hgn/barnowld
GitHub: hgn/barnowld
一个基于 Linux perf 子系统和 PMU 计数模式的守护进程,以极低系统开销实时检测 CPU 缓存侧信道攻击。
Stars: 14 | Forks: 2

*该项目名称的灵感来自于仓鸮(barn owl),它在动物世界中拥有最好的听觉之一。这恰是用来探测对 CPU cache lines 那些微小但不自然的频繁失败访问的最合适的感知器官。另外一个选择这个名字的原因是,通过 DALL-E 2 可以很容易地将它变成一个可爱的 logo,而且这个项目名称仍然足够独特。你可以自己选择相信哪个原因。*
**该 daemon 的理念:尝试以尽可能少的计算开销来检测异常的 CPU 特征,这些特征极有可能是由于 side-channel 攻击引起的。** 如果检测到这些特征,则将事件报告给系统日志。例如,云系统的日志监控系统可以在检测到这些消息时触发警报(即,可能的攻击会以 `error` 的严重级别记录到日志中,因此可以过滤 error 级别)。
相关工作:互联网上有一些关于检测 side-channel 攻击的科学出版物。这些出版物的“问题”在于,它们通常涉及机器学习和其他计算密集型的硬件要求,或者在操作上(就 CPU 资源而言)很复杂。此外,源代码通常是不公开的,这就是为什么我决定以这种特定的形式独立实现它。但我一直非常感谢能提供相关参考。有关更多信息,请参阅 *相关工作* 章节。
# 用法与示例
安装与运行
```
git clone https://github.com/hgn/barnowld.git && cd barnowld
cargo build
$(pwd)/target/debug/barnowld -v
# 或以 daemon 模式与 journal 连接
sudo systemd-run --system --wait $(pwd)/target/debug/barnowld
```
检测到的 Cache Side-Channel 攻击会打印到 STDOUT,如果作为 daemon 运行,则会记录到 systemd 的 journal 中。请查看以下 spectre 检测的示例输出,该输出以 error 日志级别记录到了系统 journal 中。
```
Possible cache side-channel attack on CPU 0 detected!
Cache miss/ref ratio 96.43% above trigger threshold of 90.00%
Within 6 recorded seconds on CPU 0, 42230182 cache references where detected and 40724557 cache misses
To further invesigative this alert please install perf and execute to following
commands to narrow down the specific origin process.
perf record -e cache-references,cache-misses -C 0
perf report --stdio
```
如果按照建议进行进一步的分析,输出可能类似于以下截取的内容。
```
$ sudo perf record -e cache-references,cache-misses -C 0
[ perf record: Woken up 20 times to write data ]
[ perf record: Captured and wrote 6,340 MB perf.data (93086 samples) ]
$ sudo perf report --stdio
# Overhead Command Shared Object Symbol
# ........ ............... ................. ...........................................
97.96% spectre.out spectre.out [.] readMemoryByte
1.67% spectre.out spectre.out [.] victim_function
0.04% spectre.out [kernel.kallsyms] [k] _raw_spin_lock_irqsave
0.03% spectre.out [kernel.kallsyms] [k] __i915_vma_retire
0.01% kworker/0:2-eve [kernel.kallsyms] [k] collect_percpu_times
```
这里一个名为 spectre.out 的进程触发了大量的 cache miss 率。例如,可以使用 `perf script` 对确切的 PID 进行进一步调查。
要将 Barnowld 安装为永久的 systemd 服务,只需要几条命令,这些命令会将 Barnowld 构建为 release 可执行文件(通过 `cargo release`)并安装所有必需的文件。随后的命令将会启动/启用该服务:
```
# 以 release 形式构建 barnowld 并安装到系统目录
$ make install
# 触发 systemd 的 service 文件重新加载
$ sudo systemctl daemon-reload
# 启动该服务
$ sudo systemctl start barnowld.service
# 检查一切是否正常工作
$ sudo systemctl status barnowld.service
$ sudo journalctl -u barnowld.service -f
# 根据需要永久启用
$ sudo systemctl enable barnowld.service
```
# 实现细节
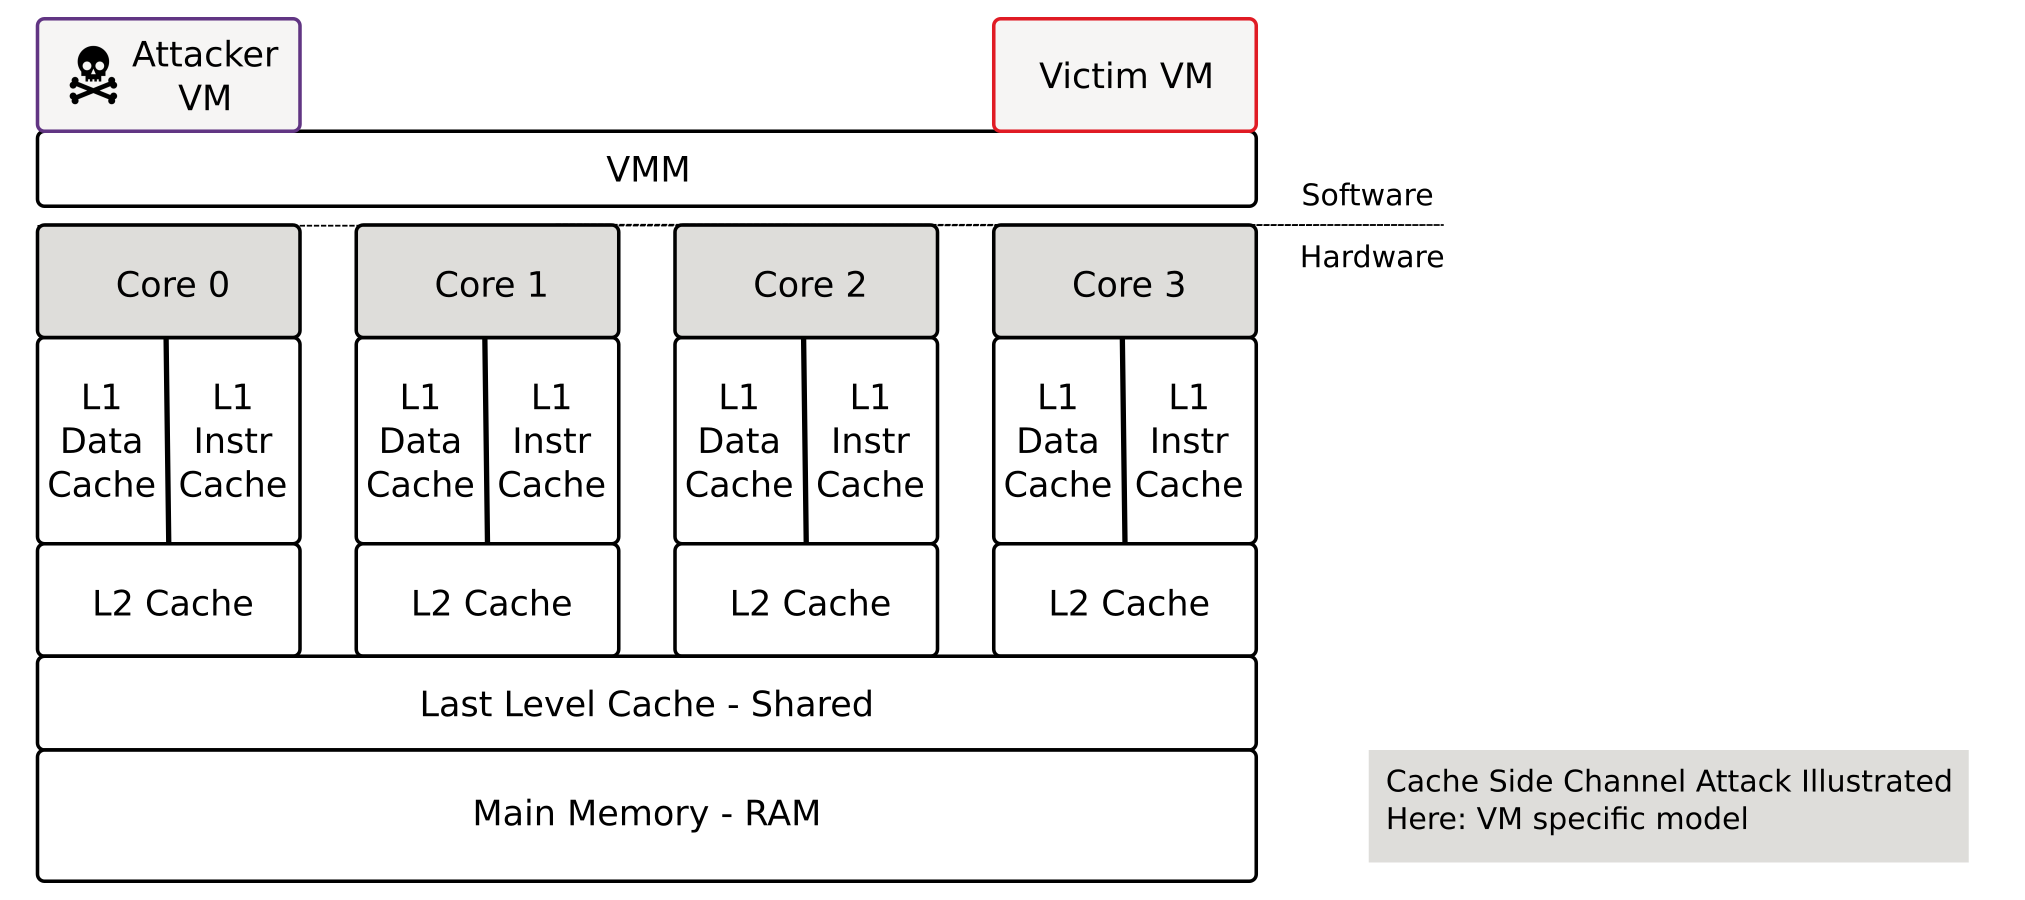
Barnowld 会在一定时间内分析所有可用的逻辑 CPU(硬件线程,在 RISC-V 领域称为 Harts)的异常情况。在此过程中,它会在时间上迭代,并以伪随机的方式遍历 CPU,从而增加对策的难度。然后,Barnowl 会在一定时间内(同样是伪随机地)分析 cache 引用和 cache miss 率。这里主要关注的是 last level cache 的特征。基本上,以下 Cache Side-Channel 攻击应该是可检测的:
- Flush+Reload
- Evict+Time
- Cross-VM Cache Attacks
- Prime+Probe(未成功,至少对于 PoC https://github.com/Miro-H/CacheSC 是这样)
如前所述,flush+flush 或 Branch History Attacks 无法通过此方法检测到。
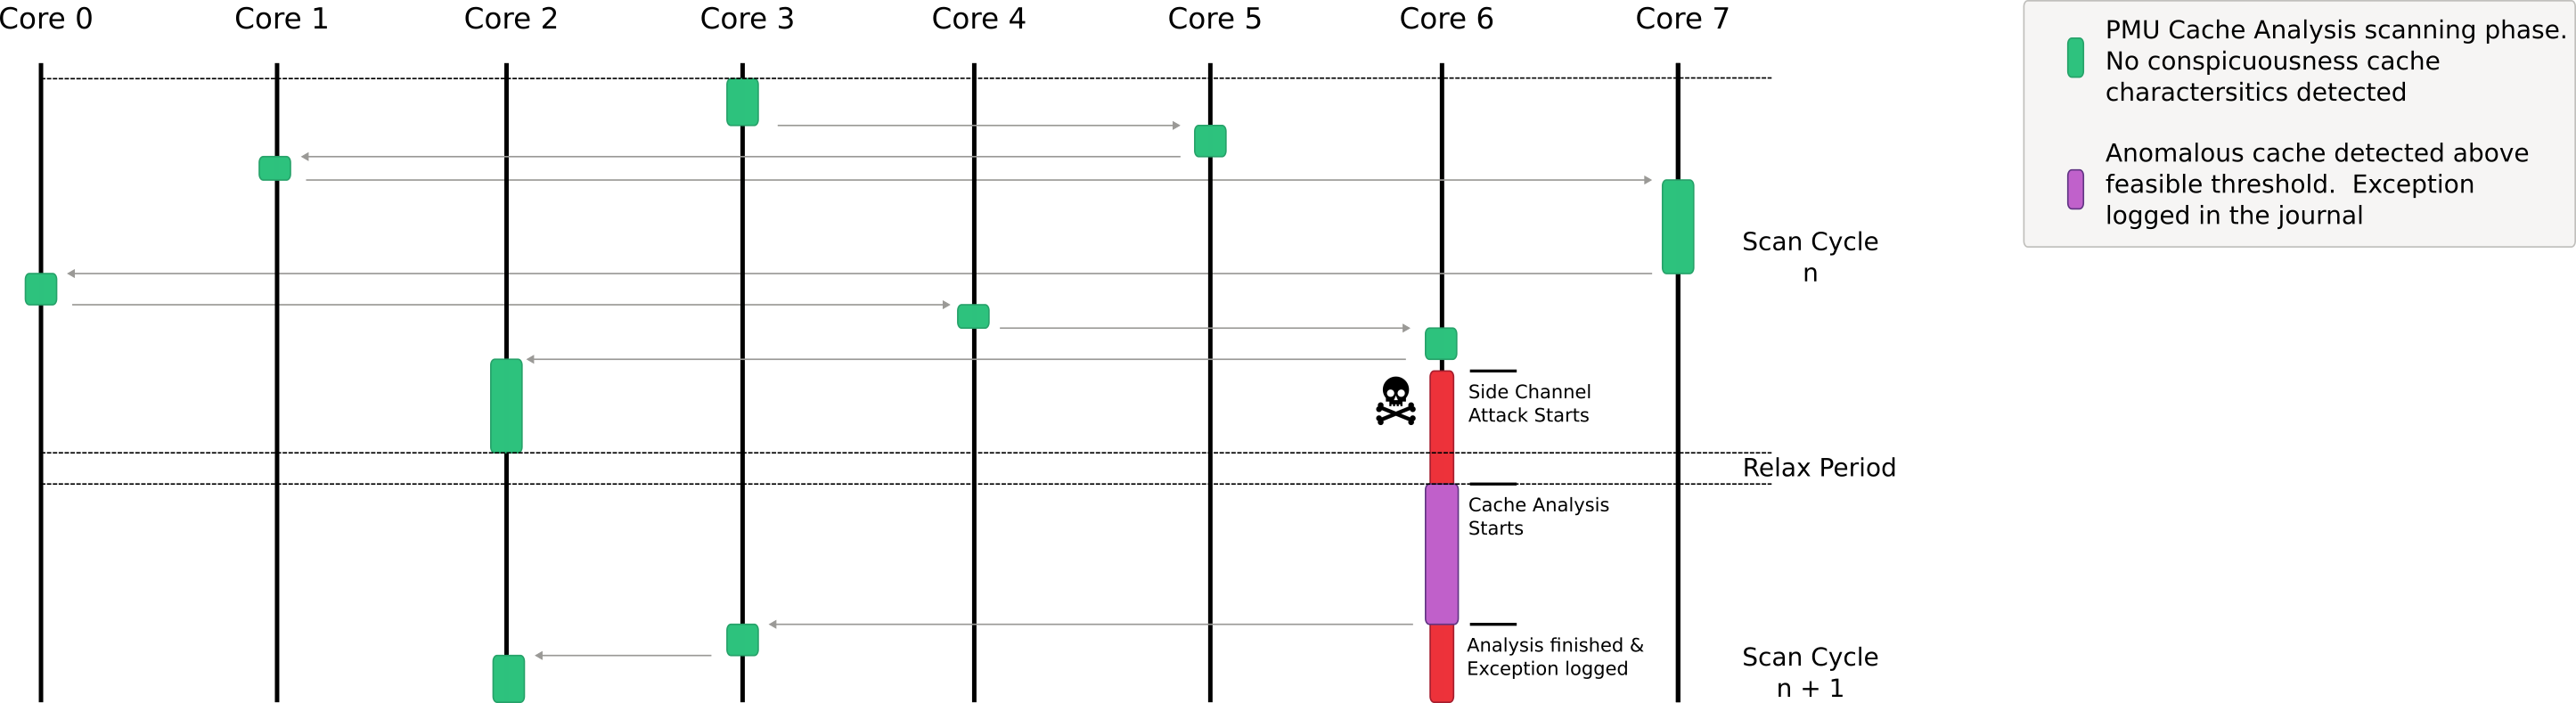
为此,Barnwold 使用了处理器 Performance Monitor Unit (PMU) 的所谓的 Counting Mode。与 Sampling Mode 相比,Counting Mode 几乎没有可测量的开销。而且,无论是 Intel、AMD、ARM 还是 RISC-V,所有主要平台都支持 PMU。
counting mode 的缺点是不进行采样,因此无法识别特定的进程。而 sampling mode 的巨大缺点是,它会使得 CPU、kernel 和用户空间承受明显大得多的负担。但是:如果考虑到你有 99.999% 的概率没有受到任何 cache side channel 攻击的影响,这就是一个很好的权衡。
我尝试通过不同的用例来触发**误报**(false positives)。例如 `dd if=/dev/random ...` 或者其他在 C 语言中手工编写的随机复制循环。目前我还没有遇到过任何会导致误报的应用程序。但我也非常感谢有价值的反馈和 issue。另一方面:如果一个合法的应用程序确实在较长时间内表现出如此糟糕(高)的 cache miss 率,那么就应该检查一下这个应用程序了——无论如何,这里可能有些东西需要优化。自修改代码可能是高 cache miss 的一个来源,但其持续时间应该限制在几毫秒内,而且即使是自修改代码,其比例也应该低于 50%。
该实现基于 Linux 内核的 perf 子系统,该子系统围绕两个方面设计:灵活性和性能。实际上,perf 可以被视为一个命令系统调用,它使用 ring buffer 在 kernel 空间和用户空间之间高效地交换数据。如果进行这些分析的目标是尽可能低的系统开销,那么这就是理想的条件。
# PoC 测试免责声明
你的 PC 上有些测试可能无法开箱即用。某些 PoC 只有在禁用 Meltdown/Spectre Linux 内核防护措施的情况下才能执行。
如果你使用了更新的 microcode 来修复 speculative execution side-channel 攻击,那么所提供的一些 PoC 在你的本地 PC 上可能也无法运行。
# 相关工作
- "SPECULARIZER: Detecting Speculative Execution Attacks via Performance Tracing",
https://yinqian.org/papers/dimva21.pdf
- "WHISPER A Tool for Run-time Detection of Side-Channel Attacks",
https://www.researchgate.net/publication/340697201_WHISPER_A_Tool_for_Run-time_Detection_of_Side-Channel_Attacks
- "Real-Time Detection for Cache Side Channel Attack using Performance Counter Monitor",
https://www.mdpi.com/2076-3417/10/3/984
- "NIGHTs-WATCH: A Cache-based Side-channel Intrusion Detector Using Hardware Performance Counters",
https://hal.science/hal-01806729/document
# 开发
对于 journal 测试,可以使用以下命令:
```
# 在 systemd 环境中启动 barnowld 而无需 service 文件
sudo systemd-run --system --wait $(pwd)/target/debug/barnowld
# CTRL-C 中断
# 查看 journal
sudo journalctl -n 50 -e
```
标签:AMSI绕过, Rust, 侧信道攻击检测, 可视化界面, 威胁检测, 子域名枚举, 守护进程, 客户端加密, 系统安全, 缓存安全, 网络流量审计, 防御绕过