bruneaug/DShield-SIEM
GitHub: bruneaug/DShield-SIEM
基于ELK Stack的DShield蜜罐传感器日志收集与分析平台,支持威胁情报集成和可视化监控。
Stars: 47 | Forks: 9
# 使用 Elasticsearch 进行 DShield Sensor 日志收集
## 简介
这是 Scott Jensen 在 ISC Storm Center 网站上作为 BACS 论文发布的初始版本以及 Github 上发布的脚本的分支和重大更新。
https://github.com/fkadriver/Dshield-ELK
https://isc.sans.edu/diary/DShield+Sensor+Monitoring+with+a+Docker+ELK+Stack+Guest+Diary/30118
这是关于如何使用 DShield-SIEM 进行分析的一个很好的参考:https://isc.sans.edu/diary/30962/ ## DShield SIEM 网络流 这概述了如何使用 DShield sensor 进行日志收集。
https://github.com/bruneaug/DShield-SIEM/blob/main/Troubleshooting/DShield-SIEM-Flow.png # 为什么使用它? 此 docker 是专为与 [DShield Honeypot](https://isc.sans.edu/tools/honeypot/) 配合使用而定制的,用于收集和解析日志并收集数据,以便于进行研究搜索。建议的安装方式是在使用 PI Raspbian OS 的 Raspberry 或运行 Ubuntu 20.04 LTS 的系统上安装 DShield sensor,无论是在您的网络中还是在您选择的云中。
**注意**:必须按照以下说明将其安装在单独的服务器上。
- 这已在 Ubuntu 20.04、22.04 和 24.04 LTS 或 [Proxmox LXC](https://github.com/bruneaug/DShield-SIEM/blob/main/AddOn/LXC_Container_DShield-SIEM.md) Container 上进行了测试
- 步骤 1 构建 Ubuntu
- 步骤 2 安装 docker 和 ELK
- 步骤 3 在 DShield Sensor(s) 上安装和配置 Filebeat
# Ubuntu 设置 #### 就像在企业中一样,收集安全日志和监控网络(如 DShield SIEM)的系统需要安装在单独的服务器上,而不是与 DShield sensor 一起安装。 - Ubuntu 22.04 LTS Live Server 64-Bit
- 最小 10+ GB - 推荐 12 GB RAM
- 如果分配给每个容器的 RAM(见下文)超过 2GB,请考虑增加服务器 RAM 容量。
- 4-8 核心
- 添加 2 个分区,一个用于 OS,另一个用于 docker
- 分配给 /var/lib/docker 的最小 300 GB 分区
- Ubuntu 重启后,设置 docker 分区
- 向 [VM](https://github.com/bruneaug/DShield-SIEM/blob/main/AddOn/Build_a_Docker_Partition.md) 添加 300 GB 分区 ## Elastic 已安装的软件包 ### ELK 当前版本:8.19.7(2025 年 11 月 11 日更新) - Kibana - Elasticsearch - Logstash - Elastic-Agent - Filebeat - Heartbeat - Metricbeat ## 附加软件 - CyberChef - Mitre ATT&CK - Attack Navigator **注意**:要更新 ELK 服务器组件,请按照以下步骤操作:
https://github.com/bruneaug/DShield-SIEM/blob/main/README.md#download-github-update ## 安装 docker 以 user ($) 账户安装 docker: ``` sudo apt-get install ca-certificates curl gnupg network-manager txt2html sudo install -m 0755 -d /etc/apt/keyrings curl -fsSL https://download.docker.com/linux/ubuntu/gpg | sudo gpg --dearmor -o /etc/apt/keyrings/docker.gpg sudo chmod a+r /etc/apt/keyrings/docker.gpg Note: You may need to take the next line, remove the backlash () and put everythin in a single line in Notepad to run this echo. echo "deb [arch="$(dpkg --print-architecture)" signed-by=/etc/apt/keyrings/docker.gpg] https://download.docker.com/linux/ubuntu \ "$(. /etc/os-release && echo "$VERSION_CODENAME")" stable" | sudo tee /etc/apt/sources.list.d/docker.list > /dev/null sudo apt update && sudo apt upgrade sudo reboot (if update were applied) sudo apt-get install -y jq docker-ce docker-ce-cli containerd.io docker-buildx-plugin docker-compose-plugin pip sudo systemctl enable docker sudo systemctl start docker.service ``` 确认 docker 服务正在运行
``` sudo systemctl status docker.service ``` ## 更新 /etc/hosts 在 IP 地址和服务器名称之后,将以下 ELK 服务器名称 **es01 kibana fleet-server heartbeat logstash filebeat filebeat01** 添加到 /etc/hosts:
``` sudo vi /etc/hosts ``` 将此内容添加到 ELK 服务器 IP 地址后的 /etc/hosts 中
127.0.0.1 sensor es01 ...
192.168.25.80 sensor es01 ...
``` es01 kibana fleet-server heartbeat logstash filebeat filebeat01 ``` ## 添加到 sysctl vm.max_map_count 编辑 sysctl.conf 文件:
``` sudo vi /etc/sysctl.conf ``` 在文件底部添加以下内容:
``` vm.max_map_count=262144 ``` 添加并保存。这是使用 Docker 时的 [Elasticsearch](https://www.elastic.co/guide/en/elasticsearch/reference/current/docker.html#docker-cli-run-prod-mode) 要求。 ## 确保防火墙已关闭 ``` sudo iptables -nL ``` 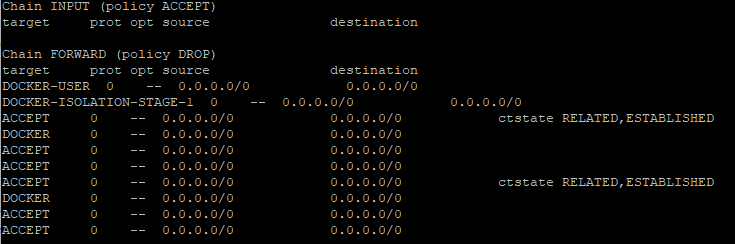 # 配置并安装 DShield ELK 使用 user ($) 账户,运行以下命令:
``` git clone https://github.com/bruneaug/DShield-SIEM.git mkdir scripts mv DShield-SIEM/AddOnScripts/*.sh scripts chmod 754 scripts/*.sh cd ~/DShield-SIEM ``` **注意**:在安装之前,您可以编辑 **.env**(使用 ls -la 查看)文件以进行所需的任何更改。
- elastic 的当前 _默认密码_ 是 **student**
**.env** 中的内存限制是 docker 将为每个 ELK 容器分配的最大内存。
Elasticsearch 默认为 3GB,但如果您有资源,可以扩展
编辑 .env 文件并为您自己的 ELK Stack 进行配置
``` vi .env ``` - 更新 **.env** 文件中的以下变量以匹配您的 ELK 服务器 DNS 信息、主机名、IP 和默认 elastic 密码(如果您想更改它):
- HOSTNAME="ubuntu" - DNS_SERVER="9.9.9.9" - IPADDRESS="192.168.25.231" - ELASTIC_PASSWORD=student - ES_MEM = Elasticsearch -> 4g, KB_MEM = Kibana -> 2g - 如果您想更改默认域名服务器信息和目标地址的本地专用网络位置(即 DShield sensor 映射 - 当前设置为 **Ottawa, Canada**),请在加载 docker 之前编辑以下目录中的文件:
``` cd logstash/pipeline ``` - logstash-200-filter-cowrie.conf
- logstash-201-filter-iptables.conf
- logstash-202-filter-cowrie-webhoneypot.conf
您可以保留这些默认值或编辑每个文件并更改它们。 ### 配置 ELK Infrastructure Monitoring 编辑 **heartbeat.yml** 以使用您自己的 sensor IP 更改 sensor IP(名为 PI)。Kibana heartbeat 检查您的服务状态并确定它们是否可用。
更新此 IP 和主机名以反映您的 sensor。 **注意**:如果您有多个想要监控的 sensor,可以复制并添加相同的 5 行
可以在 Observability -> Uptime Monitors 中查看
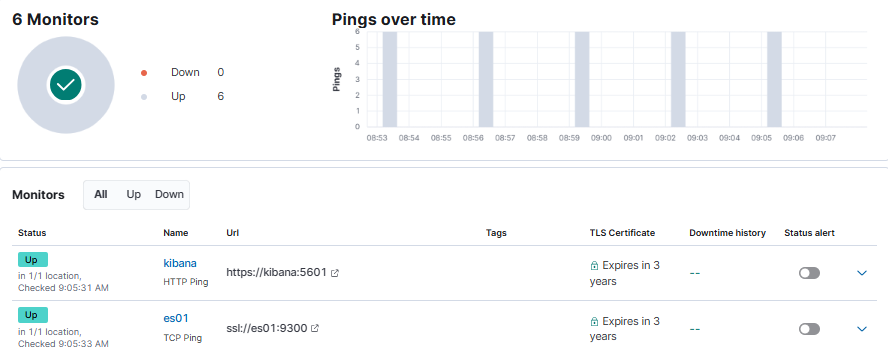 此行是 sensor IP 地址。如果在连接到 TCP 12222 时未收到响应,它将在界面中将其标记为 down。
这是由 ELK 服务器发起的,以检查来自 sensor 的响应。
更新此行:hosts: ["192.168.25.165"]
``` vi ~/DShield-SIEM/heartbeat/heartbeat.yml ``` 脚本 **change_perms.sh** 将在开始安装 docker 组件之前配置一些文件。
该脚本还会将 dashboard 查询中使用的 IP 地址更新为您 ELK stack 的 IP。
``` ~/scripts/change_perms.sh ~/scripts/get_researchers.sh ``` 现在执行 docker compose 以构建 ELK 服务器应用程序。
这将构建:Kibana、Elasticsearch、elastic-agent、Logstash 并加载 Cowrie 解析器、配置文件和 dashboard。
``` sudo docker compose up -d ``` 安装完成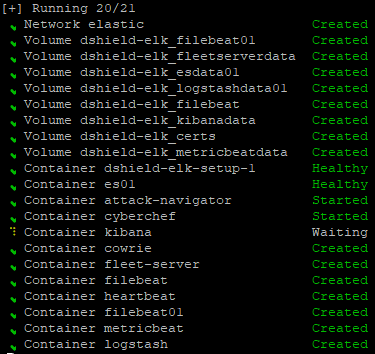 ### Docker 目录列表
此命令显示安装所有 Elasticsearch 组件后正在使用的 docker 目录列表。
### Docker 目录列表
此命令显示安装所有 Elasticsearch 组件后正在使用的 docker 目录列表。
随着数据添加到 Elasticsearch,您还可以使用以下命令或在 ELK 内部监控可用于存储的磁盘空间。
``` sudo du --human-readable --max-depth 1 --no-dereference --one-file-system /var/lib/docker ``` 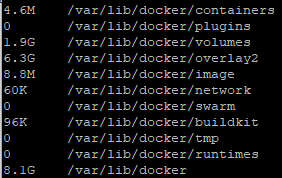 ### 以下 ELK 服务已设置 使用 netstat,这 4 个服务现在应该正在监听。
``` netstat -an | grep '80\|9200\|9300\|8220\|5601\|5044\|5066\|5067\|5068\|9600' ``` 这应该是您应该看到的输出:
https://github.com/fkadriver/Dshield-ELK
https://isc.sans.edu/diary/DShield+Sensor+Monitoring+with+a+Docker+ELK+Stack+Guest+Diary/30118
这是关于如何使用 DShield-SIEM 进行分析的一个很好的参考:https://isc.sans.edu/diary/30962/ ## DShield SIEM 网络流 这概述了如何使用 DShield sensor 进行日志收集。
https://github.com/bruneaug/DShield-SIEM/blob/main/Troubleshooting/DShield-SIEM-Flow.png # 为什么使用它? 此 docker 是专为与 [DShield Honeypot](https://isc.sans.edu/tools/honeypot/) 配合使用而定制的,用于收集和解析日志并收集数据,以便于进行研究搜索。建议的安装方式是在使用 PI Raspbian OS 的 Raspberry 或运行 Ubuntu 20.04 LTS 的系统上安装 DShield sensor,无论是在您的网络中还是在您选择的云中。
**注意**:必须按照以下说明将其安装在单独的服务器上。
- 这已在 Ubuntu 20.04、22.04 和 24.04 LTS 或 [Proxmox LXC](https://github.com/bruneaug/DShield-SIEM/blob/main/AddOn/LXC_Container_DShield-SIEM.md) Container 上进行了测试
- 步骤 1 构建 Ubuntu
- 步骤 2 安装 docker 和 ELK
- 步骤 3 在 DShield Sensor(s) 上安装和配置 Filebeat
# Ubuntu 设置 #### 就像在企业中一样,收集安全日志和监控网络(如 DShield SIEM)的系统需要安装在单独的服务器上,而不是与 DShield sensor 一起安装。 - Ubuntu 22.04 LTS Live Server 64-Bit
- 最小 10+ GB - 推荐 12 GB RAM
- 如果分配给每个容器的 RAM(见下文)超过 2GB,请考虑增加服务器 RAM 容量。
- 4-8 核心
- 添加 2 个分区,一个用于 OS,另一个用于 docker
- 分配给 /var/lib/docker 的最小 300 GB 分区
- Ubuntu 重启后,设置 docker 分区
- 向 [VM](https://github.com/bruneaug/DShield-SIEM/blob/main/AddOn/Build_a_Docker_Partition.md) 添加 300 GB 分区 ## Elastic 已安装的软件包 ### ELK 当前版本:8.19.7(2025 年 11 月 11 日更新) - Kibana - Elasticsearch - Logstash - Elastic-Agent - Filebeat - Heartbeat - Metricbeat ## 附加软件 - CyberChef - Mitre ATT&CK - Attack Navigator **注意**:要更新 ELK 服务器组件,请按照以下步骤操作:
https://github.com/bruneaug/DShield-SIEM/blob/main/README.md#download-github-update ## 安装 docker 以 user ($) 账户安装 docker: ``` sudo apt-get install ca-certificates curl gnupg network-manager txt2html sudo install -m 0755 -d /etc/apt/keyrings curl -fsSL https://download.docker.com/linux/ubuntu/gpg | sudo gpg --dearmor -o /etc/apt/keyrings/docker.gpg sudo chmod a+r /etc/apt/keyrings/docker.gpg Note: You may need to take the next line, remove the backlash () and put everythin in a single line in Notepad to run this echo. echo "deb [arch="$(dpkg --print-architecture)" signed-by=/etc/apt/keyrings/docker.gpg] https://download.docker.com/linux/ubuntu \ "$(. /etc/os-release && echo "$VERSION_CODENAME")" stable" | sudo tee /etc/apt/sources.list.d/docker.list > /dev/null sudo apt update && sudo apt upgrade sudo reboot (if update were applied) sudo apt-get install -y jq docker-ce docker-ce-cli containerd.io docker-buildx-plugin docker-compose-plugin pip sudo systemctl enable docker sudo systemctl start docker.service ``` 确认 docker 服务正在运行
``` sudo systemctl status docker.service ``` ## 更新 /etc/hosts 在 IP 地址和服务器名称之后,将以下 ELK 服务器名称 **es01 kibana fleet-server heartbeat logstash filebeat filebeat01** 添加到 /etc/hosts:
``` sudo vi /etc/hosts ``` 将此内容添加到 ELK 服务器 IP 地址后的 /etc/hosts 中
127.0.0.1 sensor es01 ...
192.168.25.80 sensor es01 ...
``` es01 kibana fleet-server heartbeat logstash filebeat filebeat01 ``` ## 添加到 sysctl vm.max_map_count 编辑 sysctl.conf 文件:
``` sudo vi /etc/sysctl.conf ``` 在文件底部添加以下内容:
``` vm.max_map_count=262144 ``` 添加并保存。这是使用 Docker 时的 [Elasticsearch](https://www.elastic.co/guide/en/elasticsearch/reference/current/docker.html#docker-cli-run-prod-mode) 要求。 ## 确保防火墙已关闭 ``` sudo iptables -nL ```  # 配置并安装 DShield ELK 使用 user ($) 账户,运行以下命令:
``` git clone https://github.com/bruneaug/DShield-SIEM.git mkdir scripts mv DShield-SIEM/AddOnScripts/*.sh scripts chmod 754 scripts/*.sh cd ~/DShield-SIEM ``` **注意**:在安装之前,您可以编辑 **.env**(使用 ls -la 查看)文件以进行所需的任何更改。
- elastic 的当前 _默认密码_ 是 **student**
**.env** 中的内存限制是 docker 将为每个 ELK 容器分配的最大内存。
Elasticsearch 默认为 3GB,但如果您有资源,可以扩展
编辑 .env 文件并为您自己的 ELK Stack 进行配置
``` vi .env ``` - 更新 **.env** 文件中的以下变量以匹配您的 ELK 服务器 DNS 信息、主机名、IP 和默认 elastic 密码(如果您想更改它):
- HOSTNAME="ubuntu" - DNS_SERVER="9.9.9.9" - IPADDRESS="192.168.25.231" - ELASTIC_PASSWORD=student - ES_MEM = Elasticsearch -> 4g, KB_MEM = Kibana -> 2g - 如果您想更改默认域名服务器信息和目标地址的本地专用网络位置(即 DShield sensor 映射 - 当前设置为 **Ottawa, Canada**),请在加载 docker 之前编辑以下目录中的文件:
``` cd logstash/pipeline ``` - logstash-200-filter-cowrie.conf
- logstash-201-filter-iptables.conf
- logstash-202-filter-cowrie-webhoneypot.conf
您可以保留这些默认值或编辑每个文件并更改它们。 ### 配置 ELK Infrastructure Monitoring 编辑 **heartbeat.yml** 以使用您自己的 sensor IP 更改 sensor IP(名为 PI)。Kibana heartbeat 检查您的服务状态并确定它们是否可用。
更新此 IP 和主机名以反映您的 sensor。 **注意**:如果您有多个想要监控的 sensor,可以复制并添加相同的 5 行
可以在 Observability -> Uptime Monitors 中查看
 此行是 sensor IP 地址。如果在连接到 TCP 12222 时未收到响应,它将在界面中将其标记为 down。
这是由 ELK 服务器发起的,以检查来自 sensor 的响应。
更新此行:hosts: ["192.168.25.165"]
``` vi ~/DShield-SIEM/heartbeat/heartbeat.yml ``` 脚本 **change_perms.sh** 将在开始安装 docker 组件之前配置一些文件。
该脚本还会将 dashboard 查询中使用的 IP 地址更新为您 ELK stack 的 IP。
``` ~/scripts/change_perms.sh ~/scripts/get_researchers.sh ``` 现在执行 docker compose 以构建 ELK 服务器应用程序。
这将构建:Kibana、Elasticsearch、elastic-agent、Logstash 并加载 Cowrie 解析器、配置文件和 dashboard。
``` sudo docker compose up -d ``` 安装完成
### Docker 目录列表
此命令显示安装所有 Elasticsearch 组件后正在使用的 docker 目录列表。随着数据添加到 Elasticsearch,您还可以使用以下命令或在 ELK 内部监控可用于存储的磁盘空间。
``` sudo du --human-readable --max-depth 1 --no-dereference --one-file-system /var/lib/docker ```  ### 以下 ELK 服务已设置 使用 netstat,这 4 个服务现在应该正在监听。
``` netstat -an | grep '80\|9200\|9300\|8220\|5601\|5044\|5066\|5067\|5068\|9600' ``` 这应该是您应该看到的输出:
tcp 0 0 0.0.0.0:80 0.0.0.0:* LISTEN ---> Local CyberChef tcp 0 0 0.0.0.0:5601 0.0.0.0:* LISTEN ---> Kibana Web Access tcp 0 0 0.0.0.0:8080 0.0.0.0:* LISTEN ---> Local Attack Navigator tcp 0 0 0.0.0.0:8220 0.0.0.0:* LISTEN ---> elastic-agent Service tcp 0 0 0.0.0.0:9200 0.0.0.0:* LISTEN ---> Elasticsearch Service tcp 0 0 0.0.0.0:9300 0.0.0.0:* LISTEN ---> Elasticsearch Cluster Service tcp 0 0 0.0.0.0:5044 0.0.0.0:* LISTEN ---> Logstash Data Collection tcp 0 0 0.0.0.0:5066 0.0.0.0:* LISTEN ---> Metricbeat Stack Node Information tcp 0 0 0.0.0.0:5067 0.0.0.0:* LISTEN ---> Filebeat Stack Node Information tcp 0 0 0.0.0.0:5068 0.0.0.0:* LISTEN ---> Filebeat Stack Node Information (Process ISC Threat Intel to Logstash) tcp 0 0 0.0.0.0:9600 0.0.0.0:* LISTEN ---> Logstash Stack Node and Pipeline Information tcp6 0 0 :::80 :::* LISTEN tcp6 0 0 :::5601 :::* LISTEN tcp6 0 0 :::8080 :::* LISTEN tcp6 0 0 :::8220 :::* LISTEN tcp6 0 0 :::9200 :::* LISTEN tcp6 0 0 :::9300 :::* LISTEN tcp6 0 0 :::5044 :::* LISTEN tcp6 0 0 :::5066 :::* LISTEN tcp6 0 0 :::5067 :::* LISTEN tcp6 0 0 :::5068 :::* LISTEN tcp6 0 0 :::9600 :::* LISTEN # 在 Kibana 中加载默认 Filebeat 模板 这将安装默认模板,并且 dashboards 可用于存储来自远程 DShield sensors 的 netflow 数据。
为了使 Logstash 开始存储数据,必须执行以下命令。第一步是登录 filebeat:
``` sudo docker exec -ti filebeat bash ``` 接下来,运行此 Filebeat 命令将模板加载到 Kibana 中:
``` ./filebeat setup -e ``` # 访问 Kibana 界面 在 docker 完成安装所有 ELK docker 组件后,现在是使用您的 Ubuntu 服务器 IP 登录 ELK stack 的时候了。
- 使用用户名:**elastic** 和默认密码(_如果尚未更改_):**student** 登录 Kibana
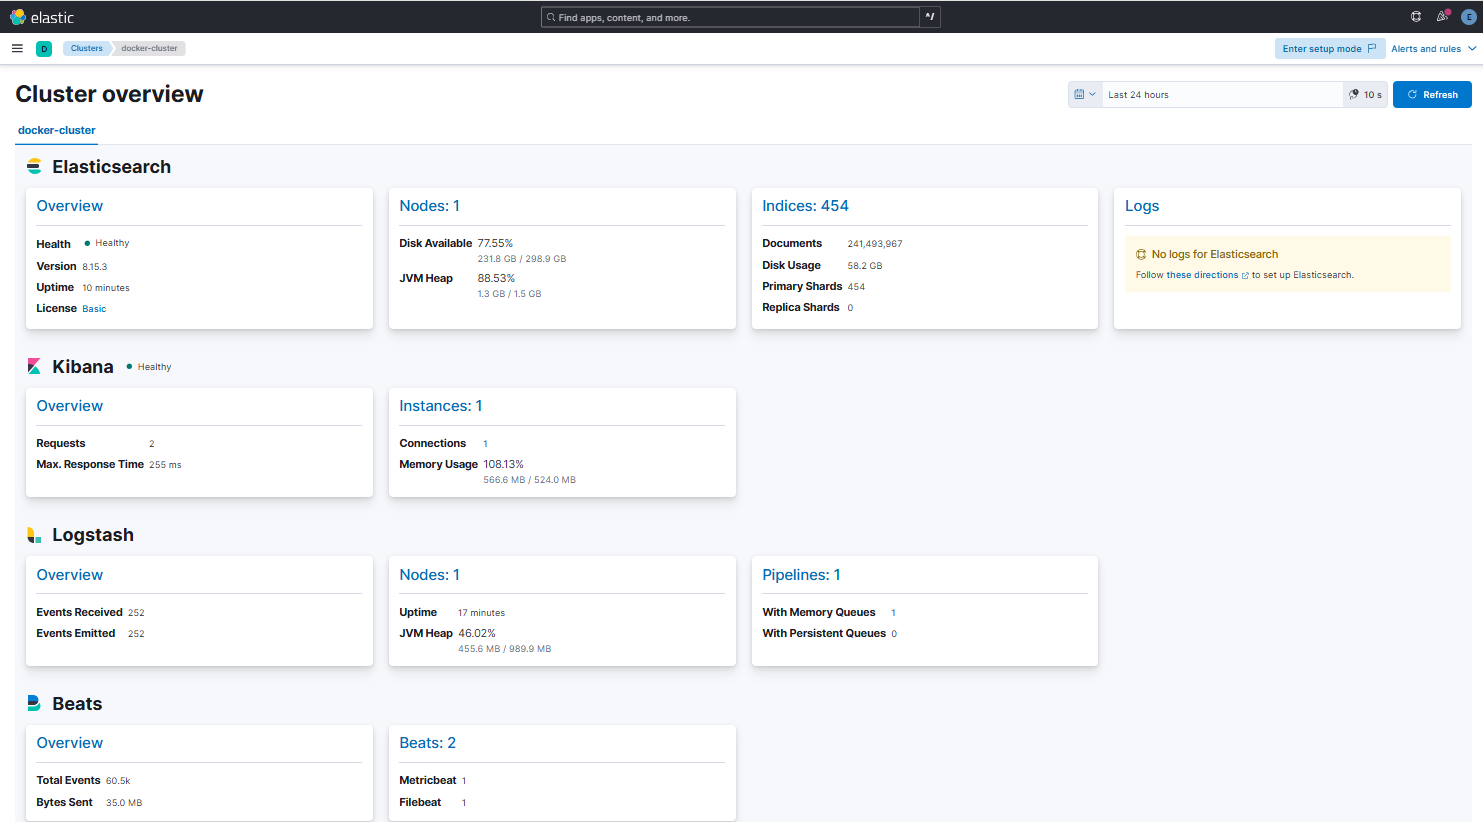
Web 访问:https://serverIP 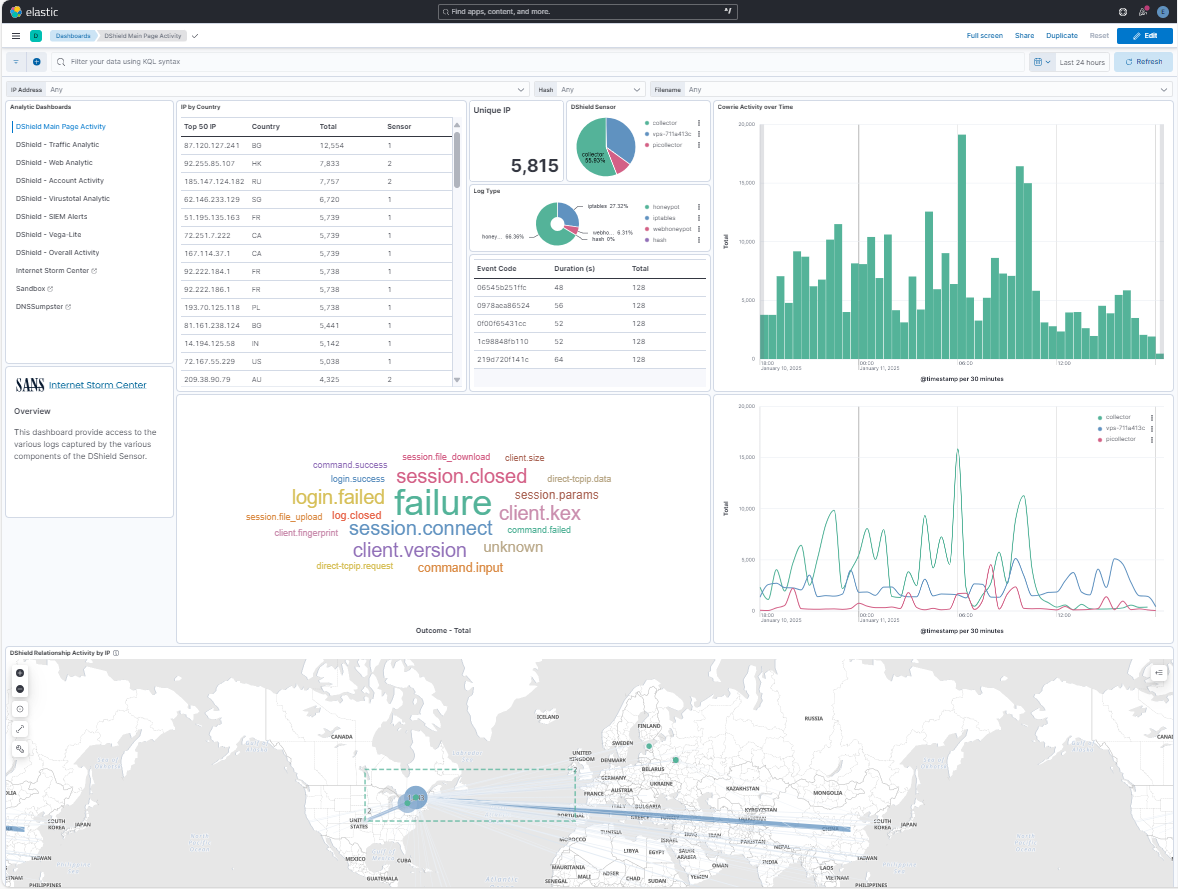 # 配置 ELK Stack Management 为了查看 ELK stack 健康状况,需要通过导航到以下位置来配置 stack monitoring:Management -> Stack Monitoring
- 仅当安装未自动设置 Stack Monitoring 时才需要此步骤
- 选择 "_Or, set up with self monitoring_"
- Monitoring is currently off -> 选择:_Turn on monitoring_
  # 配置 fleet-agent fleet-agent(这是在 ELK stack 上运行的 elastic-agent)将用于摄取威胁情报。
- 从下拉菜单中,选择 Management → Fleet →Settings → Edit Outputs (Actions)
- 通过 SSH 登录服务器
- 将 ca.crt 证书复制到 /tmp
``` sudo cp /var/lib/docker/volumes/dshield-elk_certs/_data/ca/ca.crt /tmp ``` - 获取 Elasticsearch CA trusted fingerprint 的副本
``` sudo openssl x509 -fingerprint -sha256 -noout -in /tmp/ca.crt | awk -F"=" {' print $2 '} | sed s/://g ``` - 输出将如下所示:
673FB617E15CCCE73F9B647EF99449642A19CFC1D75BF5772047DA99DB950844 - 获取 Elasticsearch CA 证书的内容以应用到 Advanced YAML 配置。输入命令因为它不能很好地复制
``` sudo cat /tmp/ca.crt | sed -r 's/(.*)/ \1/g' ``` 按照上面 Troubleshooting fleet-server-examples 指南 URL 中的示例获取正确格式。
_sed_ 将使用前面的命令向 CA 证书 4 个空格 - 将 Hosts 更改为:https://es01:9200 添加证书信息后,保存并应用这些设置。
然后 Save and deploy 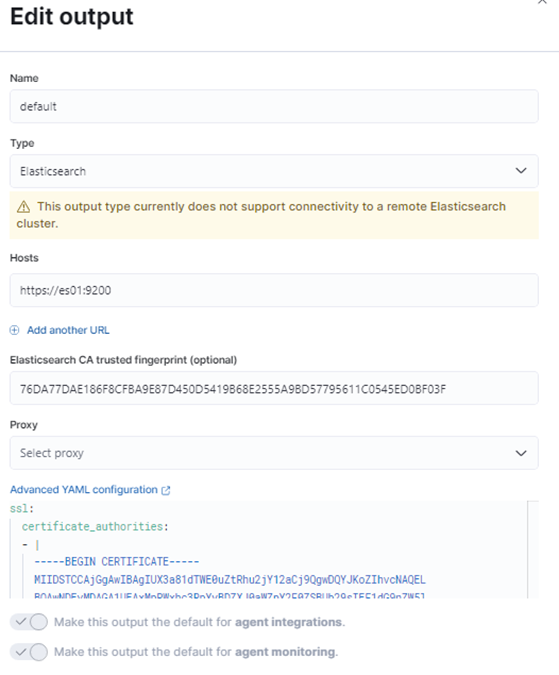 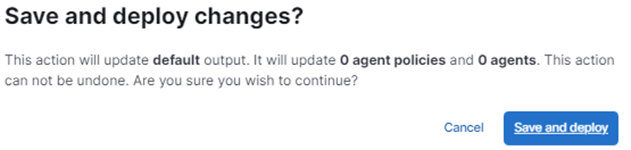 在 Settings 下,通过 edit 或 Add Fleet Server 配置 Fleet server hosts,如下所示: 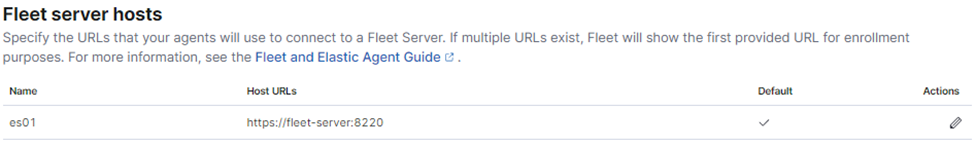 下一阶段是选择 Agent Policy → Add Agent → Enroll in Fleet → Add Fleet Server - 提供名称:es01 - 提供 URL:https://fleet-server:8220 - 最后:Generate Fleet Server policy - 选择:RPM 有关 _Fleet-Server SSL Configuration_ 的示例,请参阅此页面:
https://github.com/bruneaug/DShield-SIEM/blob/main/Troubleshooting/fleet-server-examples.txt 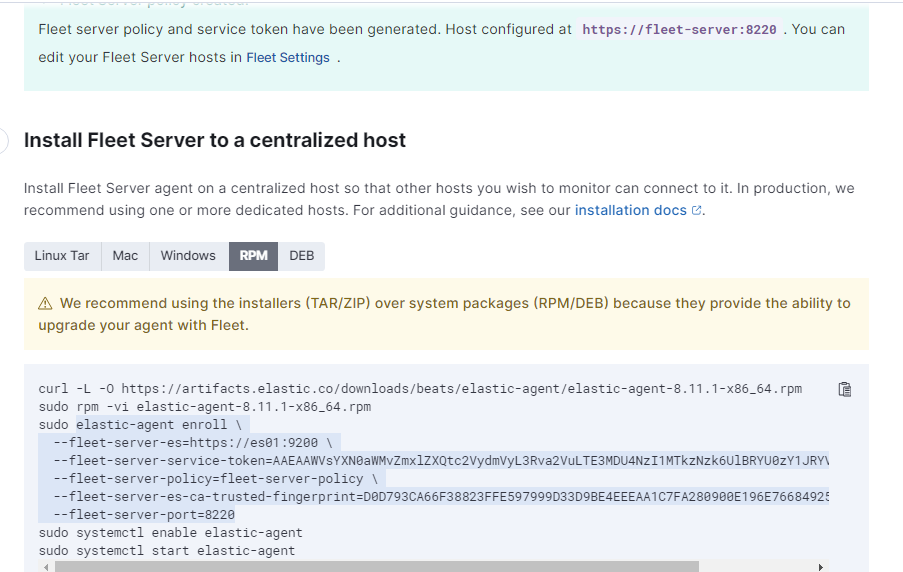 我们需要此信息来设置我们的 fleet server。
通过 SSH 登录到 fleet-server 并确保 fleet-server 正在运行,然后再设置我们的 agent:
``` sudo docker exec -ti fleet-server bash ./elastic-agent status (check it is running) ./elastic-agent restart (if it doesn't appear to be running, force a restart, and recheck the status) ``` 这是需要复制到 fleet server 的内容示例。确保 fleet server es 是:https://es01:9200
在 port=8220 之后添加粗体部分,因为证书是自生成的。这将确保 agent 接受更新。
token 和 fingerprint 将与此示例不同
复制下面的 elastic-enrol agent 并替换从您自己的服务中获取的这 2 行,其他所有内容保持不变。
--fleet-server-service-token=AAEAAWVsYXN0aWMvZmxlZXQtc2VydmVyL3Rva2VuLTE3MzEwOTcwODU3MzI6VjMyLU13cmFUOUM1eUFvMUhVUFl5QQ \ --fleet-server-es-ca-trusted-fingerprint=0D9A25F4C147EB3A496253525DF6F039CF3C19776E64A1F77CEFCCD08B76BC61 \ 登录 fleet-agent 后,在您的 fleet-agent 中注册 elastic-agent: 使用此模板安装您的证书,并确保替换为您自己的
fleet-server-service-token & fleet-server-es-ca-trusted-fingerprint
``` elastic-agent enroll \ --url=https://fleet-server:8220 \ --fleet-server-es=https://es01:9200 \ --fleet-server-service-token=AAEAAWVsYXN0aWMvZmxlZXQtc2VydmVyL3Rva2VuLTE3MzEwOTcwODU3MzI6VjMyLU13cmFUOUM1eUFvMUhVUFl5QQ \ --fleet-server-policy=fleet-server-policy \ --fleet-server-es-ca=/certs/es01/es01.crt \ --fleet-server-es-ca-trusted-fingerprint=0D9A25F4C147EB3A496253525DF6F039CF3C19776E64A1F77CEFCCD08B76BC61 \ --fleet-server-port=8220 \ --certificate-authorities=/certs/ca/ca.crt \ --fleet-server-cert=/certs/fleet-server/fleet-server.crt \ --fleet-server-cert-key=/certs/fleet-server/fleet-server.key \ --elastic-agent-cert=/certs/fleet-server/fleet-server.crt \ --elastic-agent-cert-key=/certs/fleet-server/fleet-server.key \ --fleet-server-es-cert=/certs/fleet-server/fleet-server.crt \ --fleet-server-es-cert-key=/certs/fleet-server/fleet-server.key ``` 这将替换您当前的设置。您想继续吗?[Y/n]: Y
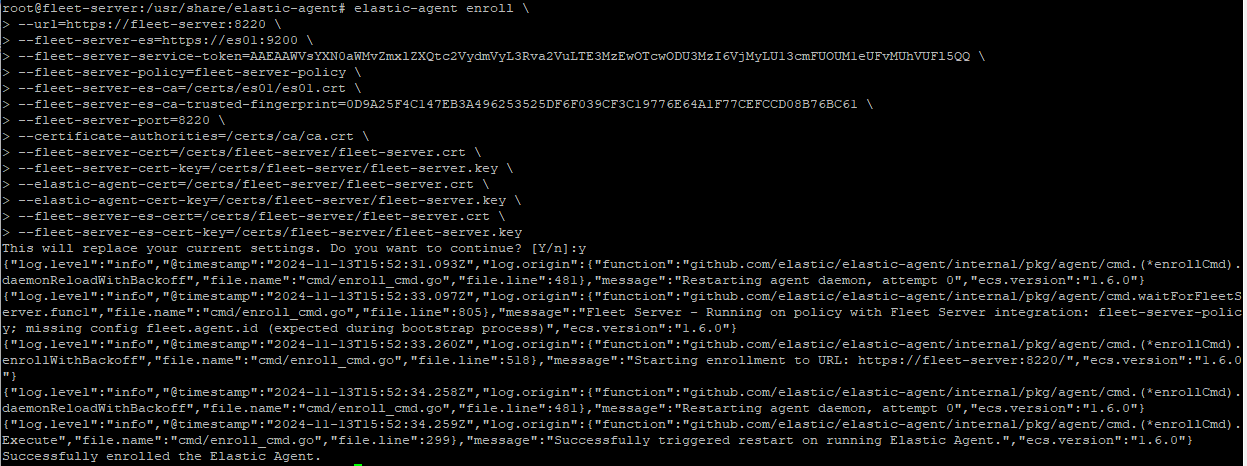 **Successfully enrolled the Elastic Agent.** 从您当前的位置,验证它是否正确安装
``` ./elastic-agent status ./elastic-agent restart (if you got what appears to be errors, force a restart and check the status) ``` 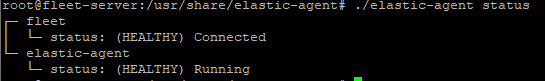 现在 Fleet Server 已连接,关闭此窗口并继续下一步。 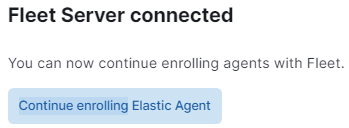 在 Elastic Management → Fleet 中,刷新 Agents,显示如下: 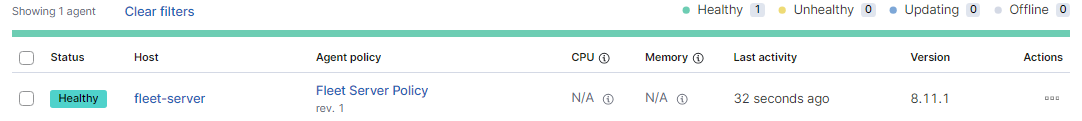 服务器现在已准备好安装 Threat Intel Agents,以便在 Security(SIEM 部分)中针对 honeypot 日志使用。
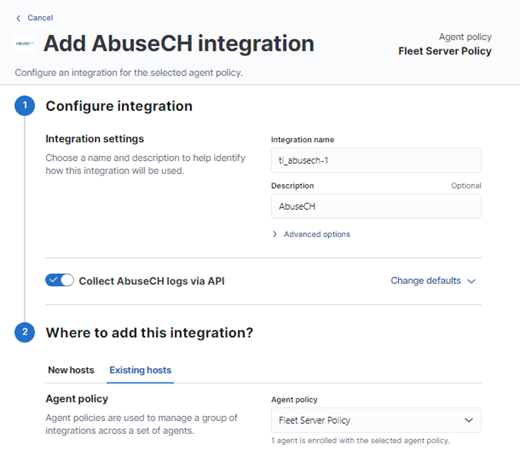
下一步是选择 Agent policies → Fleet Server Policy → Add integration:
使用此 Dashboard 查看 elastic-agent 收集的指标:
 - 选择并添加 AlienVault OTX(需要 API key)
- 选择 AbuseCH(需要 API key)
- 选择 Threat Intelligence Utilities
- Elasticsearch
- 选择 Kibana
- 选择 Docker
 # Fleet Server Policy 示例 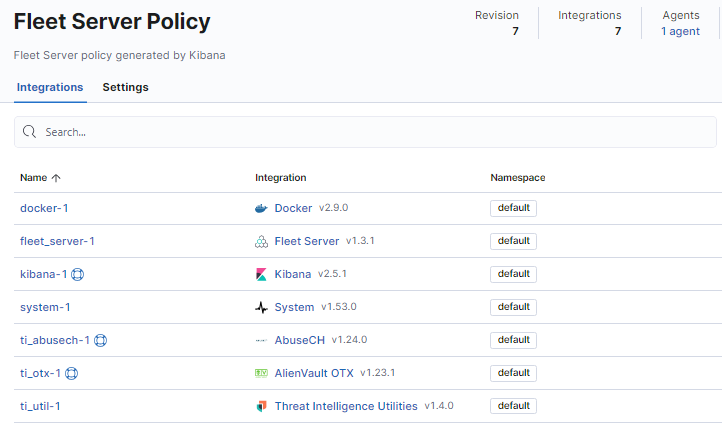 - 在 Elastic Management → Installed Integration 中
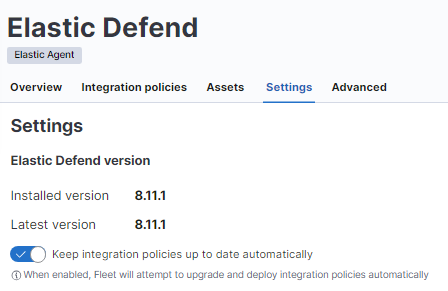
- 选择每个已安装的 integration,然后选择 Settings 并启用选项卡以 _keep the policy up to date_:
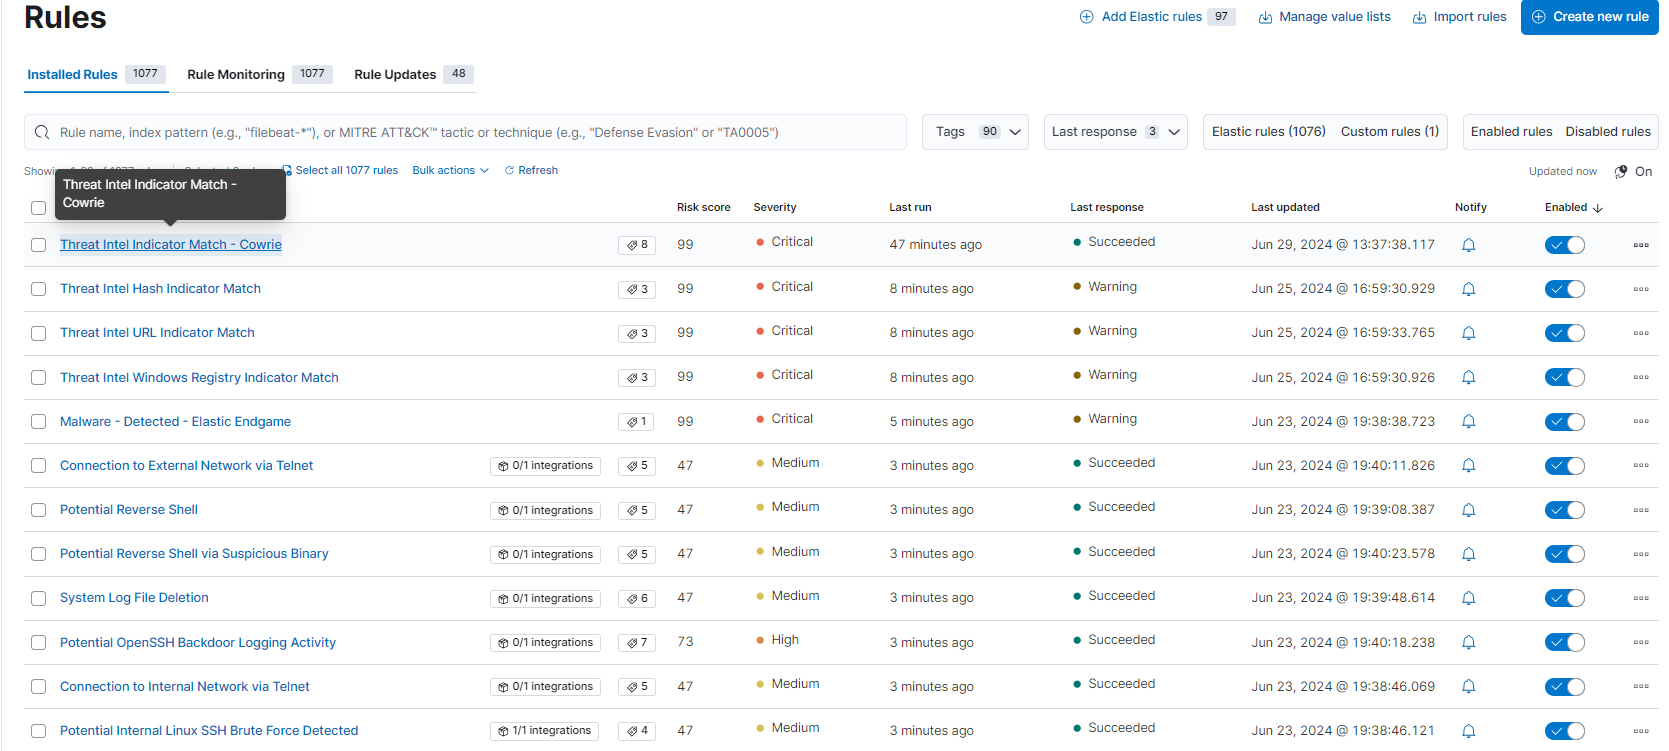
 ## 配置 Security → Rules - 选择 Rules → Detection rules (SIEM) → Add Elastic rules - 在 Search Tags 下:Rule Type: Threat Intel(至少添加这 4 条规则) - 安装并启用这 4 条规则 - Threat Intel Indicator Match - Cowrie(Custom rule loaded and enabled when docker load all the ELK stack components) - Threat Intel Windows Registry Indicator Match - Threat Intel Hash Indicator Match - Threat Intel URL Indicator Match - 您可以查看规则并启用您想针对您的 honeypot 数据尝试的其他规则。
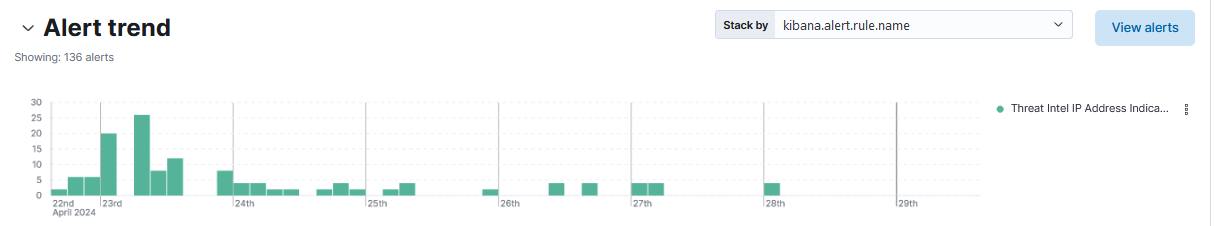
 ## 在 Alert trend 中查看 Rules 捕获的活动 如果上述某些 threat intel 已添加到 elastic-agent,并且 cowrie* 在初始安装期间已添加到 Management -> Advanced Settings 中,它现在可以在 ELK stack 的 SIEM 部分的 alert trends 中跟踪匹配的规则。
这是来自 Management → Stack Management → Advanced Settings 的输出
 如果任何 threat intel 匹配,SIEM 将显示以下现在可以调查的活动:
  # 在 DShield Sensor 上设置 Filebeat - 日志到 ELK 下一步是将 Filebeat 软件包添加到 DShield Sensor 以将日志发送到 Elasticsearch。
使用以下步骤安装 Filebeat,使用从此参考 [3] 中获取的以下命令:
``` wget -qO - https://artifacts.elastic.co/GPG-KEY-elasticsearch | sudo apt-key add - sudo apt-get install apt-transport-https echo "deb https://artifacts.elastic.co/packages/8.x/apt stable main" | sudo tee -a /etc/apt/sources.list.d/elastic-8.x.list echo "deb https://artifacts.elastic.co/packages/oss-8.x/apt stable main" | sudo tee -a /etc/apt/sources.list.d/elastic-8.x.list sudo apt-get update ``` ### 安装与您的架构匹配的版本 安装后,我们对 filebeat 设置 **hold**,以便您可以更新 sensor 而不更改 filebeat 版本。filebeat
版本应始终与 Elasticsearc/Kibana docker 版本匹配。
Linux - X86_64 ``` wget https://artifacts.elastic.co/downloads/beats/filebeat/filebeat-8.19.7-amd64.deb sudo apt install ./filebeat-8.19.7-amd64.deb sudo apt-mark hold filebeat ``` PI - aarch64 ``` wget https://artifacts.elastic.co/downloads/beats/filebeat/filebeat-8.19.7-arm64.deb sudo apt install ./filebeat-8.19.7-arm64.deb sudo apt-mark hold filebeat ``` 为了更新 filebeat,当时机到来时,您需要移除 hold。在移除之前检查 filebeat 上是否有 hold
``` sudo apt-mark showhold sudo apt-mark unhold filebeat ``` 如果您想在 DShield sensor 上使用 Zeek,请查看这些安装 [steps](https://github.com/bruneaug/DShield-SIEM/blob/main/AddOn/Configure_Zeek_DShield_Sensor.md) ### Cloud Sensor 设置 - Filebeat -> Home Router -> Logstash 要从 cloud sensor 连接到本地 ELK Stack,您需要执行以下操作: - 配置 home router 以 NAT 到您的 ELK Stack 本地 IP 地址
- 使用来自您的 sensor 的路由器 IP 地址(我建议在您的 home IP 更改时向您的 home IP 添加主机名)连接到您的 home router
- 最终连接应如下所示:sensor -> NAT Router IP -> ELK Stack ### 将所有 Sensor 文件传输到 DShield Sensor 按照此 URL 下载与 DShield Sensor 相关的所有文件
https://github.com/bruneaug/DShield-Sensor ``` git clone https://github.com/bruneaug/DShield-Sensor.git sudo cp ~/DShield-Sensor/filebeat/filebeat.yml /etc/filebeat/filebeat.yml ``` - 编辑 filebeat.yml 并将 IP 地址或主机名更改为 logstash parser (192.168.25.23) 以匹配 Logstash 使用的 IP。
- 此 IP 地址可以是 **local IP** 或 **the IP of your ISP router**(如果您使用的是 cloud sensor)(即 OVH、AWS、Azure 等)
- 如果是 cloud sensor,**the IP of your ISP router** 需要在路由器中端口转发 (5044) 到 DShield SIEM。
``` sudo vi /etc/filebeat/filebeat.yml ``` output.logstash:
hosts: ["192.168.25.23:5044"]
#hosts: ["logstash.com:5044"]
### Filebeat 故障排除 ``` sudo su - filebeat test config ``` 预期输出:_Config OK
_ ``` filebeat test output ``` 预期输出:logstash: 192.168.25.231:5044... connection... parse host... OK dns lookup... OK addresses: 192.168.25.231 dial up... OK TLS... WARN secure connection disabled talk to server... OK ## 启动 Filebeat ``` sudo systemctl enable filebeat sudo systemctl start filebeat sudo systemctl status filebeat ``` ### Filebeat 跟踪文件 Filebeat 使用名为 **log.json** 的文件跟踪它已处理的事件,如果删除,则重新启动 filebeat 时,之前发送到 Elasticsearch 的所有事件都将被重新处理。
此文件的位置:
sudo su - ``` cd /var/lib/filebeat/registry/filebeat ``` 如果您计划因为 ELK server 重建而重新发送所有日志,_stop filebeat, delete log.json and restart filebeat_。 这通常需要一段时间才能在 ELK Stack dashboard 中追上。如果您想查看它是否正在将日志发送到 ELK Stack,您可以
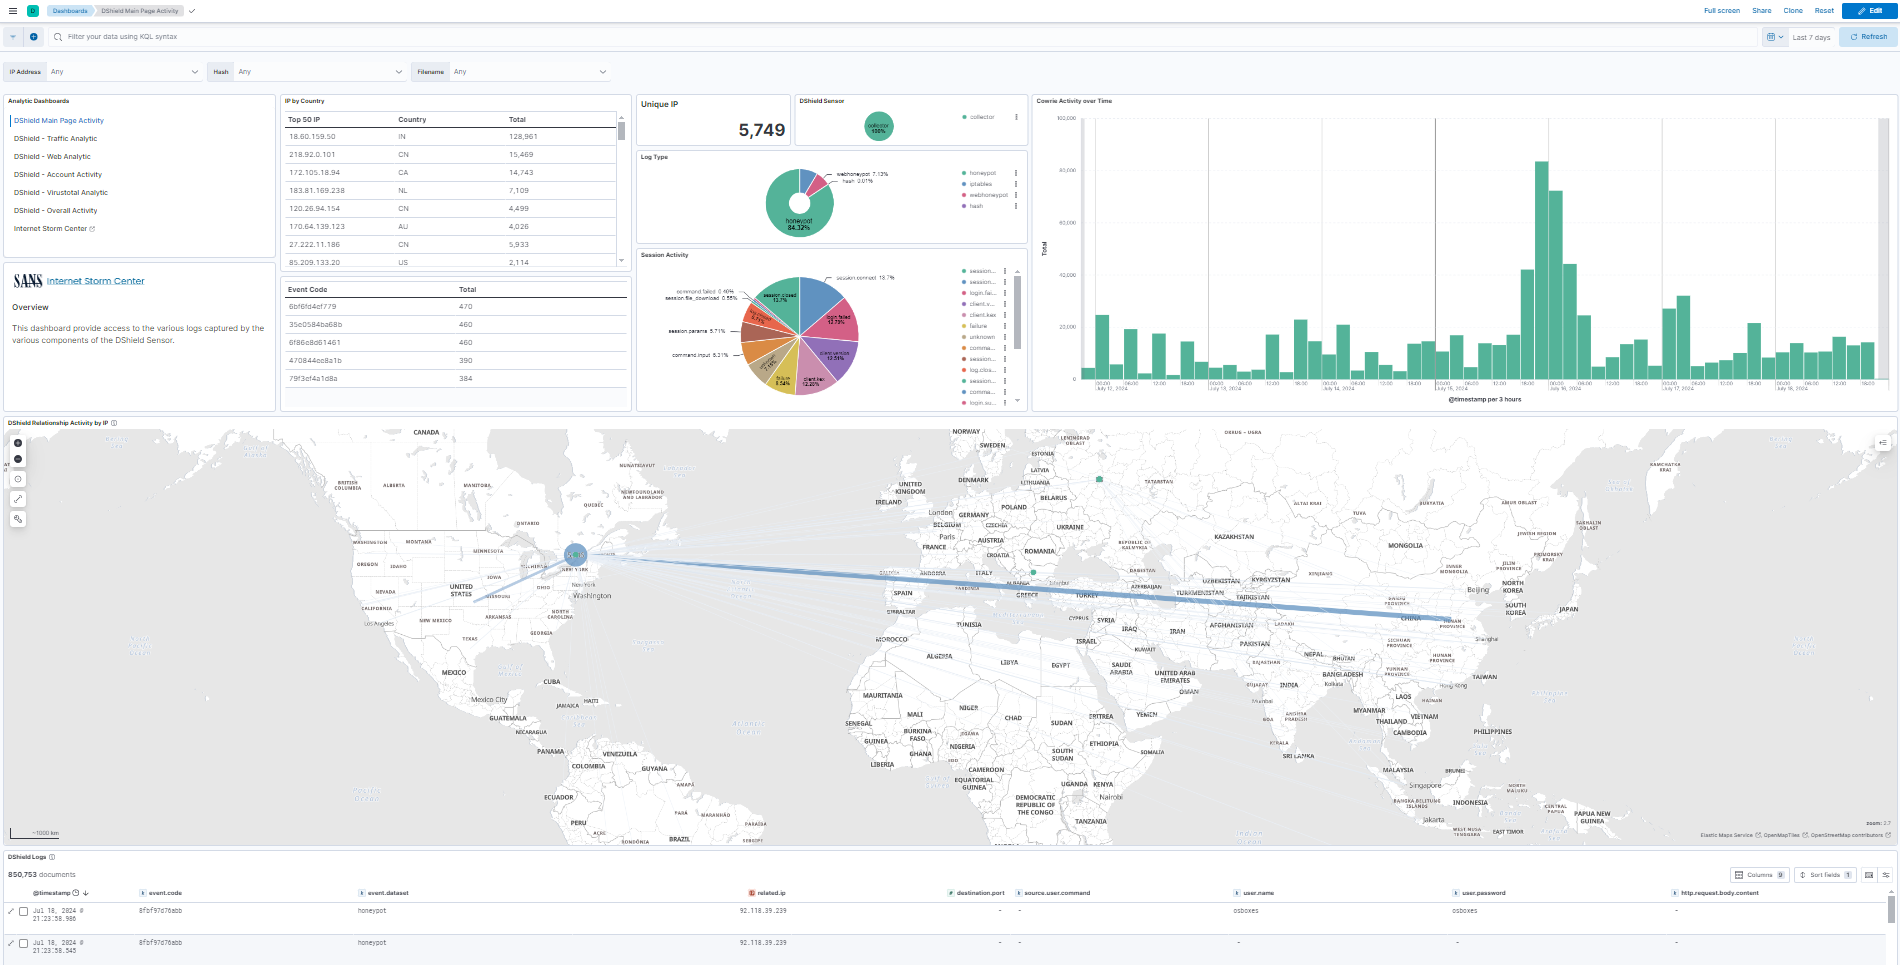
- tail -f log.json - 在 dashboard 中查看过去 30 天,同时它正在追赶 # 界面 - Logs DShield Sensor Overview 要访问 Dashboard,请选择 Analytics -> Dashboard -> **[Logs DShield Sensor] Overview**
 ## 将 ca.crt 添加到工作站浏览器 按照此 [Page](https://github.com/bruneaug/DShield-SIEM/blob/main/AddOn/Workstation_Browser_CA_Certificate.md) 中的步骤将 ELK server 使用的 ca.crt 添加到 Kibana。
 # 有用的 Docker 命令 有关有用 docker 命令的列表,请参阅此页面。
https://github.com/bruneaug/DShield-SIEM/edit/main/Troubleshooting/docker_useful_commands..md # 使用 Console 的 Elastic 信息 这些命令从 Dev Tool -> Console 运行
GET _nodes/http?pretty (获取所有节点的列表和信息)
GET _security/_authenticate
GET /_cat/nodes?v=true
# 学生编写的 DShield 分析脚本和代码 这是 BACS 课程学生编写的用于辅助日志分析的脚本和代码列表。
Jesse La Grew [cowrieprocessor](https://github.com/jslagrew/cowrieprocessor)
jrjobe [DShield-Cowrie-json-Parser](https://github.com/jrjobe/DShield-Cowrie-json-Parser)
ham-sauce [vt_cowrie](https://github.com/ham-sauce/vt_cowrie)
NickTheSecurityDude [dshield-honeypot-scripts](https://github.com/NickTheSecurityDude/dshield-honeypot-scripts/tree/main) 和 [LinkedIn Post](https://www.linkedin.com/pulse/how-i-used-honeypot-track-analyze-cyberattacks-nicholas-gilbert-jcste)
Josh Gilman [DShieldKickStarter](https://github.com/iamjoshgilman/DShieldKickStarter)
kcustom11 [dshield-azure](https://github.com/kcustom11/dshield-azure) Azure Terraform
Boggby [ec2-honeypot-template](https://github.com/Boggby/ec2-honeypot-template)
amelete11235 [homelab](https://github.com/amelete11235/homelab/blob/main/Installing%20DShield%20SIEM%20on%20a%20Raspberry%20Pi%205%20-%208%20GB%20RAM/Installing%20DShield%20SIEM%20on%20a%20Raspberry%20Pi%205%20-%208%20GB%20RAM.md) DShiel SIEM Raspberry 5
William Constantino [Cowrie logfile_investigation with Python](https://github.com/JJWCons/log-scripts/blob/main/logfile_investigation.py)
William Constantino [Cowrie single_multi_IP with](https://github.com/JJWCons/log-scripts/blob/main/single_multi_IP.py)
Steven C. Peterson [DShield Model Context Protocol](https://github.com/datagen24/dsheild-mcp)
Nathan Smisson [dshield-tooling](https://github.com/neurohypophysis/dshield-tooling)
# 参考资料 [1] https://isc.sans.edu/tools/honeypot/
[2] https://www.elastic.co/downloads/beats/filebeat
[3] https://www.elastic.co/guide/en/beats/filebeat/8.8/setup-repositories.html#_apt
[4] https://isc.sans.edu/diary/DShield+Honeypot+Activity+for+May+2023/29932
[5] https://isc.sans.edu/diary/DShield+Sensor+JSON+Log+to+Elasticsearch/29458
[6] https://isc.sans.edu/diary/DShield+Sensor+JSON+Log+Analysis/29412
[7] https://github.com/jslagrew/cowrieprocessor/blob/main/submit_vtfiles.py
[8] https://handlers.sans.edu/gbruneau/elastic.htm
[9] https://www.elastic.co/guide/en/fleet/current/secure-connections.html
[10] https://www.docker.elastic.co/
[11] https://github.com/gchq/CyberChef
[12] https://github.com/mitre-attack/attack-navigator/pkgs/container/attack-navigator
标签:Docker, DShield, Elasticsearch, ELK Stack, Filebeat, Logstash, OISF, PB级数据处理, Proxmox, 企业安全, 传感器, 内容过滤, 威胁情报, 安全日志, 安全运维, 安全防御评估, 开发者工具, 异常检测, 日志收集, 日志管理, 流量解析, 网络流量分析, 网络资产管理, 蜜罐, 蜜罐日志, 证书利用, 请求拦截, 越狱测试