Yamato-Security/hayabusa
GitHub: Yamato-Security/hayabusa
一款基于 Rust 编写、支持 Sigma 规则的超快速 Windows 事件日志取证时间线生成与威胁狩猎工具。
Stars: 3204 | Forks: 273

[
English ] | [
日本語]


# 关于 Hayabusa
Hayabusa 是由日本的 [Yamato Security](https://yamatosecurity.connpass.com/) 团队创建的一款 **Windows 事件日志快速取证时间线生成器**和**威胁狩猎工具**。
Hayabusa 在日语中意为 ["peregrine falcon"](https://en.wikipedia.org/wiki/Peregrine_falcon),之所以选择这个名字,是因为游隼是世界上速度最快的动物,擅长狩猎且极易训练。
它使用内存安全的 [Rust](https://www.rust-lang.org/) 编写,支持多线程以实现尽可能快的速度,并且是唯一完全支持 Sigma 规范(包括 v2 关联规则)的开源工具。
Hayabusa 可以处理解析 [upstream Sigma](https://github.com/SigmaHQ/sigma) 规则,但是,我们在 [hayabusa-rules repository](https://github.com/Yamato-Security/hayabusa-rules) 中使用和托管的 Sigma 规则经过了一些转换,以便使规则加载更加灵活并减少误报。
您可以在 [sigma-to-hayabusa-converter repository](https://github.com/Yamato-Security/sigma-to-hayabusa-converter) 的 README 文件中阅读相关详细信息。
Hayabusa 既可以在单个运行中的系统上运行以进行实时分析,也可以通过收集单个或多个系统的日志进行离线分析,或者通过运行带有 [Velociraptor](https://docs.velociraptor.app/) 的 [Hayabusa artifact](https://docs.velociraptor.app/exchange/artifacts/pages/windows.eventlogs.hayabusa/) 来进行企业范围的威胁狩猎和事件响应。
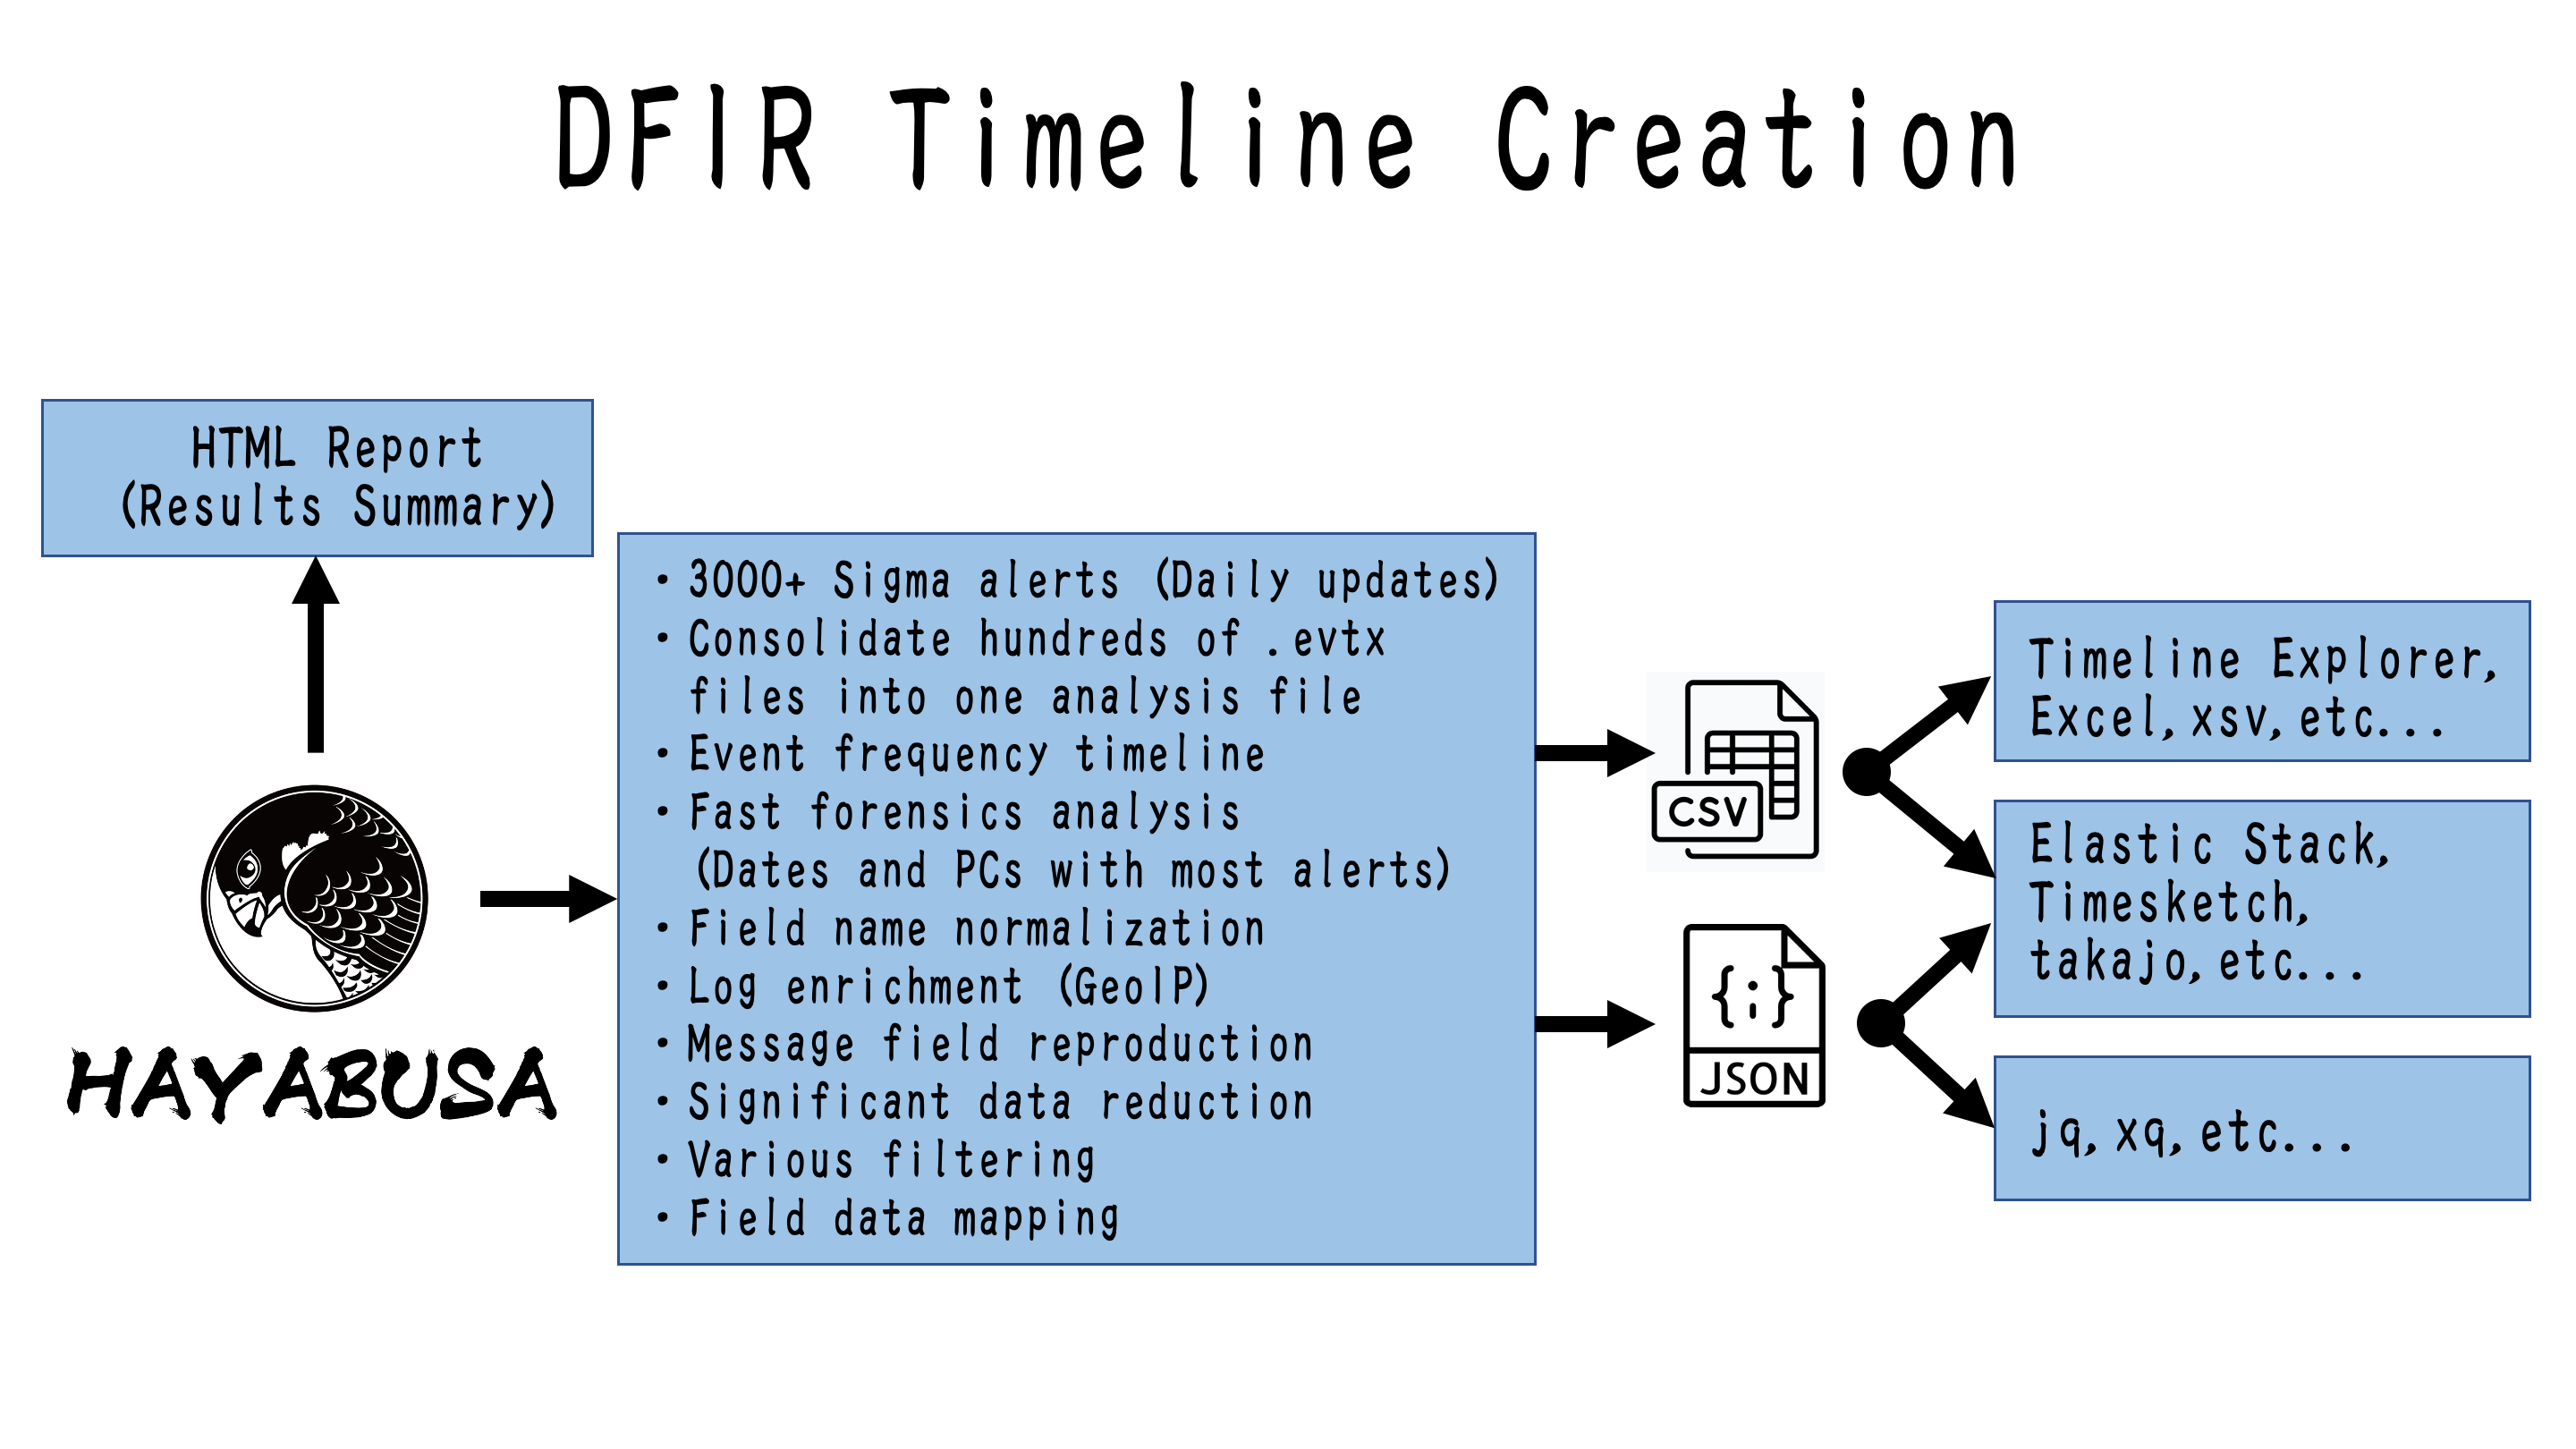
输出将整合到单个 CSV/JSON/JSONL 时间线中,以便在 [LibreOffice](https://www.libreoffice.org/)、[Timeline Explorer](https://ericzimmerman.github.io/#!index.md)、[Elastic Stack](doc/ElasticStackImport/ElasticStackImport-English.md)、[Timesketch](https://timesketch.org/) 等工具中轻松分析。
# 配套项目
* [EnableWindowsLogSettings](https://github.com/Yamato-Security/EnableWindowsLogSettings) - 正确启用 Windows 事件日志的文档和脚本。
* [Hayabusa Encoded Rules](https://github.com/Yamato-Security/hayabusa-encoded-rules) - 与 Hayabusa 规则存储库相同,但规则和配置文件存储在一个文件中并经过 XOR 处理,以防止防病毒软件产生误报。
* [Hayabusa Rules](https://github.com/Yamato-Security/hayabusa-rules) - Hayabusa 以及 Hayabusa 使用的精选 Sigma 检测规则。
* [Hayabusa EVTX](https://github.com/Yamato-Security/hayabusa-evtx) - `evtx` crate 的一个维护较好的分支。
* [Hayabusa Sample EVTXs](https://github.com/Yamato-Security/hayabusa-sample-evtx) - 用于测试 hayabusa/sigma 检测规则的示例 evtx 文件。
* [Presentations](https://github.com/Yamato-Security/Presentations) - 我们关于工具和资源的演讲演示文稿。
* [Sigma to Hayabusa Converter](https://github.com/Yamato-Security/sigma-to-hayabusa-converter) - 将上游基于 Windows 事件日志的 Sigma 规则整理成更易于使用的形式。
* [Takajo](https://github.com/Yamato-Security/takajo) - hayabusa 结果分析器。
* [WELA (Windows Event Log Analyzer)](https://github.com/Yamato-Security/WELA) - 使用 PowerShell 编写的 Windows 事件日志分析器。(已弃用并由 Takajo 取代。)
# 使用 Hayabusa 的第三方项目
* [AllthingsTimesketch](https://github.com/blueteam0ps/AllthingsTimesketch) - 将 Plaso 和 Hayabusa 结果导入 Timesketch 的 NodeRED 工作流。
* [LimaCharlie](https://docs.limacharlie.io/docs/extensions-third-party-extensions-hayabusa) - 提供适合您需求的基于云的安全工具和基础设施。
* [OpenRelik](https://openrelik.org/) - 一个开源 (Apache-2.0) 平台,旨在简化协作数字取证调查。
* [Splunk4DFIR](https://github.com/mf1d3l/Splunk4DFIR) - 使用 Docker 快速启动 splunk 实例,以便在调查期间浏览日志和工具输出。
* [Velociraptor](https://github.com/Velocidex/velociraptor) - 一种使用 Velociraptor 查询语言 (VQL) 查询收集基于主机的状态信息的工具。
## 目录
- [About Hayabusa](#about-hayabusa)
- [Companion Projects](#companion-projects)
- [Third-Party Projects That Use Hayabusa](#third-party-projects-that-use-hayabusa)
- [Table of Contents](#table-of-contents)
- [Main Goals](#main-goals)
- [Threat Hunting and Enterprise-wide DFIR](#threat-hunting-and-enterprise-wide-dfir)
- [Fast Forensics Timeline Generation](#fast-forensics-timeline-generation)
- [Screenshots](#screenshots)
- [Startup](#startup)
- [DFIR Timeline Terminal Output](#dfir-timeline-terminal-output)
- [Keyword Search Results](#keyword-search-results)
- [Detection Fequency Timeline (`-T` option)](#detection-fequency-timeline--t-option)
- [Results Summary](#results-summary)
- [HTML Results Summary (`-H` option)](#html-results-summary--h-option)
- [DFIR Timeline Analysis in LibreOffice (`-M` Multiline Output)](#dfir-timeline-analysis-in-libreoffice--m-multiline-output)
- [DFIR Timeline Analysis in Timeline Explorer](#dfir-timeline-analysis-in-timeline-explorer)
- [Critical Alert Filtering and Computer Grouping in Timeline Explorer](#critical-alert-filtering-and-computer-grouping-in-timeline-explorer)
- [Analysis in Timesketch](#analysis-in-timesketch)
- [Importing and Analyzing Timeline Results](#importing-and-analyzing-timeline-results)
- [Analyzing JSON-formatted results with JQ](#analyzing-json-formatted-results-with-jq)
- [Features](#features)
- [Downloads](#downloads)
- [Windows live response packages](#windows-live-response-packages)
- [Git Cloning](#git-cloning)
- [Advanced: Compiling From Source (Optional)](#advanced-compiling-from-source-optional)
- [Updating Rust Packages](#updating-rust-packages)
- [Cross-compiling 32-bit Windows Binaries](#cross-compiling-32-bit-windows-binaries)
- [macOS Compiling Notes](#macos-compiling-notes)
- [Linux Compiling Notes](#linux-compiling-notes)
- [Cross-compiling Linux MUSL Binaries](#cross-compiling-linux-musl-binaries)
- [Running Hayabusa](#running-hayabusa)
- [Caution: Anti-Virus/EDR Warnings and Slow Runtimes](#caution-anti-virusedr-warnings-and-slow-runtimes)
- [Windows](#windows)
- [Error when trying to scan a file or directory with a space in the path](#error-when-trying-to-scan-a-file-or-directory-with-a-space-in-the-path)
- [Characters not being displayed correctly](#characters-not-being-displayed-correctly)
- [Linux](#linux)
- [macOS](#macos)
- [Command List](#command-list)
- [Analysis Commands:](#analysis-commands)
- [Config Commands:](#config-commands)
- [DFIR Timeline Commands:](#dfir-timeline-commands)
- [General Commands:](#general-commands)
- [Command Usage](#command-usage)
- [Analysis Commands](#analysis-commands-1)
- [`computer-metrics` command](#computer-metrics-command)
- [`computer-metrics` command examples](#computer-metrics-command-examples)
- [`computer-metrics` screenshot](#computer-metrics-screenshot)
- [`eid-metrics` command](#eid-metrics-command)
- [`eid-metrics` command examples](#eid-metrics-command-examples)
- [`eid-metrics` command config file](#eid-metrics-command-config-file)
- [`eid-metrics` screenshot](#eid-metrics-screenshot)
- [`expand-list` command](#expand-list-command)
- [`expand-list` command examples](#expand-list-command-examples)
- [`expand-list` results](#expand-list-results)
- [`extract-base64` command](#extract-base64-command)
- [`extract-base64` command examples](#extract-base64-command-examples)
- [`extract-base64` results](#extract-base64-results)
- [`log-metrics` command](#log-metrics-command)
- [`log-metrics` command examples](#log-metrics-command-examples)
- [`log-metrics` screenshot](#log-metrics-screenshot)
- [`logon-summary` command](#logon-summary-command)
- [`logon-summary` command examples](#logon-summary-command-examples)
- [`logon-summary` screenshots](#logon-summary-screenshots)
- [`pivot-keywords-list` command](#pivot-keywords-list-command)
- [`pivot-keywords-list` command examples](#pivot-keywords-list-command-examples)
- [`pivot-keywords-list` config file](#pivot-keywords-list-config-file)
- [`search` command](#search-command)
- [`search` command examples](#search-command-examples)
- [`search` command config files](#search-command-config-files)
- [Config Commands](#config-commands-1)
- [`config-critical-systems` command](#config-critical-systems-command)
- [`config-critical-systems` command examples](#config-critical-systems-command-examples)
- [DFIR Timeline Commands](#dfir-timeline-commands-1)
- [Scan Wizard](#scan-wizard)
- [Core Rules](#core-rules)
- [Core+ Rules](#core-rules-1)
- [Core++ Rules](#core-rules-2)
- [Emerging Threats (ET) Add-On Rules](#emerging-threats-et-add-on-rules)
- [Threat Hunting (TH) Add-On Rules](#threat-hunting-th-add-on-rules)
- [Channel-based event log and rules filtering](#channel-based-event-log-and-rules-filtering)
- [`csv-timeline` command](#csv-timeline-command)
- [`csv-timeline` command examples](#csv-timeline-command-examples)
- [Advanced - GeoIP Log Enrichment](#advanced---geoip-log-enrichment)
- [GeoIP config file](#geoip-config-file)
- [Automatic updates of GeoIP databases](#automatic-updates-of-geoip-databases)
- [`csv-timeline` command config files](#csv-timeline-command-config-files)
- [`json-timeline` command](#json-timeline-command)
- [`json-timeline` command examples and config files](#json-timeline-command-examples-and-config-files)
- [`level-tuning` command](#level-tuning-command)
- [`level-tuning` command examples](#level-tuning-command-examples)
- [`level-tuning` config file](#level-tuning-config-file)
- [`list-profiles` command](#list-profiles-command)
- [`set-default-profile` command](#set-default-profile-command)
- [`set-default-profile` command examples](#set-default-profile-command-examples)
- [`update-rules` command](#update-rules-command)
- [`update-rules` command example](#update-rules-command-example)
- [Timeline Output](#timeline-output)
- [Output Profiles](#output-profiles)
- [1. `minimal` profile output](#1-minimal-profile-output)
- [2. `standard` profile output](#2-standard-profile-output)
- [3. `verbose` profile output](#3-verbose-profile-output)
- [4. `all-field-info` profile output](#4-all-field-info-profile-output)
- [5. `all-field-info-verbose` profile output](#5-all-field-info-verbose-profile-output)
- [6. `super-verbose` profile output](#6-super-verbose-profile-output)
- [7. `timesketch-minimal` profile output](#7-timesketch-minimal-profile-output)
- [8. `timesketch-verbose` profile output](#8-timesketch-verbose-profile-output)
- [Profile Comparison](#profile-comparison)
- [Profile Field Aliases](#profile-field-aliases)
- [Extra Profile Field Alias](#extra-profile-field-alias)
- [Abbreviations](#abbreviations)
- [Level Abbreviations](#level-abbreviations)
- [MITRE ATT\&CK Tactics Abbreviations](#mitre-attck-tactics-abbreviations)
- [Channel Abbreviations](#channel-abbreviations)
- [Other Abbreviations](#other-abbreviations)
- [Progress Bar](#progress-bar)
- [Color Output](#color-output)
- [Results Summary](#results-summary-1)
- [Detection Fequency Timeline](#detection-fequency-timeline)
- [Hayabusa Rules](#hayabusa-rules)
- [Sigma v.s. Hayabusa (Built-in Sigma Compatible) Rules](#sigma-vs-hayabusa-built-in-sigma-compatible-rules)
- [Other Windows Event Log Analyzers and Related Resources](#other-windows-event-log-analyzers-and-related-resources)
- [Windows Logging Recommendations](#windows-logging-recommendations)
- [Sysmon Related Projects](#sysmon-related-projects)
- [Community Documentation](#community-documentation)
- [English](#english)
- [Japanese](#japanese)
- [Contribution](#contribution)
- [Bug Submission](#bug-submission)
- [License](#license)
- [Twitter](#twitter)
## 主要目标
### 威胁狩猎和企业级 DFIR
Hayabusa 目前拥有超过 4000 条 Sigma 规则和超过 170 条 Hayabusa 内置检测规则,并且还在定期添加更多规则。
它可以与 [Velociraptor](https://docs.velociraptor.app/) 的 [Hayabusa artifact](https://docs.velociraptor.app/exchange/artifacts/pages/windows.eventlogs.hayabusa/) 结合使用,免费进行企业级主动威胁狩猎以及 DFIR(数字取证与事件响应)。
通过结合这两个开源工具,您可以在环境中没有设置 SIEM 的情况下,实质上追溯性地重现 SIEM。
您可以通过观看 [Eric Capuano](https://twitter.com/eric_capuano) 的 Velociraptor 演示视频 [here](https://www.youtube.com/watch?v=Q1IoGX--814) 来了解如何操作。
### 快速取证时间线生成
传统的 Windows 事件日志分析一直是一个非常漫长且乏味的过程,因为 Windows 事件日志:1) 采用难以分析的数据格式;2) 大部分数据是噪声,对调查没有用处。
Hayabusa 的目标是仅提取有用数据,并以尽可能简洁、易读的格式呈现,不仅供经过专业培训的分析师使用,也供任何 Windows 系统管理员使用。
Hayabusa 希望让分析师与传统的 Windows 事件日志分析相比,能用 20% 的时间完成 80% 的工作。
# 截图
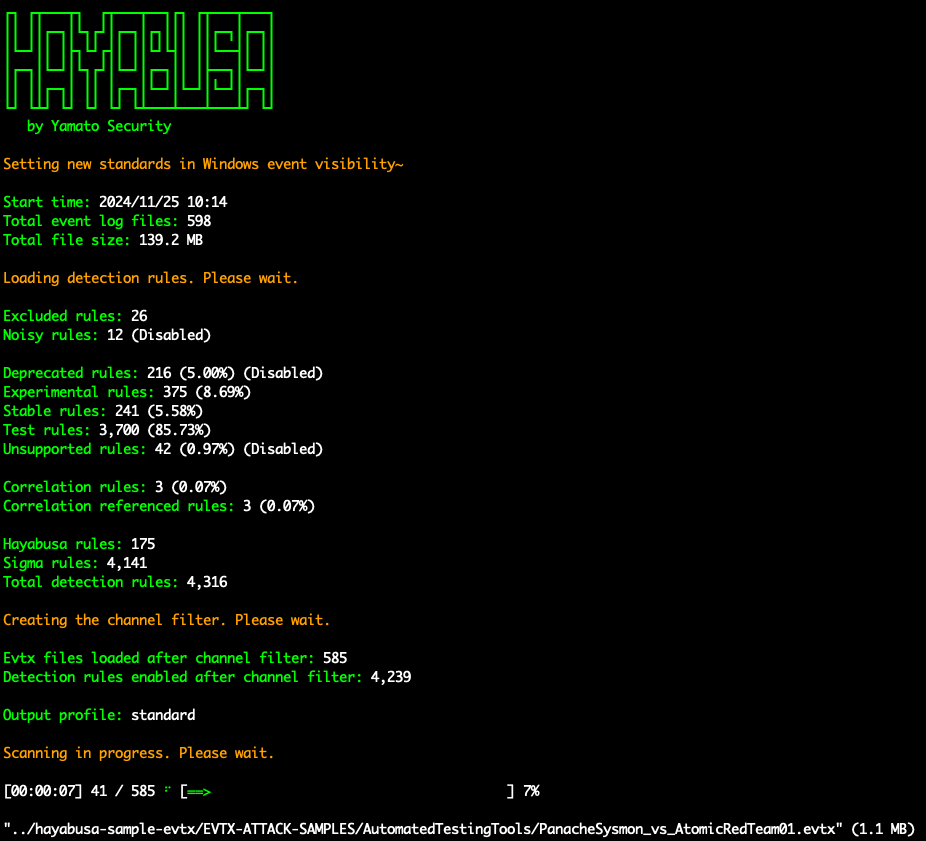
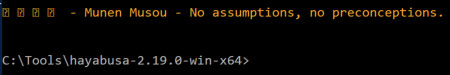
## 启动
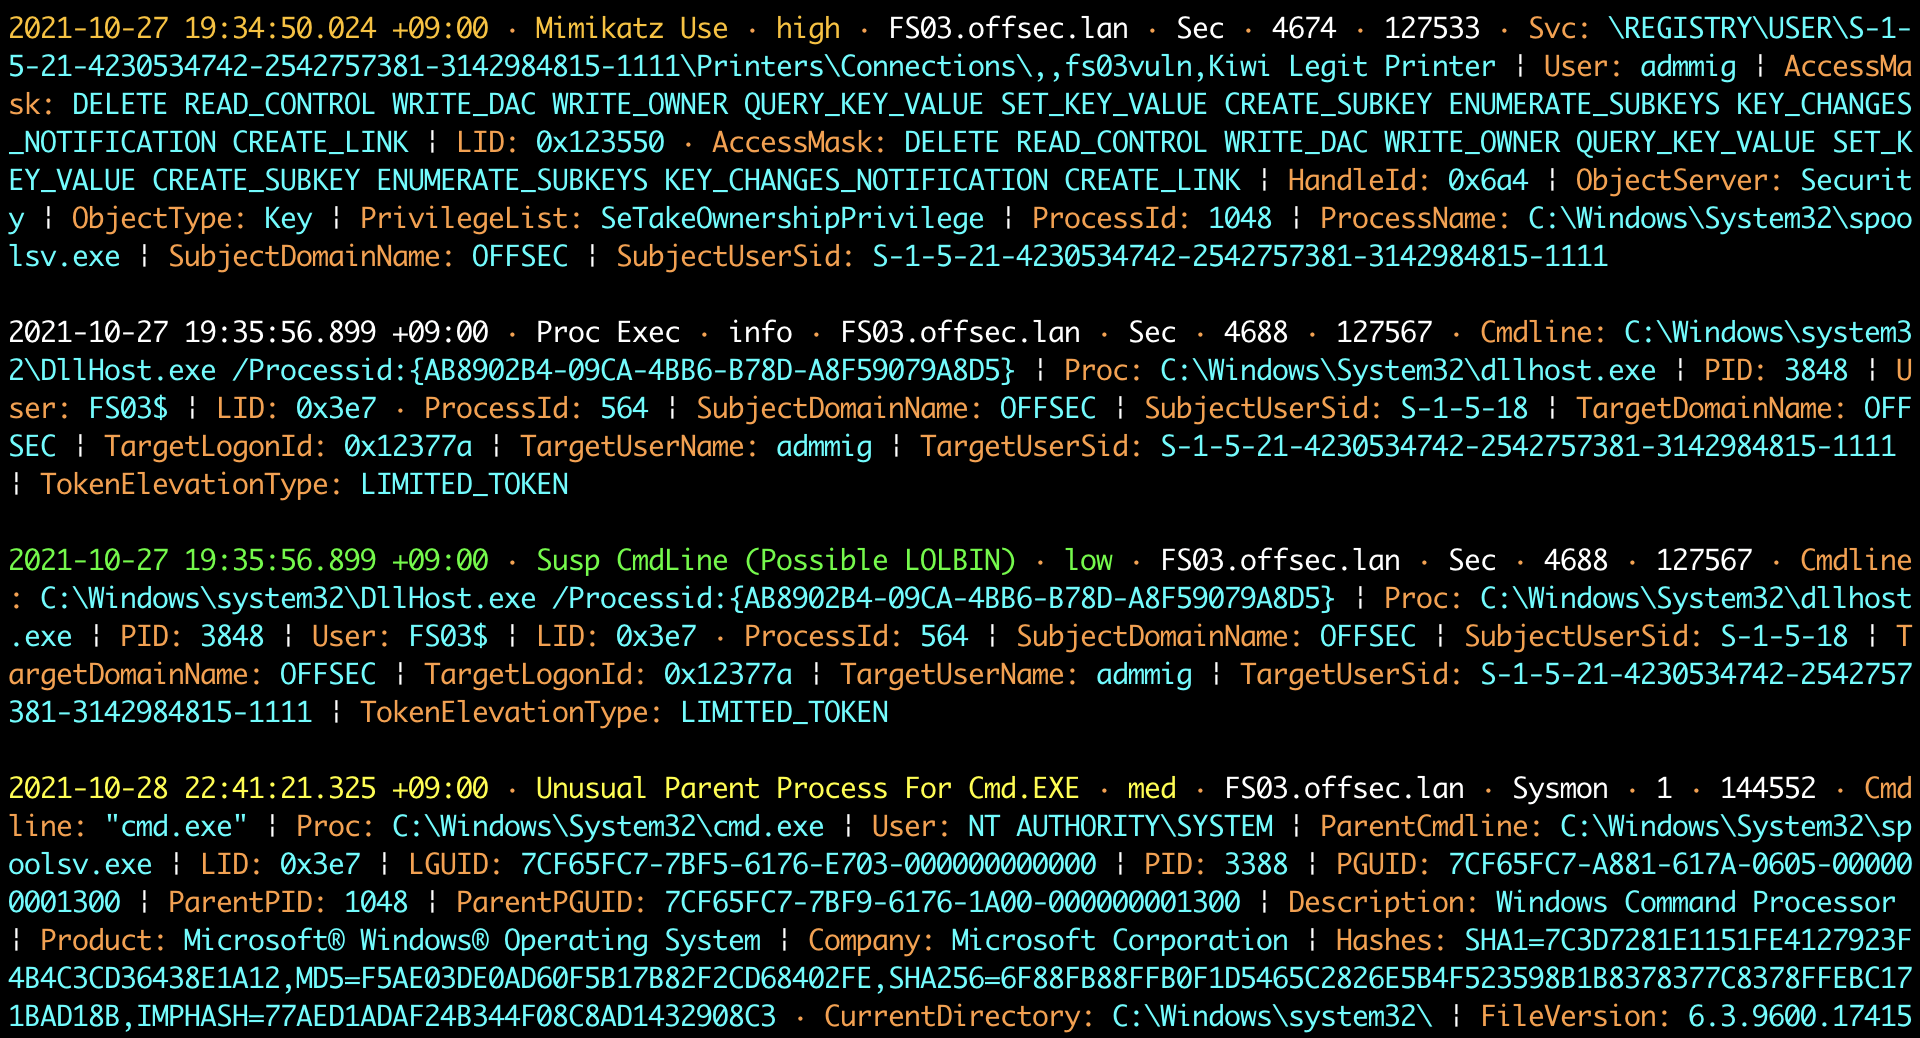
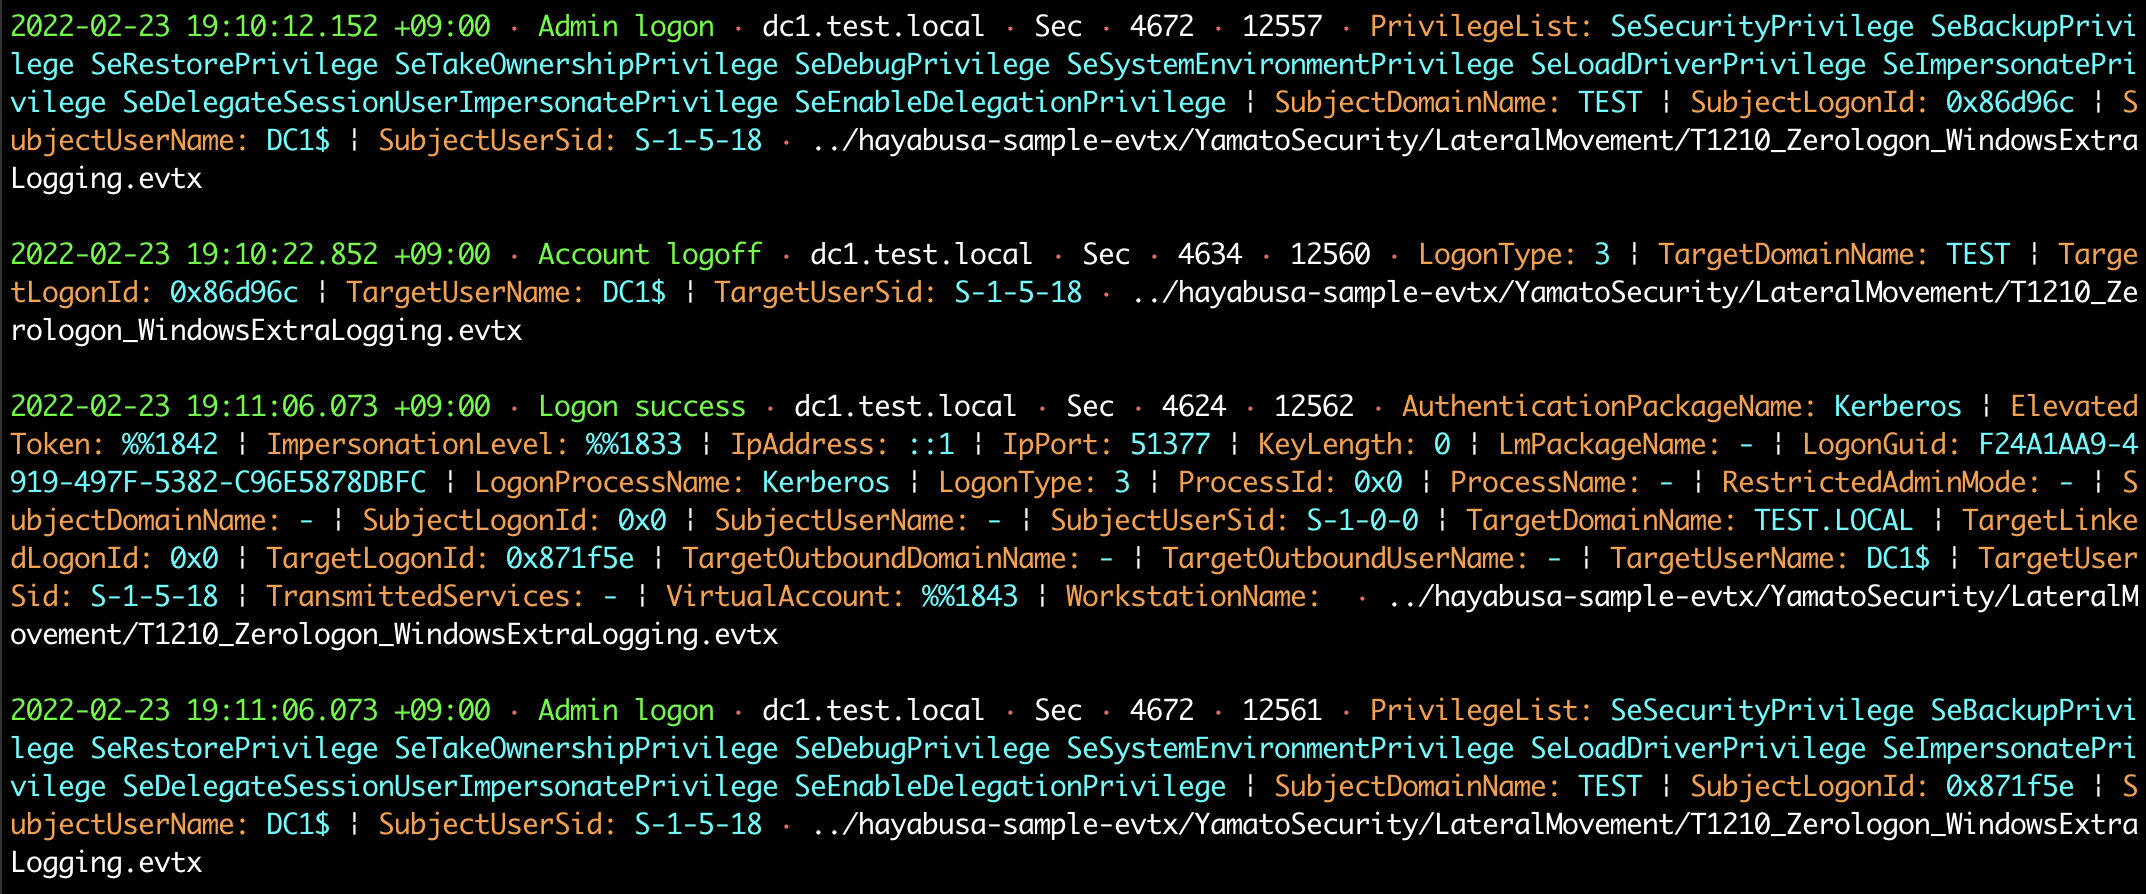
## DFIR 时间线终端输出
## 关键词搜索结果
## 检测频率时间线(`-T` 选项)
## 结果摘要
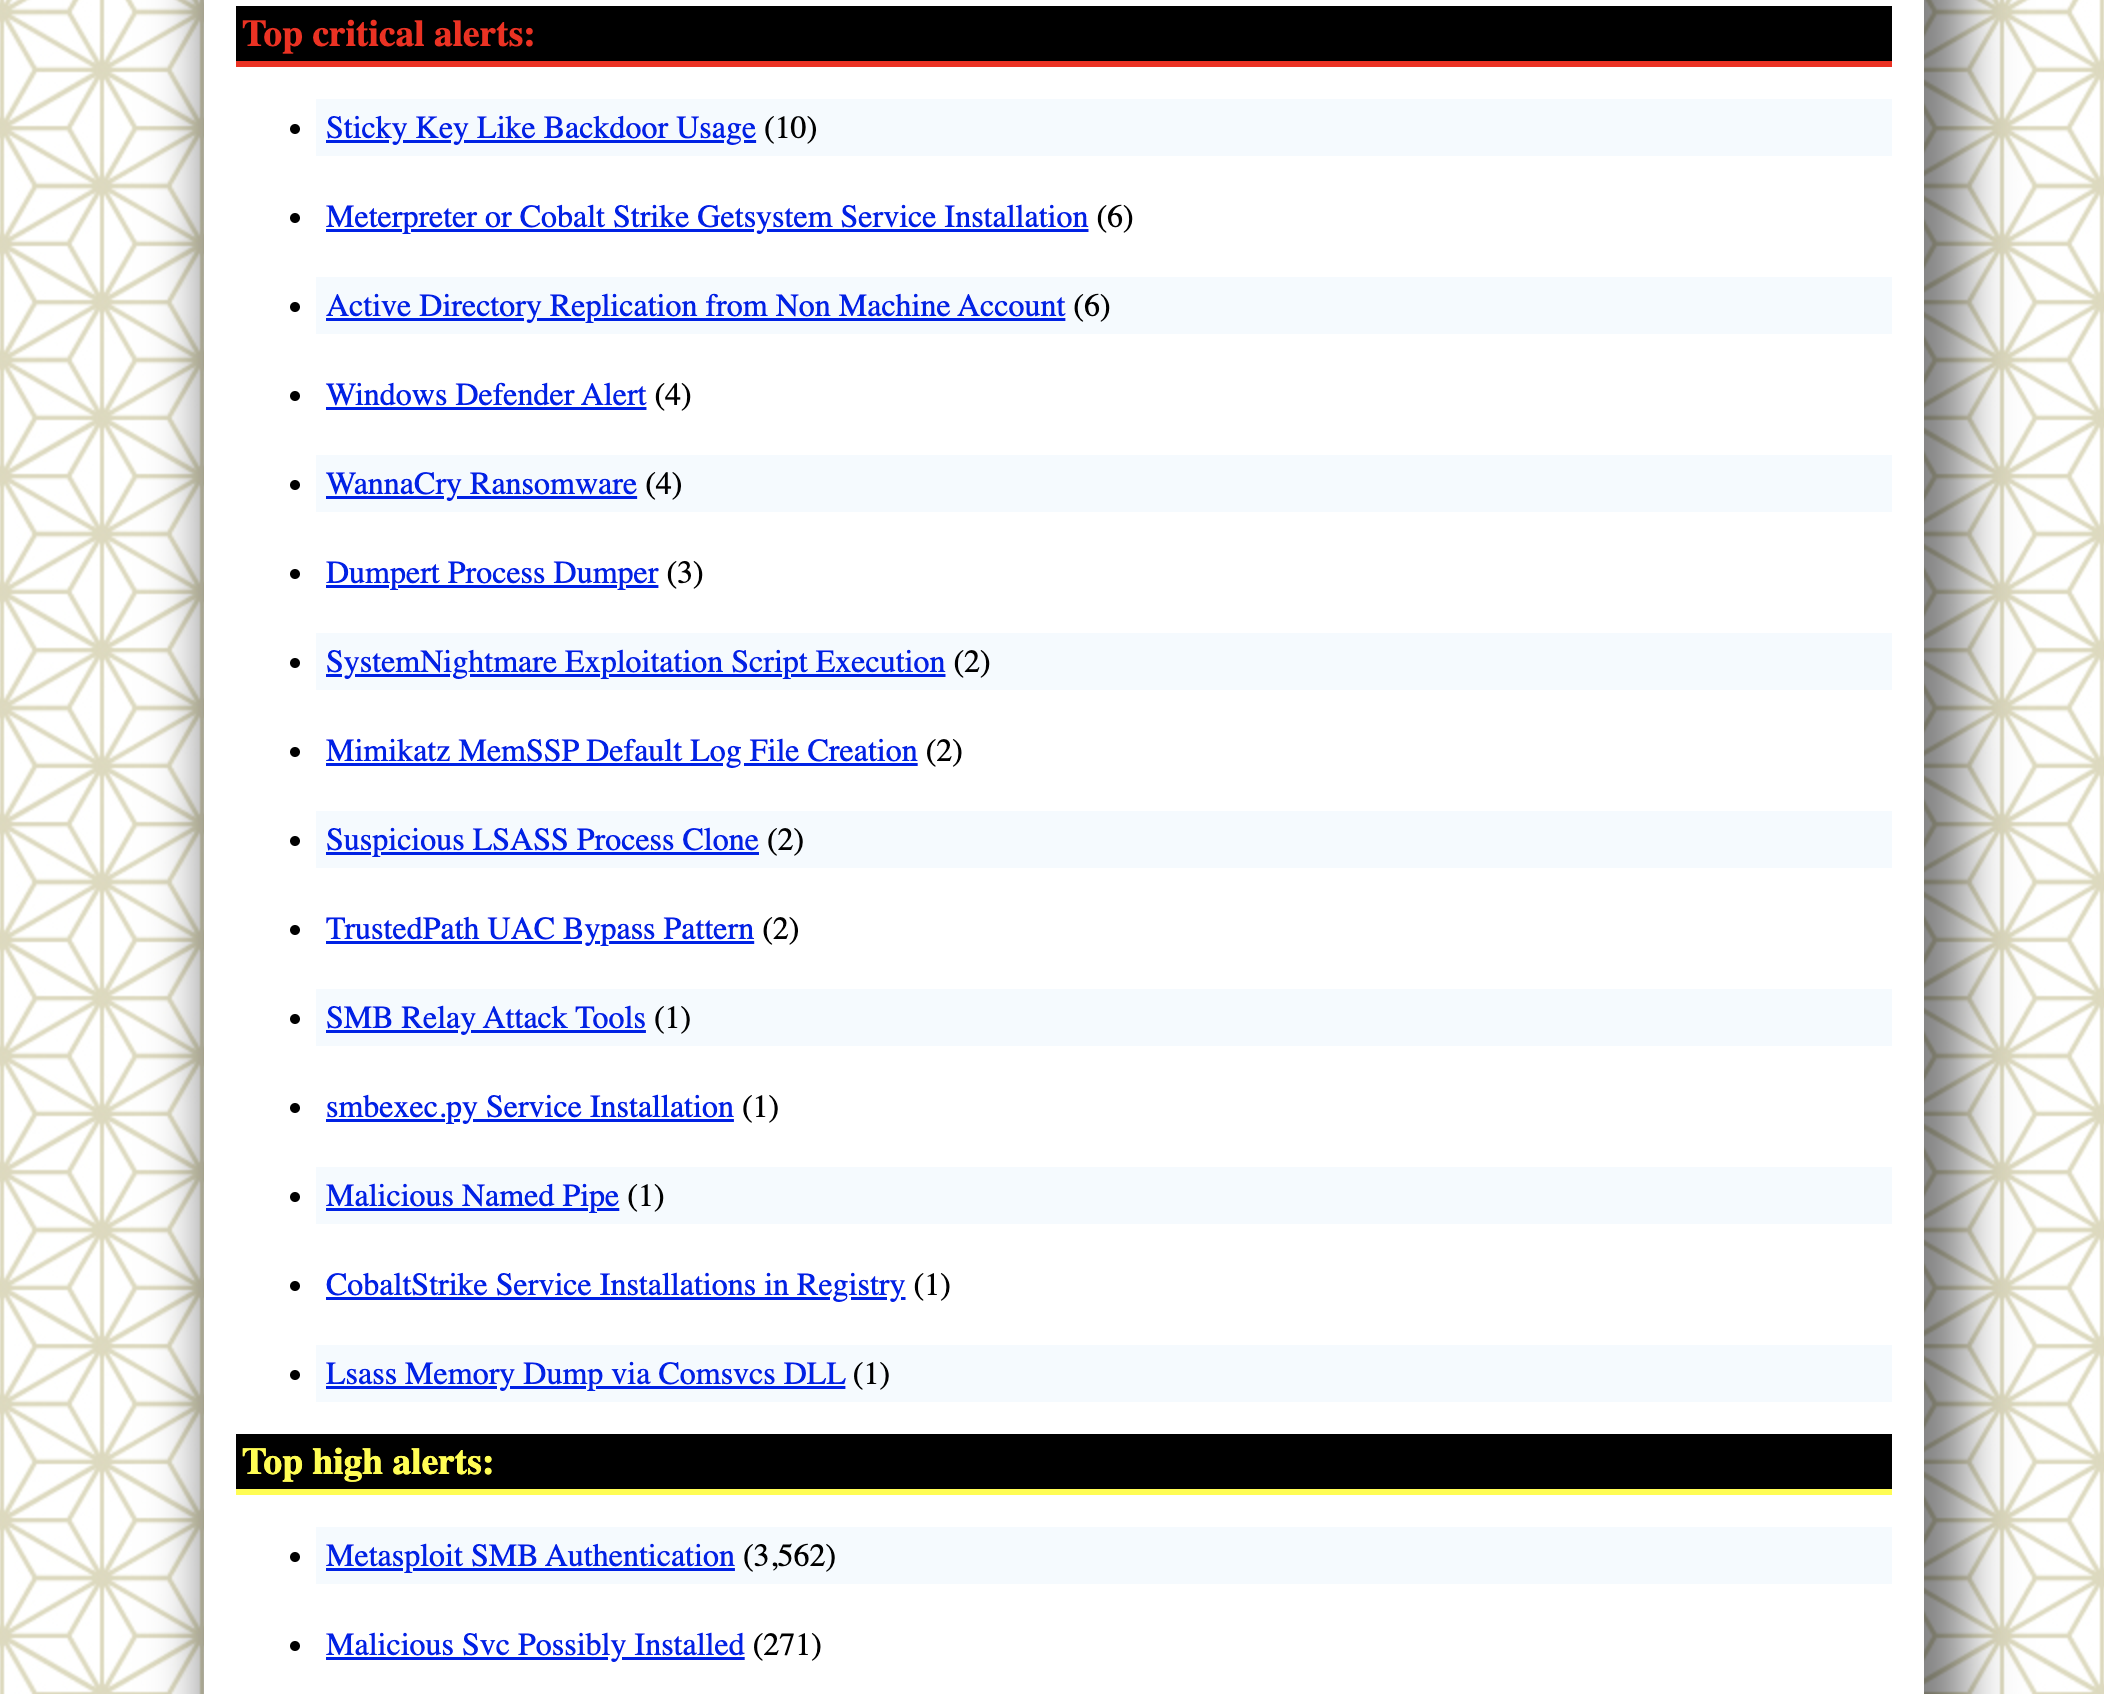
## HTML 结果摘要(`-H` 选项)
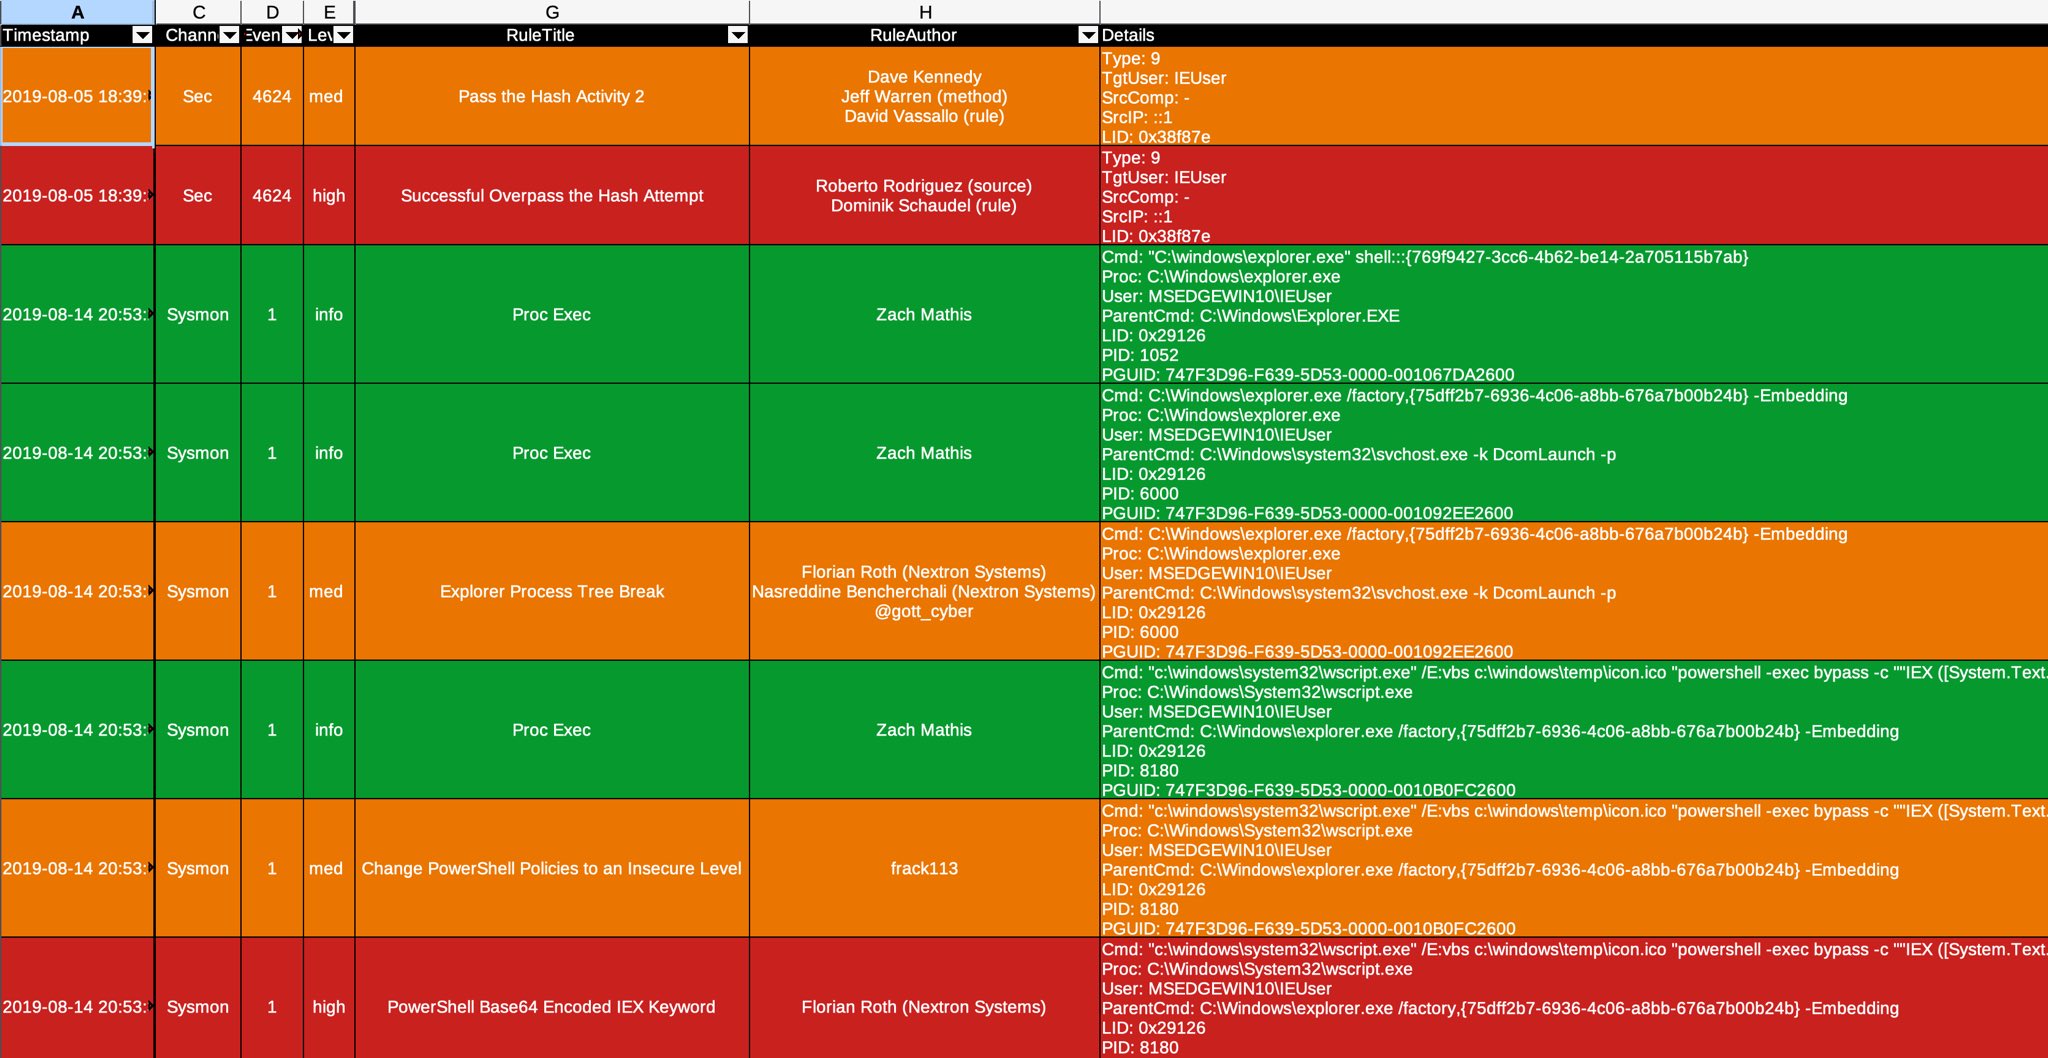
## 在 LibreOffice 中进行 DFIR 时间线分析(`-M` 多行输出)
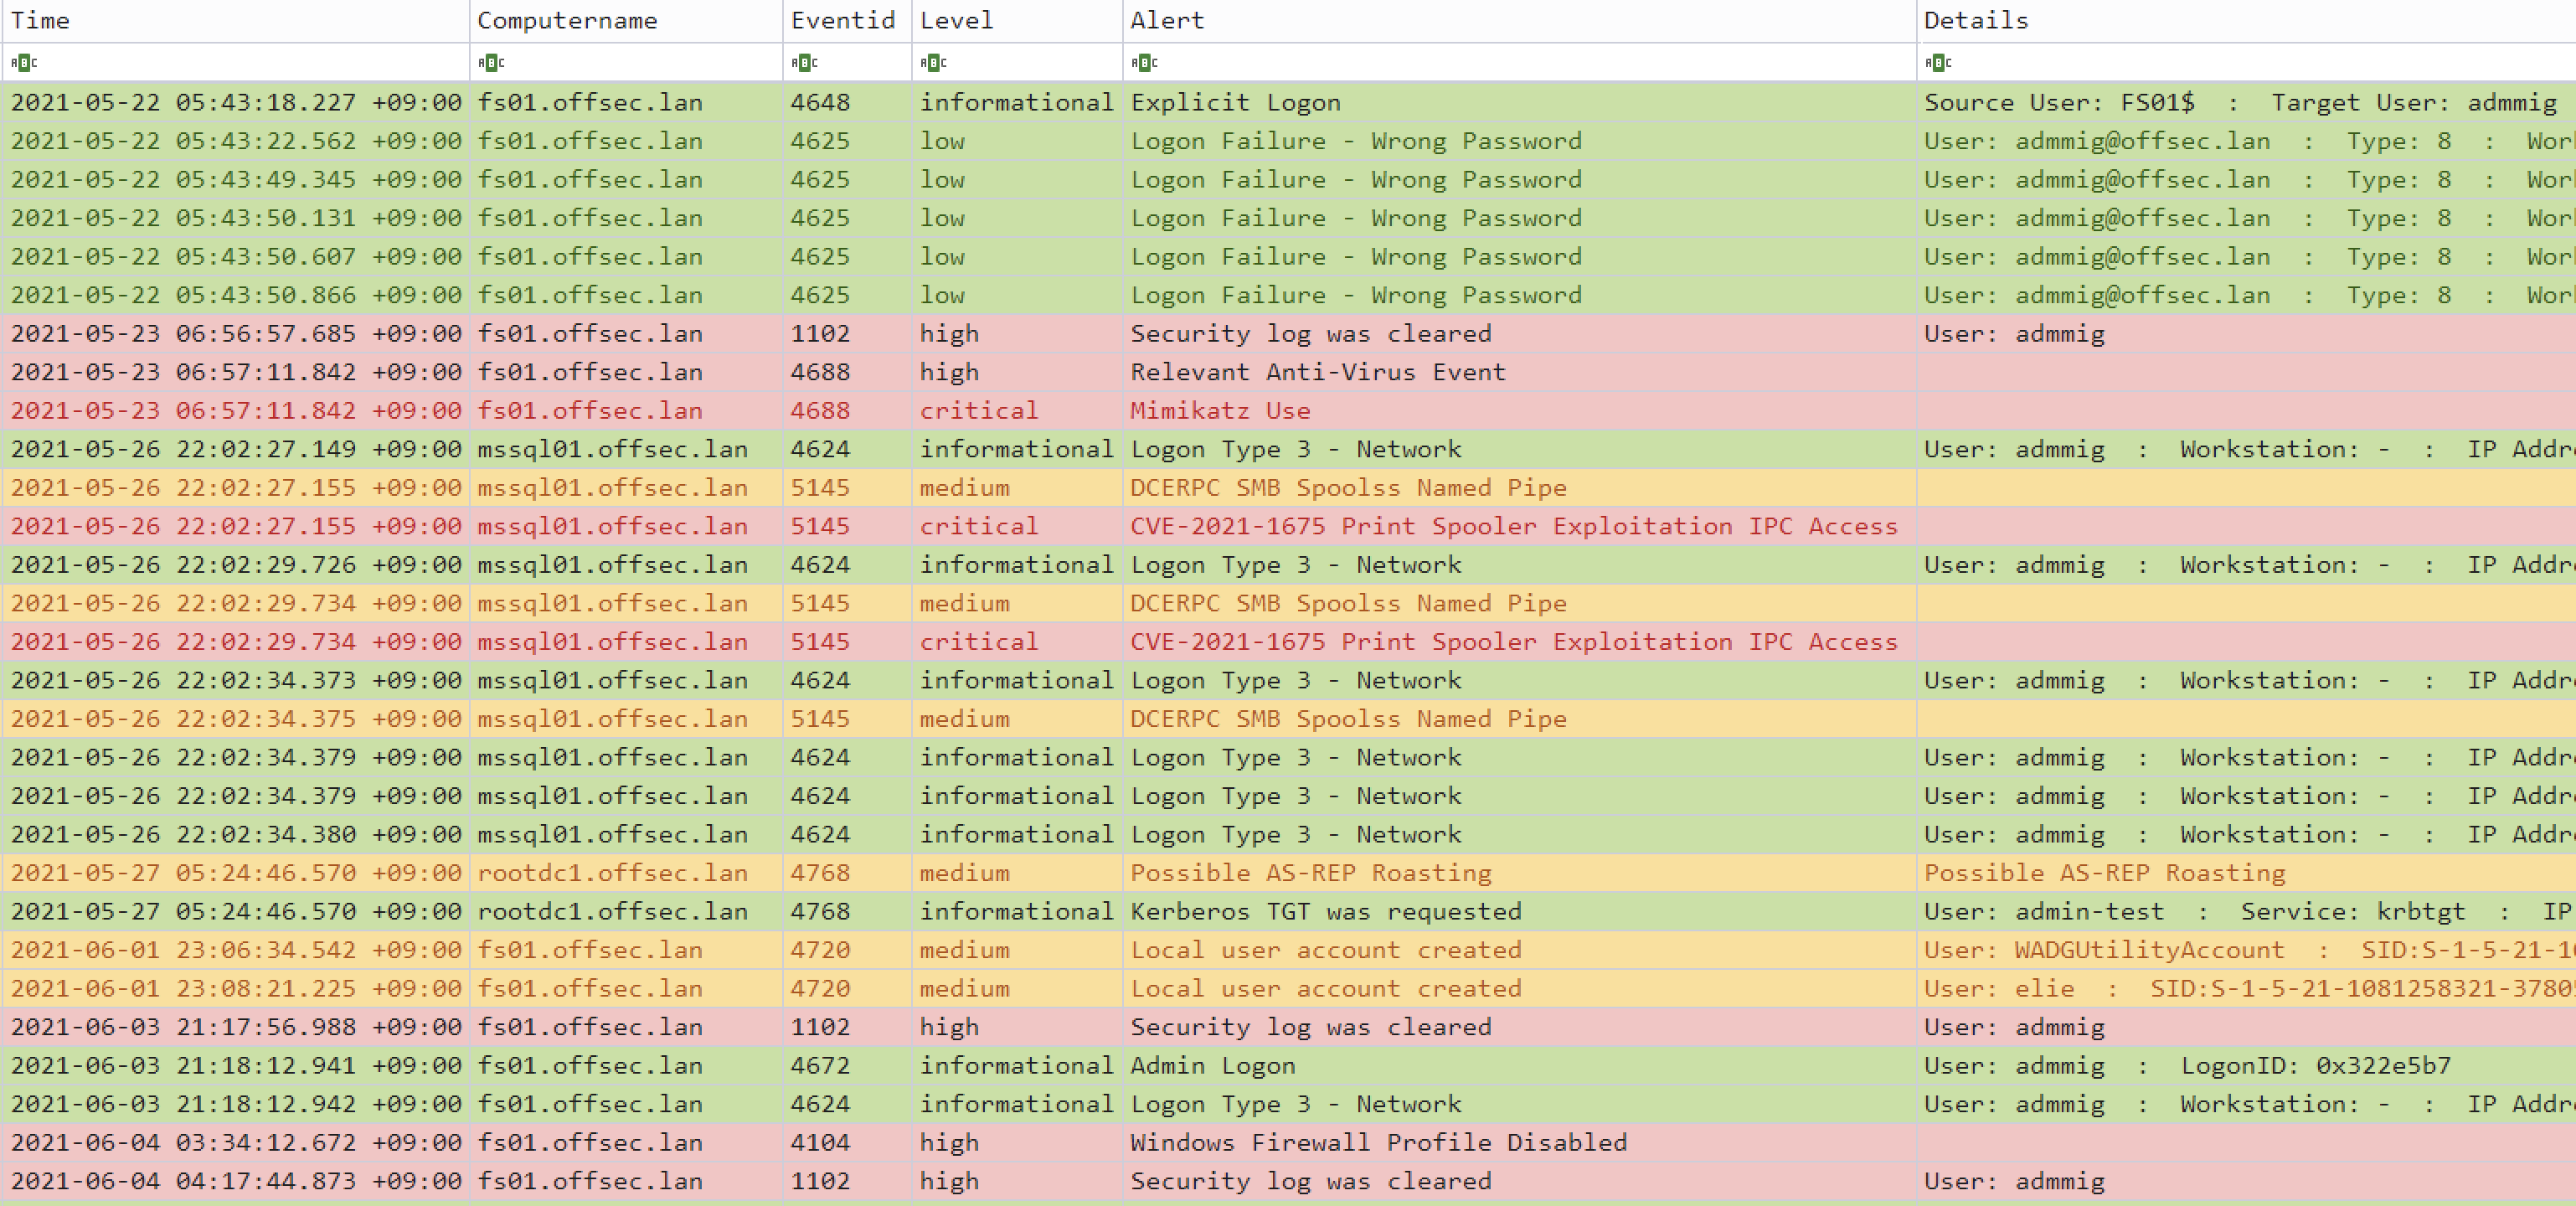
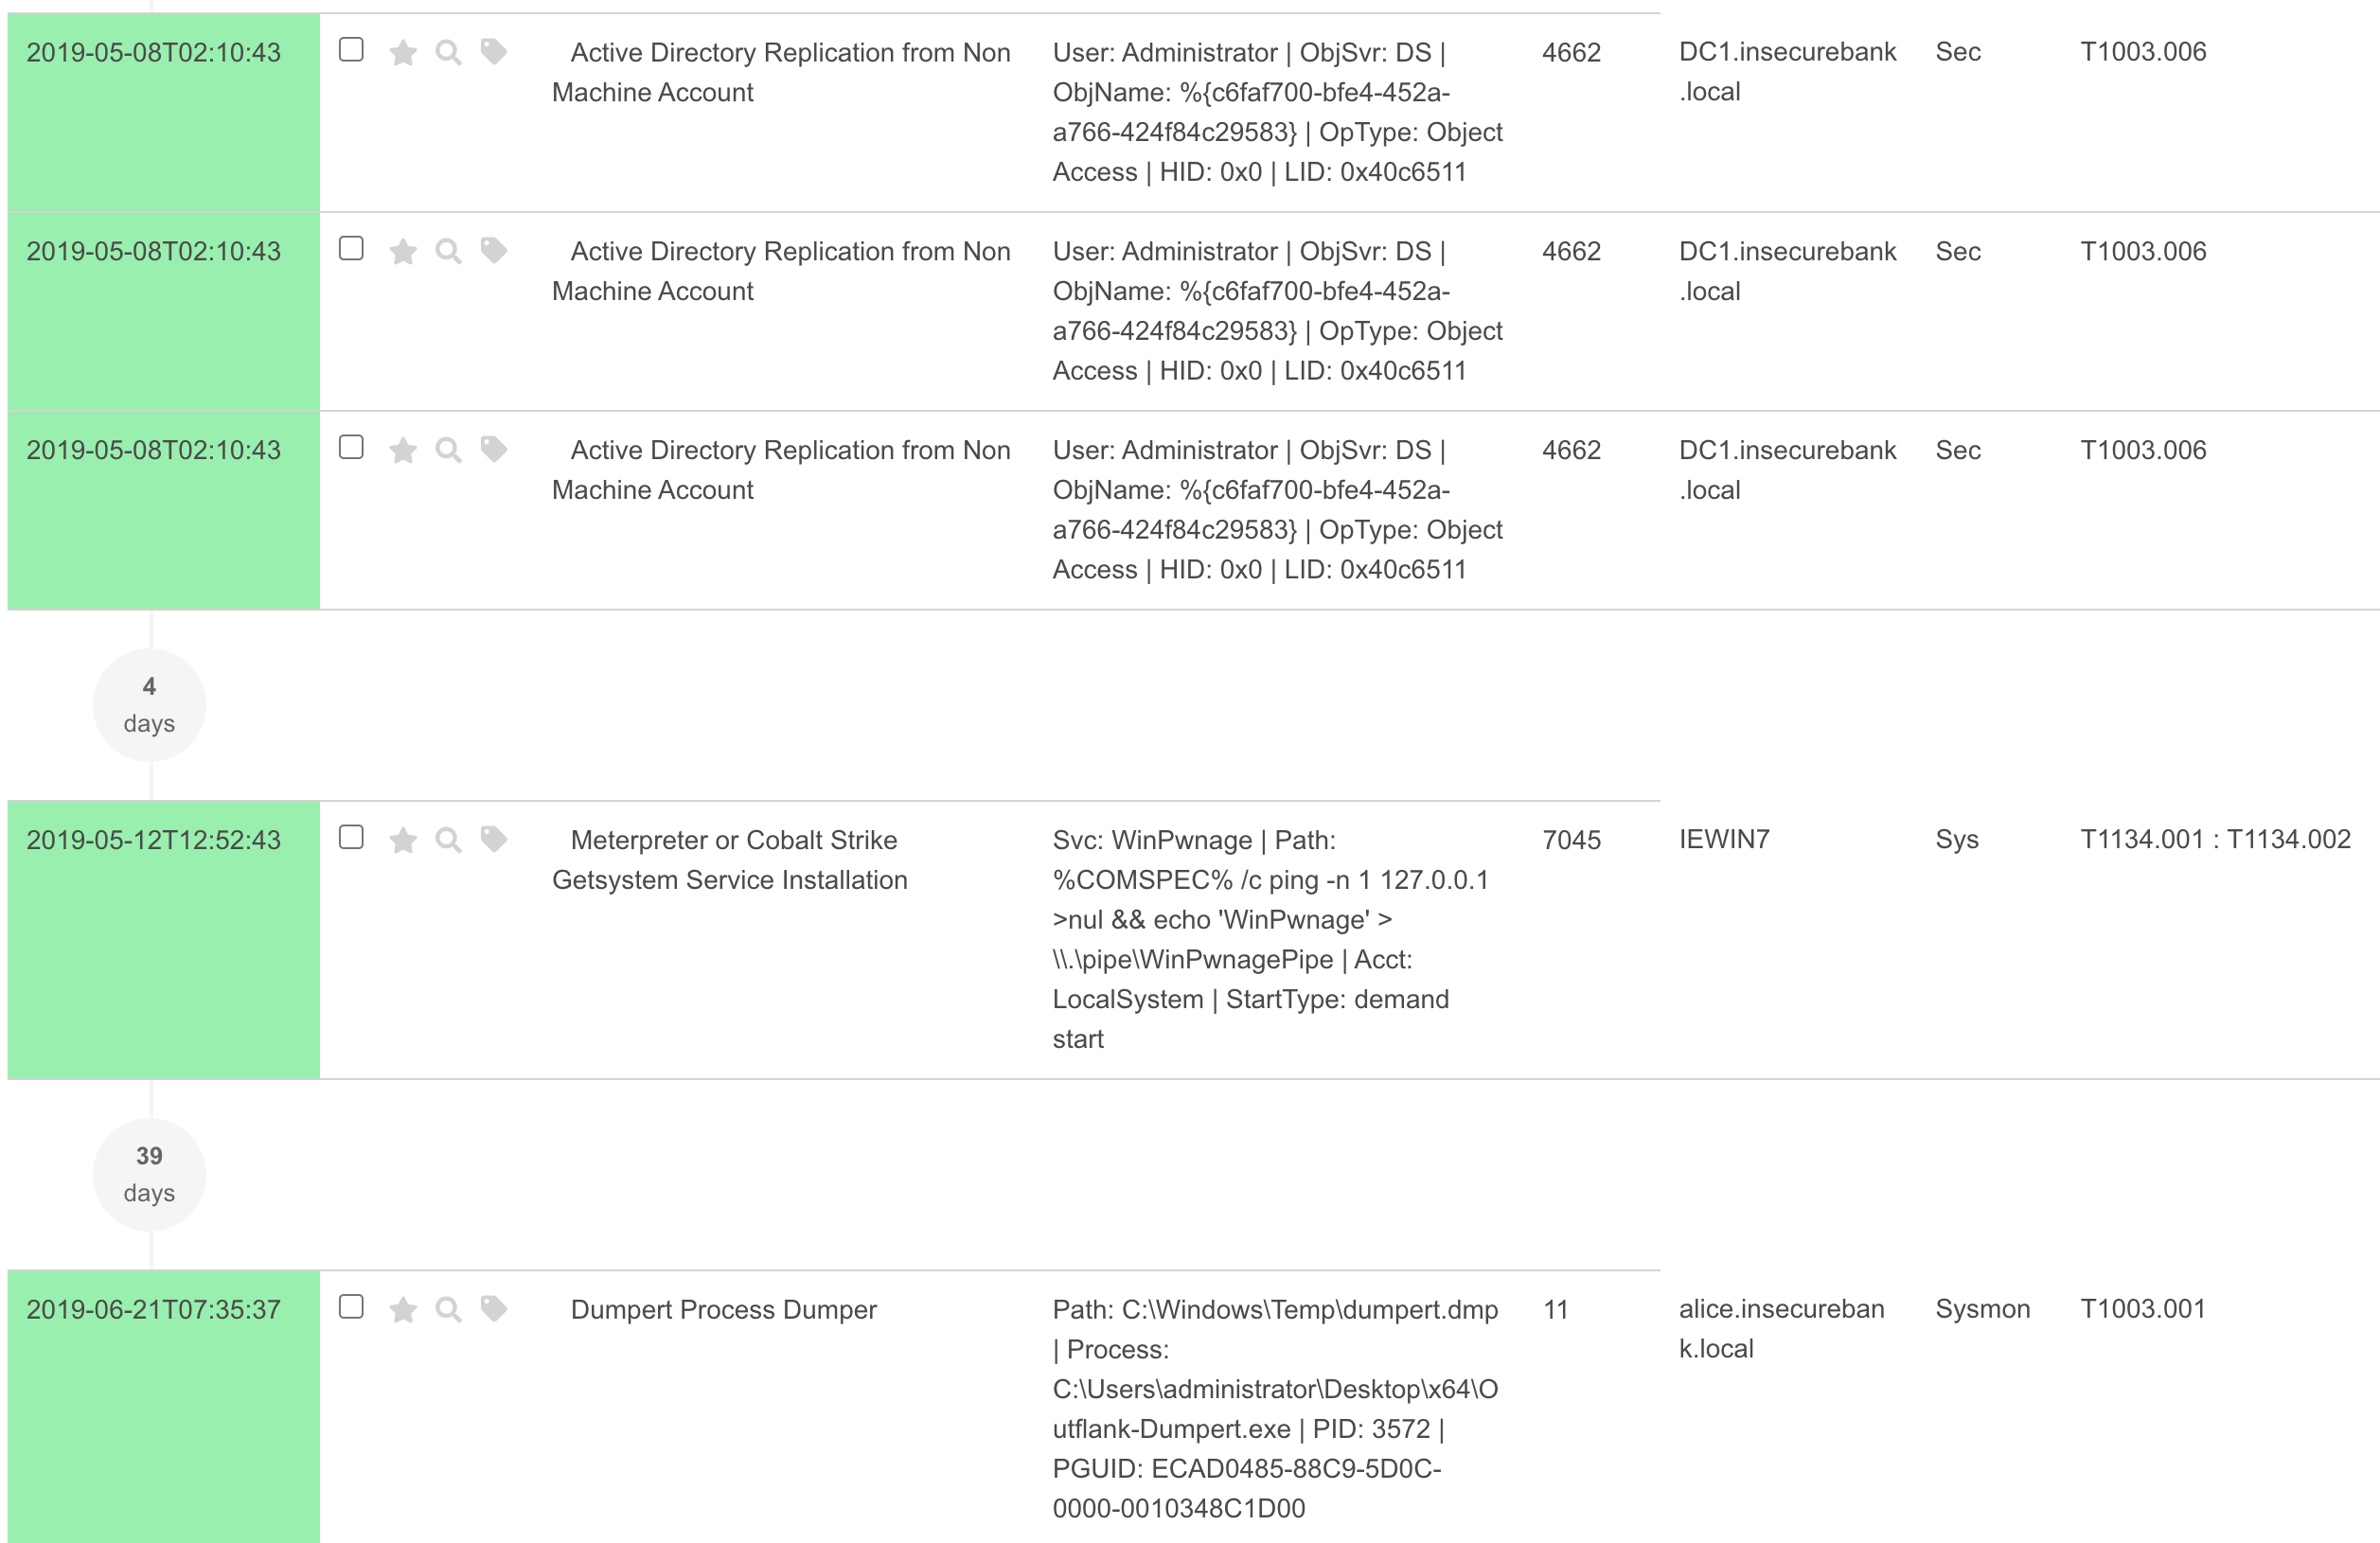
## 在 Timeline Explorer 中进行 DFIR 时间线分析
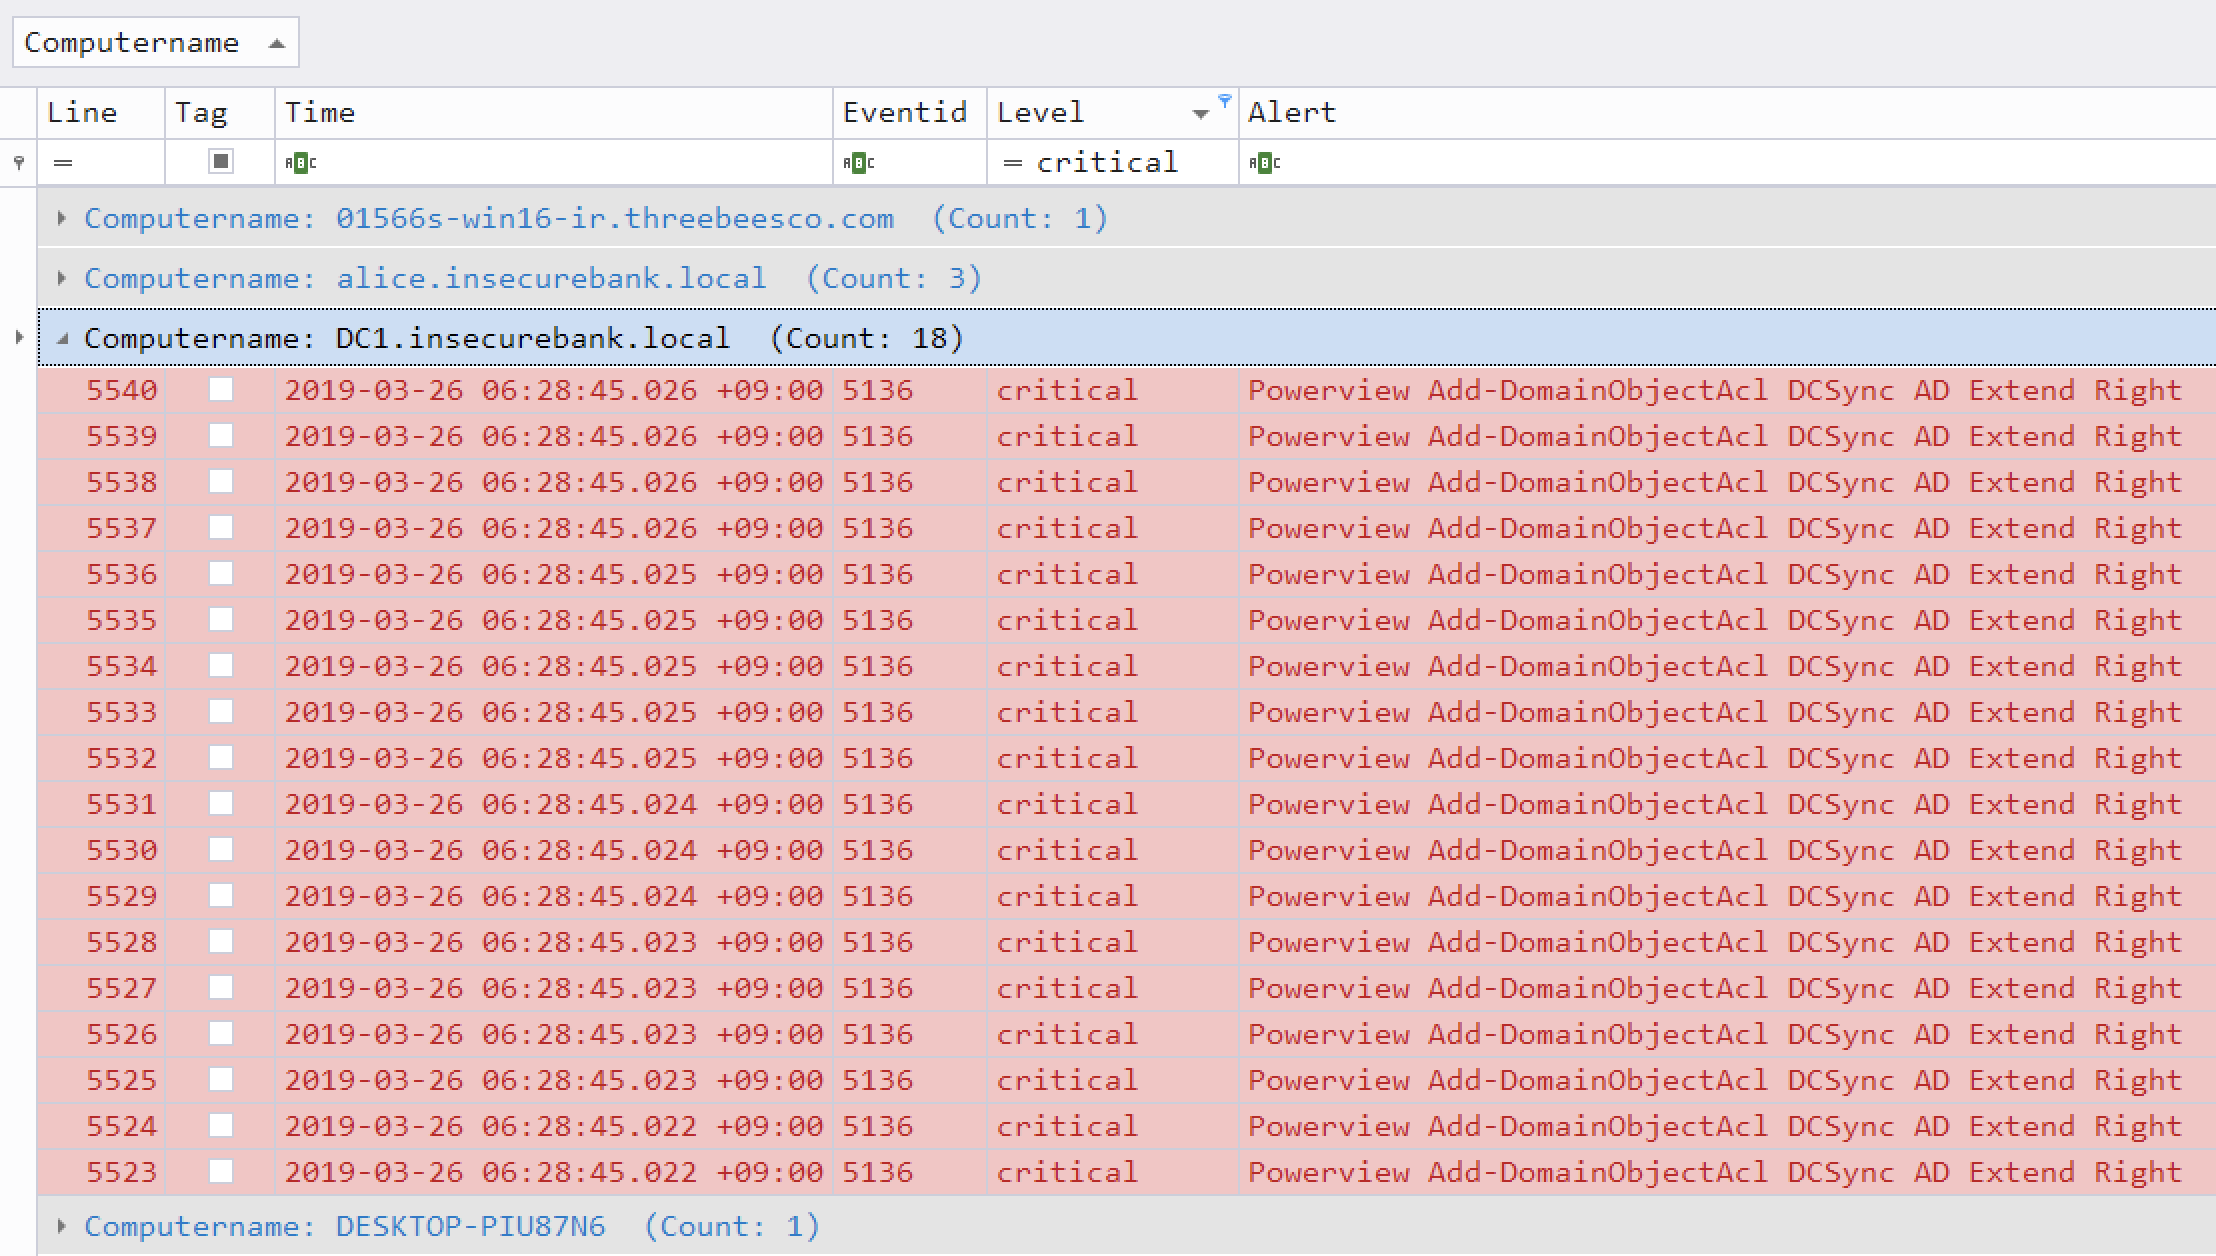
## 在 Timeline Explorer 中进行关键警报过滤和计算机分组
## 在 Timesketch 中进行分析
# 导入并分析时间线结果
您可以学习如何在 Timeline Explorer 中分析 CSV 时间线 [here](doc/TimelineExplorerAnalysis/TimelineExplorerAnalysis-English.md)。
您可以学习如何将 CSV 文件导入 Elastic Stack [here](doc/ElasticStackImport/ElasticStackImport-English.md)。
您可以学习如何将 CSV 文件导入 Timesketch [here](doc/TimesketchImport/TimesketchImport-English.md)。
# 使用 JQ 分析 JSON 格式的结果
您可以学习如何使用 `jq` 分析 JSON 格式的结果 [here](doc/AnalysisWithJQ-English.md)。
# 功能
* 跨平台支持:Windows、Linux、macOS。
* 使用 Rust 开发,确保内存安全且速度极快。
* 多线程支持,性能提升高达 5 倍。
* 为取证调查和事件响应创建单一、易于分析的时间线。
* 基于 IoC 特征进行威胁狩猎,特征编写在易于阅读/创建/编辑的基于 YML 的 hayabusa 规则中。
* 支持 Sigma 规则,可将 sigma 规则转换为 hayabusa 规则。
* 目前与其他同类工具相比,它支持最多的 sigma 规则,甚至支持计数规则和新的聚合器,如 `|equalsfield` 和 `|endswithfield`。
* 计算机指标。(对于过滤包含大量事件的特定计算机非常有用。)
* 事件 ID 指标。(对于了解有哪些类型的事件以及调整日志设置非常有用。)
* 通过排除不需要的或噪声较大的规则来进行规则调整配置。
* MITRE ATT&CK 战术映射。
* 规则级别调整。
* 创建唯一透视关键词列表,以快速识别异常用户、主机名、进程等,并关联事件。
* 输出所有字段以进行更彻底的调查。
* 成功和失败的登录摘要。
* 使用 [Velociraptor](https://docs.velociraptor.app/) 在所有端点上进行企业级威胁狩猎和 DFIR。
* 输出为 CSV、JSON/JSONL 和 HTML 摘要报告。
* 每日 Sigma 规则更新。
* 支持 JSON 格式的日志输入。
* 日志字段规范化。(将具有不同命名约定的多个字段转换为相同的字段名称。)
* 通过向 IP 地址添加 GeoIP(ASN、城市、国家/地区)信息来进行日志增强。
* 使用关键词或正则表达式搜索所有事件。
* 字段数据映射。(例如:`0xc0000234` -> `ACCOUNT LOCKED`)
* 从 evtx 剩余空间 (slack space) 中提取 evtx 记录。
* 输出时进行事件去重。(在启用恢复记录或包含备份的 evtx 文件、来自 VSS 的 evtx 文件等时非常有用。)
* 扫描设置向导,帮助更轻松地选择要启用的规则。(为了减少误报等。)
* PowerShell 经典日志字段解析和提取。
* 低内存占用。(注意:这通过不对结果进行排序来实现。最适合在代理或大数据上运行。)
* 对通道和规则进行过滤,以获得最高效的性能。
* 检测、提取并解码日志中发现的 Base64 字符串。
* 基于关键系统的警报级别调整。
# 下载
请从 [Releases](https://github.com/Yamato-Security/hayabusa/releases) 页面下载带有编译好的二进制文件的 Hayabusa 最新稳定版本,或从源代码编译。
我们为以下架构提供二进制文件:
- Linux ARM 64-bit GNU (`hayabusa-x.x.x-lin-aarch64-gnu`)
- Linux Intel 64-bit GNU (`hayabusa-x.x.x-lin-x64-gnu`)
- Linux Intel 64-bit MUSL (`hayabusa-x.x.x-lin-x64-musl`)
- macOS ARM 64-bit (`hayabusa-x.x.x-mac-aarch64`)
- macOS Intel 64-bit (`hayabusa-x.x.x-mac-x64`)
- Windows ARM 64-bit (`hayabusa-x.x.x-win-aarch64.exe`)
- Windows Intel 64-bit (`hayabusa-x.x.x-win-x64.exe`)
- Windows Intel 32-bit (`hayabusa-x.x.x-win-x86.exe`)
## Windows 实时响应包
从 v2.18.0 开始,我们提供特殊的 Windows 软件包,这些软件包使用存储在单个文件中的 XOR 编码规则,以及合并到单个文件中的所有配置文件(托管在 [hayabusa-encoded-rules repository](https://github.com/Yamato-Security/hayabusa-encoded-rules))。
只需下载名称中包含 `live-response` 的 zip 包即可。
zip 文件仅包含三个文件:Hayabusa 二进制文件、XOR 编码的规则文件和配置文件。
这些实时响应包的目的是当在客户端端点上运行 Hayabusa 时,确保 Windows Defender 等防病毒扫描程序不会对 `.yml` 规则文件产生误报。
此外,我们希望尽量减少写入系统的文件数量,以免覆盖 USN 日志等取证工件。
# Git 克隆
您可以使用以下命令 `git clone` 存储库并从源代码编译二进制文件:
**警告:** 存储库的 main 分支用于开发目的,因此您可能会访问尚未正式发布的新功能,但可能存在错误,因此请将其视为不稳定版本。
```
git clone https://github.com/Yamato-Security/hayabusa.git --recursive
```
您可以使用 `git pull --recurse-submodules` 同步 `rules` 文件夹并获取最新的 Hayabusa 规则,或者使用以下命令:
```
hayabusa.exe update-rules
```
如果更新失败,您可能需要重命名 `rules` 文件夹并重试。
# 高级:从源码编译(可选)
如果您安装了 Rust,可以使用以下命令从源代码编译:
注意:要进行编译,通常需要最新版本的 Rust。
```
cargo build --release
```
您可以从 main 分支下载最新的不稳定版本,或从 [Releases](https://github.com/Yamato-Security/hayabusa/releases) 页面下载最新的稳定版本。
请务必定期使用以下命令更新 Rust:
```
rustup update stable
```
编译后的二进制文件将输出在 `./target/release` 文件夹中。
## 更新 Rust 包
您可以在编译前更新到最新的 Rust crate:
```
cargo update
```
## 交叉编译 32 位 Windows 二进制文件
您可以使用以下命令在 64 位 Windows 系统上创建 32 位二进制文件:
```
rustup install stable-i686-pc-windows-msvc
rustup target add i686-pc-windows-msvc
rustup run stable-i686-pc-windows-msvc cargo build --release
```
## macOS 编译说明
如果您收到有关 openssl 的编译错误,则需要安装 [Homebrew](https://brew.sh/),然后安装以下包:
```
brew install pkg-config
brew install openssl
```
## Linux 编译说明
需要以下构建依赖项:
* openssl-devel (基于 Fedora) / libssl-dev (基于 Ubuntu)
* perl
* musl-gcc
## 交叉编译 Linux MUSL 二进制文件
在 Linux 操作系统上,首先安装目标。
```
rustup install stable-x86_64-unknown-linux-musl
rustup target add x86_64-unknown-linux-musl
```
使用以下命令编译:
```
cargo build --release --target=x86_64-unknown-linux-musl
```
MUSL 二进制文件将在 `./target/x86_64-unknown-linux-musl/release/` 目录中创建。
MUSL 二进制文件比 GNU 二进制文件慢约 15%,但它们在不同版本和发行版的 Linux 之间具有更好的可移植性。
# 运行 Hayabusa
## 注意:防病毒/EDR 警告和运行缓慢
在尝试运行 hayabusa 甚至只是下载 `.yml` 规则时,您可能会收到来自防病毒或 EDR 产品的警报,因为检测特征中会包含 `mimikatz` 等关键词和可疑的 PowerShell 命令。
这些是误报,因此需要在您的安全产品中配置排除项以允许 hayabusa 运行。
如果您担心恶意软件或供应链攻击,请检查 hayabusa 源代码并自行编译二进制文件。
由于 Windows Defender 的实时防护,您可能会遇到运行缓慢的情况,尤其是在重启后的第一次运行。
您可以通过暂时关闭实时防护或将 hayabusa 运行目录添加到排除项来避免这种情况。
(在执行这些操作之前,请考虑安全风险。)
## Windows
在命令提示符/PowerShell 或 Windows 终端中,只需运行相应的 32 位或 64 位 Windows 二进制文件。
### 尝试扫描路径中包含空格的文件或目录时出错
在 Windows 中使用内置的命令提示符或 PowerShell 时,如果文件或目录路径中有空格,您可能会收到 Hayabusa 无法加载任何 .evtx 文件的错误。
为了正确加载 .evtx 文件,请务必执行以下操作:
1. 用双引号括起文件或目录路径。
2. 如果是目录路径,请确保最后一个字符不包含反斜杠。
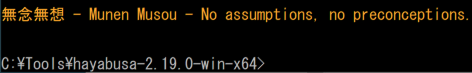
### 字符显示不正确
在 Windows 上使用默认字体 `Lucida Console` 时,徽标和表格中使用的各种字符将无法正确显示。
您应该将字体更改为 `Consalas` 以解决此问题。
这将解决除结束消息中日语字符显示之外的大部分文本渲染问题:
您有四个选项来解决此问题:
1. 使用 [Windows Terminal](https://learn.microsoft.com/en-us/windows/terminal/) 而不是命令提示符或 PowerShell。(推荐)
2. 使用 `MS Gothic` 字体。请注意,反斜杠将变为日元符号。
3. 安装 [HackGen](https://github.com/yuru7/HackGen/releases) 字体并使用 `HackGen Console NF`。
4. 使用 `-q, --quiet` 选项不显示包含日语的结束消息。
## Linux
您首先需要使二进制文件可执行。
```
chmod +x ./hayabusa
```
然后从 Hayabusa 根目录运行它:
```
./hayabusa
```
## macOS
在终端或 iTerm2 中,您首先需要使二进制文件可执行。
```
chmod +x ./hayabusa
```
然后,尝试从 Hayabusa 根目录运行它:
```
./hayabusa
```
在最新版本的 macOS 上,尝试运行时可能会收到以下安全错误:
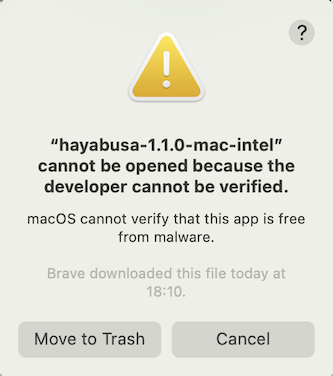
点击“取消”,然后从“系统偏好设置”中打开“安全性与隐私”,在“通用”选项卡中点击“仍要允许”。
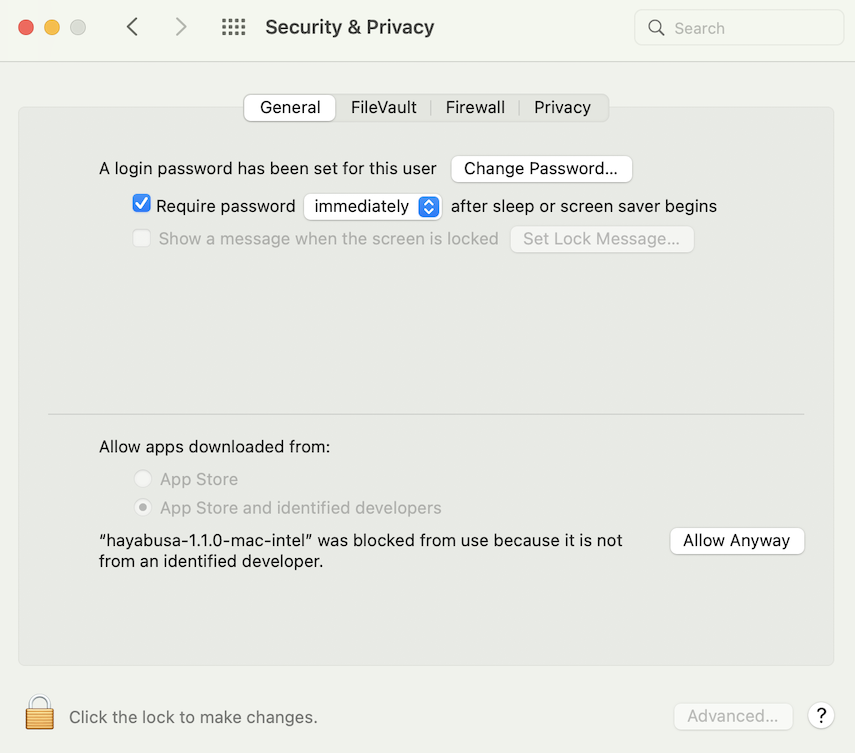
之后,再次尝试运行。
```
./hayabusa
```
将弹出以下警告,请点击“打开”。
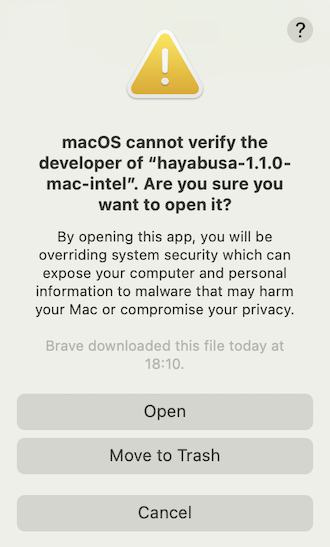
您现在应该可以运行 hayabusa 了。
# 命令列表
## 分析命令:
* `computer-metrics`:打印基于计算机名称的事件数量。
* `eid-metrics`:打印基于事件 ID 的事件数量和百分比。
* `expand-list`:从 `rules` 文件夹中提取 `expand` 占位符。
* `extract-base64`:从事件中提取并解码 base64 字符串。
* `log-metrics`:打印日志文件指标。
* `logon-summary`:打印登录事件摘要。
* `pivot-keywords-list`:打印可疑透视关键词列表。
* `search`:通过关键词或正则表达式搜索所有事件。
## 配置命令:
* `config-critical-systems`:查找域控制器和文件服务器等关键系统。
## DFIR 时间线命令:
* `csv-timeline`:以 CSV 格式保存时间线。
* `json-timeline`:以 JSON/JSONL 格式保存时间线。
* `level-tuning`:自定义调整警报的“级别” (`level`)。
* `list-profiles`:列出可用的输出配置文件。
* `set-default-profile`:更改默认配置文件。
* `update-rules`:将规则同步到 [hayabusa-rules](https://github.com/Yamato-Security/hayabusa-rules) GitHub 存储库中的最新规则。
## 通用命令:
* `help`:打印此消息或给定子命令的帮助。
* `list-contributors`:打印贡献者列表。
# 命令用法
## 分析命令
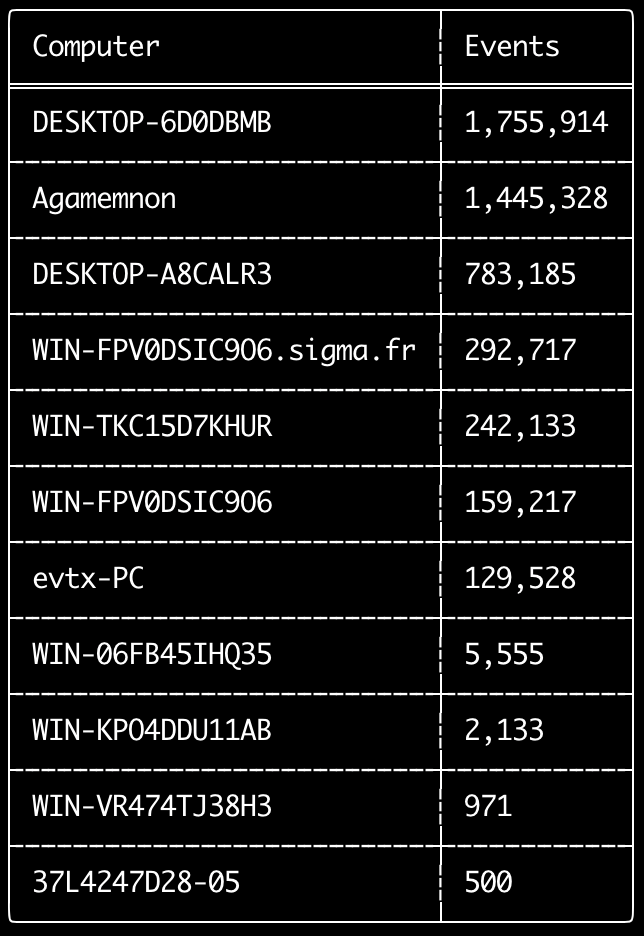
### `computer-metrics` 命令
您可以使用 `computer-metrics` 命令根据 `
` 字段中定义的每台计算机来检查有多少事件。
请注意,您不能完全依赖 `Computer` 字段来根据原始计算机分离事件。
Windows 11 在保存到事件日志时有时会使用完全不同的 `Computer` 名称。
此外,Windows 10 有时会以全小写形式记录 `Computer` 名称。
此命令不使用任何检测规则,因此将分析所有事件。
这是一个很好的命令,可以快速查看哪些计算机的日志最多。
有了这些信息,您就可以在创建时间线时使用 `--include-computer` 或 `--exclude-computer` 选项,通过根据计算机创建多个时间线或排除某些计算机的事件来提高时间线生成的效率。
```
Usage: computer-metrics [OPTIONS]
Input:
-d, --directory Directory of multiple .evtx files
-f, --file File path to one .evtx file
-l, --live-analysis Analyze the local C:\Windows\System32\winevt\Logs folder
General Options:
-C, --clobber Overwrite files when saving
-h, --help Show the help menu
-J, --JSON-input Scan JSON formatted logs instead of .evtx (.json or .jsonl)
-Q, --quiet-errors Quiet errors mode: do not save error logs
-x, --recover-records Carve evtx records from slack space (default: disabled)
-c, --rules-config Specify custom rule config directory (default: ./rules/config)
--target-file-ext Specify additional evtx file extensions (ex: evtx_data)
-t, --threads Number of threads (default: optimal number for performance)
Filtering:
--time-offset Scan recent events based on an offset (ex: 1y, 3M, 30d, 24h, 30m)
Output:
-o, --output Save the results in CSV format (ex: computer-metrics.csv)
Display Settings:
-K, --no-color Disable color output
-q, --quiet Quiet mode: do not display the launch banner
-v, --verbose Output verbose information
```
#### `computer-metrics` 命令示例
* 打印目录中的计算机名称指标:`hayabusa.exe computer-metrics -d ../logs`
* 将结果保存到 CSV 文件:`hayabusa.exe computer-metrics -d ../logs -o computer-metrics.csv`
#### `computer-metrics` 截图
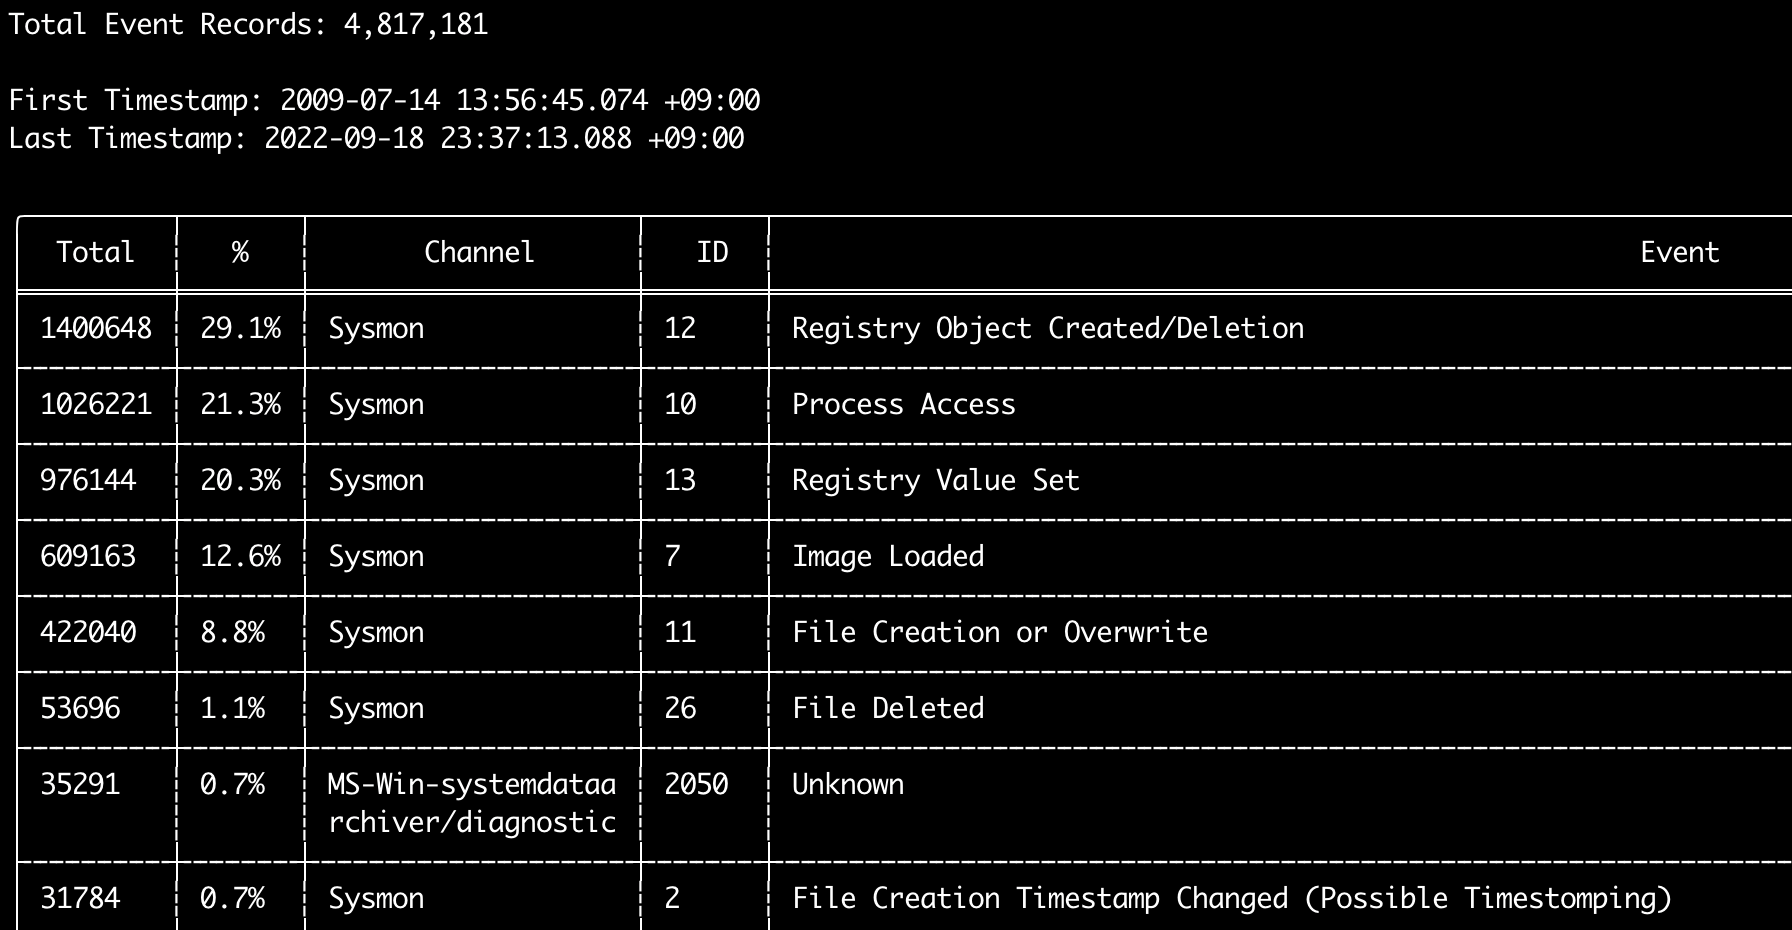
### `eid-metrics` 命令
您可以使用 `eid-metrics` 命令打印出按通道分隔的事件 ID(`` 字段)的总数和百分比。
此命令不使用任何检测规则,因此将扫描所有事件。
```
Usage: eid-metrics [OPTIONS]
Input:
-d, --directory Directory of multiple .evtx files
-f, --file File path to one .evtx file
-l, --live-analysis Analyze the local C:\Windows\System32\winevt\Logs folder
General Options:
-C, --clobber Overwrite files when saving
-h, --help Show the help menu
-J, --JSON-input Scan JSON formatted logs instead of .evtx (.json or .jsonl)
-Q, --quiet-errors Quiet errors mode: do not save error logs
-x, --recover-records Carve evtx records from slack space (default: disabled)
-c, --rules-config Specify custom rule config directory (default: ./rules/config)
-t, --threads Number of threads (default: optimal number for performance)
--target-file-ext Specify additional evtx file extensions (ex: evtx_data)
Filtering:
--exclude-computer Do not scan specified computer names (ex: ComputerA) (ex: ComputerA,ComputerB)
--include-computer Scan only specified computer names (ex: ComputerA) (ex: ComputerA,ComputerB)
--time-offset Scan recent events based on an offset (ex: 1y, 3M, 30d, 24h, 30m)
Output:
-b, --disable-abbreviations Disable abbreviations
-o, --output Save the Metrics in CSV format (ex: metrics.csv)
Display Settings:
-K, --no-color Disable color output
-q, --quiet Quiet mode: do not display the launch banner
-v, --verbose Output verbose information
Time Format:
--European-time Output timestamp in European time format (ex: 22-02-2022 22:00:00.123 +02:00)
-O, --ISO-8601 Output timestamp in original ISO-8601 format (ex: 2022-02-22T10:10:10.1234567Z) (Always UTC)
--RFC-2822 Output timestamp in RFC 2822 format (ex: Fri, 22 Feb 2022 22:00:00 -0600)
--RFC-3339 Output timestamp in RFC 3339 format (ex: 2022-02-22 22:00:00.123456-06:00)
--US-military-time Output timestamp in US military time format (ex: 02-22-2022 22:00:00.123 -06:00)
--US-time Output timestamp in US time format (ex: 02-22-2022 10:00:00.123 PM -06:00)
-U, --UTC Output time in UTC format (default: local time)
```
#### `eid-metrics` 命令示例
* 打印单个文件的事件 ID 指标:`hayabusa.exe eid-metrics -f Security.evtx`
* 打印目录的事件 ID 指标:`hayabusa.exe eid-metrics -d ../logs`
* 将结果保存到 CSV 文件:`hayabusa.exe eid-metrics -f Security.evtx -o eid-metrics.csv`
#### `eid-metrics` 命令配置文件
通道、事件 ID 和事件标题定义在 `rules/config/channel_eid_info.txt` 中。
示例:
```
Channel,EventID,EventTitle
Microsoft-Windows-Sysmon/Operational,1,Process Creation.
Microsoft-Windows-Sysmon/Operational,2,File Creation Timestamp Changed. (Possible Timestomping)
Microsoft-Windows-Sysmon/Operational,3,Network Connection.
Microsoft-Windows-Sysmon/Operational,4,Sysmon Service State Changed.
```
#### `eid-metrics` 截图
### `expand-list` 命令
从规则文件夹中提取 `expand` 占位符。
这在创建配置文件以使用任何包含 `expand` 字段修饰符的规则时非常有用。
要使用 `expand` 规则,您只需在 `./config/expand/` 目录下创建一个与 `expand` 字段修饰符同名的 `.txt` 文件,并将要检查的所有值放入该文件中。
例如,如果规则的 `detection` 逻辑是:
```
detection:
selection:
EventID: 5145
RelativeTargetName|contains: '\winreg'
filter_main:
IpAddress|expand: '%Admins_Workstations%'
condition: selection and not filter_main
```
您可以创建文本文件 `./config/expand/Admins_Workstations.txt` 并放入如下值:
```
AdminWorkstation1
AdminWorkstation2
AdminWorkstation3
```
这在本质上与检查以下逻辑相同:
```
- IpAddress: 'AdminWorkstation1'
- IpAddress: 'AdminWorkstation2'
- IpAddress: 'AdminWorkstation3'
```
如果配置文件不存在,Hayabusa 仍会加载 `expand` 规则但会忽略它。
```
Usage: expand-list [OPTIONS]
General Options:
-h, --help Show the help menu
-r, --rules Specify rule directory (default: ./rules)
Display Settings:
-K, --no-color Disable color output
-q, --quiet Quiet mode: do not display the launch banner
```
#### `expand-list` 命令示例
* 从默认 `rules` 目录中提取 `expand` 字段修饰符:`hayabusa.exe expand-list`
* 从 `sigma` 目录中提取 `expand` 字段修饰符:`hayabusa.exe eid-metrics -r ../sigma`
#### `expand-list` 结果
```
5 unique expand placeholders found:
Admins_Workstations
DC-MACHINE-NAME
Workstations
internal_domains
domain_controller_hostnames
```
### `extract-base64` 命令
此命令将从以下事件中提取 base64 字符串,对其进行解码并说明正在使用哪种编码。
* Security 4688 CommandLine
* Sysmon 1 CommandLine, ParentCommandLine
* System 7045 ImagePath
* PowerShell Operational 4104
* PowerShell Operational 4103
```
Usage: extract-base64 [OPTIONS]
Input:
-d, --directory Directory of multiple .evtx files
-f, --file File path to one .evtx file
-l, --live-analysis Analyze the local C:\Windows\System32\winevt\Logs folder
General Options:
-C, --clobber Overwrite files when saving
-h, --help Show the help menu
-J, --JSON-input Scan JSON formatted logs instead of .evtx (.json or .jsonl)
-Q, --quiet-errors Quiet errors mode: do not save error logs
-x, --recover-records Carve evtx records from slack space (default: disabled)
-c, --rules-config Specify custom rule config directory (default: ./rules/config)
-t, --threads Number of threads (default: optimal number for performance)
--target-file-ext Specify additional evtx file extensions (ex: evtx_data)
Filtering:
--exclude-computer Do not scan specified computer names (ex: ComputerA) (ex: ComputerA,ComputerB)
--include-computer Scan only specified computer names (ex: ComputerA) (ex: ComputerA,ComputerB)
--time-offset Scan recent events based on an offset (ex: 1y, 3M, 30d, 24h, 30m)
Output:
-o, --output Extract Base64 strings
Display Settings:
-K, --no-color Disable color output
-q, --quiet Quiet mode: do not display the launch banner
-v, --verbose Output verbose information
Time Format:
--European-time Output timestamp in European time format (ex: 22-02-2022 22:00:00.123 +02:00)
-O, --ISO-8601 Output timestamp in original ISO-8601 format (ex: 2022-02-22T10:10:10.1234567Z) (Always UTC)
--RFC-2822 Output timestamp in RFC 2822 format (ex: Fri, 22 Feb 2022 22:00:00 -0600)
--RFC-3339 Output timestamp in RFC 3339 format (ex: 2022-02-22 22:00:00.123456-06:00)
--US-military-time Output timestamp in US military time format (ex: 02-22-2022 22:00:00.123 -06:00)
--US-time Output timestamp in US time format (ex: 02-22-2022 10:00:00.123 PM -06:00)
-U, --UTC Output time in UTC format (default: local time)
```
#### `extract-base64` 命令示例
* 扫描目录并输出到终端:`hayabusa.exe extract-base64 -d ../hayabusa-sample-evtx`
* 扫描目录并输出到 CSV 文件:`hayabusa.exe eid-metrics -r ../sigma -o base64-extracted.csv`
#### `extract-base64` 结果
输出到终端时,由于空间有限,仅显示以下字段:
* 时间戳 (Timestamp)
* 计算机 (Computer)
* Base64 字符串 (Base64 String)
* 解码后的字符串(如果不是二进制) (Decoded String)
保存到 CSV 文件时,将保存以下字段:
* 时间戳 (Timestamp)
* 计算机 (Computer)
* Base64 字符串 (Base64 String)
* 解码后的字符串(如果不是二进制) (Decoded String)
* 原始字段 (Original Field)
* 长度 (Length)
* 二进制 (`Y/N`) (Binary)
* 双重编码(为 `Y` 时通常是恶意的) (Double Encoding)
* 编码类型 (Encoding Type)
* 文件类型 (File Type)
* 事件 (Event)
* 记录 ID (Record ID)
* 文件名 (File Name)
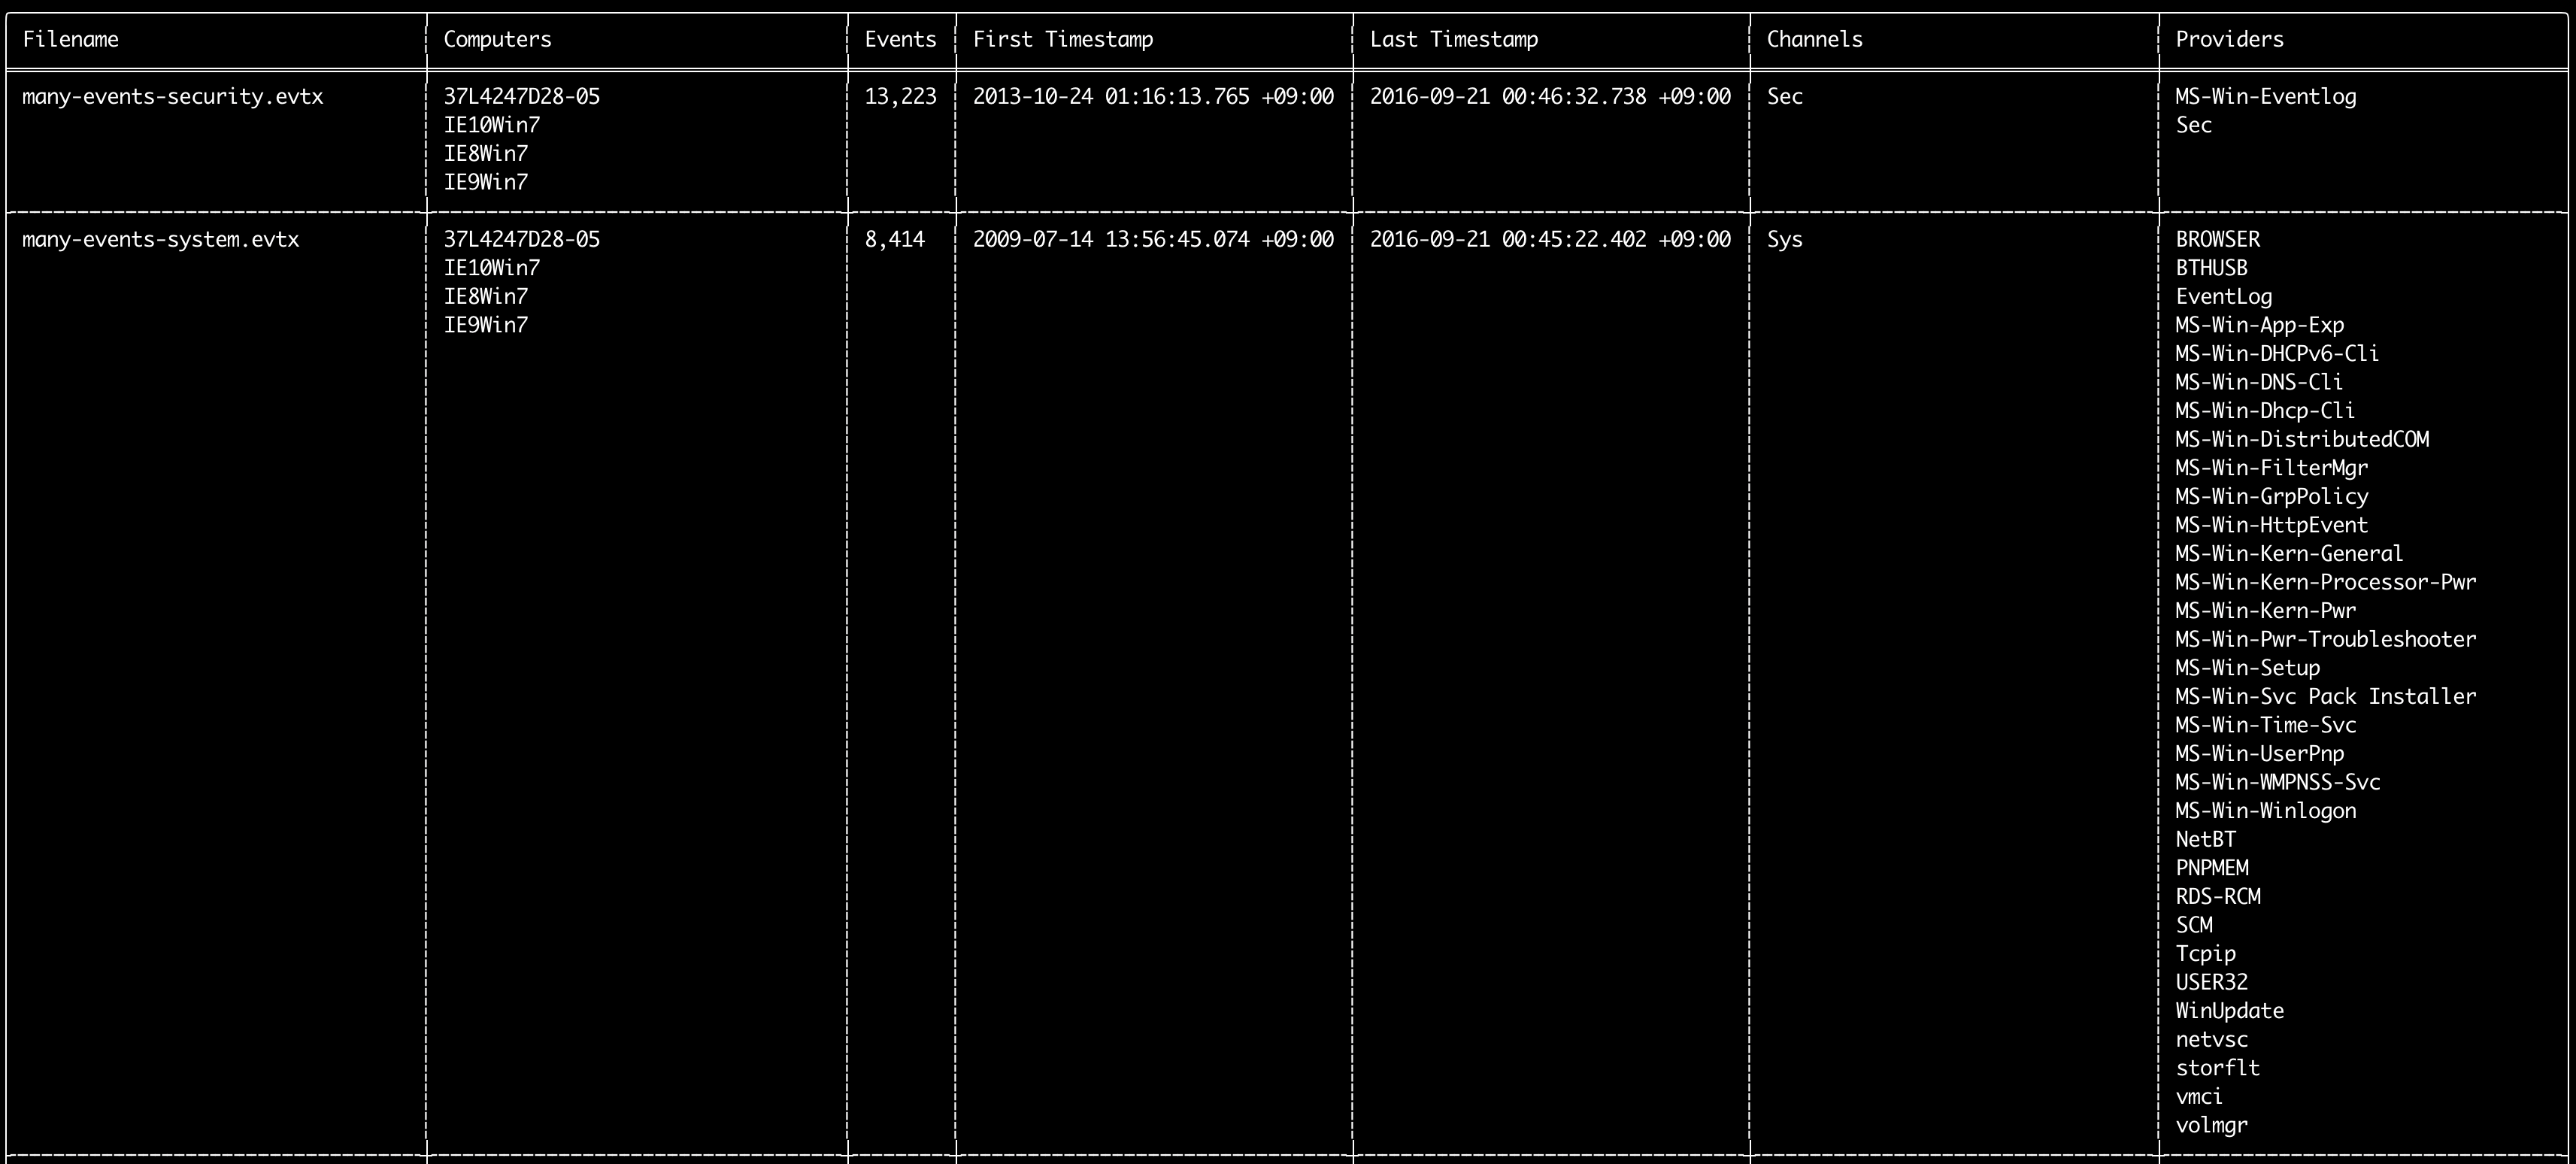
### `log-metrics` 命令
您可以使用 `log-metrics` 命令打印事件日志中的以下元数据:
* 文件名
* 计算机名称
* 事件数量
* 第一个时间戳
* 最后一个时间戳
* 通道
* 提供者
此命令不使用任何检测规则,因此将扫描所有事件。
```
Usage: log-metrics [OPTIONS]
Input:
-d, --directory Directory of multiple .evtx files
-f, --file File path to one .evtx file
-l, --live-analysis Analyze the local C:\Windows\System32\winevt\Logs folder
General Options:
-C, --clobber Overwrite files when saving
-h, --help Show the help menu
-J, --JSON-input Scan JSON formatted logs instead of .evtx (.json or .jsonl)
-Q, --quiet-errors Quiet errors mode: do not save error logs
-x, --recover-records Carve evtx records from slack space (default: disabled)
-c, --rules-config Specify custom rule config directory (default: ./rules/config)
-t, --threads Number of threads (default: optimal number for performance)
--target-file-ext Specify additional evtx file extensions (ex: evtx_data)
Filtering:
--exclude-computer Do not scan specified computer names (ex: ComputerA) (ex: ComputerA,ComputerB)
--include-computer Scan only specified computer names (ex: ComputerA) (ex: ComputerA,ComputerB)
--time-offset Scan recent events based on an offset (ex: 1y, 3M, 30d, 24h, 30m)
Output:
-b, --disable-abbreviations Disable abbreviations
-M, --multiline Output event field information in multiple rows for CSV output
-o, --output Save the Metrics in CSV format (ex: metrics.csv)
-S, --tab-separator Separate event field information by tabs
Display Settings:
-K, --no-color Disable color output
-q, --quiet Quiet mode: do not display the launch banner
-v, --verbose Output verbose information
Time Format:
--European-time Output timestamp in European time format (ex: 22-02-2022 22:00:00.123 +02:00)
-O, --ISO-8601 Output timestamp in original ISO-8601 format (ex: 2022-02-22T10:10:10.1234567Z) (Always UTC)
--RFC-2822 Output timestamp in RFC 2822 format (ex: Fri, 22 Feb 2022 22:00:00 -0600)
--RFC-3339 Output timestamp in RFC 3339 format (ex: 2022-02-22 22:00:00.123456-06:00)
--US-military-time Output timestamp in US military time format (ex: 02-22-2022 22:00:00.123 -06:00)
--US-time Output timestamp in US time format (ex: 02-22-2022 10:00:00.123 PM -06:00)
-U, --UTC Output time in UTC format (default: local time)
```
#### `log-metrics` 命令示例
* 打印单个文件的事件 ID 指标:`hayabusa.exe log-metrics -f Security.evtx`
* 打印目录的事件 ID 指标:`hayabusa.exe log-metrics -d ../logs`
* 将结果保存到 CSV 文件:`hayabusa.exe log-metrics -d ../logs -o eid-metrics.csv`
#### `log-metrics` 截图
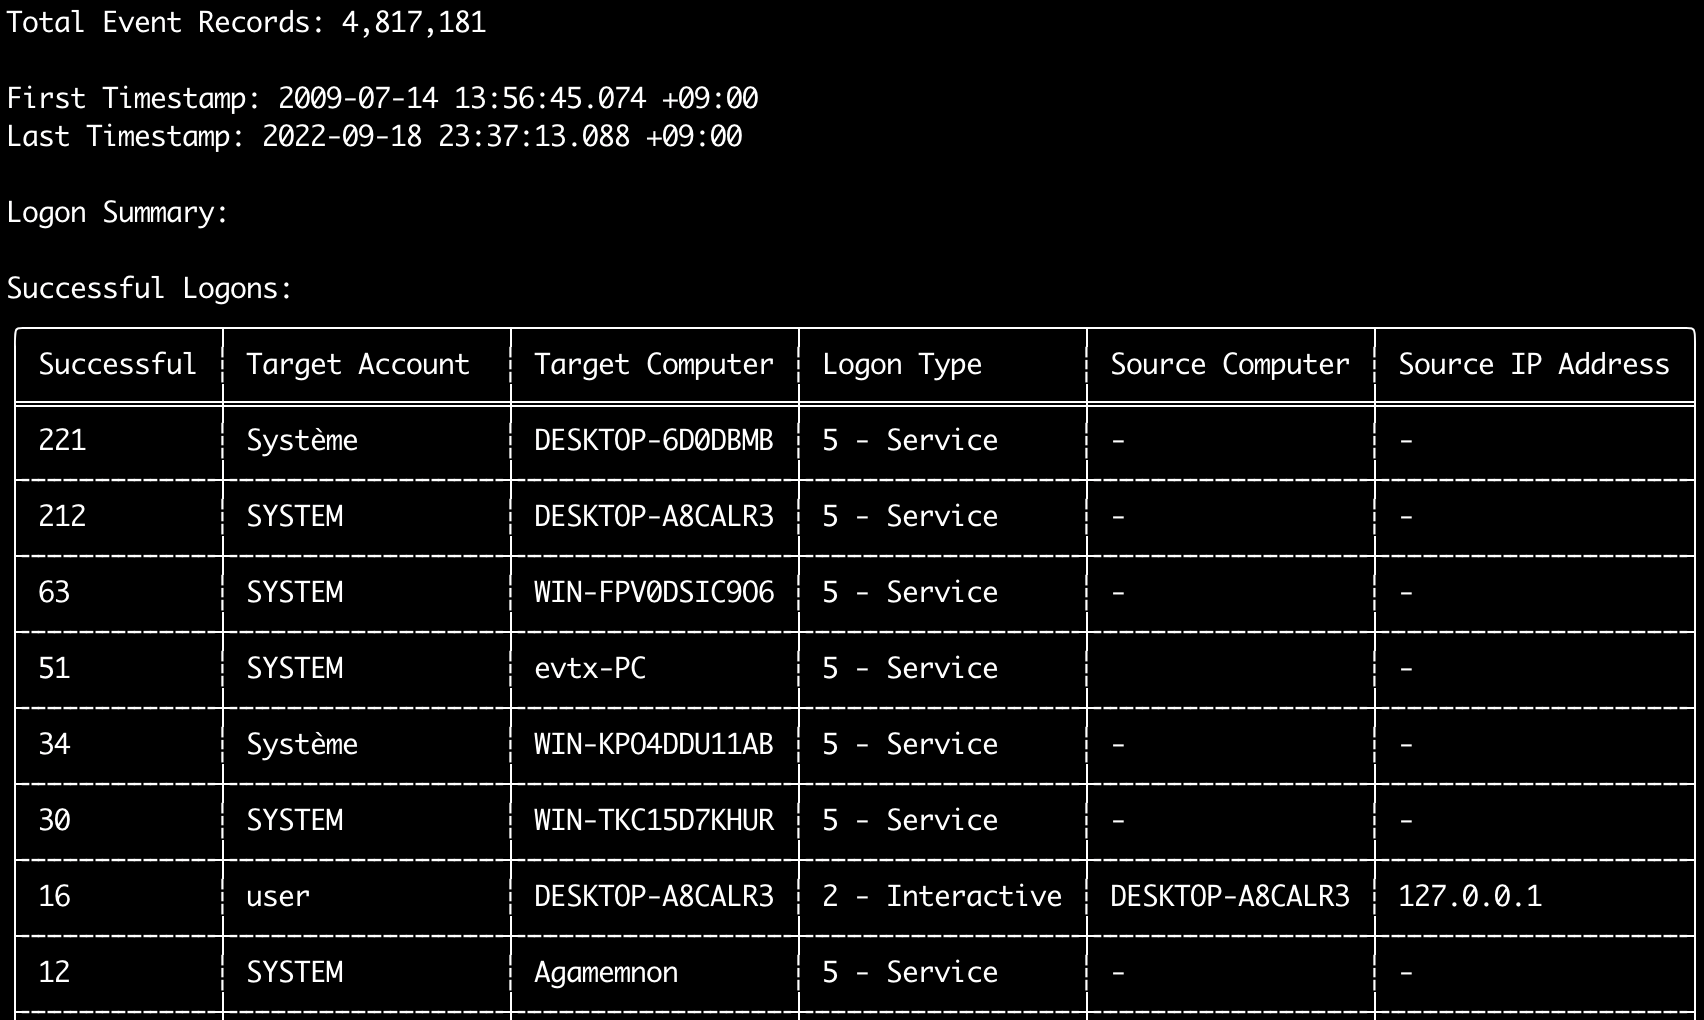
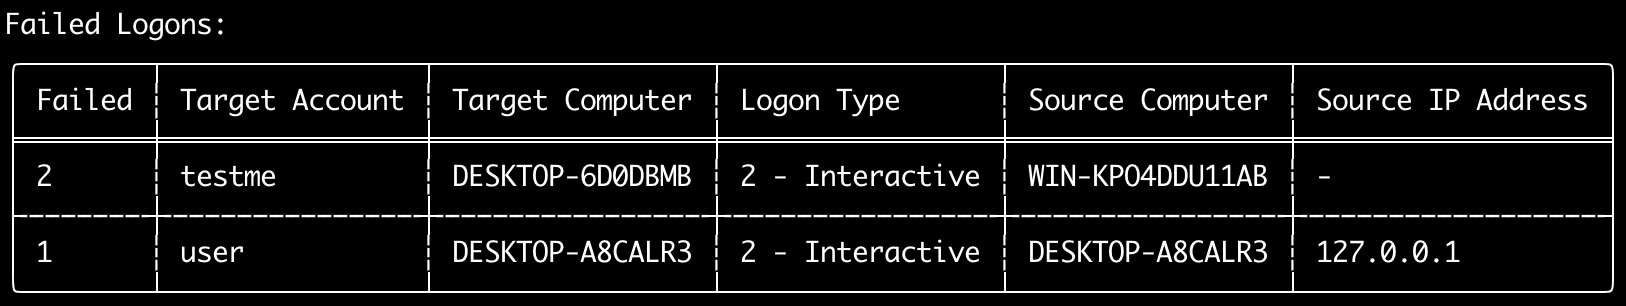
### `logon-summary` 命令
您可以使用 `logon-summary` 命令输出登录信息摘要(登录用户名以及成功和失败的登录计数)。
您可以使用 `-f` 显示一个 evtx 文件的登录信息,或使用 `-d` 选项显示多个 evtx 文件的登录信息。
成功登录取自以下事件:
* `Security 4624`(登录成功)
* `RDS-LSM 21`(远程桌面服务本地会话管理器登录)
* `RDS-GTW 302`(远程桌面服务网关登录)
失败登录取自 `Security 4625` 事件。
```
Usage: logon-summary [OPTIONS]
Input:
-d, --directory Directory of multiple .evtx files
-f, --file File path to one .evtx file
-l, --live-analysis Analyze the local C:\Windows\System32\winevt\Logs folder
General Options:
-C, --clobber Overwrite files when saving
-h, --help Show the help menu
-J, --JSON-input Scan JSON formatted logs instead of .evtx (.json or .jsonl)
-Q, --quiet-errors Quiet errors mode: do not save error logs
-x, --recover-records Carve evtx records from slack space (default: disabled)
-c, --rules-config Specify custom rule config directory (default: ./rules/config)
-t, --threads Number of threads (default: optimal number for performance)
--target-file-ext Specify additional evtx file extensions (ex: evtx_data)
Filtering:
--exclude-computer Do not scan specified computer names (ex: ComputerA) (ex: ComputerA,ComputerB)
--include-computer Scan only specified computer names (ex: ComputerA) (ex: ComputerA,ComputerB)
--time-offset Scan recent events based on an offset (ex: 1y, 3M, 30d, 24h, 30m)
--timeline-end End time of the event logs to load (ex: "2022-02-22 23:59:59 +09:00")
--timeline-start Start time of the event logs to load (ex: "2020-02-22 00:00:00 +09:00")
Output:
-o, --output Save the logon summary to two CSV files (ex: -o logon-summary)
Display Settings:
-K, --no-color Disable color output
-q, --quiet Quiet mode: do not display the launch banner
-v, --verbose Output verbose information
Time Format:
--European-time Output timestamp in European time format (ex: 22-02-2022 22:00:00.123 +02:00)
-O, --ISO-8601 Output timestamp in original ISO-8601 format (ex: 2022-02-22T10:10:10.1234567Z) (Always UTC)
--RFC-2822 Output timestamp in RFC 2822 format (ex: Fri, 22 Feb 2022 22:00:00 -0600)
--RFC-3339 Output timestamp in RFC 3339 format (ex: 2022-02-22 22:00:00.123456-06:00)
--US-military-time Output timestamp in US military time format (ex: 02-22-2022 22:00:00.123 -06:00)
--US-time Output timestamp in US time format (ex: 02-22-2022 10:00:00.123 PM -06:00)
-U, --UTC Output time in UTC format (default: local time)
```
#### `logon-summary` 命令示例
* 打印登录摘要:`hayabusa.exe logon-summary -f Security.evtx`
* 保存登录摘要结果:`hayabusa.exe logon-summary -d ../logs -o logon-summary.csv`
#### `logon-summary` 截图
### `pivot-keywords-list` 命令
您可以使用 `pivot-keywords-list` 命令创建唯一透视关键词列表,以快速识别异常用户、主机名、进程等,并关联事件。
重要提示:默认情况下,hayabusa 将返回所有事件(信息级及以上)的结果,因此我们强烈建议将 `pivot-keywords-list` 命令与 `-m, --min-level` 选项结合使用。
例如,首先仅从 `critical` 警报创建关键词(使用 `-m critical`),然后继续使用 `-m high`、`-m medium` 等。
结果中很可能会出现匹配许多正常事件的常见关键词,因此在手动检查结果并在单个文件中创建唯一关键词列表后,您可以使用类似 `grep -f keywords.txt timeline.csv` 的命令创建缩小的可疑活动时间线。
```
Usage: pivot-keywords-list [OPTIONS]
Input:
-d, --directory Directory of multiple .evtx files
-f, --file File path to one .evtx file
-l, --live-analysis Analyze the local C:\Windows\System32\winevt\Logs folder
General Options:
-C, --clobber Overwrite files when saving
-h, --help Show the help menu
-J, --JSON-input Scan JSON formatted logs instead of .evtx (.json or .jsonl)
-w, --no-wizard Do not ask questions. Scan for all events and alerts
-Q, --quiet-errors Quiet errors mode: do not save error logs
-x, --recover-records Carve evtx records from slack space (default: disabled)
-c, --rules-config Specify custom rule config directory (default: ./rules/config)
-t, --threads Number of threads (default: optimal number for performance)
--target-file-ext Specify additional evtx file extensions (ex: evtx_data)
Filtering:
-E, --EID-filter Scan only common EIDs for faster speed (./rules/config/target_event_IDs.txt)
-D, --enable-deprecated-rules Enable rules with a status of deprecated
-n, --enable-noisy-rules Enable rules set to noisy (./rules/config/noisy_rules.txt)
-u, --enable-unsupported-rules Enable rules with a status of unsupported
-e, --exact-level Only load rules with a specific level (informational, low, medium, high, critical)
--exclude-computer Do not scan specified computer names (ex: ComputerA) (ex: ComputerA,ComputerB)
--exclude-eid Do not scan specific EIDs for faster speed (ex: 1) (ex: 1,4688)
--exclude-status Do not load rules according to status (ex: experimental) (ex: stable,test)
--exclude-tag Do not load rules with specific tags (ex: sysmon)
--include-computer Scan only specified computer names (ex: ComputerA) (ex: ComputerA,ComputerB)
--include-eid Scan only specified EIDs for faster speed (ex: 1) (ex: 1,4688)
--include-status Only load rules with specific status (ex: experimental) (ex: stable,test)
--include-tag Only load rules with specific tags (ex: attack.execution,attack.discovery)
-m, --min-level Minimum level for rules to load (default: informational)
--time-offset Scan recent events based on an offset (ex: 1y, 3M, 30d, 24h, 30m)
--timeline-end End time of the event logs to load (ex: "2022-02-22 23:59:59 +09:00")
--timeline-start Start time of the event logs to load (ex: "2020-02-22 00:00:00 +09:00")
Output:
-o, --output Save pivot words to separate files (ex: PivotKeywords)
Display Settings:
-K, --no-color Disable color output
-q, --quiet Quiet mode: do not display the launch banner
-v, --verbose Output verbose information
```
#### `pivot-keywords-list` 命令示例
* 将透视关键词输出到屏幕:`hayabusa.exe pivot-keywords-list -d ../logs -m critical`
* 从关键警报中创建透视关键词列表并保存结果。(结果将保存到 `keywords-Ip Addresses.txt`、`keywords-Users.txt` 等文件):
```
hayabusa.exe pivot-keywords-list -d ../logs -m critical -o keywords`
```
#### `pivot-keywords-list` 配置文件
您可以通过编辑 `./rules/config/pivot_keywords.txt` 来自定义要搜索的关键词。
[This page](https://github.com/Yamato-Security/hayabusa-rules/blob/main/config/pivot_keywords.txt) 是默认设置。
格式为 `KeywordName.FieldName`。例如,在创建 `Users` 列表时,hayabusa 将列出 `SubjectUserName`、`TargetUserName` 和 `User` 字段中的所有值。
### `search` 命令
`search` 命令允许您对所有事件进行关键词搜索。
(不仅仅是 Hayabusa 的检测结果。)
这对于确定 Hayabusa 未检测到的事件中是否存在任何证据非常有用。
```
Usage: hayabusa.exe search <--keywords "" OR --regex ""> [OPTIONS]
Display Settings:
-K, --no-color Disable color output
-q, --quiet Quiet mode: do not display the launch banner
-v, --verbose Output verbose information
General Options:
-C, --clobber Overwrite files when saving
-h, --help Show the help menu
-Q, --quiet-errors Quiet errors mode: do not save error logs
-x, --recover-records Carve evtx records from slack space (default: disabled)
-c, --rules-config Specify custom rule config directory (default: ./rules/config)
-t, --threads Number of threads (default: optimal number for performance)
--target-file-ext Specify additional evtx file extensions (ex: evtx_data)
-s, --sort Sort results before saving the file (warning: this uses much more memory!)
Input:
-d, --directory Directory of multiple .evtx files
-f, --file File path to one .evtx file
-l, --live-analysis Analyze the local C:\Windows\System32\winevt\Logs folder
Filtering:
-a, --and-logic Search keywords with AND logic (default: OR)
-F, --filter Filter by specific field(s)
-i, --ignore-case Case-insensitive keyword search
-k, --keyword Search by keyword(s)
-r, --regex Search by regular expression
--time-offset Scan recent events based on an offset (ex: 1y, 3M, 30d, 24h, 30m)
--timeline-end End time of the event logs to load (ex: "2022-02-22 23:59:59 +09:00")
--timeline-start Start time of the event logs to load (ex: "2020-02-22 00:00:00 +09:00")
Output:
-b, --disable-abbreviations Disable abbreviations
-J, --JSON-output Save the search results in JSON format (ex: -J -o results.json)
-L, --JSONL-output Save the search results in JSONL format (ex: -L -o results.jsonl)
-M, --multiline Output event field information in multiple rows for CSV output
-o, --output Save the search results in CSV format (ex: search.csv)
-S, --tab-separator Separate event field information by tabs
Time Format:
--European-time Output timestamp in European time format (ex: 22-02-2022 22:00:00.123 +02:00)
-O, --ISO-8601 Output timestamp in original ISO-8601 format (ex: 2022-02-22T10:10:10.1234567Z) (Always UTC)
--RFC-2822 Output timestamp in RFC 2822 format (ex: Fri, 22 Feb 2022 22:00:00 -0600)
--RFC-3339 Output timestamp in RFC 3339 format (ex: 2022-02-22 22:00:00.123456-06:00)
--US-military-time Output timestamp in US military time format (ex: 02-22-2022 22:00:00.123 -06:00)
--US-time Output timestamp in US time format (ex: 02-22-2022 10:00:00.123 PM -06:00)
-U, --UTC Output time in UTC format (default: local time)
```
#### `search` 命令示例
* 在 `../hayabusa-sample-evtx` 目录中搜索关键词 `mimikatz`:
```
hayabusa.exe search -d ../hayabusa-sample-evtx -k "mimikatz"
```
* 在 `../hayabusa-sample-evtx` 目录中搜索关键词 `mimikatz` 或 `kali`:
```
hayabusa.exe search -d ../hayabusa-sample-evtx -k "mimikatz" -k "kali"
```
* 在 `../hayabusa-sample-evtx` 目录中搜索关键词 `mimikatz` 并忽略大小写:
```
hayabusa.exe search -d ../hayabusa-sample-evtx -k "mimikatz" -i
```
* 使用正则表达式在 `../hayabusa-sample-evtx` 目录中搜索 IP 地址:
```
hayabusa.exe search -d ../hayabusa-sample-evtx -r "(?:[0-9]{1,3}\.){3}[0-9]{1,3}"
```
* 搜索 `../hayabusa-sample-evtx` 目录并显示 `WorkstationName` 字段为 `kali` 的所有事件:
```
hayabusa.exe search -d ../hayabusa-sample-evtx -r ".*" -F WorkstationName:"kali"
```
#### `search` 命令配置文件
`./rules/config/channel_abbreviations.txt`:通道名称及其缩写的映射。
## 配置命令
### `config-critical-systems` 命令
此命令将自动尝试查找域控制器和文件服务器等关键系统,并将其添加到 `./config/critical_systems.txt` 配置文件中,以便所有警报的级别都将提高一级。
它将搜索 Security 4768(请求 Kerberos TGT)事件以确定其是否为域控制器。
它将搜索 Security 5145(网络共享文件访问)事件以确定其是否为文件服务器。
添加到 `critical_systems.txt` 文件的任何主机名,其所有低级别以上的警报都将提高一级,最高级别为 `emergency`。
```
Usage: hayabusa.exe config-critical-systems [OPTIONS]
Input:
-d, --directory Directory of multiple .evtx files
-f, --file File path to one .evtx file
Display Settings:
-K, --no-color Disable color output
-q, --quiet Quiet mode: do not display the launch banner
General Options:
-h, --help Show the help menu
```
#### `config-critical-systems` 命令示例
* 在 `../hayabusa-sample-evtx` 目录中搜索域控制器和文件服务器:
```
hayabusa.exe config-critical-systems -d ../hayabusa-sample-evtx"
```
## DFIR 时间线命令
### 扫描向导
`csv-timeline` 和 `json-timeline` 命令现在默认启用了扫描向导。
这旨在帮助用户根据自己的需求和偏好轻松选择要启用的检测规则。
要加载的检测规则集基于 Sigma 项目中的官方列表。
详情请参阅 [this blog post](https://blog.sigmahq.io/introducing-sigma-rule-packages-releases-76043ce42e81)。
您可以通过添加 `-w, --no-wizard` 选项轻松关闭向导并以传统方式使用 Hayabusa。
#### 核心规则 (Core Rules)
`core` 规则集启用状态为 `test` 或 `stable` 且级别为 `high` 或 `critical` 的规则。
这些是具有高置信度和相关性的高质量规则,不应产生太多误报。
规则状态为 `test` 或 `stable` 意味着超过 6 个月没有误报报告。
规则将匹配攻击者技术、通用可疑活动或恶意行为。
这与使用 `--exclude-status deprecated,unsupported,experimental --min-level high` 选项相同。
#### 核心+ 规则 (Core+ Rules)
`core+` 规则集启用状态为 `test` 或 `stable` 且级别为 `medium` 或更高的规则。
`medium` 规则通常需要额外的调整,因为可能会匹配某些应用程序、合法的用户行为或组织的脚本。
这与使用 `--exclude-status deprecated,unsupported,experimental --min-level medium` 选项相同。
#### 核心++ 规则 (Core++ Rules)
`core++` 规则集启用状态为 `experimental`、`test` 或 `stable` 且级别为 `medium` 或更高的规则。
这些规则是最前沿的。
它们针对 SigmaHQ 项目中可用的基准 evtx 文件进行了验证,并由多位检测工程师进行了审查。
除此之外,它们在最初阶段几乎未经测试。
如果您希望能够尽早检测到威胁,并愿意承担管理更高误报率的代价,请使用这些规则。
这与使用 `--exclude-status deprecated,unsupported --min-level medium` 选项相同。
#### 新兴威胁 (ET) 附加规则
`Emerging Threats (ET)` 规则集启用带有 `detection.emerging_threats` 标签的规则。
这些规则针对特定威胁,对于目前尚无太多可用信息的当前威胁特别有用。
这些规则不应有太多误报,但其相关性会随时间而降低。
不启用这些规则时,与使用 `--exclude-tag detection.emerging_threats` 选项相同。
在不使用向导的情况下传统运行 Hayabusa 时,默认会包含这些规则。
#### 威胁狩猎 (TH) 附加规则
`Threat Hunting (TH)` 规则集启用带有 `detection.threat_hunting` 标签的规则。
这些规则可能会检测到未知的恶意活动,但通常会有更多误报。
不启用这些规则时,与使用 `--exclude-tag detection.threat_hunting` 选项相同。
在不使用向导的情况下传统运行 Hayabusa 时,默认会包含这些规则。
### 基于通道的事件日志和规则过滤
从 Hayabusa v2.16.0 开始,我们在加载 `.evtx` 文件和 `.yml` 规则时启用了基于通道 (Channel) 的过滤器。
其目的是通过仅加载必要内容来使扫描尽可能高效。
虽然单个事件日志中可能存在多个提供者,但在单个 evtx 文件中包含多个通道并不常见。
(我们唯一一次看到这种情况是在有人为了 [sample-evtx](https://github.com/Yamato-Security/hayabusa-sample-evtx) 项目人为地将两个不同的 evtx 文件合并在一起时。)
我们可以利用这一点,首先检查指定扫描的每个 `.evtx` 文件第一条记录中的 `Channel` 字段。
我们还检查哪些 `.yml` 规则使用了规则 `Channel` 字段中指定的哪些通道。
通过这两个列表,我们仅加载使用 `.evtx` 文件中实际存在的通道的规则。
例如,如果用户想要扫描 `Security.evtx`,则仅使用指定 `Channel: Security` 的规则。
加载其他检测规则(例如仅在 `Application` 日志中查找事件的规则等)没有意义。
请注意,通道字段(例如 `Channel: Security`)在原始 Sigma 规则中并未**显式**定义。
对于 Sigma 规则,通道和事件 ID 字段是通过 `logsource` 下的 `service` 和 `category` 字段**隐式**定义的。(例如 `service: security`)
在 [hayabusa-rules](https://github.com/Yamato-Security/hayabusa-rules) 存储库中整理 Sigma 规则时,我们会对 `logsource` 字段进行去抽象化,并显式定义通道和事件 ID 字段。
我们在 [here](https://github.com/Yamato-Security/sigma-to-hayabusa-converter) 中深入解释了我们这样做的原因和方法。
目前,只有两条检测规则没有定义 `Channel`,旨在扫描所有 `.evtx` 文件:
- [Possible Hidden Shellcode](https://github.com/Yamato-Security/hayabusa-rules/blob/main/hayabusa/builtin/UnkwnChannEID_Med_PossibleHiddenShellcode.yml)
- [Mimikatz Use](https://github.com/SigmaHQ/sigma/blob/master/rules/windows/builtin/win_alert_mimikatz_keywords.yml)
如果您想使用这两条规则并针对加载的 `.evtx` 文件扫描所有规则,则需要在 `csv-timeline` 和 `json-timeline` 命令中添加 `-A, --enable-all-rules` 选项。
在我们的基准测试中,规则过滤通常会带来 20% 到 10 倍的性能提升,具体取决于扫描的文件,当然也会使用更少的内存。
加载 `.evtx` 文件时也会使用通道过滤。
例如,如果您指定了一条查找通道为 `Security` 的事件的规则,那么加载非 `Security` 日志的 `.evtx` 文件就没有意义。
在我们的基准测试中,这在正常扫描中带来了约 10% 的速度提升,在使用单条规则扫描时性能提升高达 60% 以上。
如果您确定在单个 `.evtx` 文件中使用了多个通道(例如有人使用工具将多个 `.evtx` 文件合并在一起),那么您可以在 `csv-timeline` 和 `json-timeline` 命令中使用 `-a, --scan-all-evtx-files` 选项禁用此过滤。
### `csv-timeline` 命令
`csv-timeline` 命令将以 CSV 格式创建事件的取证时间线。
```
Usage: csv-timeline [OPTIONS]
Input:
-d, --directory Directory of multiple .evtx files
-f, --file File path to one .evtx file
-l, --live-analysis Analyze the local C:\Windows\System32\winevt\Logs folder
General Options:
-C, --clobber Overwrite files when saving
-h, --help Show the help menu
-J, --JSON-input Scan JSON formatted logs instead of .evtx (.json or .jsonl)
-w, --no-wizard Do not ask questions. Scan for all events and alerts
-Q, --quiet-errors Quiet errors mode: do not save error logs
-x, --recover-records Carve evtx records from slack space (default: disabled)
-r, --rules Specify a custom rule directory or file (default: ./rules)
-c, --rules-config Specify custom rule config directory (default: ./rules/config)
-s, --sort Sort events before saving the file. (warning: this uses much more memory!)
-t, --threads Number of threads (default: optimal number for performance)
--target-file-ext Specify additional evtx file extensions (ex: evtx_data)
Filtering:
-E, --EID-filter Scan only common EIDs for faster speed (./rules/config/target_event_IDs.txt)
-A, --enable-all-rules Enable all rules regardless of loaded evtx files (disable channel filter for rules)
-D, --enable-deprecated-rules Enable rules with a status of deprecated
-n, --enable-noisy-rules Enable rules set to noisy (./rules/config/noisy_rules.txt)
-u, --enable-unsupported-rules Enable rules with a status of unsupported
-e, --exact-level Only load rules with a specific level (informational, low, medium, high, critical)
--exclude-category Do not load rules with specified logsource categories (ex: process_creation,pipe_created)
--exclude-computer Do not scan specified computer names (ex: ComputerA) (ex: ComputerA,ComputerB)
--exclude-eid Do not scan specific EIDs for faster speed (ex: 1) (ex: 1,4688)
--exclude-status Do not load rules according to status (ex: experimental) (ex: stable,test)
--exclude-tag Do not load rules with specific tags (ex: sysmon)
--include-category Only load rules with specified logsource categories (ex: process_creation,pipe_created)
--include-computer Scan only specified computer names (ex: ComputerA) (ex: ComputerA,ComputerB)
--include-eid Scan only specified EIDs for faster speed (ex: 1) (ex: 1,4688)
--include-status Only load rules with specific status (ex: experimental) (ex: stable,test)
--include-tag Only load rules with specific tags (ex: attack.execution,attack.discovery)
-m, --min-level Minimum level for rules to load (default: informational)
-P, --proven-rules Scan with only proven rules for faster speed (./rules/config/proven_rules.txt)
-a, --scan-all-evtx-files Scan all evtx files regardless of loaded rules (disable channel filter for evtx files)
--time-offset Scan recent events based on an offset (ex: 1y, 3M, 30d, 24h, 30m)
--timeline-end End time of the event logs to load (ex: "2022-02-22 23:59:59 +09:00")
--timeline-start Start time of the event logs to load (ex: "2020-02-22 00:00:00 +09:00")
Output:
-b, --disable-abbreviations Disable abbreviations
-G, --GeoIP Add GeoIP (ASN, city, country) info to IP addresses
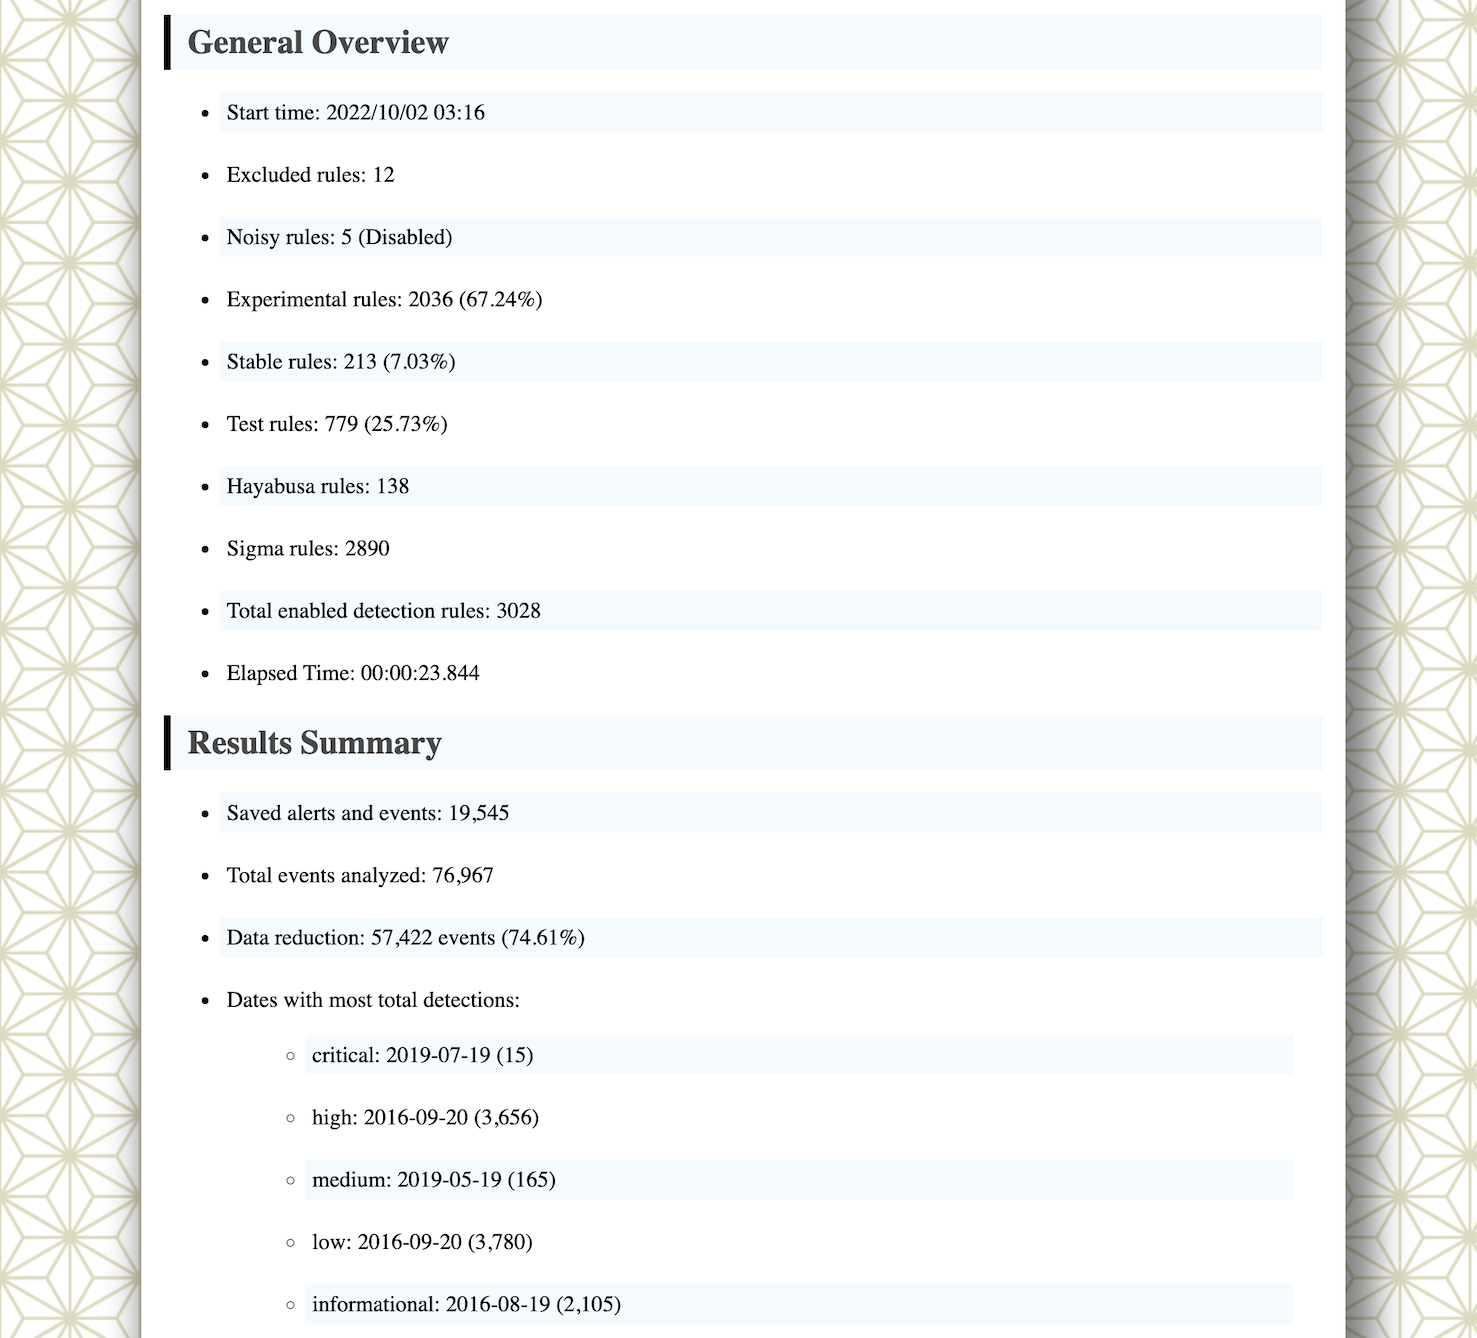
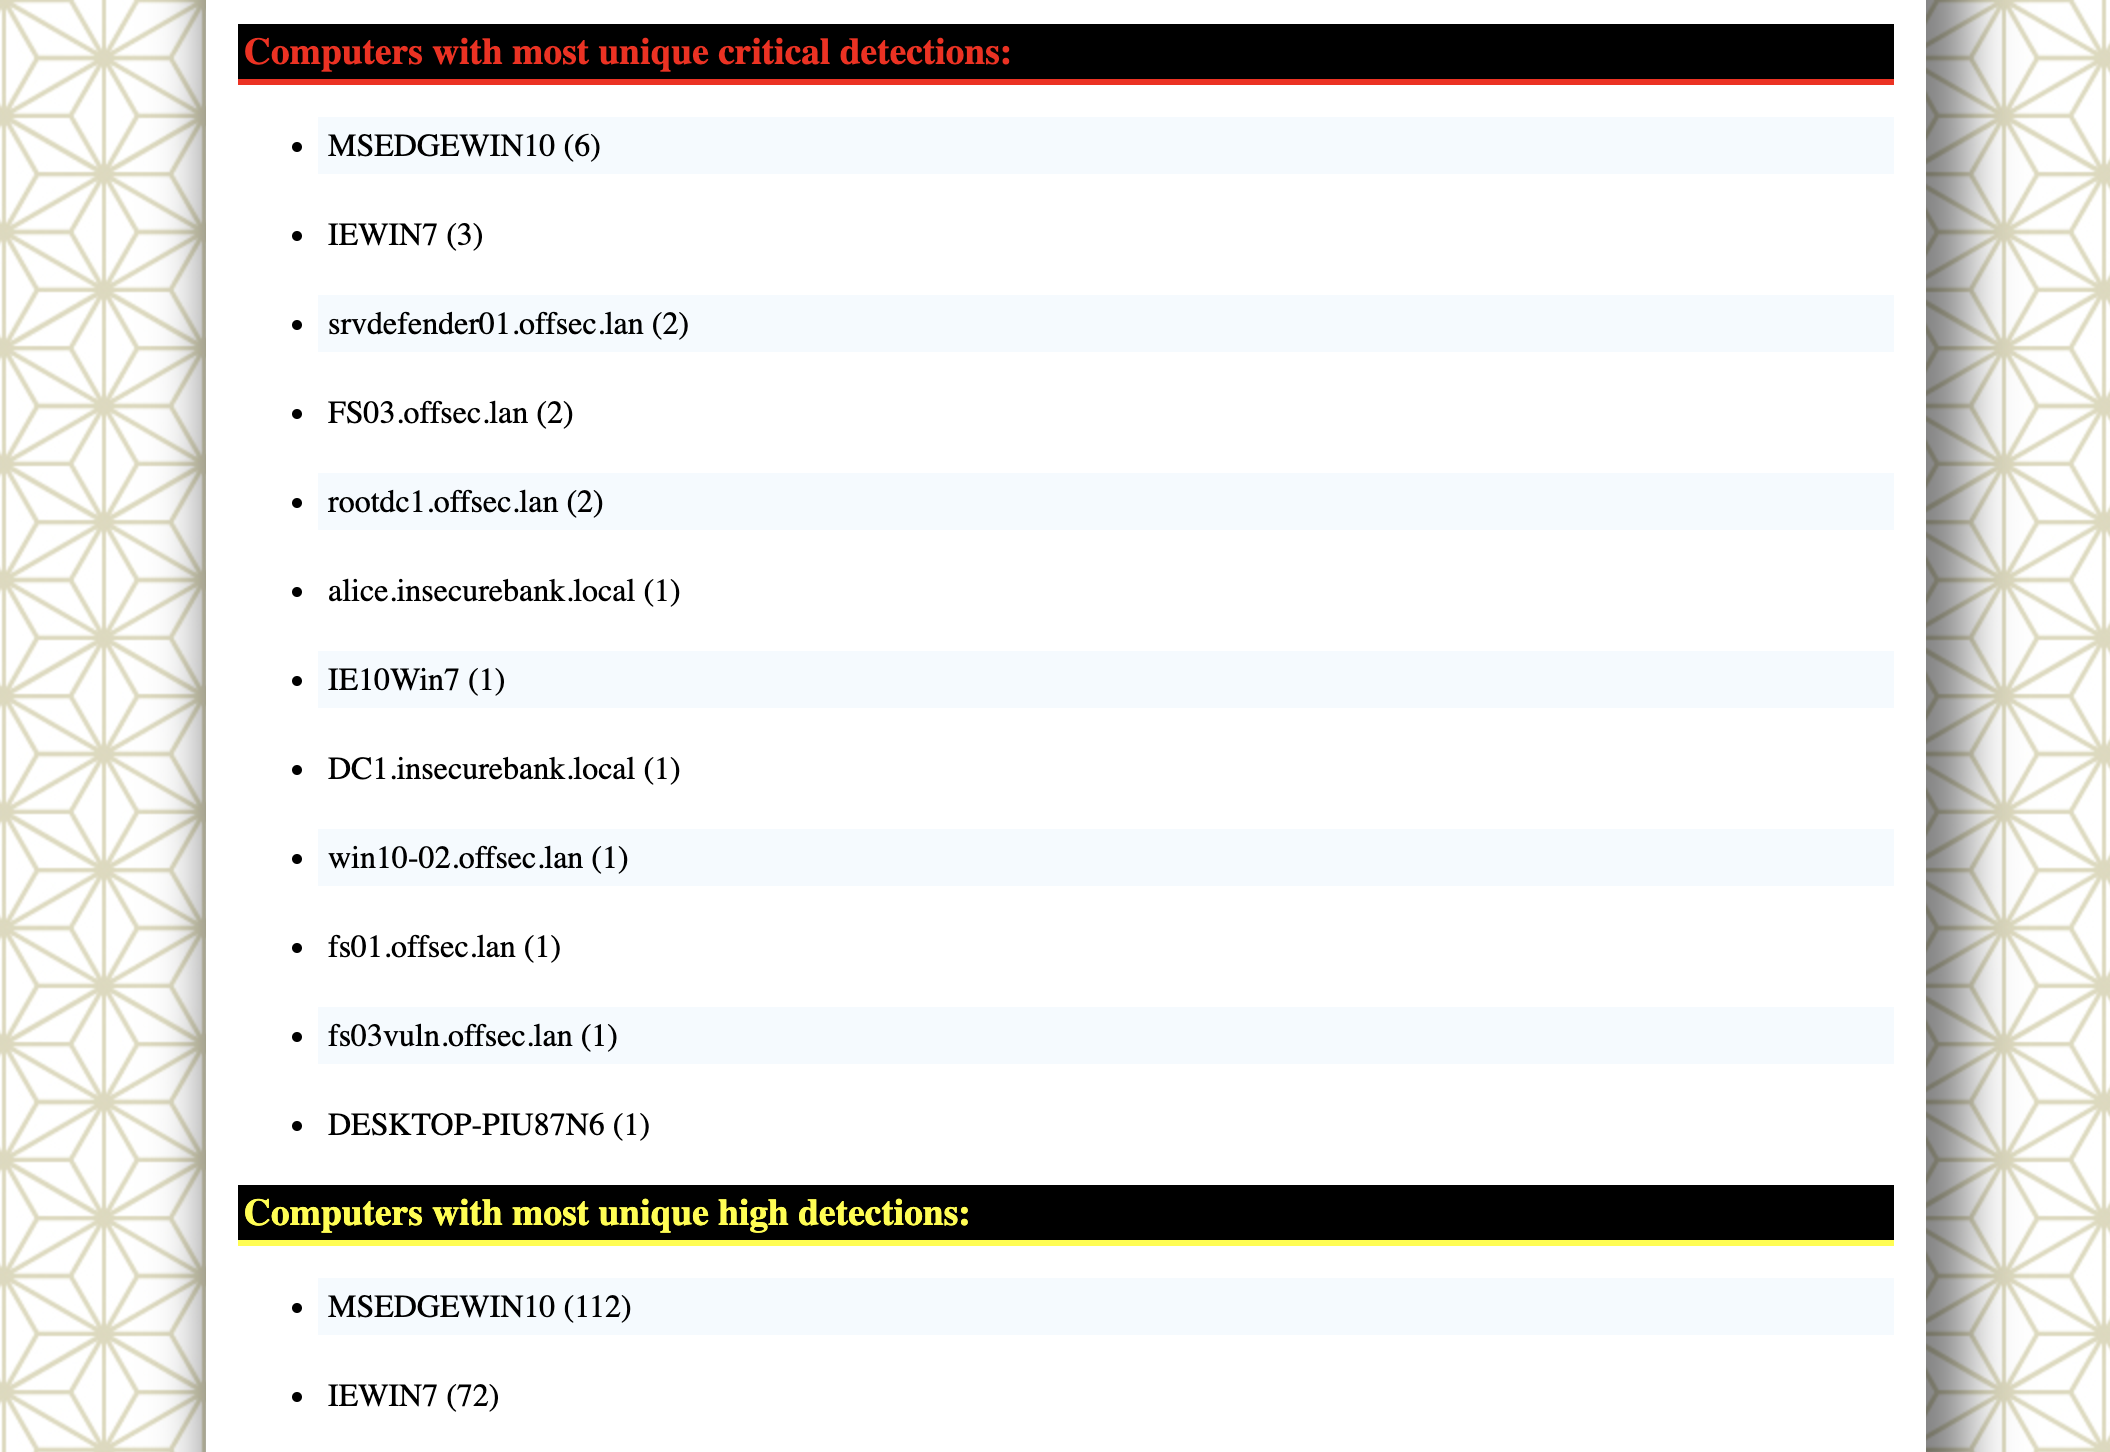
-H, --HTML-report Save Results Summary details to an HTML report (ex: results.html)
-M, --multiline Output event field information in multiple rows
-F, --no-field-data-mapping Disable field data mapping
--no-pwsh-field-extraction Disable field extraction of PowerShell classic logs
-o, --output Save the timeline in CSV format (ex: results.csv)
-p, --profile Specify output profile
-R, --remove-duplicate-data Duplicate field data will be replaced with "DUP"
-X, --remove-duplicate-detections Remove duplicate detections (default: disabled)
-S, --tab-separator Separate event field information by tabs
Display Settings:
-K, --no-color Disable color output
-N, --no-summary Do not display Results Summary for faster speed
-q, --quiet Quiet mode: do not display the launch banner
-v, --verbose Output verbose information
-T, --visualize-timeline Output event frequency timeline (terminal needs to support unicode)
Time Format:
--European-time Output timestamp in European time format (ex: 22-02-2022 22:00:00.123 +02:00)
-O, --ISO-8601 Output timestamp in original ISO-8601 format (ex: 2022-02-22T10:10:10.1234567Z) (Always UTC)
--RFC-2822 Output timestamp in RFC 2822 format (ex: Fri, 22 Feb 2022 22:00:00 -0600)
--RFC-3339 Output timestamp in RFC 3339 format (ex: 2022-02-22 22:00:00.123456-06:00)
--US-military-time Output timestamp in US military time format (ex: 02-22-2022 22:00:00.123 -06:00)
--US-time Output timestamp in US time format (ex: 02-22-2022 10:00:00.123 PM -06:00)
-U, --UTC Output time in UTC format (default: local time)
```
#### `csv-timeline` 命令示例
* 使用默认的 `standard` 配置文件对一个 Windows 事件日志文件运行 hayabusa:
```
hayabusa.exe csv-timeline -f eventlog.evtx
```
* 使用 verbose 配置文件对包含多个 Windows 事件日志文件的 sample-evtx 目录运行 hayabusa:
```
hayabusa.exe csv-timeline -d .\hayabusa-sample-evtx -p verbose
```
* 导出到单个 CSV 文件,以便使用 LibreOffice、Timeline Explorer、Elastic Stack 等进行进一步分析,并包含所有字段信息(警告:使用 `super-verbose` 配置文件,您的文件输出大小将变得大得多!):
```
hayabusa.exe csv-timeline -d .\hayabusa-sample-evtx -o results.csv -p super-verbose
```
* 启用 EID(事件 ID)过滤器:
```
hayabusa.exe csv-timeline -E -d .\hayabusa-sample-evtx -o results.csv
```
* 仅运行 hayabusa 规则(默认运行 `-r .\rules` 中的所有规则):
```
hayabusa.exe csv-timeline -d .\hayabusa-sample-evtx -r .\rules\hayabusa -o results.csv -w
```
* 仅针对 Windows 默认启用的日志运行 hayabusa 规则:
```
hayabusa.exe csv-timeline -d .\hayabusa-sample-evtx -r .\rules\hayabusa\builtin -o results.csv -w
```
* 仅针对 sysmon 日志运行 hayabusa 规则:
```
hayabusa.exe csv-timeline -d .\hayabusa-sample-evtx -r .\rules\hayabusa\sysmon -o results.csv -w
```
* 仅运行 sigma 规则:
```
hayabusa.exe csv-timeline -d .\hayabusa-sample-evtx -r .\rules\sigma -o results.csv -w
```
* 启用已弃用的规则(`status` 标记为 `deprecated` 的规则)和噪声较大的规则(规则 ID 列在 `.\rules\config\noisy_rules.txt` 中的规则):
```
hayabusa.exe csv-timeline -d .\hayabusa-sample-evtx --enable-noisy-rules --enable-deprecated-rules -o results.csv -w
```
* 仅运行分析登录的规则并以 UTC 时区输出:
```
hayabusa.exe csv-timeline -d .\hayabusa-sample-evtx -r .\rules\hayabusa\builtin\Security\LogonLogoff\Logon -U -o results.csv -w
```
* 在实时 Windows 机器上运行(需要管理员权限)并仅检测警报(潜在的恶意行为):
```
hayabusa.exe csv-timeline -l -m low
```
* 打印详细信息(对于确定哪些文件处理时间较长、解析错误等非常有用):
```
hayabusa.exe csv-timeline -d .\hayabusa-sample-evtx -v
```
* 详细输出示例:
加载规则:
```
Loaded rule: rules/sigma/builtin/deprecated/proc_creation_win_susp_run_folder.yml
Loaded rule: rules/sigma/builtin/deprecated/proc_creation_win_execution_mssql_xp_cmdshell_stored_procedure.yml
Loaded rule: rules/sigma/builtin/deprecated/proc_creation_win_susp_squirrel_lolbin.yml
Loaded rule: rules/sigma/builtin/win_alert_mimikatz_keywords.yml
```
扫描期间的错误:
```
[ERROR] Failed to parse event file.
EventFile: ../logs/Microsoft-Rdms-UI%4Operational.evtx
Error: Failed to parse record number 58471
[ERROR] Failed to parse event file.
EventFile: ../logs/Microsoft-Rdms-UI%4Operational.evtx
Error: Failed to parse record number 58470
[ERROR] Failed to parse event file.
EventFile: ../logs/Microsoft-Windows-AppxPackaging%4Operational.evtx
Error: An error occurred while trying to serialize binary xml to output.
```
* 输出为兼容导入 [Timesketch](https://timesketch.org/) 的 CSV 格式:
```
hayabusa.exe csv-timeline -d ../hayabusa-sample-evtx --RFC-3339 -o timesketch-import.csv -p timesketch -U
```
* 静默错误模式:
默认情况下,hayabusa 会将错误消息保存到错误日志文件中。
如果您不想保存错误消息,请添加 `-Q`。
#### 高级 - GeoIP 日志增强
您可以使用免费的 GeoLite2 地理位置数据向 SrcIP(源 IP)字段和 TgtIP(目标 IP)字段添加 GeoIP(ASN 组织、城市和国家/地区)信息。
步骤:
1. 首先注册一个 MaxMind 账户 [here](https://dev.maxmind.com/geoip/geolite2-free-geolocation-data)。
2. 从 [download page](https://www.maxmind.com/en/accounts/current/geoip/downloads) 下载三个 `.mmdb` 文件并将其保存到一个目录中。文件名应为 `GeoLite2-ASN.mmdb`、`GeoLite2-City.mmdb` 和 `GeoLite2-Country.mmdb`。
3. 运行 `csv-timeline` 或 `json-timeline` 命令时,添加 `-G` 选项,后跟包含 MaxMind 数据库的目录。
* 使用 `csv-timeline` 时,将额外输出以下 6 列:`SrcASN`、`SrcCity`、`SrcCountry`、`TgtASN`、`TgtCity`、`TgtCountry`。
* 使用 `json-timeline` 时,相同的 `SrcASN`、`SrcCity`、`SrcCountry`、`TgtASN`、`TgtCity`、`TgtCountry` 字段将添加到 `Details` 对象中,但仅当它们包含信息时。
* 当 `SrcIP` 或 `TgtIP` 为本地主机(`127.0.0.1`、`::1` 等)时,`SrcASN` 或 `TgtASN` 将输出为 `Local`。
* 当 `SrcIP` 或 `TgtIP` 为私有 IP 地址(`10.0.0.0/8`、`fe80::/10` 等)时,`SrcASN` 或 `TgtASN` 将输出为 `Private`。
##### GeoIP 配置文件
在 GeoIP 数据库中查找的包含源和目标 IP 地址的字段名称定义在 `rules/config/geoip_field_mapping.yaml` 中。
如有必要,您可以添加到此列表中。
此文件中还有一个过滤器部分,用于确定从哪些事件中提取 IP 地址信息。
##### GeoIP 数据库自动更新
MaxMind GeoIP 数据库每 2 周更新一次。
您可以安装 MaxMind `geoipupdate` 工具 [here](https://github.com/maxmind/geoipupdate) 以自动更新这些数据库。
macOS 上的步骤:
1. `brew install geoipupdate`
2. 编辑 `/usr/local/etc/GeoIP.conf` 或 `/opt/homebrew/etc/GeoIP.conf`:放入您在登录 MaxMind 网站后创建的 `AccountID` 和 `LicenseKey`。确保 `EditionIDs` 行显示 `EditionIDs GeoLite2-ASN GeoLite2-City GeoLite2-Country`。
3. 运行 `geoipupdate`。
4. 当您想要添加 GeoIP 信息时,添加 `-G /usr/local/var/GeoIP` 或 `-G /opt/homebrew/var/GeoIP`。
Windows 上的步骤:
1. 从 [Releases](https://github.com/maxmind/geoipupdate/releases) 页面下载最新的 Windows 二进制文件(例如 `geoipupdate_4.10.0_windows_amd64.zip`)。
2. 编辑 `\ProgramData\MaxMind/GeoIPUpdate\GeoIP.conf`:放入您在登录 MaxMind 网站后创建的 `AccountID` 和 `LicenseKey`。确保 `EditionIDs` 行显示 `EditionIDs GeoLite2-ASN GeoLite2-City GeoLite2-Country`。
3. 运行 `geoipupdate` 可执行文件。
#### `csv-timeline` 命令配置文件
`./rules/config/channel_abbreviations.txt`:通道名称及其缩写的映射。
`./rules/config/default_details.txt`:如果规则中未指定 `details:` 行,则应输出哪些默认字段信息(`%Details%` 字段)的配置文件。
这是基于提供者名称和事件 ID 的。
`./rules/config/eventkey_alias.txt`:此文件包含字段的短名称别名及其原始较长字段名称的映射。
示例:
```
InstanceID,Event.UserData.UMDFHostDeviceArrivalBegin.InstanceId
IntegrityLevel,Event.EventData.IntegrityLevel
IpAddress,Event.EventData.IpAddress
```
如果此处未定义字段,Hayabusa 将自动在 `Event.EventData` 下检查该字段。
`./rules/config/exclude_rules.txt`:此文件包含将排除使用的规则 ID 列表。
通常是因为一条规则替换了另一条规则,或者该规则根本无法使用。
与防火墙和 IDS 一样,任何基于特征的工具都需要进行一些调整以适应您的环境,因此您可能需要永久或临时排除某些规则。
您可以将规则 ID(例如:`4fe151c2-ecf9-4fae-95ae-b88ec9c2fca6`)添加到 `./rules/config/exclude_rules.txt` 中,以忽略任何您不需要或无法使用的规则。
`./rules/config/noisy_rules.txt`:此文件包含默认禁用的规则 ID 列表,但可以通过使用 `-n, --enable-noisy-rules` 选项启用噪声规则来启用。
这些规则通常由于其性质或误报而产生较多噪声。
`./rules/config/target_event_IDs.txt`:如果启用了 EID 过滤器,则仅扫描此文件中指定的事件 ID。
默认情况下,Hayabusa 将扫描所有事件,但如果您想提高性能,请使用 `-E, --EID-filter` 选项。
这通常会带来 10~25% 的速度提升。
### `json-timeline` 命令
`json-timeline` 命令将以 JSON 或 JSONL 格式创建事件的取证时间线。
输出为 JSONL 将比 JSON 速度更快且文件更小,如果您只是要将结果导入到 Elastic Stack 等其他工具中,这将非常有用。
如果您要使用文本编辑器手动分析结果,JSON 会更好。
CSV 输出适用于将较小的时间线(通常小于 2GB)导入 LibreOffice 或 Timeline Explorer 等工具。
JSON 最适合使用 `jq` 等工具对数据进行更详细的分析(包括大型结果文件),因为 `Details` 字段是分开的,以便于分析。
(在 CSV 输出中,所有事件日志字段都在一个大的 `Details` 列中,这使得数据排序等变得更加困难。)
```
Usage: json-timeline [OPTIONS]
Input:
-d, --directory Directory of multiple .evtx files
-f, --file File path to one .evtx file
-l, --live-analysis Analyze the local C:\Windows\System32\winevt\Logs folder
General Options:
-C, --clobber Overwrite files when saving
-h, --help Show the help menu
-J, --JSON-input Scan JSON formatted logs instead of .evtx (.json or .jsonl)
-w, --no-wizard Do not ask questions. Scan for all events and alerts
-Q, --quiet-errors Quiet errors mode: do not save error logs
-x, --recover-records Carve evtx records from slack space (default: disabled)
-r, --rules Specify a custom rule directory or file (default: ./rules)
-c, --rules-config Specify custom rule config directory (default: ./rules/config)
-s, --sort Sort events before saving the file. (warning: this uses much more memory!)
-t, --threads Number of threads (default: optimal number for performance)
--target-file-ext Specify additional evtx file extensions (ex: evtx_data)
Filtering:
-E, --EID-filter Scan only common EIDs for faster speed (./rules/config/target_event_IDs.txt)
-A, --enable-all-rules Enable all rules regardless of loaded evtx files (disable channel filter for rules)
-D, --enable-deprecated-rules Enable rules with a status of deprecated
-n, --enable-noisy-rules Enable rules set to noisy (./rules/config/noisy_rules.txt)
-u, --enable-unsupported-rules Enable rules with a status of unsupported
-e, --exact-level Only load rules with a specific level (informational, low, medium, high, critical)
--exclude-category Do not load rules with specified logsource categories (ex: process_creation,pipe_created)
--exclude-computer Do not scan specified computer names (ex: ComputerA) (ex: ComputerA,ComputerB)
--exclude-eid Do not scan specific EIDs for faster speed (ex: 1) (ex: 1,4688)
--exclude-status Do not load rules according to status (ex: experimental) (ex: stable,test)
--exclude-tag Do not load rules with specific tags (ex: sysmon)
--include-category Only load rules with specified logsource categories (ex: process_creation,pipe_created)
--include-computer Scan only specified computer names (ex: ComputerA) (ex: ComputerA,ComputerB)
--include-eid Scan only specified EIDs for faster speed (ex: 1) (ex: 1,4688)
--include-status Only load rules with specific status (ex: experimental) (ex: stable,test)
--include-tag Only load rules with specific tags (ex: attack.execution,attack.discovery)
-m, --min-level Minimum level for rules to load (default: informational)
-P, --proven-rules Scan with only proven rules for faster speed (./rules/config/proven_rules.txt)
-a, --scan-all-evtx-files Scan all evtx files regardless of loaded rules (disable channel filter for evtx files)
--time-offset Scan recent events based on an offset (ex: 1y, 3M, 30d, 24h, 30m)
--timeline-end End time of the event logs to load (ex: "2022-02-22 23:59:59 +09:00")
--timeline-start Start time of the event logs to load (ex: "2020-02-22 00:00:00 +09:00")
Output:
-b, --disable-abbreviations Disable abbreviations
-G, --GeoIP Add GeoIP (ASN, city, country) info to IP addresses
-H, --HTML-report Save Results Summary details to an HTML report (ex: results.html)
-L, --JSONL-output Save the timeline in JSONL format (ex: -L -o results.jsonl)
-F, --no-field-data-mapping Disable field data mapping
--no-pwsh-field-extraction Disable field extraction of PowerShell classic logs
-o, --output Save the timeline in JSON format (ex: results.json)
-p, --profile Specify output profile
-R, --remove-duplicate-data Duplicate field data will be replaced with "DUP"
-X, --remove-duplicate-detections Remove duplicate detections (default: disabled)
Display Settings:
-K, --no-color Disable color output
-N, --no-summary Do not display Results Summary for faster speed
-q, --quiet Quiet mode: do not display the launch banner
-v, --verbose Output verbose information
-T, --visualize-timeline Output event frequency timeline (terminal needs to support unicode)
Time Format:
--European-time Output timestamp in European time format (ex: 22-02-2022 22:00:00.123 +02:00)
-O, --ISO-8601 Output timestamp in original ISO-8601 format (ex: 2022-02-22T10:10:10.1234567Z) (Always UTC)
--RFC-2822 Output timestamp in RFC 2822 format (ex: Fri, 22 Feb 2022 22:00:00 -0600)
--RFC-3339 Output timestamp in RFC 3339 format (ex: 2022-02-22 22:00:00.123456-06:00)
--US-military-time Output timestamp in US military time format (ex: 02-22-2022 22:00:00.123 -06:00)
--US-time Output timestamp in US time format (ex: 02-22-2022 10:00:00.123 PM -06:00)
-U, --UTC Output time in UTC format (default: local time)
```
#### `json-timeline` 命令示例和配置文件
`json-timeline` 的选项和配置文件与 `csv-timeline` 相同,但多了一个选项 `-L, --JSONL-output` 用于输出为 JSONL 格式。
### `level-tuning` 命令
`level-tuning` 命令允许您调整规则的警报级别,根据您的需要提高或降低风险级别。
此命令使用配置文件来覆盖 `rules` 文件夹中规则的风险级别(`level` 字段)。
```
Usage: level-tuning [OPTIONS]
Display Settings:
-K, --no-color Disable color output
-q, --quiet Quiet mode: do not display the launch banner
General Options:
-f, --file Tune alert levels (default: ./rules/config/level_tuning.txt)
-h, --help Show the help menu
```
#### `level-tuning` 命令示例
* 正常用法:`hayabusa.exe level-tuning`
* 基于您的自定义配置文件调整规则警报级别:`hayabusa.exe level-tuning -f ./config/level_tuning.txt`
#### `level-tuning` 配置文件
Hayabusa 和 Sigma 规则作者在编写规则时会评估警报的适当风险级别。
然而,有时风险级别并不一致,而且实际风险级别可能会根据您的环境而有所不同。
Yamato Security 在 `./rules/config/level_tuning.txt` 提供并维护了一个配置文件,您也可以使用它来调整您的规则。
`./rules/config/level_tuning.txt` 示例:
```
id,new_level
570ae5ec-33dc-427c-b815-db86228ad43e,informational # 'Application Uninstalled' - Originally low.
b6ce0b2f-593b-5e1c-e137-d30b2974e30e,high # 'Suspicious Double Extension File Execution' - Sysmon 1 - Originally critical
452b2159-5e6e-c494-63b9-b385d6195f58,high # 'Suspicious Double Extension File Execution' - Security 4688 - Originally critical
51ba8477-86a4-6ff0-35fa-7b7f1b1e3f83,high # 'CobaltStrike Service Installations - System' - System 7045 - Originally critical
daad2203-665f-294c-6d2f-f9272c3214f2,critical # 'Mimikatz DC Sync' - Security 4662 - Originally high
8b061ac2-31c7-659d-aa1b-36ceed1b03f1,high # 'HackTool - Rubeus Execution' - Sysmon 1 - Originally critical
be670d5c-31eb-7391-4d2e-d122c89cd5bb,high # 'HackTool - Rubeus Execution' - Security 4688 - Originally critical
```
在这种情况下,规则目录中 `id` 为 `570ae5ec-33dc-427c-b815-db86228ad43e` 的规则的风险级别将重写为 `informational`。
可以设置的级别有 `critical`、`high`、`medium`、`low` 和 `informational`。
### `list-profiles` 命令
```
Usage: list-profiles [OPTIONS]
Display Settings:
-K, --no-color Disable color output
-q, --quiet Quiet mode: do not display the launch banner
General Options:
-h, --help Show the help menu
```
### `set-default-profile` 命令
```
Usage: set-default-profile [OPTIONS]
Display Settings:
-K, --no-color Disable color output
-q, --quiet Quiet mode: do not display the launch banner
General Options:
-h, --help Show the help menu
-p, --profile Specify output profile
```
#### `set-default-profile` 命令示例
* 将默认配置文件设置为 `minimal`:`hayabusa.exe set-default-profile minimal`
* 将默认配置文件设置为 `super-verbose`:`hayabusa.exe set-default-profile super-verbose`
### `update-rules` 命令
`update-rules` 命令将 `rules` 文件夹与 [Hayabusa rules github repository](https://github.com/Yamato-Security/hayabusa-rules) 同步,更新规则和配置文件。
```
Usage: update-rules [OPTIONS]
Display Settings:
-K, --no-color Disable color output
-q, --quiet Quiet mode: do not display the launch banner
General Options:
-h, --help Show the help menu
-r, --rules Specify a custom rule directory or file (default: ./rules)
```
#### `update-rules` 命令示例
您通常只需执行此操作:`hayabusa.exe update-rules`
# 时间线输出
## 输出配置文件
Hayabusa 在 `config/profiles.yaml` 中有 8 个预定义的输出配置文件可供使用:
1. `minimal`
2. `standard`(默认)
3. `verbose`
4. `all-field-info`
5. `all-field-info-verbose`
6. `super-verbose`
7. `timesketch-minimal`
8. `timesketch-verbose`
您可以通过编辑此文件轻松自定义或添加自己的配置文件。
您还可以使用 `set-default-profile --profile ` 轻松更改默认配置文件。
使用 `list-profiles` 命令显示可用的配置文件及其字段信息。
### 1. `minimal` 配置文件输出
`%Timestamp%, %Computer%, %Channel%, %EventID%, %Level%, %RecordID%, %RuleTitle%, %Details%`
### 2. `standard` 配置文件输出
`%Timestamp%, %Computer%, %Channel%, %EventID%, %Level%, %RecordID%, %RuleTitle%, %Details%, %ExtraFieldInfo%, %RuleID%`
### 3. `verbose` 配置文件输出
`%Timestamp%, %Computer%, %Channel%, %EventID%, %Level%, %MitreTactics%, %MitreTags%, %OtherTags%, %RecordID%, %RuleTitle%, %Details%, %ExtraFieldInfo%, %RuleFile%, %RuleID%, %EvtxFile%`
### 4. `all-field-info` 配置文件输出
不输出最小的 `details` 信息,而是输出 `EventData` 和 `UserData` 部分中的所有字段信息以及它们的原始字段名称。
`%Timestamp%, %Computer%, %Channel%, %EventID%, %Level%, %RecordID%, %RuleTitle%, %AllFieldInfo%, %RuleFile%, %RuleID%, %EvtxFile%`
### 5. `all-field-info-verbose` 配置文件输出
`%Timestamp%, %Computer%, %Channel%, %EventID%, %Level%, %MitreTactics%, %MitreTags%, %OtherTags%, %RecordID%, %RuleTitle%, %AllFieldInfo%, %RuleFile%, %RuleID%, %EvtxFile%`
### 6. `super-verbose` 配置文件输出
`%Timestamp%, %Computer%, %Channel%, %EventID%, %Level%, %RuleTitle%, %RuleAuthor%, %RuleModifiedDate%, %Status%, %RecordID%, %Details%, %ExtraFieldInfo%, %MitreTactics%, %MitreTags%, %OtherTags%, %Provider%, %RuleCreationDate%, %RuleFile%, %RuleID%, %EvtxFile%`
### 7. `timesketch-minimal` 配置文件输出
输出为兼容导入 [Timesketch](https://timesketch.org/) 的格式。
`%Timestamp%, hayabusa, %RuleTitle%, %Computer%, %Channel%, %EventID%, %Level%, %MitreTactics%, %MitreTags%, %OtherTags%, %RecordID%, %Details%, %RuleFile%, %RuleID%, %EvtxFile%`
### 8. `timesketch-verbose` 配置文件输出
`%Timestamp%, hayabusa, %RuleTitle%, %Computer%, %Channel%, %EventID%, %Level%, %MitreTactics%, %MitreTags%, %OtherTags%, %RecordID%, %Details%, %ExtraFieldInfo%, %RuleFile%, %RuleID%, %EvtxFile%`
### 配置文件对比
以下基准测试是在 2018 年联想 P51(Xeon 4 核 CPU / 64GB RAM)上进行的,使用了 3GB 的 evtx 数据并启用了 3891 条规则。(2023/06/01)
| 配置文件 | 处理时间 | 输出文件大小 | 文件大小增量 |
| :---: | :---: | :---: | :---: |
| minimal | 8 分 50 秒 | 770 MB | -30% |
| standard (默认) | 9 分 00 秒 | 1.1 GB | 无 |
| verbose | 9 分 10 秒 | 1.3 GB | +20% |
| all-field-info | 9 分 3 秒 | 1.2 GB | +10% |
| all-field-info-verbose | 9 分 10 秒 | 1.3 GB | +20% |
| super-verbose | 9 分 12 秒 | 1.5 GB | +35% |
### 配置文件字段别名
内置输出配置文件可以输出以下信息:
| 别名名称 | Hayabusa 输出信息 |
| :--- | :--- |
|%AllFieldInfo% | 所有字段信息。 |
|%Channel% | 日志名称。`` 字段。 |
|%Computer% | `` 字段。 |
|%Details% | YML 检测规则中的 `details` 字段,但只有 hayabusa 规则有此字段。此字段提供有关警报或事件的额外信息,并可以从事件日志的字段中提取有用数据。例如,用户名、命令行信息、进程信息等。当占位符指向不存在的字段或别名映射不正确时,它将输出为 `n/a`(不可用)。如果未指定 `details` 字段(即 sigma 规则),则将输出在 `./rules/config/default_details.txt` 中定义的提取字段的默认 `details` 消息。您可以通过在 `default_details.txt` 中添加 `Provider Name`、`EventID` 和要输出的 `details` 消息来添加更多默认 `details` 消息。当规则中或 `default_details.txt` 中均未定义 `details` 字段时,所有字段都将输出到 `details` 列。 |
|%ExtraFieldInfo% | 打印未在 %Details% 中输出的字段信息。 |
|%EventID% | `` 字段。 |
|%EvtxFile% | 引起警报或事件的 evtx 文件名。 |
|%Level% | YML 检测规则中的 `level` 字段。(`informational`, `low`, `medium`, `high`, `critical`) |
|%MitreTactics% | MITRE ATT&CK [tactics](https://attack.mitre.org/tactics/enterprise/)(例如:Initial Access, Lateral Movement 等)。 |
|%MitreTags% | MITRE ATT&CK 组 ID、技术 ID 和软件 ID。 |
|%OtherTags% | YML 检测规则中 `tags` 字段中未包含在 `MitreTactics` 或 `MitreTags` 中的任何关键词。 |
|%Provider% | `` 字段中的 `Name` 属性。 |
|%RecordID% | 来自 `` 字段的事件记录 ID。 |
|%RuleAuthor% | YML 检测规则中的 `author` 字段。 |
|%RuleCreationDate% | YML 检测规则中的 `date` 字段。 |
|%RuleFile% | 生成警报或事件的检测规则的文件名。 |
|%RuleID% | YML 检测规则中的 `id` 字段。 |
|%RuleModifiedDate% | YML 检测规则中的 `modified` 字段。 |
|%RuleTitle% | YML 检测规则中的 `title` 字段。 |
|%Status% | YML 检测规则中的 `status` 字段。 |
|%Timestamp% | 默认为 `YYYY-MM-DD HH:mm:ss.sss +hh:mm` 格式。事件日志中的 `` 字段。默认时区将是本地时区,但您可以使用 `--UTC` 选项将时区更改为 UTC。 |
#### 额外配置文件字段别名
如果需要,您还可以将此额外别名添加到输出配置文件中:
| 别名名称 | Hayabusa 输出信息 |
| :--- | :--- |
|%RenderedMessage% | WEC 转发日志中的 `` 字段。 |
注意:这**不**包含在任何内置配置文件中,因此您需要手动编辑 `config/default_profile.yaml` 文件并添加以下行:
```
Message: "%RenderedMessage%"
```
您还可以定义 [event key aliases](https://github.com/Yamato-Security/hayabusa-rules/blob/main/README.md#eventkey-aliases) 来输出其他字段。
## 缩写
为了节省空间,我们对级别、MITRE ATT&CK 战术、通道、提供者、字段名称等进行了缩写。
您可以使用 `-b, --disable-abbreviations` 选项关闭其中一些缩写,以查看原始通道名称、提供者名称等。
### 级别缩写
为了节省空间,我们在显示警报级别 (`level`) 时使用以下缩写。
* `emer`:`emergency`
* `crit`:`critical`
* `high`:`high`
* `med `:`medium`
* `low `:`low`
* `info`:`informational`
* `undef`:`undefined`
### MITRE ATT&CK 战术缩写
为了节省空间,我们在显示 MITRE ATT&CK 战术标签时使用以下缩写。
您可以在 `./config/mitre_tactics.txt` 配置文件中自由编辑这些缩写。
* `Recon` : Reconnaissance (侦察)
* `ResDev` : Resource Development (资源开发)
* `InitAccess` : Initial Access (初始访问)
* `Exec` : Execution (执行)
* `Persis` : Persistence (持久化)
* `PrivEsc` : Privilege Escalation (权限提升)
* `Evas` : Defense Evasion (防御规避)
* `CredAccess` : Credential Access (凭据访问)
* `Disc` : Discovery (发现)
* `LatMov` : Lateral Movement (横向移动)
* `Collect` : Collection (收集)
* `C2` : Command and Control (命令与控制)
* `Exfil` : Exfiltration (渗出)
* `Impact` : Impact (影响)
### 通道缩写
为了节省空间,我们在显示通道 (Channel) 时使用以下缩写。
您可以在 `./rules/config/channel_abbreviations.txt` 配置文件中自由编辑这些缩写。
* `App` : `Application`
* `AppLocker` : `Microsoft-Windows-AppLocker/*`
* `BitsCli` : `Microsoft-Windows-Bits-Client/Operational`
* `CodeInteg` : `Microsoft-Windows-CodeIntegrity/Operational`
* `Defender` : `Microsoft-Windows-Windows Defender/Operational`
* `DHCP-Svr` : `Microsoft-Windows-DHCP-Server/Operational`
* `DNS-Svr` : `DNS Server`
* `DvrFmwk` : `Microsoft-Windows-DriverFrameworks-UserMode/Operational`
* `Exchange` : `MSExchange Management`
* `Firewall` : `Microsoft-Windows-Windows Firewall With Advanced Security/Firewall`
* `KeyMgtSvc` : `Key Management Service`
* `LDAP-Cli` : `Microsoft-Windows-LDAP-Client/Debug`
* `NTLM` `Microsoft-Windows-NTLM/Operational`
* `OpenSSH` : `OpenSSH/Operational`
* `PrintAdm` : `Microsoft-Windows-PrintService/Admin`
* `PrintOp` : `Microsoft-Windows-PrintService/Operational`
* `PwSh` : `Microsoft-Windows-PowerShell/Operational`
* `PwShClassic` : `Windows PowerShell`
* `RDP-Client` : `Microsoft-Windows-TerminalServices-RDPClient/Operational`
* `Sec` : `Security`
* `SecMitig` : `Microsoft-Windows-Security-Mitigations/*`
* `SmbCliSec` : `Microsoft-Windows-SmbClient/Security`
* `SvcBusCli` : `Microsoft-ServiceBus-Client`
* `Sys` : `System`
* `Sysmon` : `Microsoft-Windows-Sysmon/Operational`
* `TaskSch` : `Microsoft-Windows-TaskScheduler/Operational`
* `WinRM` : `Microsoft-Windows-WinRM/Operational`
* `WMI` : `Microsoft-Windows-WMI-Activity/Operational`
### 其他缩写
规则中使用以下缩写,以使输出尽可能简洁:
* `Acct` -> Account
* `Addr` -> Address
* `Auth` -> Authentication
* `Cli` -> Client
* `Chan` -> Channel
* `Cmd` -> Command
* `Cnt` -> Count
* `Comp` -> Computer
* `Conn` -> Connection/Connected
* `Creds` -> Credentials
* `Crit` -> Critical
* `Disconn` -> Disconnection/Disconnected
* `Dir` -> Directory
* `Drv` -> Driver
* `Dst` -> Destination
* `EID` -> Event ID
* `Err` -> Error
* `Exec` -> Execution
* `FW` -> Firewall
* `Grp` -> Group
* `Img` -> Image
* `Inj` -> Injection
* `Krb` -> Kerberos
* `LID` -> Logon ID
* `Med` -> Medium
* `Net` -> Network
* `Obj` -> Object
* `Op` -> Operational/Operation
* `Proto` -> Protocol
* `PW` -> Password
* `Reconn` -> Reconnection
* `Req` -> Request
* `Rsp` -> Response
* `Sess` -> Session
* `Sig` -> Signature
* `Susp` -> Suspicious
* `Src` -> Source
* `Svc` -> Service
* `Svr` -> Server
* `Temp` -> Temporary
* `Term` -> Termination/Terminated
* `Tkt` -> Ticket
* `Tgt` -> Target
* `Unkwn` -> Unknown
* `Usr` -> User
* `Perm` -> Permament
* `Pkg` -> Package
* `Priv` -> Privilege
* `Proc` -> Process
* `PID` -> Process ID
* `PGUID` -> Process GUID (Global Unique ID)
* `Ver` -> Version
## 进度条
进度条仅在处理多个 evtx 文件时起作用。
它将实时显示已完成分析的 evtx 文件的数量和百分比。
## 彩色输出
警报将根据警报级别 (`level`) 以彩色输出。
您可以在 `./config/level_color.txt` 的配置文件中更改默认颜色,格式为 `level,(RGB 6位十六进制颜色值)`。
如果您想禁用彩色输出,可以使用 `-K, --no-color` 选项。
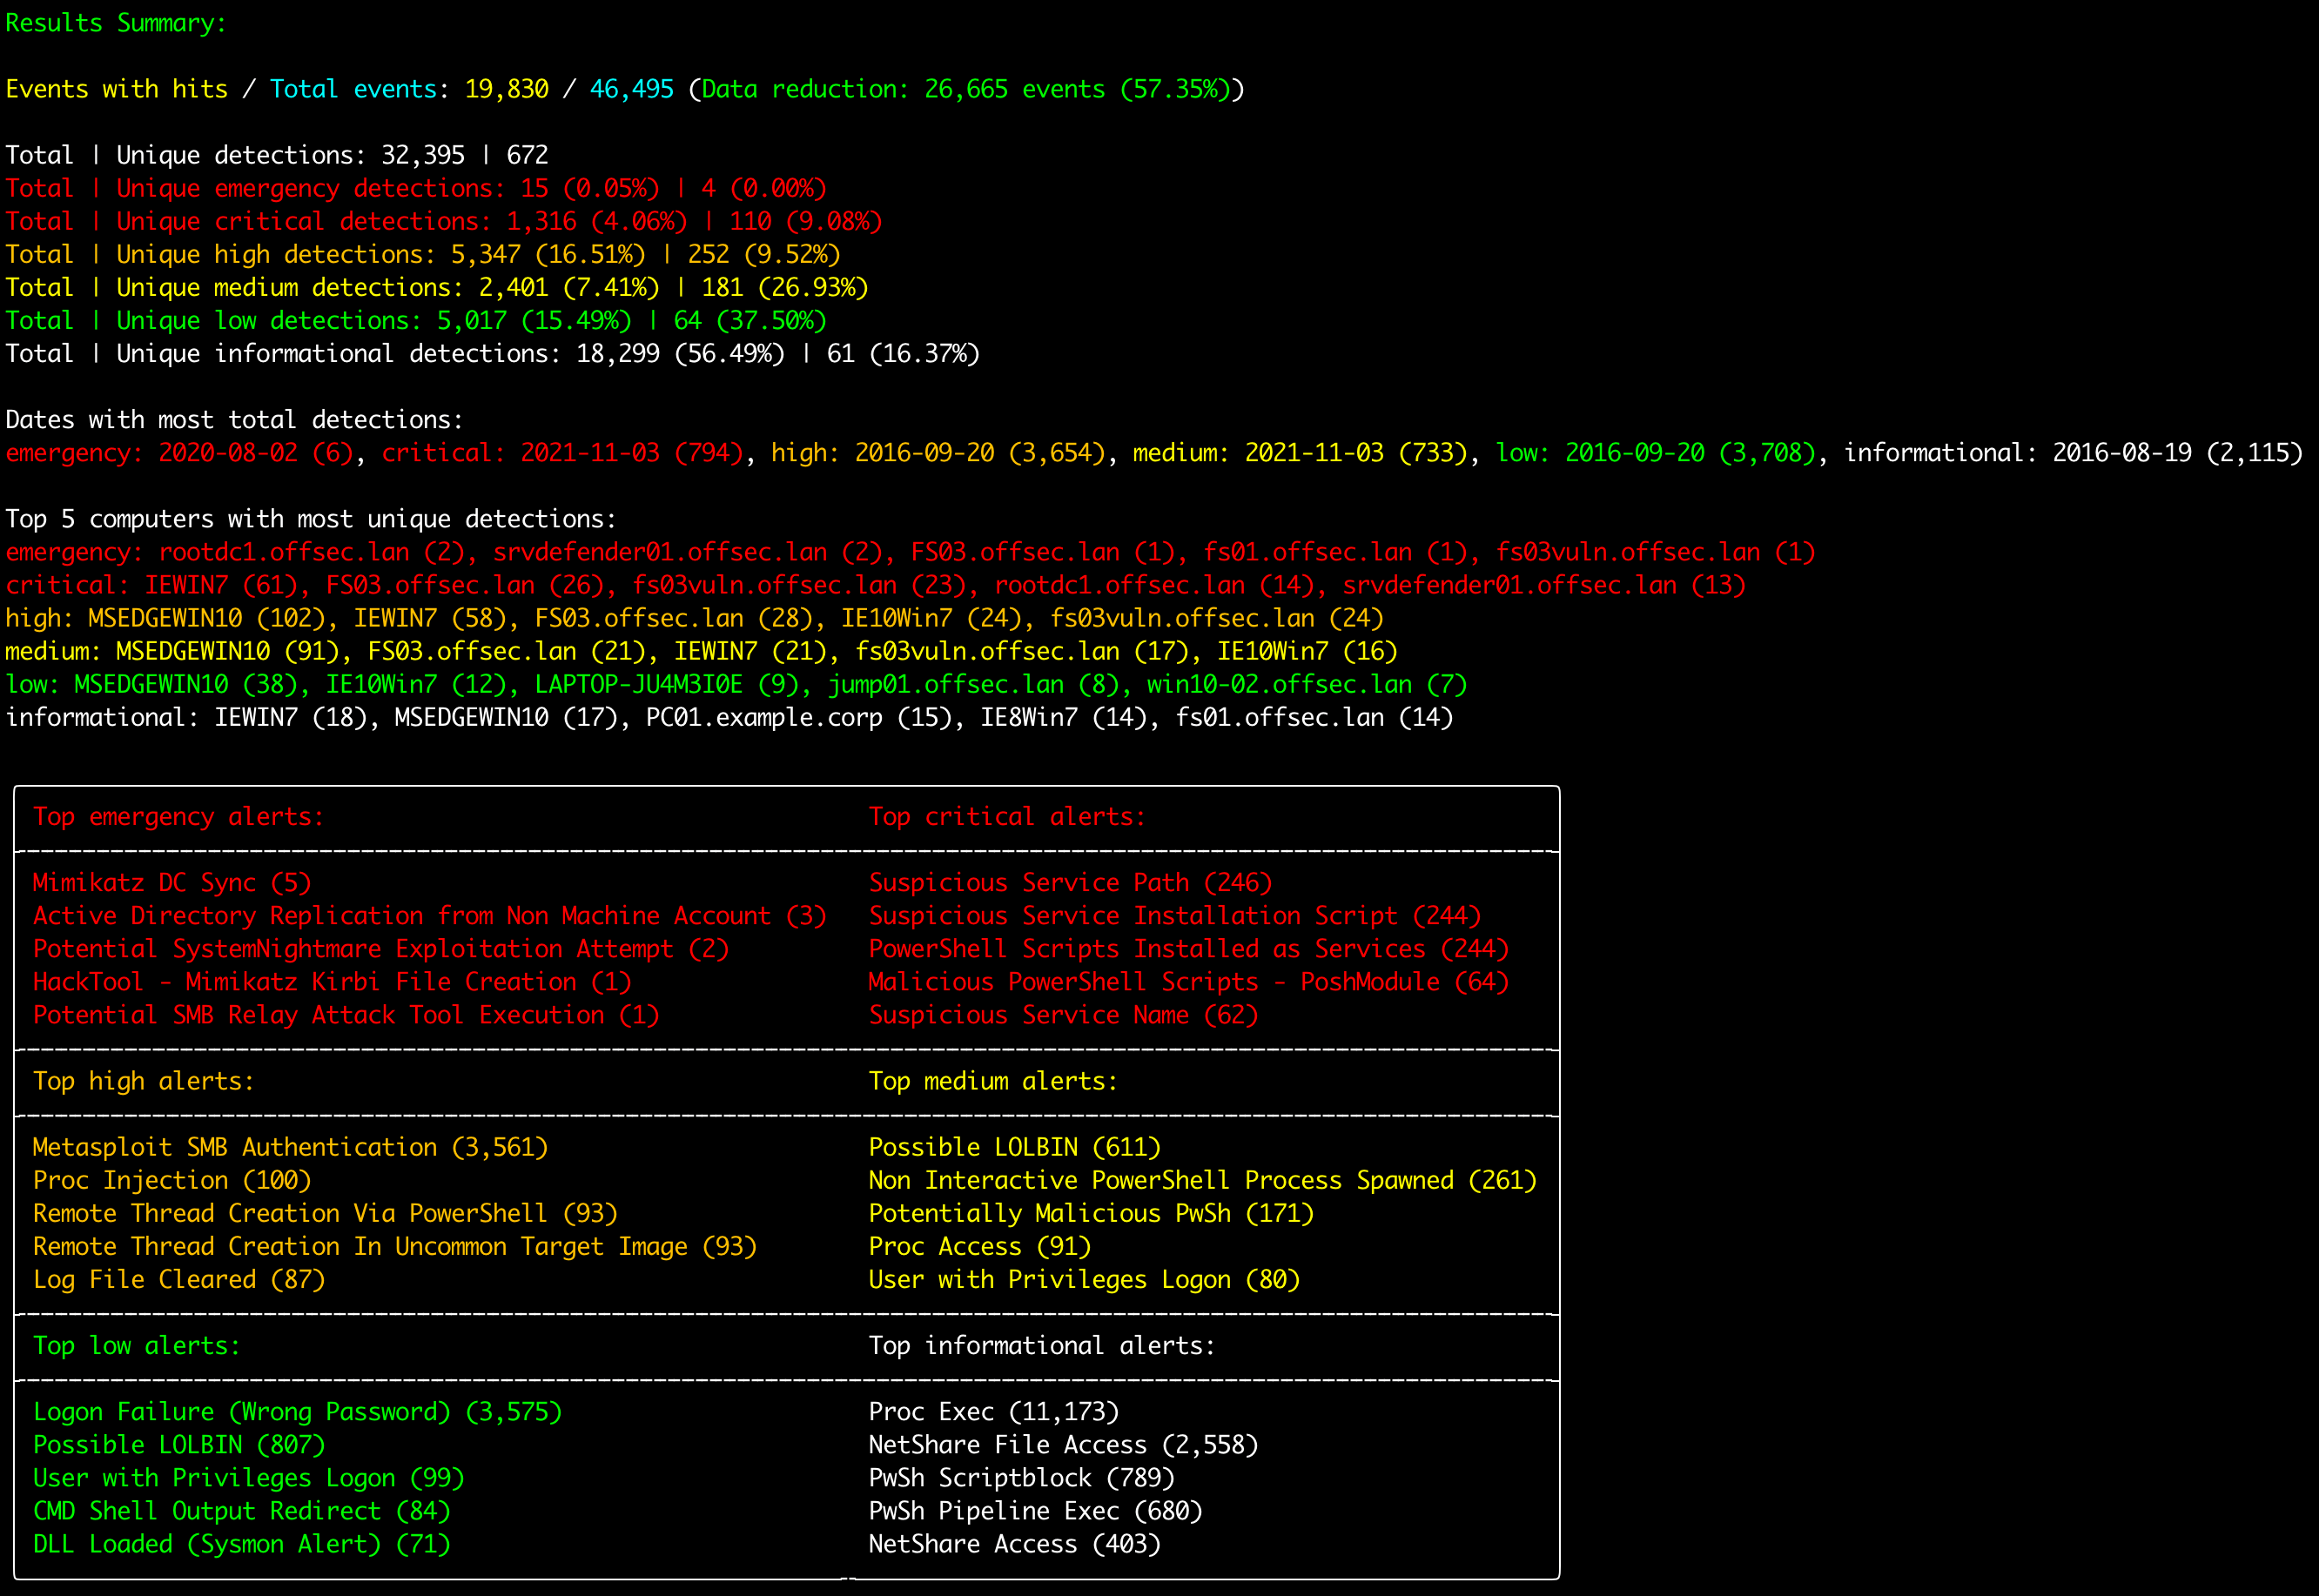
## 结果摘要
每次扫描后都会显示总事件数、有命中的事件数、数据缩减指标、总检测数和唯一检测数、检测次数最多的日期、检测次数最多的计算机以及排名靠前的警报。
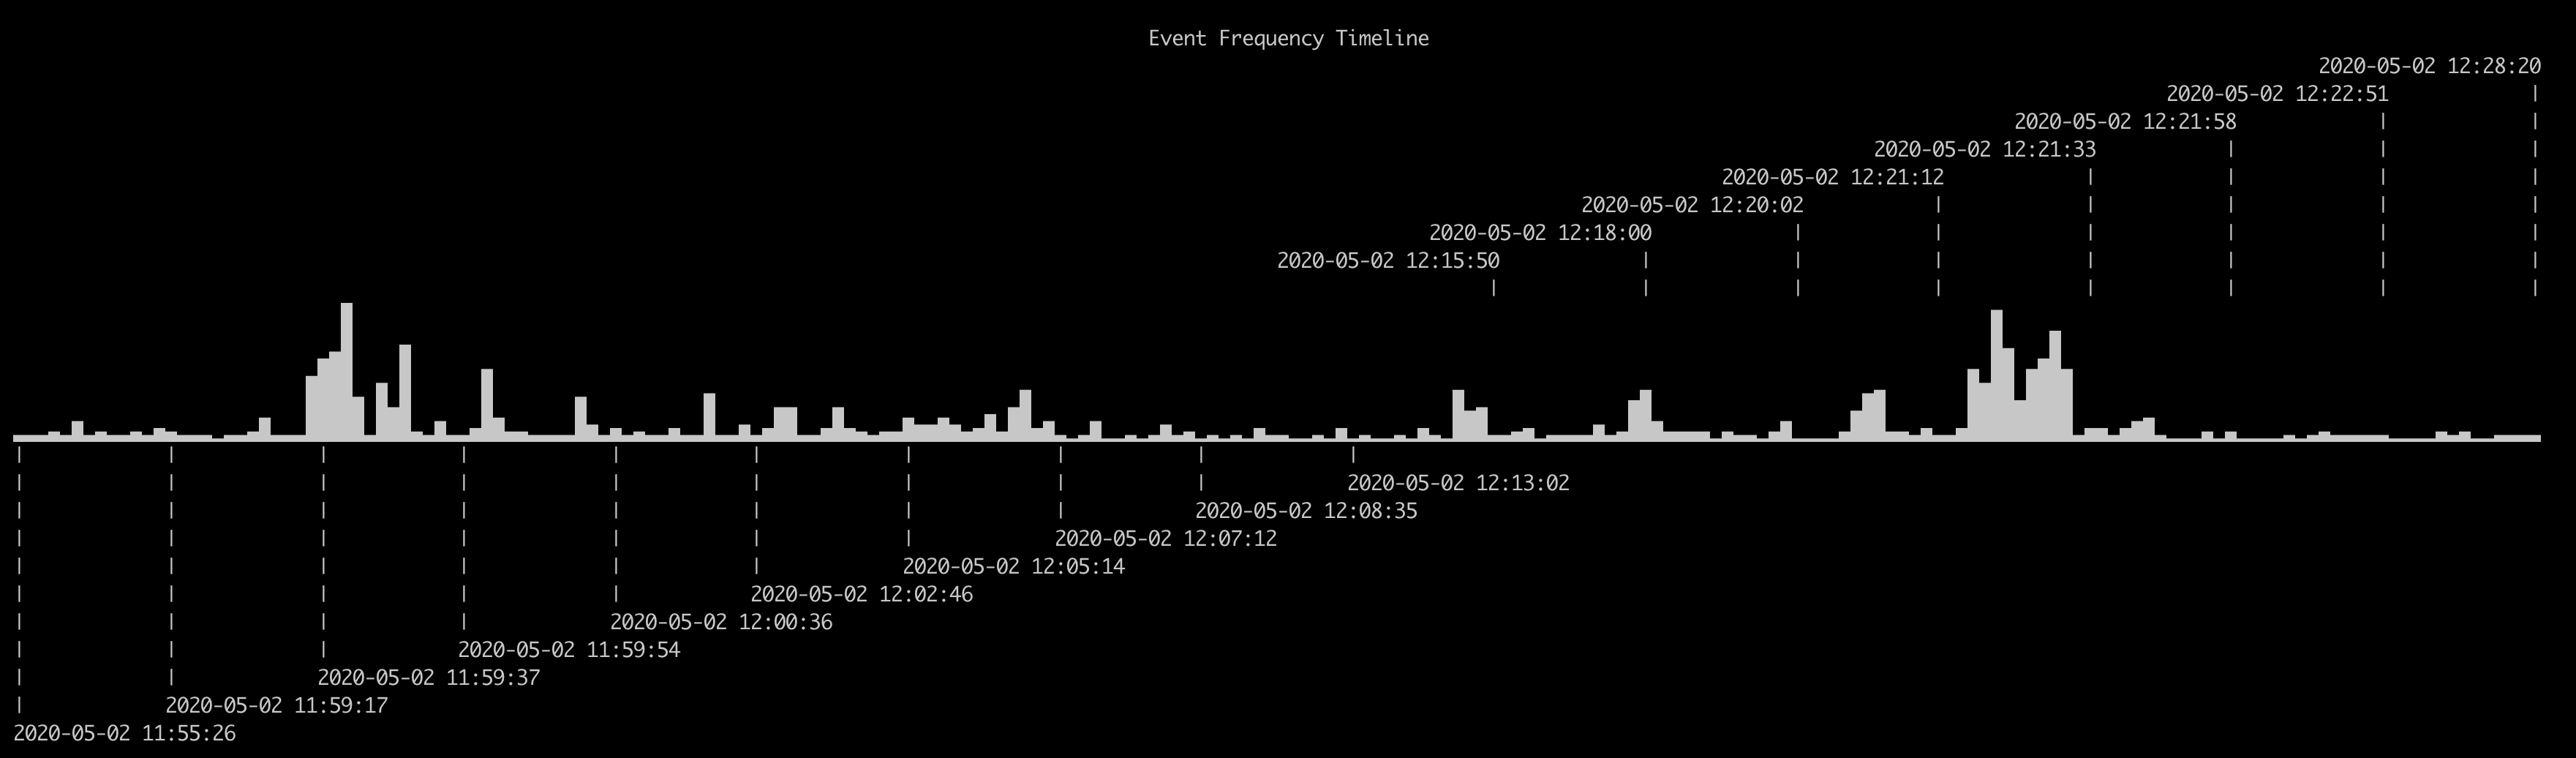
### 检测频率时间线
如果您添加 `-T, --visualize-timeline` 选项,事件频率时间线功能将显示检测到事件的迷你图频率时间线。
注意:需要超过 5 个事件。此外,字符在默认的命令提示符或 PowerShell 提示符下无法正确渲染,因此请使用 Windows 终端、iTerm2 等终端。
# Hayabusa 规则
Hayabusa 检测规则采用类似 sigma 的 YML 格式编写,位于 `rules` 文件夹中。
这些规则托管在 [https://github.com/Yamato-Security/hayabusa-rules](https://github.com/Yamato-Security/hayabusa-rules),因此请将规则的任何问题和拉取请求发送到那里,而不是 Hayabusa 主存储库。
请阅读 [the hayabusa-rules repository README](https://github.com/Yamato-Security/hayabusa-rules/blob/main/README.md) 以了解规则格式以及如何创建规则。
来自 hayabusa-rules 存储库的所有规则都应放在 `rules` 文件夹中。
`informational` 级别的规则被视为“事件” (`events`),而任何 `level` 为 `low` 及以上的规则都被视为“警报” (`alerts`)。
hayabusa 规则目录结构分为 2 个目录:
* `builtin`:可以通过 Windows 内置功能生成的日志。
* `sysmon`:由 [sysmon](https://docs.microsoft.com/en-us/sysinternals/downloads/sysmon) 生成的日志。
规则按日志类型(例如:Security, System 等)进一步细分为目录,并按以下格式命名:
请查看当前规则,将其作为创建新规则或检查检测逻辑的模板。
## Sigma 与 Hayabusa(内置 Sigma 兼容)规则
Hayabusa 原生支持 Sigma 规则,唯一的例外是在内部处理 `logsource` 字段。
为了减少误报,Sigma 规则应通过我们在 [here](https://github.com/Yamato-Security/hayabusa-rules/blob/main/tools/sigmac/README.md) 中解释的转换器运行。
这将添加正确的 `Channel` 和 `EventID`,并为 `process_creation` 等某些类别执行字段映射。
几乎所有的 Hayabusa 规则都与 Sigma 格式兼容,因此您可以像使用 Sigma 规则一样将它们转换为其他 SIEM 格式。
Hayabusa 规则专为 Windows 事件日志分析而设计,具有以下优势:
1. 额外的 `details` 字段,用于显示仅从日志中有用字段中提取的附加信息。
2. 它们都针对示例日志进行了测试,并已知可以工作。
3. 包含 Sigma 中没有的额外聚合器,例如 `|equalsfield` 和 `|endswithfield`。
据我们所知,在所有开源 Windows 事件日志分析工具中,hayabusa 对 sigma 规则提供了最强大的原生支持。
# 其他 Windows 事件日志分析器及相关资源
* [APT-Hunter](https://github.com/ahmedkhlief/APT-Hunter) - 用 Python 编写的攻击检测工具。
* [Awesome Event IDs](https://github.com/stuhli/awesome-event-ids) - 对数字取证和事件响应有用的事件 ID 资源集合。
* [Chainsaw](https://github.com/countercept/chainsaw) - 另一个用 Rust 编写的基于 sigma 的攻击检测工具。
* [DeepBlueCLI](https://github.com/sans-blue-team/DeepBlueCLI) - 由 [Eric Conrad](https://twitter.com/eric_conrad) 用 Powershell 编写的攻击检测工具。
* [Epagneul](https://github.com/jurelou/epagneul) - Windows 事件日志的图形可视化。
* [EventList](https://github.com/miriamxyra/EventList/) - 由 [Miriam Wiesner](https://github.com/miriamxyra) 将安全基准事件 ID 映射到 MITRE ATT&CK。
* [Mapping MITRE ATT&CK with Window Event Log IDs](https://www.socinvestigation.com/mapping-mitre-attck-with-window-event-log-ids/) - 由 [Michel de CREVOISIER](https://twitter.com/mdecrevoisier) 提供。
* [EvtxECmd](https://github.com/EricZimmerman/evtx) - 由 [Eric Zimmerman](https://twitter.com/ericrzimmerman) 提供的 Evtx 解析器。
* [EVTXtract](https://github.com/williballenthin/EVTXtract) - 从未分配空间和内存镜像中恢复 EVTX 日志文件。
* [EvtxToElk](https://www.dragos.com/blog/industry-news/evtxtoelk-a-python-module-to-load-windows-event-logs-into-elasticsearch/) - 将 Evtx 数据发送到 Elastic Stack 的 Python 工具。
* [EVTX ATTACK Samples](https://github.com/sbousseaden/EVTX-ATTACK-SAMPLES) - 由 [SBousseaden](https://twitter.com/SBousseaden) 提供的 EVTX 攻击示例事件日志文件。
* [EVTX-to-MITRE-Attack](https://github.com/mdecrevoisier/EVTX-to-MITRE-Attack) - 由 [Michel de CREVOISIER](https://twitter.com/mdecrevoisier) 提供的映射到 ATT&CK 的 EVTX 攻击示例事件日志文件。
* [EVTX parser](https://github.com/omerbenamram/evtx) - 我们使用的由 [@OBenamram](https://twitter.com/obenamram) 编写的 Rust evtx 库。
* [Grafiki](https://github.com/lucky-luk3/Grafiki) - Sysmon 和 PowerShell 日志可视化工具。
* [LogonTracer](https://github.com/JPCERTCC/LogonTracer) - 由 [JPCERTCC](https://twitter.com/jpcert_en) 提供的用于可视化登录以检测横向移动的图形界面。
* [NSA Windows Event Monitoring Guidance](https://github.com/nsacyber/Event-Forwarding-Guidance/tree/master/Events) - NSA 关于监控内容的指南。
* [RustyBlue](https://github.com/Yamato-Security/RustyBlue) - 由 Yamato Security 移植的 DeepBlueCLI 的 Rust 版本。
* [Sigma](https://github.com/SigmaHQ/sigma) - 基于社区的通用 SIEM 规则。
* [SOF-ELK](https://github.com/philhagen/sof-elk) - 由 [Phil Hagen](https://twitter.com/philhagen) 提供的预打包 VM,带有 Elastic Stack,用于导入数据进行 DFIR 分析。
* [so-import-evtx](https://docs.securityonion.net/en/2.3/so-import-evtx.html) - 将 evtx 文件导入 Security Onion。
* [SysmonTools](https://github.com/nshalabi/SysmonTools) - Sysmon 的配置和离线日志可视化工具。
* [Timeline Explorer](https://ericzimmerman.github.io/#!index.md) - 由 [Eric Zimmerman](https://twitter.com/ericrzimmerman) 提供的最佳 CSV 时间线分析器。
* [Windows Event Log Analysis - Analyst Reference](https://www.forwarddefense.com/media/attachments/2021/05/15/windows-event-log-analyst-reference.pdf) - 由 Forward Defense 的 Steve Anson 提供。
* [Zircolite](https://github.com/wagga40/Zircolite) - 用 Python 编写的基于 Sigma 的攻击检测工具。
# Windows 日志记录建议
为了正确检测 Windows 机器上的恶意活动,您需要改进默认的日志设置。
我们创建了一个单独的项目来记录需要启用哪些日志设置,以及在 [https://github.com/Yamato-Security/EnableWindowsLogSettings](https://github.com/Yamato-Security/EnableWindowsLogSettings) 自动启用正确设置的脚本。
我们还推荐以下网站作为指导:
* [JSCU-NL (Joint Sigint Cyber Unit Netherlands) Logging Essentials](https://github.com/JSCU-NL/logging-essentials)
* [ACSC (Australian Cyber Security Centre) Logging and Fowarding Guide](https://www.cyber.gov.au/acsc/view-all-content/publications/windows-event-logging-and-forwarding)
* [Malware Archaeology Cheat Sheets](https://www.malwarearchaeology.com/cheat-sheets)
# Sysmon 相关项目
为了创建最多的取证证据并以最高的准确度进行检测,您需要安装 sysmon。我们推荐以下网站和配置文件:
* [TrustedSec Sysmon Community Guide](https://github.com/trustedsec/SysmonCommunityGuide)
* [Sysmon Modular](https://github.com/olafhartong/sysmon-modular)
* [SwiftOnSecurity Sysmon Config](https://github.com/SwiftOnSecurity/sysmon-config)
* [SwiftOnSecurity Sysmon Config fork by Neo23x0](https://github.com/Neo23x0/sysmon-config)
* [SwiftOnSecurity Sysmon Config fork by ion-storm](https://github.com/ion-storm/sysmon-config)
# 社区文档
## 英语
* 2025/10/01 [BHIS: Wrangling Windows Event Logs with Hayabusa & SOF-ELK (Part 2)](https://www.blackhillsinfosec.com/wrangling-windows-event-logs-with-hayabusa-sof-elk-part-2/)
* 2025/09/29 [BHIS: Wrangling Windows Event Logs with Hayabusa & SOF-ELK (Part 1)](https://www.blackhillsinfosec.com/wrangling-windows-event-logs-with-hayabusa-sof-elk-part-1/)
* 2023/12/11 [Unleashing the Hayabusa Feathers: My Top Features Revealed!](https://detect.fyi/hunting-with-hayabusa-tool-showcase-aafef7434413) 作者:Christian Henriksen
* 2023/10/16 [Incident response and threat hunting using hayabusa tool](https://mahim-firoj.medium.com/incident-response-and-threat-hunting-using-hayabusa-tool-383da273183a) 作者:Md. Mahim Bin Firoj
* 2023/03/21 [Find Threats in Event Logs with Hayabusa](https://blog.ecapuano.com/p/find-threats-in-event-logs-with-hayabusa) 作者:[Eric Capuano](https://twitter.com/eric_capuano)
* 2023/03/14 [Rust Performance Guide for Hayabusa Developers](doc/RustPerformance-English.md) 作者:Fukusuke Takahashi
* 2022/06/19 [Velociraptor Walkthrough and Hayabusa Integration](https://www.youtube.com/watch?v=Q1IoGX--814) 作者:[Eric Capuano](https://twitter.com/eric_capuano)
* 2022/01/24 [Graphing Hayabusa results in neo4j](https://www.youtube.com/watch?v=7sQqz2ek-ko) 作者:Matthew Seyer ([@forensic_matt](https://twitter.com/forensic_matt))
## 日语
* 2024/01/24 [LME × Hayabusa - Windowsイベントログの集約と解析の効率化](https://jpn.nec.com/cybersecurity/blog/240126/index.html) 来自 NEC 安全博客
* 2023/09/29 [Fast Forensics with Hayabusa and Splunk](https://jpn.nec.com/cybersecurity/blog/230929/index.html) 来自 NEC 安全博客
* 2023/09/13 [Windows Event Log Analysis with Hayabusa](https://engineers.ffri.jp/entry/2023/09/13/130750) 来自 FFRI
* 2022/03/14 [Rust Performance Guide for Hayabusa Developers](doc/RustPerformance-Japanese.md) 作者:Fukusuke Takahashi
* 2022/01/22 [Visualizing Hayabusa results in Elastic Stack](https://qiita.com/kzzzzo2/items/ead8ccc77b7609143749) 作者:[@kzzzzo2](https://qiita.com/kzzzzo2)
* 2021/12/31 [Intro to Hayabusa](https://itib.hatenablog.com/entry/2021/12/31/222946) 作者:itiB ([@itiB_S144](https://twitter.com/itiB_S144))
* 2021/12/27 [Hayabusa internals](https://kazuminkun.hatenablog.com/entry/2021/12/27/190535) 作者:Kazuminn ([@k47_um1n](https://twitter.com/k47_um1n))
# 贡献
我们欢迎任何形式的贡献。
拉取请求、规则创建和示例 evtx 日志是最好的,但也非常欢迎功能请求、向我们通报错误等。
至少,如果您喜欢我们的工具,请在 GitHub 上给我们一颗星并表示支持!
# 提交 Bug
请在此处提交您发现的任何错误:[here.](https://github.com/Yamato-Security/hayabusa/issues/new?assignees=&labels=bug&template=bug_report.md&title=%5Bbug%5D)
该项目目前正在积极维护中,我们很乐意修复报告的任何错误。
如果您发现 Hayabusa 规则有任何问题(误报、错误等),请将其报告给 hayabusa-rules GitHub 问题页面 [here](https://github.com/Yamato-Security/hayabusa-rules/issues/new)。
如果您发现 Sigma 规则有任何问题(误报、错误等),请将其报告给上游 SigmaHQ GitHub 问题页面 [here](https://github.com/SigmaHQ/sigma/issues)。
# 许可协议
Hayabusa 在 [AGPLv3](https://www.gnu.org/licenses/agpl-3.0.en.html) 下发布,所有规则均在 [Detection Rule License (DRL) 1.1](https://github.com/SigmaHQ/sigma/blob/master/LICENSE.Detection.Rules.md) 下发布。
您可以自由地在内部、SaaS 解决方案、咨询工作等中使用 Hayabusa。
但是,如果您在某种 SaaS 解决方案中使用 Hayabusa 并对其进行了改进,我们要求您开源这些改进并回馈给项目。
Hayabusa 使用由 MaxMind 创建的 GeoLite2 数据,可从 [https://www.maxmind.com](https://www.maxmind.com) 获取。
# 推特
您可以通过在 Twitter 上关注我们 [@SecurityYamato](https://twitter.com/SecurityYamato) 来接收有关 Hayabusa 的最新消息、规则更新、其他 Yamato Security 工具等。标签:API接口, DFIR, EVTX分析, PE 加载器, Sigma规则, 可视化界面, 域环境安全, 威胁狩猎, 子域名变形, 库, 应急响应, 数字取证, 目标导入, 网络安全, 自动化脚本, 通知系统, 通知系统, 隐私保护