netboxlabs/pktvisor
GitHub: netboxlabs/pktvisor
pktvisor 是一个轻量级网络可观测性 Agent,能够在边缘实时分析网络流量并生成 OpenTelemetry 指标,深度支持 DNS、sFlow 和 PCAP 等数据源。
Stars: 523 | Forks: 32

[](https://github.com/netboxlabs/pktvisor/actions)
[](https://github.com/netboxlabs/pktvisor/security/code-scanning)
[](https://app.codecov.io/gh/netboxlabs/pktvisor/tree/develop)
/pktvisord-x86_64
```
## 文档
### Agent 使用方法
当前命令行选项描述如下:
```
docker run --rm netboxlabs/pktvisor pktvisord --help
```
或
```
./pktvisor-x86_64.AppImage pktvisord --help
```
```
Usage:
pktvisord [options] [IFACE]
pktvisord (-h | --help)
pktvisord --version
pktvisord summarizes data streams and exposes a REST API control plane for configuration and metrics.
pktvisord operation is configured via Taps and Collection Policies. Taps abstract the process of "tapping into"
input streams with templated configuration while Policies use Taps to instantiate and configure Input and Stream
Handlers to analyze and summarize stream data, which is then made available for collection via REST API.
Taps and Collection Policies may be created by passing the appropriate YAML configuration file to
--config, and/or by enabling the admin REST API with --admin-api and using the appropriate endpoints.
Alternatively, for simple use cases you may specify IFACE, which is either a network interface, an
IP address (4 or 6), or "auto". If this is specified, "default" Tap and Collection Policies will be created with
a "pcap" input stream on the specified interfaced, along with the built in "net", "dns", and "pcap"
Stream Handler modules attached. If "auto" is specified, the most used ethernet interface will be chosen.
Note that this feature may be deprecated in the future.
For more documentation, see https://pktvisor.dev
Base Options:
-d Daemonize; fork and continue running in the background [default: false]
-h --help Show this screen
-v Verbose log output
--no-track Don't send lightweight, anonymous usage metrics
--version Show version
Web Server Options:
-l HOST Run web server on the given host or IP (default: localhost)
-p PORT Run web server on the given port (default: 10853)
--tls Enable TLS on the web server
--tls-cert FILE Use given TLS cert. Required if --tls is enabled.
--tls-key FILE Use given TLS private key. Required if --tls is enabled.
--admin-api Enable admin REST API giving complete control plane functionality [default: false]
When not specified, the exposed API is read-only access to module status and metrics.
When specified, write access is enabled for all modules.
Geo Options:
--geo-city FILE GeoLite2 City database to use for IP to Geo mapping
--geo-asn FILE GeoLite2 ASN database to use for IP to ASN mapping
--geo-cache-size N GeoLite2 LRU cache size, 0 to disable. (default: 10000)
--default-geo-city FILE Default GeoLite2 City database to be loaded if no other is specified
--default-geo-asn FILE Default GeoLite2 ASN database to be loaded if no other is specified
Configuration:
--config FILE Use specified YAML configuration to configure options, Taps, and Collection Policies
Please see https://pktvisor.dev for more information
Crashpad:
--cp-disable Disable crashpad collector
--cp-token TOKEN Crashpad token for remote crash reporting
--cp-url URL Crashpad server url
--cp-custom USERDEF Crashpad optional user defined field
--cp-path PATH Crashpad handler binary
Modules:
--module-list List all modules which have been loaded (builtin and dynamic).
--module-dir DIR Set module load path. All modules in this directory will be loaded.
Logging Options:
--log-file FILE Log to the given output file name
--syslog Log to syslog
Prometheus Options:
--prometheus Ignored, Prometheus output always enabled (left for backwards compatibility)
--prom-instance ID Optionally set the 'instance' label to given ID
Metric Enrichment Options:
--iana-service-port-registry FILE IANA Service Name and Transport Protocol Port Number Registry file in CSV format
--default-service-registry FILE Default IANA Service Name Port Number Registry CSV file to be loaded if no other is specified
Handler Module Defaults:
--max-deep-sample N Never deep sample more than N% of streams (an int between 0 and 100) (default: 100)
--periods P Hold this many 60 second time periods of history in memory (default: 5)
pcap Input Module Options: (applicable to default policy when IFACE is specified only)
-b BPF Filter packets using the given tcpdump compatible filter expression. Example: "port 53"
-H HOSTSPEC Specify subnets (comma separated) to consider HOST, in CIDR form. In live capture this
/may/ be detected automatically from capture device but /must/ be specified for pcaps.
Example: "10.0.1.0/24,10.0.2.1/32,2001:db8::/64"
Specifying this for live capture will append to any automatic detection.
```
### 使用配置文件
可以使用 `--config` 选项通过 YAML 配置文件在启动时配置 pktvisord。
配置文件可以配置命令行上可用的所有选项,
以及定义 [Policies(策略)](RFCs/2021-04-16-76-collection-policies.md) 和 [Taps(接入点)](RFCs/2021-04-16-75-taps.md)。所有部分都是可选的。
请注意,Policies 和 Taps 也可以通过 [REST API](#rest-api) 实时维护。
```
version: "1.0"
visor:
# optionally define global configuration (see command line options)
config:
verbose: true
# optionally define taps
taps:
default_pcap:
input_type: pcap
config:
iface: eth0
filter:
bpf: "port 53"
unix_dnstap:
input_type: dnstap
config:
socket: "/tmp/dnstap.sock"
tcp_dnstap:
input_type: dnstap
config:
tcp: "127.0.0.1:53053"
# optionally define policies
policies:
mysocket:
kind: collection
input:
tap: unix_dnstap
input_type: dnstap
handlers:
modules:
default_net:
type: net
default_dns:
type: dns
config:
only_qname_suffix:
- ".google.com"
- ".netboxlabs.com"
mytcp:
kind: collection
input:
tap: tcp_dnstap
input_type: dnstap
handlers:
modules:
default_net:
type: net
default_dns:
type: dns
```
如果在 Docker 容器中运行,则必须将配置文件挂载到容器中。例如,如果配置文件
位于主机上的 `/local/pktvisor/agent.yaml`,您可以使用以下命令将其挂载到容器并使用:
```
docker run -v /local/pktvisor:/usr/local/pktvisor/ --net=host netboxlabs/pktvisor pktvisord --config /usr/local/pktvisor/agent.yaml --admin-api
```
### 命令行 UI 使用方法
命令行 UI(`pktvisor-cli`)直接连接到 pktvisord agent 以可视化实时流
摘要,默认为滑动 5 分钟时间窗口。它还可以连接到运行在远程主机上的 agent。
```
docker run --rm netboxlabs/pktvisor pktvisor-cli -h
```
```
./pktvisor-x86_64.AppImage pktvisor-cli -h
```
```
Usage:
pktvisor-cli [-p PORT] [-H HOST]
pktvisor-cli -h
pktvisor-cli --version
Options:
-p PORT Query pktvisord metrics webserver on the given port [default: 10853]
-H HOST Query pktvisord metrics webserver on the given host [default: localhost]
-P POLICY pktvisor policy to query [default: default]
--tls Use TLS to communicate with pktvisord metrics webserver
--tls-noverify Do not verify TLS certificate
-h Show this screen
--version Show client version
```
### 文件分析 (pcap 和 dnstap)
`pktvisor-reader` 是一个可以静态分析预先录制的 packet capture(抓包)和 dnstap 文件的工具。
pcap 文件可以来自许多来源,最著名的是 [tcpdump](https://www.tcpdump.org/)。Dnstap 文件
可以从大多数支持 dnstap 日志记录的 DNS 服务器软件生成,可以直接生成,也可以
使用诸如 [golang-dnstap](https://github.com/dnstap/golang-dnstap) 之类的工具生成。
两者都接受许多与 `pktvisord` 相同的选项,并且执行与实时捕获相同的所有分析。pcap 文件可能包含流捕获数据。
```
docker run --rm netboxlabs/pktvisor pktvisor-reader --help
```
```
./pktvisor-x86_64.AppImage pktvisor-reader --help
```
```
Usage:
pktvisor-reader [options] FILE
pktvisor-reader (-h | --help)
pktvisor-reader --version
Summarize a network (pcap, dnstap) file. The result will be written to stdout in JSON format, while console logs will be printed
to stderr.
Options:
-i INPUT Input type (pcap|dnstap|sflow|netflow). If not set, default is pcap input
--max-deep-sample N Never deep sample more than N% of streams (an int between 0 and 100) [default: 100]
--periods P Hold this many 60 second time periods of history in memory. Use 1 to summarize all data. [default: 5]
-h --help Show this screen
--version Show version
-v Verbose log output
-b BPF Filter packets using the given BPF string
--geo-city FILE GeoLite2 City database to use for IP to Geo mapping (if enabled)
--geo-asn FILE GeoLite2 ASN database to use for IP to ASN mapping (if enabled)
-H HOSTSPEC Specify subnets (comma separated) to consider HOST, in CIDR form. In live capture this /may/ be detected automatically
from capture device but /must/ be specified for pcaps. Example: "10.0.1.0/24,10.0.2.1/32,2001:db8::/64"
Specifying this for live capture will append to any automatic detection.
```
您可以通过传入引用包含 pcap 文件的目录的卷来使用 docker 容器。标准
输出将包含 JSON 摘要输出,您可以捕获或将其通过管道传递到其他工具,例如:
```
$ docker run --rm -v /pktvisor/src/tests/fixtures:/pcaps netboxlabs/pktvisor pktvisor-reader /pcaps/dns_ipv4_udp.pcap | jq .
[2021-03-11 18:45:04.572] [pktvisor] [info] Load input plugin: PcapInputModulePlugin dev.visor.module.input/1.0
[2021-03-11 18:45:04.573] [pktvisor] [info] Load handler plugin: DnsHandler dev.visor.module.handler/1.0
[2021-03-11 18:45:04.573] [pktvisor] [info] Load handler plugin: NetHandler dev.visor.module.handler/1.0
...
processed 140 packets
{
"5m": {
"dns": {
"cardinality": {
"qname": 70
},
"period": {
"length": 6,
"start_ts": 1567706414
},
"top_nxdomain": [],
"top_qname2": [
{
"estimate": 140,
"name": ".test.com"
}
],
...
```
AppImage 可以像任何普通二进制文件一样访问本地文件:
```
$ ./pktvisor-x86_64.AppImage pktvisor-reader /pcaps/dns_ipv4_udp.pcap | jq .
[2021-03-11 18:45:04.572] [pktvisor] [info] Load input plugin: PcapInputModulePlugin dev.visor.module.input/1.0
[2021-03-11 18:45:04.573] [pktvisor] [info] Load handler plugin: DnsHandler dev.visor.module.handler/1.0
[2021-03-11 18:45:04.573] [pktvisor] [info] Load handler plugin: NetHandler dev.visor.module.handler/1.0
...
processed 140 packets
{
"5m": {
"dns": {
"cardinality": {
"qname": 70
},
"period": {
"length": 6,
"start_ts": 1567706414
},
"top_nxdomain": [],
"top_qname2": [
{
"estimate": 140,
"name": ".test.com"
}
],
...
```
### 指标收集
#### 来自 REST API 的指标
指标可以通过 [REST API](#rest-api) 以 JSON 格式从 agent 获取。
对于大多数用例,您需要每分钟收集一次最近完整的 1 分钟桶(bucket)一次:
```
curl localhost:10853/api/v1/metrics/bucket/1
```
这可以使用诸如 [telegraf](https://docs.influxdata.com/telegraf/) 和
[标准 HTTP 插件](https://github.com/influxdata/telegraf/blob/release-1.17/plugins/inputs/http/README.md) 之类的工具来完成。
针对 `default` 策略的 telegraf 配置片段示例:
```
[inputs]
[[inputs.http]]
urls = [ "http://127.0.0.1:10853/api/v1/metrics/bucket/1",]
interval = "60s"
data_format = "json"
json_query = "1m"
json_time_key = "period_start_ts"
json_time_format = "unix"
json_string_fields = [
"dns_*",
"packets_*",
"dhcp_*",
"pcap_*",
]
[inputs.http.tags]
t = "pktvisor"
interval = "60"
```
#### Prometheus 指标
`pktvisord` 原生支持 Prometheus。`default` 策略指标
可在标准 `/metrics` 端点收集,或使用 `/api/v1/policies/__all/metrics/prometheus` 从所有策略收集指标。
```
$ ./pktvisor-x86_64.AppImage pktvisord -d eth0
$ curl localhost:10853/metrics
# HELP dns_wire_packets_udp 通过 UDP 接收的总 DNS wire 数据包(入口和出口)
# TYPE dns_wire_packets_udp gauge
dns_wire_packets_udp{instance="node",policy="default"} 28
# HELP dns_rates_total 每秒所有 DNS wire 数据包(合并入口和出口)的速率
# TYPE dns_rates_total summary
dns_rates_total{instance="node",policy="default",quantile="0.5"} 0
dns_rates_total{instance="node",policy="default",quantile="0.9"} 4
dns_rates_total{instance="node",policy="default",quantile="0.95"} 4
...
```
您可以通过传递 `--prom-instance ID` 来设置 `instance` 标签
如果您对使用
[remote write(远程写入)](https://prometheus.io/docs/operating/integrations/#remote-endpoints-and-storage) 进行集中化收集感兴趣,包括连接到
云提供商,有一个 [可用的 docker 镜像](https://hub.docker.com/r/netboxlabs/pktvisor-prom-write) 可以使这
变得容易。有关更多信息,请参阅 [centralized_collection/prometheus](centralized_collection/prometheus)。
另请参阅 [getorb.io](https://getorb.io) 以获取有关将 pktvisor agent 连接到 Orb observability 平台的信息。
### REST API
REST API 文档以 [OpenAPI 格式](https://app.swaggerhub.com/apis/netboxlabs/pktvisor/3.0.0-oas3) 提供
请注意,管理控制平面 API(`--admin-api`)目前正在进行大量迭代,因此
尚未记录在案。如果您有需要管理 API 的用例,请 [联系我们](#contact-us) 进行讨论。
### 高级 Agent 示例
从 Docker 启动 collector agent,支持 MaxmindDB GeoIP/GeoASN 并使用 Host 选项来识别
入口和出口流量:
```
docker run --rm --net=host -d \
--mount type=bind,source=/opt/geo,target=/geo \
netboxlabs/pktvisor pktvisord \
--geo-city /geo/GeoIP2-City.mmdb \
--geo-asn /geo/GeoIP2-ISP.mmdb \
-H 192.168.0.54/32,127.0.0.1/32 \
eth0
```
使用 AppImage 并将日志记录到 syslog 的相同命令:
```
./pktvisor-x86_64.AppImage pktvisord -d --syslog \
--geo-city /geo/GeoIP2-City.mmdb \
--geo-asn /geo/GeoIP2-ISP.mmdb \
-H 192.168.0.54/32,127.0.0.1/32 \
eth0
```
### 更多文档
我们认识到一流文档的价值,我们正在致力于进一步的文档工作,包括扩展和更新
REST API 文档、面向输入和处理程序模块开发人员(以及那些希望为 pktvisor 做贡献的人)的内部文档,以及用户手册。
如果您对安装、使用或开发有任何疑问,请 [联系我们](#contact-us)。
## 联系我们
我们非常希望能听到您的用例、功能请求和其他反馈意见!
* [提交 issue](https://github.com/netboxlabs/pktvisor/issues/new)
* 查看现有的 [issues](https://github.com/netboxlabs/pktvisor/issues)
* 发起一个 [Discussion(讨论)](https://github.com/netboxlabs/pktvisor/discussions)
* [加入我们的 Slack](https://join.slack.com/t/netboxlabs/shared_invite/zt-qqsm5cb4-9fsq1xa~R3h~nX6W0sJzmA)
* 发送邮件至 [info@pktvisor.dev](mailto:info@pktvisor.dev)
## 构建
主要代码库是用整洁的现代 C++ 编写的。`pktvisor-cli` 命令行界面是用 Go 编写的。构建系统需要 CMake 和 [Conan](https://conan.io/) 包管理系统。
pktvisor 遵守 [semantic versioning(语义化版本控制)](https://semver.org/)。
pktvisor 在 Linux 和 OSX 上开发和测试。Windows 移植版正在进行中。已知 x86_64 和 ARM 架构均可正常运行。
#### 依赖项
* [Conan](https://conan.io/) 2.X C++ 包管理器
* CMake >= 3.24 (`cmake`)
* 支持 C++17 的 C++ 编译器
有关 conan 包含的包的列表,请参阅 [conanfile.py](conanfile.py)
#### 构建
一般构建步骤如下:
```
# clone the repository
git clone https://github.com/netboxlabs/pktvisor.git
cd pktvisor/
conan profile detect -f
cd build/
# configure and handle dependencies
cmake -DCMAKE_BUILD_TYPE=Release -DCMAKE_PROJECT_TOP_LEVEL_INCLUDES=./cmake/conan_provider.cmake ..
# build and run tests
make all test
# the binaries will be in the build/bin directory
bin/pktvisord --help
```
由于开发环境可能会有很大差异,请参阅
[Dockerfile](https://github.com/netboxlabs/pktvisor/blob/master/docker/Dockerfile)
和 [Continuous Integration build file(持续集成构建文件)](https://github.com/netboxlabs/pktvisor/blob/master/.github/workflows/build.yml) 作为
参考。
## 贡献
感谢您考虑做出贡献!我们将此部分,提供更详细的信息来指导您完成该过程。
请针对 `develop` 分支提交 Pull Requests。如果您正在考虑较大的贡献,[请联系我们](#contact-us) 讨论您的设计。
有关更多信息,请参阅 [Contribution Guidelines(贡献指南)](CONTRIBUTING.md)。
## 许可证
此代码在 Mozilla Public License 2.0 下发布。您可以在 LICENSE 文件中找到条款和条件。
## 必要声明
版权所有 NetBox Labs, Inc.
简介 • 快速开始 • 文档 • 构建 • 贡献 • 联系我们
## 什么是 pktvisor? **pktvisor**(发音为 "packet visor")是一个 **observability agent(可观测性 Agent)**,用于分析高流量、信息密集的 网络数据流,并直接从边缘提取可操作的洞察,同时与现代 observability stack(可观测性技术栈)紧密集成。 它资源高效,从零开始构建,采用模块化设计,并可通过 API 和 YAML 策略实时动态控制。输入和分析器模块可以在运行时动态加载。指标输出可以通过命令行 UI 在本地节点上使用和可视化(用于本地化、超实时操作),也可以集中收集到 Prometheus 和 Grafana 等行业标准 observability stack 中。 [input stream system(输入流系统)](src/inputs) 设计用于 _接入_ 数据流。目前支持 [packet capture(抓包)](https://en.wikipedia.org/wiki/Packet_analyzer)、 [dnstap](https://dnstap.info/)、[sFlow](https://en.wikipedia.org/wiki/SFlow) 和 [Netflow](https://en.wikipedia.org/wiki/NetFlow) / [IPFIX](https://en.wikipedia.org/wiki/IP_Flow_Information_Export),并将很快支持其他 taps,例如 [envoy taps](https://www.envoyproxy.io/docs/envoy/latest/operations/traffic_tapping) 和 [eBPF](https://ebpf.io/)。 [stream analyzer system(流分析器系统)](src/handlers) 包括完整的应用层分析,并能 [高效地](https://en.wikipedia.org/wiki/Streaming_algorithm) 汇总为: * Counters(计数器) * Histograms and Quantiles(直方图和分位数) * Timers and Rates(计时器和速率) * Heavy Hitters/Frequent Items/Top N(主要项/频繁项/Top N) * Set Cardinality(集合基数) * GeoIP/ASN 请查看 [当前指标列表](https://github.com/netboxlabs/pktvisor/wiki/Current-Metrics) 或 [示例指标输出](https://github.com/netboxlabs/pktvisor/wiki/Sample-pktvisor-Output-Data)。 pktvisor 起源于对关键互联网基础设施的 observability,以支持 DDoS 防护、流量工程和持续运营。 这些截图展示了 [Network(网络)](src/handlers/net) 和 [DNS](src/handlers/dns) 流处理器的 [命令行界面](golang/) 和 [集中化视图](centralized_collection/),以及提供的摘要信息类型: 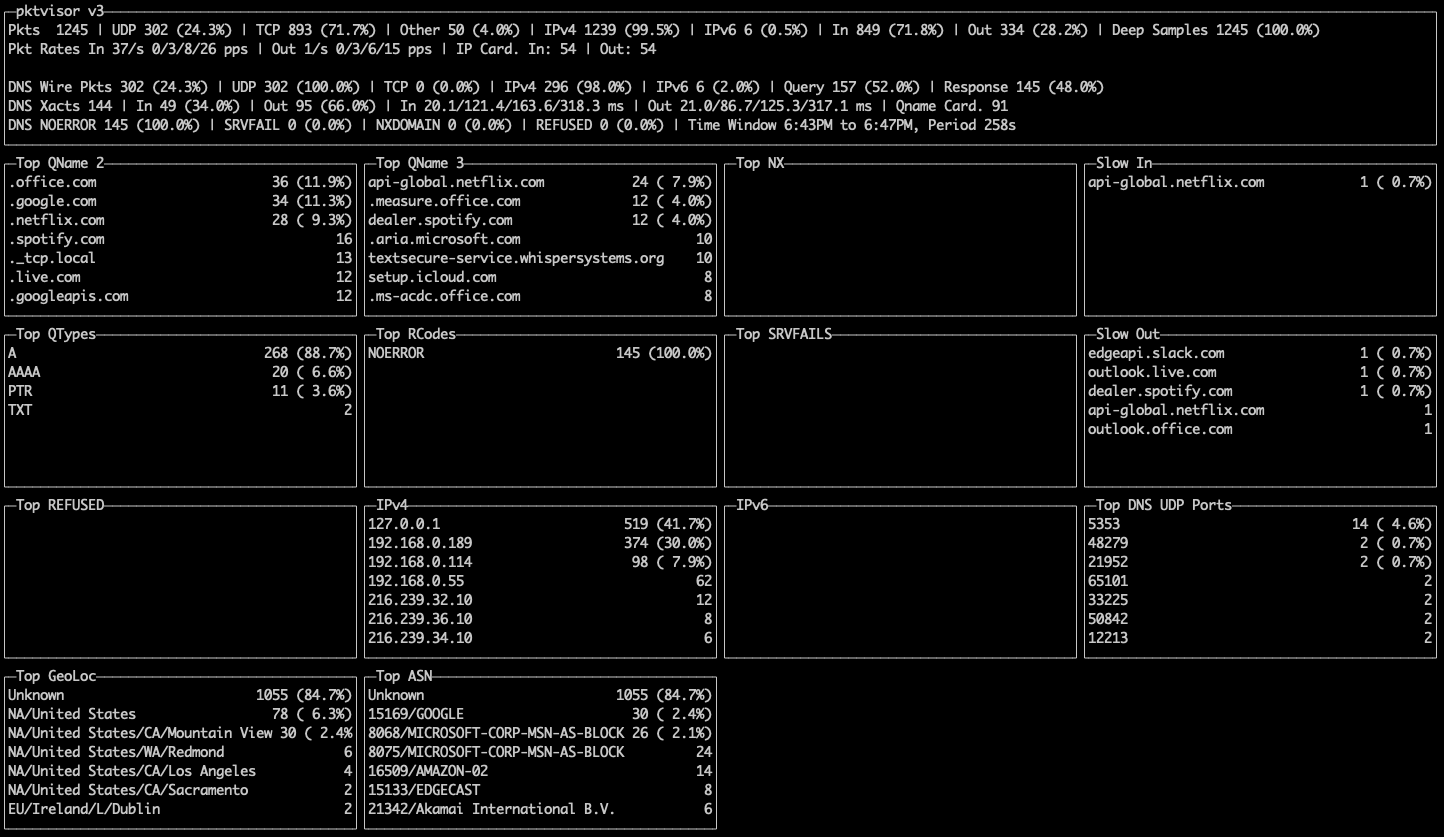 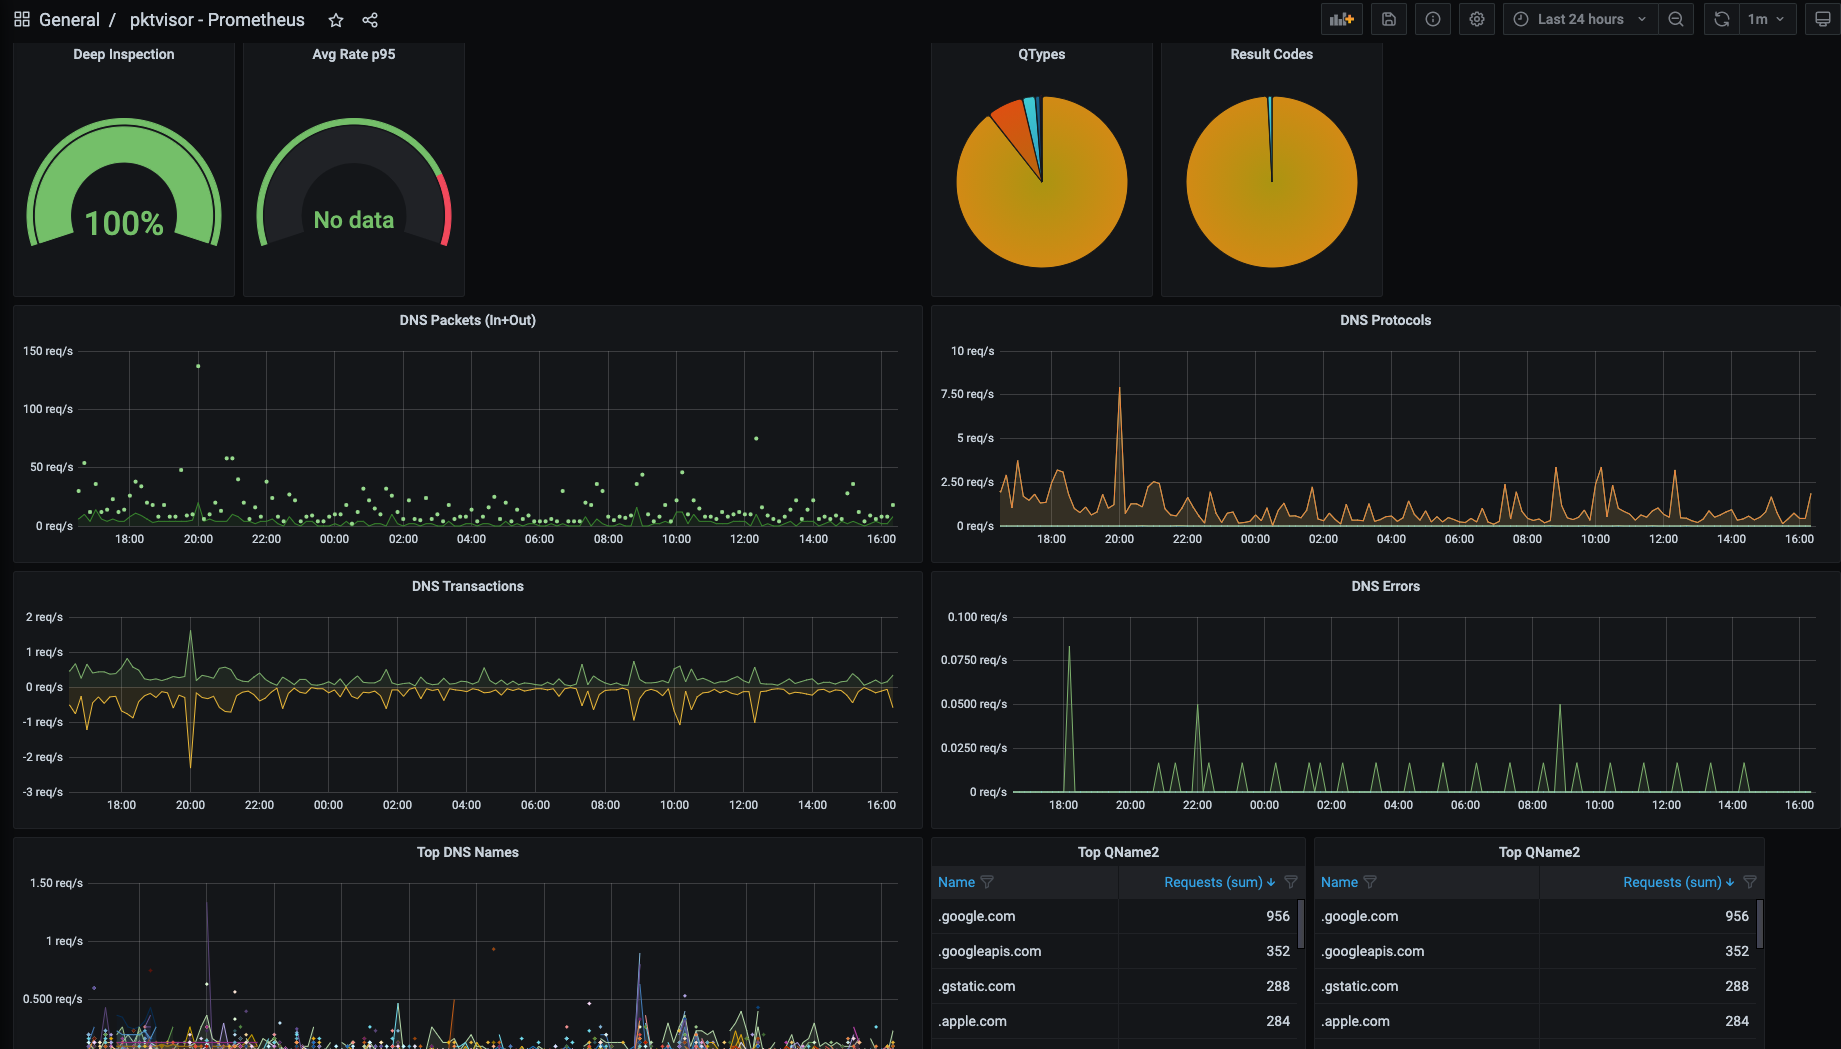 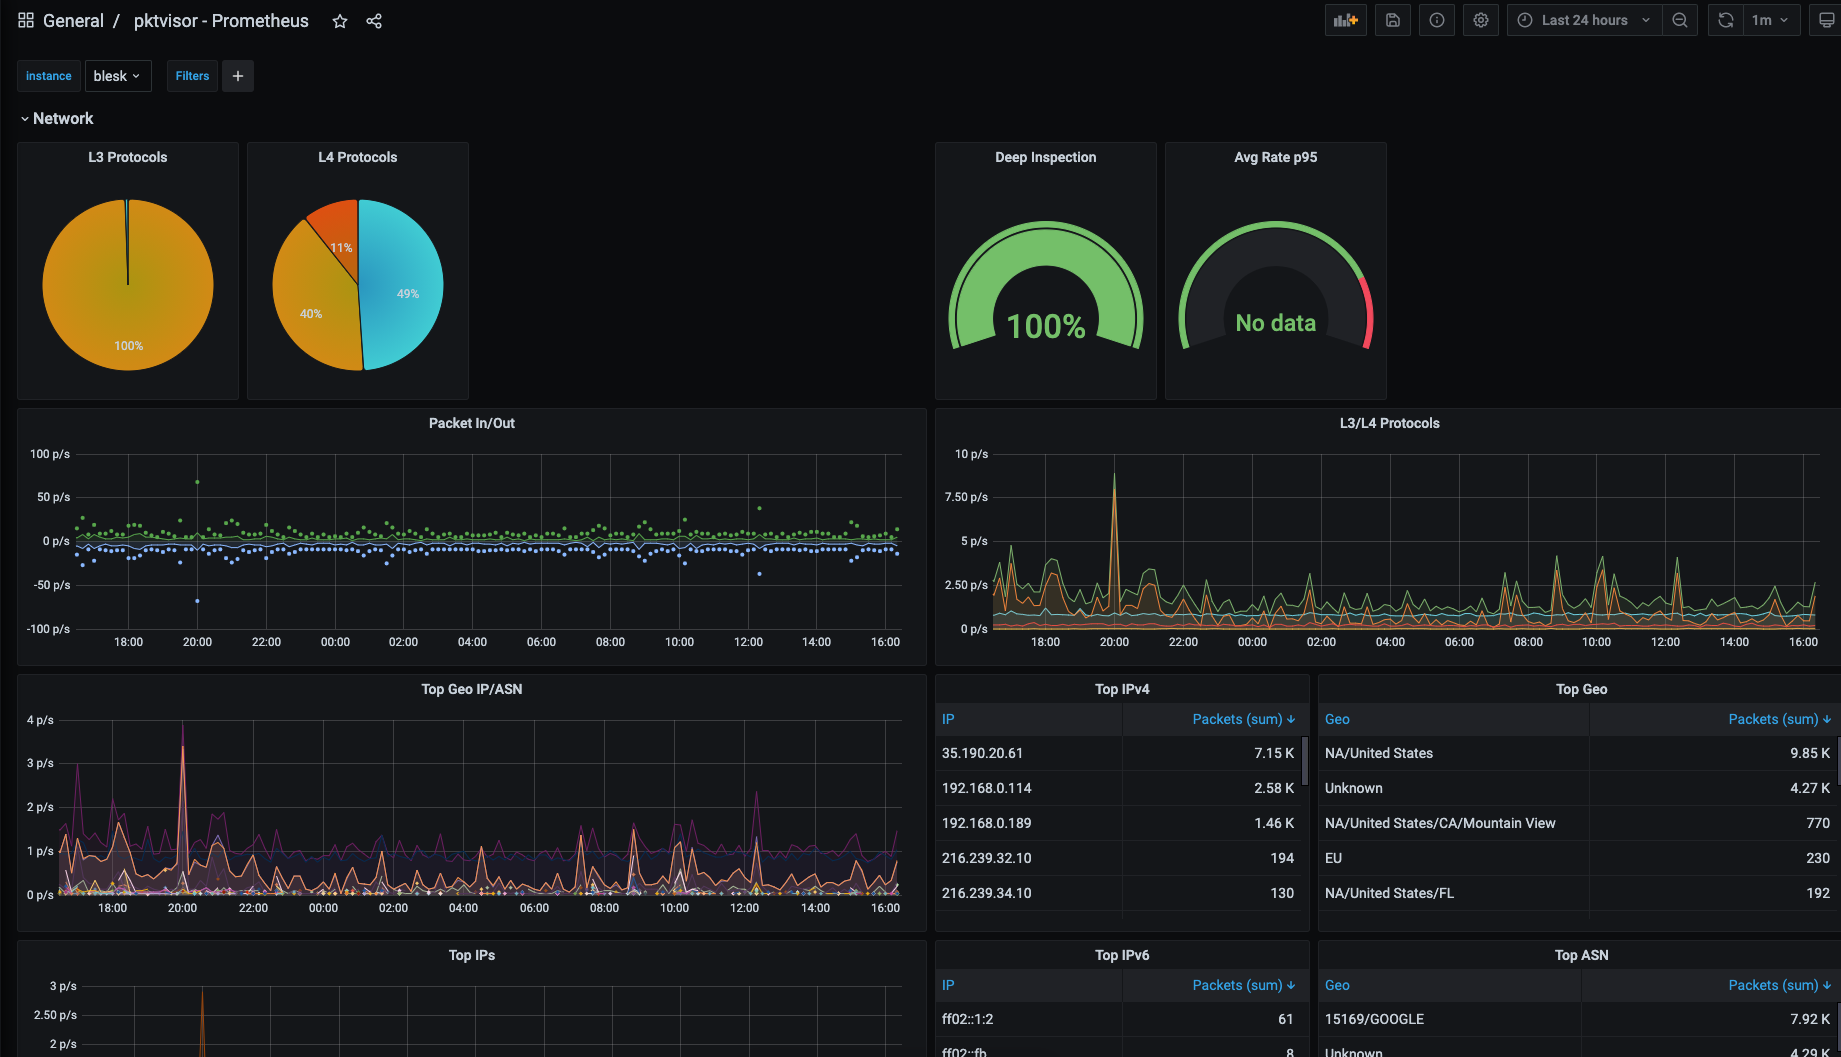 ## 快速开始 ### Docker 使用 pktvisor 最简单的方法之一是使用 [public docker image(公共 docker 镜像)](https://hub.docker.com/r/netboxlabs/pktvisor)。该镜像包含 collector agent(`pktvisord`)、command line UI(`pktvisor-cli`)以及 pcap 和 dnstap 文件分析器(`pktvisor-reader`)。运行 容器时,您可以指定要运行的工具。 1. *拉取容器* ``` docker pull netboxlabs/pktvisor ``` 或使用 `netboxlabs/pktvisor:latest-develop` 获取最新的开发版本。 2. *启动 collector agent* 这将在后台启动并保持运行。请注意,最后两个参数选择了 `pktvisord` agent 和 用于 packet capture(抓包)的 `eth0` 以太网接口。您可以将 `eth0` 替换为设备上的任何已知接口。 _请注意,此步骤需要 docker 主机网络_ 来观察容器外部的流量,并且 [目前仅 Linux 支持主机网络](https://docs.docker.com/network/host/): ``` docker run --net=host -d netboxlabs/pktvisor pktvisord eth0 ``` 如果容器没有保持运行,请检查 `docker logs` 输出。 3. *运行命令行 UI* agent 运行后,您可以使用随附的命令行 UI 在本地观察结果。此命令将在前台运行 UI(`pktvisor-cli`),并在按下 Ctrl-C 时退出。它使用内置的 REST API 连接到本地运行的 agent。 ``` docker run -it --rm --net=host netboxlabs/pktvisor pktvisor-cli ``` ### Linux 静态二进制文件 (AppImage, x86_64) 您也可以使用 Linux 一体化二进制文件,它是使用 [AppImage](https://appimage.org/) 构建的,可从 [Releases 页面](https://github.com/netboxlabs/pktvisor/releases) 下载。它设计用于所有现代 Linux 发行版,不需要安装或任何其他依赖项。 ``` curl -L http://pktvisor.com/download -o pktvisor-x86_64.AppImage chmod +x pktvisor-x86_64.AppImage ./pktvisor-x86_64.AppImage pktvisord -h ``` 例如,要在以太网接口 `eth0` 上运行 agent: ``` ./pktvisor-x86_64.AppImage pktvisord eth0 ``` AppImage 包含 collector agent(`pktvisord`)、command line UI(`pktvisor-cli`)以及 pcap 和 dnstap 文件 分析器(`pktvisor-reader`)。您可以通过将其作为第一个参数传递来指定要运行的工具: 例如,要使用 pktvisor 命令行 UI 可视化上面启动的正在运行的 agent: ``` ./pktvisor-x86_64.AppImage pktvisor-cli ``` 请注意,当运行 AppImage 版本的 agent 时,您可能需要使用 `-d` 参数来守护进程化(在后台运行),并使用 `--log-file` 或 `--syslog` 参数来记录日志。 另请参阅 [Advanced Agent Example(高级 Agent 示例)](#advanced-agent-example)。 ### Linux 静态二进制文件 (独立版, x86_64) 最后,pktvisor 还为每个单独的 pktvisor 工具(pktvisord、pktvisor-cli 和 pktvisor-reader)提供静态链接、无依赖的 Linux 二进制文件。这些是体积最小、最紧凑的二进制文件版本。 pktvisord: ``` curl -L http://pktvisor.com/download/pktvisord -o pktvisord-x86_64 chmod +x pktvisord-x86_64 ./pktvisord-x86_64 -h ``` pktvisor-cli: ``` curl -L http://pktvisor.com/download/cli -o pktvisor-cli-x86_64 chmod +x pktvisor-cli-x86_64 ./pktvisor-cli-x86_64 -h ``` pktvisor-reader: ``` curl -L http://pktvisor.com/download/reader -o pktvisor-reader-x86_64 chmod +x pktvisor-reader-x86_64 ./pktvisor-reader-x86_64 -h ``` ### 其他平台 我们正在努力支持其他操作系统、CPU 架构和打包系统。如果您没有看到您可用的二进制文件,请参阅下面的 [Build(构建)](#build) 部分以自行构建。 如果您有希望看到支持的偏好的安装方法,[请创建一个 issue](https://github.com/netboxlabs/pktvisor/issues/new)。 ### 无 Root 权限执行 Pktvisord 二进制文件 Pktvisord 使用 libpcap 从所需接口捕获 PCAP。为此,它需要系统网络捕获权限。 您可以仅授权一次这些特定要求,然后就可以在没有 `sudo` 的情况下运行二进制文件。 ``` sudo setcap cap_net_raw,cap_net_admin=eip /标签:API集成, API驱动, Bash脚本, DNSTap, GET参数, Grafana, IPFIX, NetFlow, OpenTelemetry, Packet Capture, pipx 安装, pip 包, sFlow, YAML配置, 可观测性, 安全研究社区, 实时分析, 性能监控, 指标采集, 日志审计, 用户代理, 网络观测, 自定义请求头, 请求拦截, 边缘计算