TwiN/gatus
GitHub: TwiN/gatus
一个面向开发者的服务健康仪表盘与多渠道告警系统,通过主动探测解决无流量时监控失效的问题。
Stars: 11544 | Forks: 773
[](https://gatus.io)

[](https://goreportcard.com/report/github.com/TwiN/gatus)
[](https://codecov.io/gh/TwiN/gatus)
[](https://github.com/TwiN/gatus)
[](https://cloud.docker.com/repository/docker/twinproduction/gatus)
[](https://github.com/TwiN)
Gatus 是一个面向开发者的健康仪表板,它赋予你使用 HTTP、ICMP、TCP 甚至 DNS 查询来监控服务的能力,并通过对状态码、
响应时间、证书到期时间、响应体等值的条件列表来评估查询结果。
最棒的是,每个健康检查都可以与 Slack、Teams、PagerDuty、Discord、Twilio 等多种告警方式配对。
我个人将其部署在我的 Kubernetes 集群中,并让它监控我的
核心应用程序:
参见[实时重载配置](#reloading-configuration-on-the-fly)。 | `false` | | `web` | [Web 配置](#web)。 | `{}` | | `ui` | [UI 配置](#ui)。 | `{}` | | `maintenance` | [维护配置](#maintenance)。 | `{}` | 如果你希望输出更详细的日志,可以将 `GATUS_LOG_LEVEL` 环境变量设置为 `DEBUG`。 相反,如果希望减少日志输出,可以将上述环境变量设置为 `WARN`、`ERROR` 或 `FATAL`。 `GATUS_LOG_LEVEL` 的默认值为 `INFO`。 ### 端点 端点是你想要监控的 URL、应用程序或服务。每个端点都有一个条件列表, 在指定的间隔上进行评估。如果任何条件失败,则该端点被视为不健康。 然后可以配置告警,以便在端点不健康达到某个阈值时触发。 | 参数 | 描述 | 默认值 | |:---|:---|:---| | `endpoints` | 要监控的端点列表。 | 必需 `[]` | | `endpoints[].enabled` | 是否监控该端点。 | `true` | | `endpoints[].name` | 端点名称。可以是任意值。 | 必需 `""` | | `endpoints[].group` | 组名称。用于在仪表板上将多个端点分组。
参见[端点分组](#endpoint-groups)。 | `""` | | `endpoints[].url` | 发送请求的 URL | 必需 `""` | | `endpoints[].method` | 请求方法。 | `GET` | | `endpoints[].conditions` | 用于确定端点健康状况的条件。
参见[条件](#conditions)。 | `[]` | | `endpoints[].interval` | 每次状态检查之间的持续时间。 | `60s` | | `endpoints[].graphql` | 是否将请求体包装为查询参数(`{"query":"$body"}`)。 | `false` | | `endpoints[].body` | 请求体。 | `""` | | `endpoints[].headers` | 请求头。 | `{}` | | `endpoints[].dns` | DNS 查询端点的配置。
参见[使用 DNS 查询监控端点](#monitoring-an-endpoint-using-dns-queries)。 | `""` | | `endpoints[].dns.query-type` | 查询类型(例如 MX)。 | `""` | | `endpoints[].dns.query-name` | 查询名称(例如 example.com)。 | `""` | | `endpoints[].ssh` | SSH 端点配置。
参见[使用 SSH 监控端点](#monitoring-an-endpoint-using-ssh)。 | `""` | | `endpoints[].ssh.username` | SSH 用户名(例如 example)。 | 必需 `""` | | `endpoints[].ssh.password` | SSH 密码(例如 password)。 | 必需 `""` | | `endpoints[].alerts` | 给定端点的所有告警列表。
参见[告警](#alerting)。 | `[]` | | `endpoints[].maintenance-windows` | 给定端点的所有维护窗口列表。
参见[维护](#maintenance)。 | `[]` | | `endpoints[].client` | [客户端配置](#client-configuration)。 | `{}` | | `endpoints[].ui` | 端点级别的 UI 配置。
参见[UI 配置](#ui)。 | `{}` | | `endpoints[].ui.hide-conditions` | 是否从结果中隐藏条件。请注意,这只会隐藏从启用此选项起评估的条件。 | `false` | | `endpoints[].ui.hide-hostname` | 是否从结果中隐藏主机名。 | `false` | | `endpoints[].ui.hide-port` | 是否从结果中隐藏端口。 | `false` | | `endpoints[].ui.hide-url` | 如果 URL 包含令牌,是否隐藏 URL。 | `false` | | `endpoints[].ui.hide-errors` | 是否从结果中隐藏错误。 | `false` | | `endpoints[].ui.dont-resolve-failed-conditions` | 是否在 UI 中解析失败的条件。 | `false` | | `endpoints[].ui.resolve-successful-conditions` | 是否在 UI 中解析成功的条件(有助于在检查通过时公开正文断言)。 | `false` | | `endpoints[].ui.badge.response-time` | 响应时间阈值列表。每当达到阈值时,徽章会显示不同的颜色。 | `[50, 200, 300, 500, 750]` | | `endpoints[].extra-labels` | 要添加到指标的额外标签。适用于将端点分组。 | `{}` | | `endpoints[].always-run` | (仅套件)即使套件中的先前端点失败,也是否执行此端点。 | `false` | | `endpoints[].store` | (仅套件)从响应中提取并存储在套件上下文中的值的映射(即使在失败时也存储)。 | `{}` | 你可以在请求体(`endpoints[].body`)中使用以下占位符: - `[ENDPOINT_NAME]`(从 `endpoints[].name` 解析) - `[ENDPOINT_GROUP]`(从 `endpoints[].group` 解析) - `[ENDPOINT_URL]`(从 `endpoints[].url` 解析) - `[LOCAL_ADDRESS]`(解析为本地 IP 和端口,例如 `192.0.2.1:25` 或 `[2001:db8::1]:80`) - `[RANDOM_STRING_N]`(解析为长度为 N 的随机字符串和字母(最大:8192)) ### 外部端点 与常规端点不同,外部端点不由 Gatus 监控,而是通过程序推送。 这允许你监控任何内容,即使所监控的内容在 Gatus 通常无法访问的环境中。 例如: - 你可以创建一个驻留在私有网络中的代理,并将你的服务状态推送到公开暴露的 Gatus 实例 - 你可以监控 Gatus 不支持的服务 - 你可以在使用 Gatus 作为仪表板的同时实现自己的监控系统 | 参数 | 描述 | 默认值 | |:---|:---|:---| | `external-endpoints` | 要监控的端点列表。 | `[]` | | `external-endpoints[].enabled` | 是否监控该端点。 | `true` | | `external-endpoints[].name` | 端点名称。可以是任意值。 | 必需 `""` | | `external-endpoints[].group` | 组名称。用于在仪表板上将多个端点分组。
参见[端点分组](#endpoint-groups)。 | `""` | | `external-endpoints[].token` | 推送状态所需的 Bearer 令牌。 | 必需 `""` | | `external-endpoints[].alerts` | 给定端点的所有告警列表。
参见[告警](#alerting)。 | `[]` | | `external-endpoints[].heartbeat` | 心跳配置,用于监控外部端点停止发送更新。 | `{}` | | `external-endpoints[].heartbeat.interval` | 期望的更新间隔。如果在此间隔内未收到更新,将触发告警。必须至少为 10 秒。 | `0`(禁用) | 示例: ``` external-endpoints: - name: ext-ep-test group: core token: "potato" heartbeat: interval: 30m # Automatically create a failure if no update is received within 30 minutes alerts: - type: discord description: "healthcheck failed" send-on-resolved: true ``` 要推送外部端点的状态,可以使用 [gatus-cli](https://github.com/TwiN/gatus-cli): ``` gatus-cli external-endpoint push --url https://status.example.org --key "core_ext-ep-test" --token "potato" --success ``` 或发送 HTTP 请求: ``` POST /api/v1/endpoints/{key}/external?success={success}&error={error}&duration={duration} ``` 其中: - `{key}` 的格式为 `_`,其中两个变量中的 ` `、`/`、`_`、`,`、`.`、`#`、`+` 和 `&` 都被替换为 `-`。
- 使用上面的示例配置,键将是 `core_ext-ep-test`。
- `{success}` 是一个布尔值(`true` 或 `false`),指示健康检查是否成功。
- `{error}`(可选):描述健康检查失败原因的字符串。如果 `{success}` 为 false,则应包含错误消息;如果检查成功,则忽略此字段。
- `{duration}`(可选):请求所花费的持续时间字符串(例如 `10s`)。
你还必须在 `Authorization` 头中传递 Bearer 令牌。
### 套件(ALPHA)
套件是一组按顺序执行的端点,它们共享一个上下文。
这允许你创建复杂的监控场景,其中一个端点的结果可用于后续端点,实现工作流风格的监控。
以下情况中套件可能有用:
- 测试多步骤身份验证流程(登录 -> 访问受保护资源 -> 注销)
- 需要串联请求的 API 工作流(创建资源 -> 更新 -> 验证 -> 删除)
- 监控跨多个服务的业务流程
- 验证多个端点之间的数据一致性
| 参数 | 描述 | 默认值 |
|:---|:---|:---|
| `suites` | 要监控的套件列表。 | `[]` |
| `suites[].enabled` | 是否监控套件。 | `true` |
| `suites[].name` | 套件名称。必须唯一。 | 必需 `""` |
| `suites[].group` | 组名称。用于在仪表板上将多个套件分组。 | `""` |
| `suites[].interval` | 套件执行之间的持续时间。 | `10m` |
| `suites[].timeout` |套件执行的最大持续时间。 | `5m` |
| `suites[].context` | 初始上下文值,可在端点中引用。 | `{}` |
| `suites[].endpoints` | 要按顺序执行的端点列表。 | 必需 `[]` |
| `suites[].endpoints[].store` | 从响应中提取并存储在套件上下文中的值的映射(即使在失败时也存储)。 | `{}` |
| `suites[].endpoints[].always-run` | 即使套件中先前的端点失败,也是否执行此端点。 | `false` |
**注意**:套件级别的告警目前不支持。请在套件内的单个端点上配置告警。
#### 在端点中使用上下文
一旦值存储在上下文中,它们就可以在后续端点中引用:
- 在 URL 中:`https://api.example.com/users/[CONTEXT].user_id`
- 在请求头中:`Authorization: Bearer [CONTEXT].auth_token`
- 在请求体中:`{"user_id": "[CONTEXT].user_id"}`
- 在条件中:`[BODY].server_ip == [CONTEXT].server_ip`
请注意,上下文/存储键仅限于 A-Z、a-z、0-9、下划线(`_`)和连字符(`-`)。
#### 套件配置示例
```
suites:
- name: item-crud-workflow
group: api-tests
interval: 5m
context:
price: "19.99" # Initial static value in context
endpoints:
# Step 1: Create an item and store the item ID
- name: create-item
url: https://api.example.com/items
method: POST
body: '{"name": "Test Item", "price": "[CONTEXT].price"}'
conditions:
- "[STATUS] == 201"
- "len([BODY].id) > 0"
- "[BODY].price == [CONTEXT].price"
store:
itemId: "[BODY].id"
alerts:
- type: slack
description: "Failed to create item"
# Step 2: Update the item using the stored item ID
- name: update-item
url: https://api.example.com/items/[CONTEXT].itemId
method: PUT
body: '{"price": "24.99"}'
conditions:
- "[STATUS] == 200"
alerts:
- type: slack
description: "Failed to update item"
# Step 3: Fetch the item and validate the price
- name: get-item
url: https://api.example.com/items/[CONTEXT].itemId
method: GET
conditions:
- "[STATUS] == 200"
- "[BODY].price == 24.99"
alerts:
- type: slack
description: "Item price did not update correctly"
# Step 4: Delete the item (always-run: true to ensure cleanup even if step 2 or 3 fails)
- name: delete-item
url: https://api.example.com/items/[CONTEXT].itemId
method: DELETE
always-run: true
conditions:
- "[STATUS] == 204"
alerts:
- type: slack
description: "Failed to delete item"
```
仅当所有必需端点通过其条件时,套件才会被视为成功。
### 条件
以下是一些可以使用的条件示例:
| 条件 | 描述 | 通过的值 | 失败的值 |
|:---|:---|:---|:---|
| `[STATUS] == 200` | 状态必须等于 200 | 200 | 201、404、... |
| `[STATUS] < 300` | 状态必须小于 300 | 200、201、299 | 301、302、... |
| `[STATUS] <= 299` | 状态必须小于或等于 299 | 200、201、299 | 301、302、... |
| `[STATUS] > 400` | 状态必须大于 400 | 401、402、403、404 | 400、200、... |
| `[STATUS] == any(200, 429)` | 状态必须等于 200 或 429 | 200、429 | 201、400、... |
| `[CONNECTED] == true` | 必须成功建立与主机的连接 | `true` | `false` |
| `[RESPONSE_TIME] < 500` | 响应时间必须低于 500 毫秒 | 100 毫秒、200 毫秒、300 毫秒 | 500 毫秒、501 毫秒 |
| `[IP] == 127.0.0.1` | 目标 IP 必须为 127.0.0.1 | 127.0.0.1 | 0.0.0.0 |
| `[BODY] == 1` | 请求体必须等于 1 | 1 | `{}`、`2`、... |
| `[BODY].user.name == john` | JSONPath 值 `$.user.name` 等于 `john` | `{"user":{"name":"john"}}` | |
| `[BODY].data[0].id == 1` | JSONPath 值 `$.data[0].id` 等于 1 | `{"data":[{"id":1}]}` | |
| `[BODY].age == [BODY].id` | JSONPath 值 `$.age` 等于 JSONPath `$.id` | `{"age":1,"id":1}` | |
| `len([BODY].data) < 5` | JSONPath `$.data` 的数组长度小于 5 | `{"data":[{"id":1}]}` | |
| `len([BODY].name) == 8` | JSONPath `$.name` 的字符串长度等于 8 | `{"name":"john.doe"}` | `{"name":"bob"}` |
| `has([BODY].errors) == false` | JSONPath `$.errors` 不存在 | `{"name":"john.doe"}` | `{"errors":[]}` |
| `has([BODY].users) == true` | JSONPath `$.users` 存在 | `{"users":[]}` | `{}` |
| `[BODY].name == pat(john*)` | JSONPath `$.name` 匹配模式 `john*` | `{"name":"john.doe"}` | `{"name":"bob"}` |
| `[BODY].id == any(1, 2)` | JSONPath `$.id` 等于 `1` 或 `2` | 1、2 | 3、4、5 |
| `[CERTIFICATE_EXPIRATION] > 48h` | 证书到期时间超过 48 小时 | 49 小时、50 小时、123 小时 | 1 小时、24 小时、... |
| `[DOMAIN_EXPIRATION] > 720h` | 域名到期时间超过 720 小时 | 4000 小时 | 1 小时、24 小时、... |
#### 占位符
| 占位符 | 描述 | 解析示例 |
|--------|------|----------|
| `[STATUS]` | 解析为 HTTP 状态码 | `404` |
| `[RESPONSE_TIME]` | 解析为请求耗时(毫秒) | `10` |
| `[IP]` | 解析为目标主机 IP | `192.168.0.232` |
| `[BODY]` | 解析为响应体(支持 JSONPath) | `{"name":"john.doe"}` |
| `[CONNECTED]` | 解析为是否连接成功 | `true` |
| `[CERTIFICATE_EXPIRATION]` | 解析为证书到期时间(有效单位:`s`、`m`、`h`) | `24h`、`48h`、0(若无证书) |
| `[DOMAIN_EXPIRATION]` | 解析为域名到期时间(有效单位:`s`、`m`、`h`) | `24h`、`48h`、1234h56m78s |
| `[DNS_RCODE]` | 解析为 DNS 响应码 | `NOERROR` |
#### 函数
| 函数 | 描述 | 示例 |
|------|------|------|
| `len` | 若路径指向数组,返回其长度;否则将 JSON 在给定路径处的值压缩为字符串并返回其字符数。仅适用于 `[BODY]` 占位符。 | `len([BODY].username) > 8` |
| `has` | 根据给定路径是否存在,返回 `true` 或 `false`。仅适用于 `[BODY]` 占位符。 | `has([BODY].errors) == false` |
| `pat` | 指定字符串参数应作为模式进行评估。仅适用于 `==` 和 `!=`。 | `[IP] == pat(192.168.*)` |
| `any` | 指定多个参数中任意一个为有效值。仅适用于 `==` 和 `!=`。 | `[BODY].ip == any(127.0.0.1, ::1)` |
### Web
允许你配置仪表板的服务方式和访问位置。
| 参数 | 描述 | 默认值 |
|:---|:---|:---|
| `web` | Web 配置 | `{}` |
| `web.address` | 监听地址。 | `0.0.0.0` |
| `web.port` | 监听端口。 | `8080` |
| `web.read-buffer-size` | 从连接读取请求的缓冲区大小。同时限制最大请求头大小。 | `8192` |
| `web.tls.certificate-file` | 用于 TLS 的可选公开证书文件(PE 格式)。 | `""` |
| `web.tls.private-key-file` | 用于 TLS 的可选私钥文件(PEM 格式)。 | `""` |
### UI
允许你配置仪表板的全局默认 UI 设置。部分参数可被用户通过浏览器本地存储覆盖。
| 参数 | 描述 | 默认值 |
|:---|:---|:---|
| `ui` | UI 配置 | `{}` |
| `ui.title` | 文档标题。 | `Health Dashboard ǀ Gatus` |
| `ui.description` | 页面描述。 | `Gatus is an advanced...` |
| `ui.dashboard-heading` | 仪表板标题,位于页眉和端点之间。 | `Health Dashboard` |
| `ui.dashboard-subheading` | 仪表板描述,位于页眉和端点之间。 | `Monitor the health of your endpoints in real-time` |
| `ui.header` | 仪表板页眉。同时用作 OIDC 登录页面的标题。 | `Gatus` |
| `ui.logo` | 要显示的 Logo URL。登录页上会显示在 Gatus Logo 旁边。 | `""` |
| `ui.link` | 点击 Logo 时打开的链接。 | `""` |
| `ui.favicon.default` | 浏览器标签页中的默认图标。 | `/favicon.ico` |
| `ui.favicon.size16x16` | 16x16 尺寸的图标。 | `/favicon-16x16.png` |
| `ui.favicon.size32x32` | 32x32 尺寸的图标。 | `/favicon-32x32.png` |
| `ui.buttons` | 位于页眉下方的按钮列表。 | `[]` |
| `ui.buttons[].name` | 按钮文本。 | 必需 `""` |
| `ui.buttons[].link` | 点击按钮打开的链接。 | 必需 `""` |
| `ui.custom-css` | 自定义 CSS。 | `""` |
| `ui.dark-mode` | 默认启用深色模式。取决于操作系统主题偏好。 | `true` |
| `ui.default-sort-by` | 仪表板端点默认排序方式。可选 `name`、`group` 或 `health`。用户偏好会覆盖此设置。 | `name` |
| `ui.default-filter-by` | 仪表板端点默认筛选方式。可选 `none`、`failing` 或 `unstable`。用户偏好会覆盖此设置。 | `none` |
| `ui.login-subtitle` | OIDC 登录页面副标题。 | `System Monitoring Dashboard` |
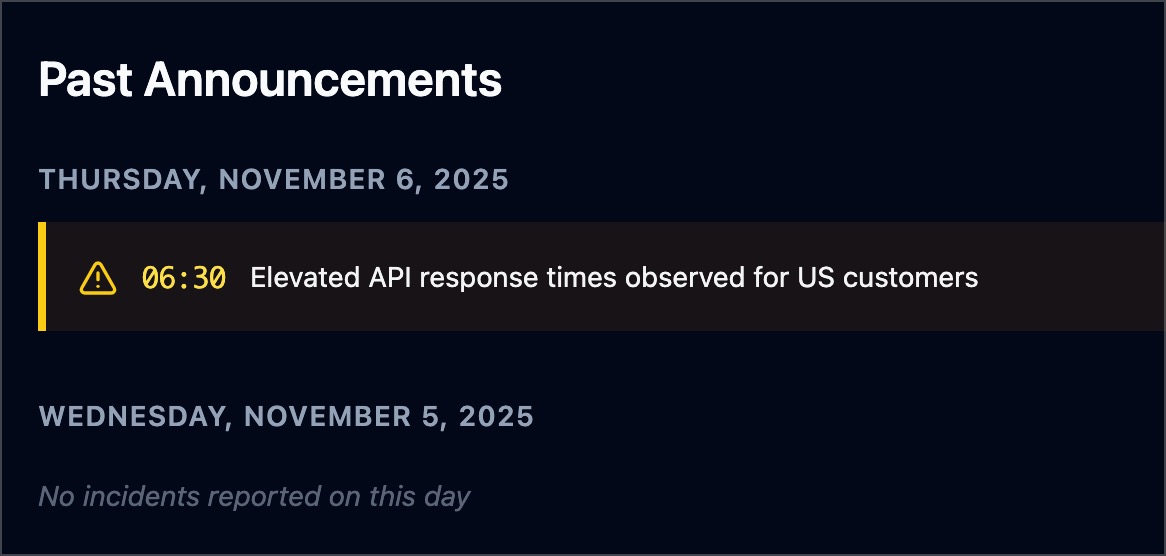
### 公告
系统范围的公告允许你在状态页顶部显示重要消息。可用于通知计划维护、正在进行的故障或一般信息。你可以使用 Markdown 格式化公告。
这本质上是某些状态页面所称的“事件通讯”。
| 参数 | 描述 | 默认值 |
|:---|:---|:---|
| `announcements` | 要显示的公告列表。 | `[]` |
| `announcements[].timestamp` | 公告发布时间(RFC3339 格式)。 | 必需 |
| `announcements[].type` | 公告类型。有效值:`outage`、`warning`、`information`、`operational`、`none`。 | `"none"` |
| `announcements[].message` | 要显示给用户的消息。 | 必需 |
| `announcements[].archived` | 是否归档该公告。归档的公告会显示在状态页底部,而不是顶部。 | `false` |
类型:
- **outage**:表示服务中断或关键问题(红色主题)
- **warning**:表示潜在问题或重要通知(黄色主题)
- **information**:一般信息或更新(蓝色主题)
- **operational**:表示已解决的问题或正常操作(绿色主题)
- **none**:无特定严重性的中性公告(灰色主题),未指定时默认为此类型
示例配置:
```
announcements:
- timestamp: 2025-11-07T14:00:00Z
type: outage
message: "Scheduled maintenance on database servers from 14:00 to 16:00 UTC"
- timestamp: 2025-11-07T16:15:00Z
type: operational
message: "Database maintenance completed successfully. All systems operational."
- timestamp: 2025-11-07T12:00:00Z
type: information
message: "New monitoring dashboard features will be deployed next week"
- timestamp: 2025-11-06T09:00:00Z
type: warning
message: "Elevated API response times observed for US customers"
archived: true
```
如果至少有一个公告被归档,状态页底部将显示 **过往公告** 部分:
### 存储
| 参数 | 描述 | 默认值 |
|:---|:---|---|
| `storage` | 存储配置。 | `{}` |
| `storage.path` | 数据持久化路径。仅支持 `sqlite` 和 `postgres` 类型。 | `""` |
| `storage.type` | 存储类型。有效值:`memory`、`sqlite`、`postgres`。 | `"memory"` |
| `storage.caching` | 是否启用写穿透缓存。提升大型仪表板的加载速度。
仅当 `storage.type` 为 `sqlite` 或 `postgres` 时有效。 | `false` | | `storage.maximum-number-of-results` | 每个端点结果的最大数量。 | `100` | | `storage.maximum-number-of-events` | 每个端点事件的最大数量。 | `50` | 每个端点的健康检查结果以及正常运行时间和事件数据必须持久化, 以便在仪表板上显示。这些参数允许你配置相应的存储。 - 如果 `storage.type` 为 `memory`(默认): ``` # 请注意,这是默认值,您可以完全省略存储配置以达到相同的结果。 # 因为数据存储在内存中,所以数据在重启后不会保留。 storage: type: memory maximum-number-of-results: 200 maximum-number-of-events: 5 ``` - 如果 `storage.type` 为 `sqlite`,`storage.path` 不能为空: ``` storage: type: sqlite path: data.db ``` 参见 [examples/docker-compose-sqlite-storage](.examples/docker-compose-sqlite-storage) 获取示例。 - 如果 `storage.type` 为 `postgres`,`storage.path` 必须为连接 URL: ``` storage: type: postgres path: "postgres://user:password@127.0.0.1:5432/gatus?sslmode=disable" ``` 参见 [examples/docker-compose-postgres-storage](.examples/docker-compose-postgres-storage) 获取示例。 ### 客户端配置 为了支持广泛的环境,每个被监控的端点都有独立的客户端配置用于发送请求。 | 参数 | 描述 | 默认值 | |:---|:---|:---| | `client.insecure` | 是否跳过验证服务器证书链和主机名。 | `false` | | `client.ignore-redirect` | 是否忽略重定向(`true`)或跟随重定向(`false`,默认)。 | `false` | | `client.timeout` | 超时时间。 | `10s` | | `client.dns-resolver` | 使用 `{proto}://{host}:{port}` 格式覆盖 DNS 解析器。 | `""` | | `client.oauth2` | OAuth2 客户端配置。 | `{}` | | `client.oauth2.token-url` | 令牌端点 URL。 | 必需 `""` | | `client.oauth2.client-id` | 用于 `Client credentials flow` 的客户端 ID。 | 必需 `""` | | `client.oauth2.client-secret` | 用于 `Client credentials flow` 的客户端密钥。 | 必需 `""` | | `client.oauth2.scopes[]` | 用于 `Client credentials flow` 的作用域列表。 | 必需 `[""]` | | `client.proxy-url` | 使用的代理 URL。 | `""` | | `client.identity-aware-proxy` | Google Identity-Aware-Proxy 客户端配置。 | `{}` | | `client.tls.certificate-file` | 用于 mTLS 的客户端证书(PEM 格式)。 | `""` | | `client.tls.private-key-file` | 用于 mTLS 的客户端私钥(PEM 格式)。 | `""` | | `client.tls.renegotiation` | 提供的重协商支持类型(`never`、`freely`、`once`)。 | `"never"` | | `client.network` | ICMP 端点客户端使用的网络(`ip`、`ip4` 或 `ip6`)。 | `"ip"` | | `client.tunnel` | 用于此端点的 SSH 隧道名称。参见[隧道](#tunneling)。 | `""` | 此默认配置如下: ``` client: insecure: false ignore-redirect: false timeout: 10s ``` 请注意,此配置仅在 `endpoints[]`、`alerting.mattermost` 和 `alerting.custom` 下可用。 以下是 `endpoints[]` 中客户端配置的示例: CODE_BLOCK_14/> 此示例展示了如何指定自定义 DNS 解析器: ``` endpoints: - name: with-custom-dns-resolver url: "https://your.health.api/health" client: dns-resolver: "tcp://8.8.8.8:53" conditions: - "[STATUS] == 200" ``` 此示例展示了如何使用 `client.oauth2` 配置查询带有 Bearer 令牌的后端 API: ``` endpoints: - name: with-custom-oauth2 url: "https://your.health.api/health" client: oauth2: token-url: https://your-token-server/token client-id: 00000000-0000-0000-0000-000000000000 client-secret: your-client-secret scopes: ['https://your.health.api/.default'] conditions: - "[STATUS] == 200" ``` 此示例展示了如何使用 `client.identity-aware-proxy` 配置查询带有 Bearer 令牌的后端 API(使用 Google Identity-Aware-Proxy): ``` endpoints: - name: with-custom-iap url: "https://my.iap.protected.app/health" client: identity-aware-proxy: audience: "XXXXXXXX-XXXXXXXXXXXX.apps.googleusercontent.com" conditions: - "[STATUS] == 200" ``` 此示例展示了如何使用 `client.tls` 配置对后端 API 执行 mTLS 查询: ``` endpoints: - name: website url: "https://your.mtls.protected.app/health" client: tls: certificate-file: /path/to/user_cert.pem private-key-file: /path/to/user_key.pem renegotiation: once conditions: - "[STATUS] == 200" ``` ### 隧道 Gatus 支持 SSH 隧道以通过跳板主机或堡垒服务器监控内部服务。 这对于无法直接从 Gatus 部署位置访问的服务特别有用。 SSH 隧道在 `tunneling` 部分全局定义,然后在端点的客户端配置中按名称引用。 | 参数 | 描述 | 默认值 | |:---|:---|:---| | `tunneling` | SSH 隧道配置。 | `{}` | | `tunneling.` | 命名 SSH 隧道的配置。 | `{}` |
| `tunneling..type` | 隧道类型(目前仅支持 `SSH`)。 | 必需 `""` |
| `tunneling..host` | SSH 服务器主机名或 IP 地址。 | 必需 `""` |
| `tunneling..port` | SSH 服务器端口。 | `22` |
| `tunneling..username` | SSH 用户名。 | 必需 `""` |
| `tunneling..password` | SSH 密码(使用此选项或私钥)。 | `""` |
| `tunneling..private-key` | SSH 私钥(PEM 格式,使用此选项或密码)。 | `""` |
| `client.tunnel` | 要用于此端点的隧道名称。 | `""` |
```
tunneling:
production:
type: SSH
host: "jumphost.example.com"
username: "monitoring"
private-key: |
-----BEGIN RSA PRIVATE KEY-----
MIIEpAIBAAKCAQEA...
-----END RSA PRIVATE KEY-----
endpoints:
- name: "internal-api"
url: "http://internal-api.example.com:8080/health"
client:
tunnel: "production"
conditions:
- "[STATUS] == 200"
```
### 告警
Gatus 支持多种告警提供者,例如 Slack 和 PagerDuty,并为每个
端点配置不同的告警(可配置描述和阈值)。
告警在端点级别配置,方式如下:
| 参数 | 描述 | 默认值 |
|:---|:---|---|
| `alerts` | 给定端点的所有告警列表。 | `[]` |
| `alerts[].type` | 告警类型。
参见下表获取所有有效类型。 | 必需 `""` | | `alerts[].enabled` | 是否启用该告警。 | `true` | | `alerts[].failure-threshold` | 连续失败次数达到该值后触发告警。 | `3` | | `alerts[].success-threshold` | 连续成功次数达到该值后标记问题已解决。 | `2` | | `alerts[].minimum-reminder-interval` | 告警提醒的最小间隔时间。例如 `"30m"`、`"1h45m30s"` 或 `"24h"`。如果为空或为 `0`,则禁用提醒。不得低于 `5m`。 | `0` | | `alerts[].send-on-resolved` | 告警解决后是否发送通知。 | `false` | | `alerts[].description` | 告警描述。将在发送的告警中包含。 | `""` | | `alerts[].provider-override` | 针对该告警类型覆盖全局提供者配置。 | `{}` | 以下是端点级别的告警配置示例: ``` endpoints: - name: example url: "https://example.org" conditions: - "[STATUS] == 200" alerts: - type: slack description: "healthcheck failed" send-on-resolved: true ``` 你也可以通过 `alerts[].provider-override` 全局覆盖提供者配置,例如: ``` endpoints: - name: example url: "https://example.org" conditions: - "[STATUS] == 200" alerts: - type: slack provider-override: webhook-url: "https://hooks.slack.com/services/**********/**********/**********" ``` | 参数 | 描述 | 默认值 | |:---|:---|---| | `alerting.awsses` | `aws-ses` 类型告警的配置。
参见[配置 AWS SES 告警](#configuring-aws-ses-alerts)。 | `{}` | | `alerting.clickup` | `clickup` 类型告警的配置。
参见[配置 ClickUp 告警](#configuring-clickup-alerts)。 | `{}` | | `alerting.custom` | 自定义动作在失败或告警时的配置。
参见[配置自定义告警](#configuring-custom-alerts)。 | `{}` | | `alerting.datadog` | `datadog` 类型告警的配置。
参见[配置 Datadog 告警](#configuring-datadog-alerts)。 | `{}` | | `alerting.discord` | `discord` 类型告警的配置。
参见[配置 Discord 告警](#configuring-discord-alerts)。 | `{}` | | `alerting.email` | `email` 类型告警的配置。
参见[配置 Email 告警](#configuring-email-alerts)。 | `{}` | | `alerting.gitea` | `gitea` 类型告警的配置。
参见[配置 Gitea 告警](#configuring-gitea-alerts)。 | `{}` | | `alerting.github` | `github` 类型告警的配置。
参见[配置 GitHub 告警](#configuring-github-alerts)。 | `{}` | | `alerting.gitlab` | `gitlab` 类型告警的配置。
参见[配置 GitLab 告警](#configuring-gitlab-alerts)。 | `{}` | | `alerting.googlechat` | `googlechat` 类型告警的配置。
参见[配置 Google Chat 告警](#configuring-google-chat-alerts)。 | `{}` | | `alerting.gotify` | `gotify` 类型告警的配置。
参见[配置 Gotify 告警](#configuring-gotify-alerts)。 | `{}` | | `alerting.homeassistant` | `homeassistant` 类型告警的配置。
参见[配置 HomeAssistant 告警](#configuring-homeassistant-alerts)。 | `{}` | | `alerting.ifttt` | `ifttt` 类型告警的配置。
参见[配置 IFTTT 告警](#configuring-ifttt-alerts)。 | `{}` | | `alerting.ilert` | `ilert` 类型告警的配置。
参见[配置 Ilert 告警](#configuring-ilert-alerts)。 | `{}` | | `alerting.incident-io` | `incident-io` 类型告警的配置。
参见[配置 Incident.io 告警](#configuring-incidentio-alerts)。 | `{}` | | `alerting.line` | `line` 类型告警的配置。
参见[配置 Line 告警](#configuring-line-alerts)。 | `{}` | | `alerting.matrix` | `matrix` 类型告警的配置。
参见[配置 Matrix 告警](#configuring-matrix-alerts)。 | `{}` | | `alerting.mattermost` | `mattermost` 类型告警的配置。
参见[配置 Mattermost 告警](#configuring-mattermost-alerts)。 | `{}` | | `alerting.messagebird` | `messagebird` 类型告警的配置。
参见[配置 Messagebird 告警](#configuring-messagebird-alerts)。 | `{}` | | `alerting.n8n` | `n8n` 类型告警的配置。
参见[配置 n8n 告警](#configuring-n8n-alerts)。 | `{}` | | `alerting.newrelic` | `newrelic` 类型告警的配置。
参见[配置 New Relic 告警](#configuring-new-relic-alerts)。 | `{}` | | `alerting.ntfy` | `ntfy` 类型告警的配置。
参见[配置 Ntfy 告警](#conditions)。 | `{}` | | `alerting.opsgenie` | `opsgenie` 类型告警的配置。
参见[配置 Opsgenie 告警](#configuring-opsgenie-alerts)。 | `{}` | | `alerting.pagerduty` | `pagerduty` 类型告警的配置。
参见[配置 PagerDuty 告警](#configuring-pagerduty-alerts)。 | `{}` | | `alerting.plivo` | `plivo` 类型告警的配置。
参见[配置 Plivo 告警](#configuring-plivo-alerts)。 | `{}` | | `alerting.pushover` | `pushover` 类型告警的配置。
参见[配置 Pushover 告警](#configuring-pushover-alerts)。 | `{}` | | `alerting.rocketchat` | `rocketchat` 类型告警的配置。
参见[配置 Rocket.Chat 告警](#configuring-rocketchat-alerts)。 | `{}` | | `alerting.sendgrid` | `sendgrid` 类型告警的配置。
参见[配置 SendGrid 告警](#configuring-sendgrid-alerts)。 | `{}` | | `alerting.signal` | `signal` 类型告警的配置。
参见[配置 Signal 告警](#configuring-signal-alerts)。 | `{}` | | `alerting.signl4` | `signl4` 类型告警的配置。
参见[配置 SIGNL4 告警](#configuring-signl4-alerts)。 | `{}` | | `alerting.slack` | `slack` 类型告警的配置。
参见[配置 Slack 告警](#configuring-slack-alerts)。 | `{}` | | `alerting.splunk` | `splunk` 类型告警的配置。
参见[配置 Splunk 告警](#configuring-splunk-alerts)。 | `{}` | | `alerting.squadcast` | `squadcast` 类型告警的配置。
参见[配置 Squadcast 告警](#configuring-squadcast-alerts)。 | `{}` | | `alerting.teams` | `teams` 类型告警的配置。*(已弃用)*
参见[配置 Teams 告警](#configuring-teams-alerts-deprecated)。 | `{}` | | `alerting.teams-workflows` | `teams-workflows` 类型告警的配置。
参见[配置 Teams Workflow 告警](#configuring-teams-workflow-alerts)。 | `{}` | | `alerting.telegram` | `telegram` 类型告警的配置。
参见[配置 Telegram 告警](#configuring-telegram-alerts)。 | `{}` | | `alerting.twilio` | `twilio` 类型告警的配置。
参见[配置 Twilio 告警](#configuring-twilio-alerts)。 | `{}` | | `alerting.vonage` | `vonage` 类型告警的配置。
参见[配置 Vonage 告警](#configuring-vonage-alerts)。 | `{}` | | `alerting.webex` | `webex` 类型告警的配置。
参见[配置 Webex 告警](#configuring-webex-alerts)。 | `{}` | | `alerting.zapier` | `zapier` 类型告警的配置。
参见[配置 Zapier 告警](#configuring-zapier-alerts)。 | `{}` | | `alerting.zulip` | `zulip` 类型告警的配置。
参见[配置 Zulip 告警](#configuring-zulip-alerts)。 | `{}` | #### 配置 AWS SES 告警 | 参数 | 描述 | 默认值 | |:---|:---|---| | `alerting.aws-ses` | `aws-ses` 类型告警的配置。
参见[配置 AWS SES 告警](#configuring-aws-ses-alerts)。 | `{}` | | `alerting.aws-ses.access-key-id` | AWS Access Key ID。 | 可选 `""` | | `alerting.aws-ses.secret-access-key` | AWS Secret Access Key。 | 可选 `""` | | `alerting.aws-ses.region` | AWS 区域。 | 必需 `""` | | `alerting.aws-ses.from` | 发送邮件的邮箱地址(需在 SES 中注册)。 | 必需 `""` | | `alerting.aws-ses.to` | 逗号分隔的收件人邮箱地址列表。 | 必需 `""` | | `alerting.aws-ses.default-alert` | 默认告警配置。
参见[设置默认告警](#setting-a-default-alert)。 | N/A | | `alerting.aws-ses.overrides` | 可能优先于默认配置的覆盖列表。 | `[]` | | `alerting.aws-ses.overrides[].group` | 该配置将覆盖此组端点的配置。 | `""` | | `alerting.aws-ses.overrides[].*` | 参考 `alerting.aws-ses.*` 参数。 | `{}` | 如果 `access-key-id` 和 `secret-access-key` 未定义,Gatus 将回退到 IAM 身份验证。 确保你有 `ses:SendEmail` 权限。 #### 配置 ClickUp 告警 | 参数 | 描述 | 默认值 | |:---|:---|---| | `alerting.clickup` | `clickup` 类型告警的配置。 | `{}` | | `alerting.clickup.list-id` | ClickUp 列表 ID,用于创建任务。 | 必需 `""` | | `alerting.clickup.token` | ClickUp API 令牌。 | 必需 `""` | | `alerting.clickup.api-url` | 自定义 API URL。 | `https://api.clickup.com/api/v2` | | `alerting.clickup.assignees` | 要指派的任务用户 ID 列表。 | `[]` | | `alerting.clickup.status` | 创建任务的初始状态。 | `""` | | `alerting.clickup.priority` | 优先级:`urgent`、`high`、`normal`、`low` 或 `none`。 | `normal` | | `alerting.clickup.notify-all` | 创建任务时是否通知所有指派用户。 | `true` | | `alerting.clickup.name` | 自定义任务名称模板(支持占位符)。 | `Health Check: [ENDPOINT_GROUP]:[ENDPOINT_NAME]` | | `alerting.clickup.content` | 自定义任务内容模板(支持占位符)。 | `Triggered: [ENDPOINT_GROUP] - [ENDPOINT_NAME] - [ALERT_DESCRIPTION] - [RESULT_ERRORS]` | | `alerting.clickup.default-alert` | 默认告警配置。
参见[设置默认告警](#setting-a-default-alert)。 | N/A | | `alerting.clickup.overrides` | 可能优先于默认配置的覆盖列表。 | `[]` | | `alerting.clickup.overrides[].group` | 将由此配置覆盖配置的端点组 | `""` | | `alerting.clickup.overrides[].*` | 请参见 `alerting.clickup.*` 参数 | `{}` | ClickUp 警报提供者在 ClickUp 列表中创建任务,当触发警报时。如果将端点警报的 `send-on-resolved` 设置为 `true`,任务将在警报解决后自动关闭。 `name` 和 `content` 中支持以下占位符: - `[ENDPOINT_GROUP]` - 从 `endpoints[].group` 解析 - `[ENDPOINT_NAME]` - 从 `endpoints[].name` 解析 - `[ALERT_DESCRIPTION]` - 从 `endpoints[].alerts[].description` 解析 - `[RESULT_ERRORS]` - 从健康评估错误解析 ``` alerting: clickup: list-id: "123456789" token: "pk_xxxxxxxxxxxxxxxxxxxxxxxxxxxxxxxx" assignees: - "12345" - "67890" status: "in progress" priority: high name: "Health Check Alert: [ENDPOINT_GROUP] - [ENDPOINT_NAME]" content: "Alert triggered for [ENDPOINT_GROUP] - [ENDPOINT_NAME] - [ALERT_DESCRIPTION] - [RESULT_ERRORS]" endpoints: - name: website url: "https://twin.sh/health" interval: 5m conditions: - "[STATUS] == 200" alerts: - type: clickup send-on-resolved: true ``` 要获取您的 ClickUp API 令牌,请参考:[生成或重新生成个人 API 令牌](https://developer.clickup.com/docs/authentication#:~:text=the%20API%20docs.-,Generate%20or%20regenerate%20a%20Personal%20API%20Token,-Log%20in%20to) 要查找您的列表 ID: 1. 打开您希望创建任务的 ClickUp 列表 2. 列表 ID 位于 URL 中:`https://app.clickup.com/{workspace_id}/v/l/li/{list_id}` 要查找指派者 ID: 1. 访问 `https://app.clickup.com/{workspace_id}/teams-pulse/teams/people` 2. 悬停在团队成员上 3. 点击三个点(更多菜单) 4. 点击 `Copy member ID` #### 配置 Datadog 警报 | 参数 | 描述 | 默认值 | |------|------|--------| | `alerting.datadog` | `datadog` 类型警报的配置 | `{}` | | `alerting.datadog.api-key` | Datadog API 密钥 | 必填 `""` | | `alerting.datadog.site` | Datadog 站点(例如 datadoghq.com、datadoghq.eu) | `"datadoghq.com"` | | `alerting.datadog.tags` | 要包含的附加标签 | `[]` | | `alerting.datadog.default-alert` | 默认警报配置。
请参见 [设置默认警报](#setting-a-default-alert) | N/A | | `alerting.datadog.overrides` | 可能优先于默认配置的覆盖列表 | `[]` | | `alerting.datadog.overrides[].group` | 将由此配置覆盖配置的端点组 | `""` | | `alerting.datadog.overrides[].*` | 请参见 `alerting.datadog.*` 参数 | `{}` | ``` alerting: datadog: api-key: "YOUR_API_KEY" site: "datadoghq.com" # or datadoghq.eu for EU region tags: - "environment:production" - "team:platform" endpoints: - name: website url: "https://twin.sh/health" interval: 5m conditions: - "[STATUS] == 200" alerts: - type: datadog send-on-resolved: true ``` #### 配置 Discord 警报 | 参数 | 描述 | 默认值 | |------|------|--------| | `alerting.discord` | `discord` 类型警报的配置 | `{}` | | `alerting.discord.webhook-url` | Discord Webhook URL | 必填 `""` | | `alerting.discord.title` | 通知标题 | `":helmet_with_white_cross: Gatus"` | | `alerting.discord.message-content` | 在嵌入之前发送的消息内容(用于提及用户/角色,例如 `<@123>`) | `""` | | `alerting.discord.default-alert` | 默认警报配置。
请参见 [设置默认警报](#setting-a-default-alert) | N/A | | `alerting.discord.overrides` | 可能优先于默认配置的覆盖列表 | `[]` | | `alerting.discord.overrides[].group` | 将由此配置覆盖配置的端点组 | `""` | | `alerting.discord.overrides[].*` | 请参见 `alerting.discord.*` 参数 | `{}` | ``` alerting: discord: webhook-url: "https://discord.com/api/webhooks/**********/**********" endpoints: - name: website url: "https://twin.sh/health" interval: 5m conditions: - "[STATUS] == 200" - "[BODY].status == UP" - "[RESPONSE_TIME] < 300" alerts: - type: discord description: "healthcheck failed" send-on-resolved: true ``` #### 配置 Email 警报 | 参数 | 描述 | 默认值 | |------|------|--------| | `alerting.email` | `email` 类型警报的配置 | `{}` | | `alerting.email.from` | 发送警报的电子邮件 | 必填 `""` | | `alerting.email.username` | 用于发送警报的 SMTP 服务器用户名。如果为空,则使用 `alerting.email.from` | `""` | | `alerting.email.password` | 用于发送警报的 SMTP 服务器密码。如果为空,则不进行身份验证 | `""` | | `alerting.email.host` | 邮件服务器主机(例如 `smtp.gmail.com`) | 必填 `""` | | `alerting.email.port` | 邮件服务器监听端口(例如 `587`) | 必填 `0` | | `alerting.email.to` | 接收警报的电子邮件地址 | 必填 `""` | | `alerting.email.default-alert` | 默认警报配置。
请参见 [设置默认警报](#setting-a-default-alert) | N/A | | `alerting.email.client.insecure` | 是否跳过 TLS 验证 | `false` | | `alerting.email.overrides` | 可能优先于默认配置的覆盖列表 | `[]` | | `alerting.email.overrides[].group` | 将由此配置覆盖配置的端点组 | `""` | | `alerting.email.overrides[].*` | 请参见 `alerting.email.*` 参数 | `{}` | ``` alerting: email: from: "from@example.com" username: "from@example.com" password: "hunter2" host: "mail.example.com" port: 587 to: "recipient1@example.com,recipient2@example.com" client: insecure: false # You can also add group-specific to keys, which will # override the to key above for the specified groups overrides: - group: "core" to: "recipient3@example.com,recipient4@example.com" endpoints: - name: website url: "https://twin.sh/health" interval: 5m conditions: - "[STATUS] == 200" - "[BODY].status == UP" - "[RESPONSE_TIME] < 300" alerts: - type: email description: "healthcheck failed" send-on-resolved: true - name: back-end group: core url: "https://example.org/" interval: 5m conditions: - "[STATUS] == 200" - "[CERTIFICATE_EXPIRATION] > 48h" alerts: - type: email description: "healthcheck failed" send-on-resolved: true ``` #### 配置 Gitea 警报 | 参数 | 描述 | 默认值 | |------|------|--------| | `alerting.gitea` | `gitea` 类型警报的配置 | `{}` | | `alerting.gitea.repository-url` | Gitea 仓库 URL(例如 `https://gitea.com/TwiN/example`) | 必填 `""` | | `alerting.gitea.token` | 用于身份验证的个人访问令牌。
必须至少具有问题的 RW 权限和元数据的 RO 权限 | 必填 `""` | | `alerting.gitea.default-alert` | 默认警报配置。
请参见 [设置默认警报](#setting-a-default-alert) | N/A | Gitea 警报提供者为每个警报创建一个标题以 `alert(gatus):` 开头并以端点显示名称结尾的问题。如果将端点警报的 `send-on-resolved` 设置为 `true`,问题将在警报解决后自动关闭。 ``` alerting: gitea: repository-url: "https://gitea.com/TwiN/test" token: "349d63f16......" endpoints: - name: example url: "https://twin.sh/health" interval: 5m conditions: - "[STATUS] == 200" - "[BODY].status == UP" - "[RESPONSE_TIME] < 75" alerts: - type: gitea failure-threshold: 2 success-threshold: 3 send-on-resolved: true description: "Everything's burning AAAAAHHHHHHHHHHHHHHH" ``` 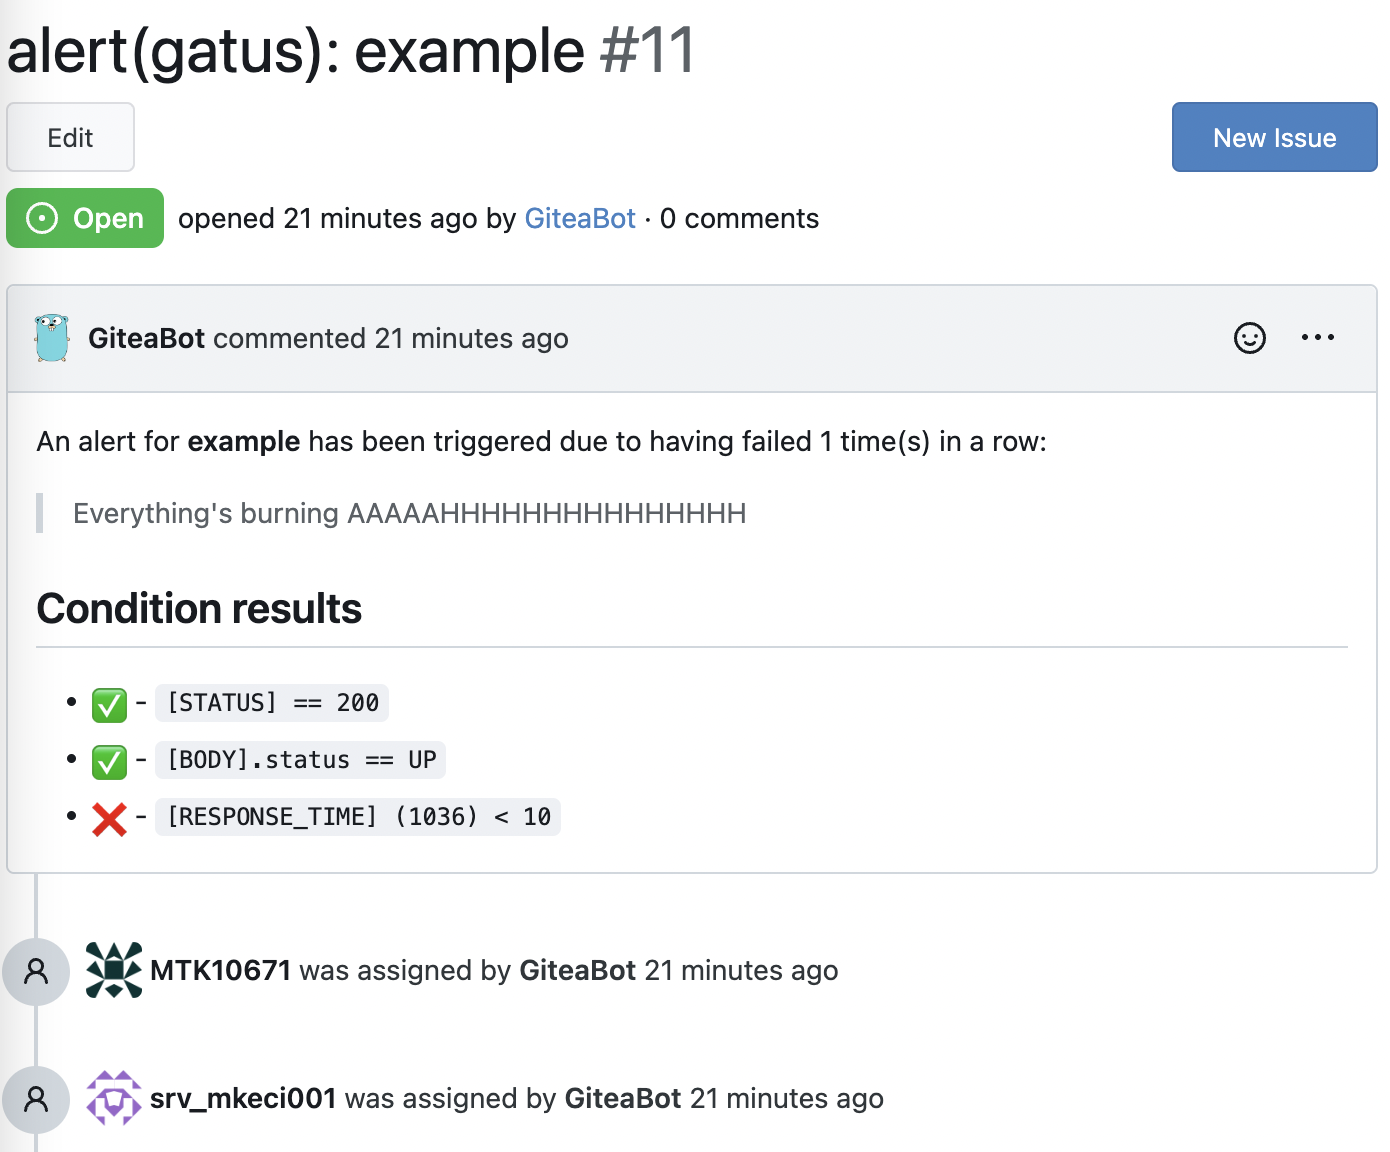 #### 配置 GitHub 警报 | 参数 | 描述 | 默认值 | |------|------|--------| | `alerting.github` | `github` 类型警报的配置 | `{}` | | `alerting.github.repository-url` | GitHub 仓库 URL(例如 `https://github.com/TwiN/example`) | 必填 `""` | | `alerting.github.token` | 用于身份验证的个人访问令牌。
必须至少具有问题的 RW 权限和元数据的 RO 权限 | 必填 `""` | | `alerting.github.default-alert` | 默认警报配置。
请参见 [设置默认警报](#setting-a-default-alert) | N/A | GitHub 警报提供者为每个警报创建一个标题以 `alert(gatus):` 开头并以端点显示名称结尾的问题。如果将端点警报的 `send-on-resolved` 设置为 `true`,问题将在警报解决后自动关闭。 ``` alerting: github: repository-url: "https://github.com/TwiN/test" token: "github_pat_12345..." endpoints: - name: example url: "https://twin.sh/health" interval: 5m conditions: - "[STATUS] == 200" - "[BODY].status == UP" - "[RESPONSE_TIME] < 75" alerts: - type: github failure-threshold: 2 success-threshold: 3 send-on-resolved: true description: "Everything's burning AAAAAHHHHHHHHHHHHHHH" ``` 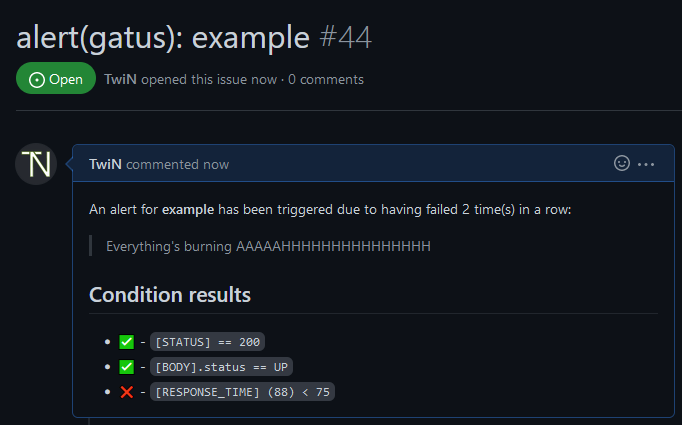 #### 配置 GitLab 警报 | 参数 | 描述 | 默认值 | |------|------|--------| | `alerting.gitlab` | `gitlab` 类型警报的配置 | `{}` | | `alerting.gitlab.webhook-url` | GitLab 警报 Webhook URL(例如 `https://gitlab.com/yourusername/example/alerts/notify/gatus/xxxxxxxxxxxxxxxx.json`) | 必填 `""` | | `alerting.gitlab.authorization-key` | GitLab 警报授权密钥 | 必填 `""` | | `alerting.gitlab.severity` | 覆盖默认严重性(critical),可以是 `critical, high, medium, low, info, unknown` 之一 | `""` | | `alerting.gitlab.monitoring-tool` | 覆盖监控工具名称(gatus) | `"g"` | | `alerting.gitlab.environment-name` | 设置 GitLab 环境名称。需要在仪表板上显示警报 | `""` | | `alerting.gitlab.service` | 覆盖端点显示名称 | `""` | | `alerting.gitlab.default-alert` | 默认警报配置。
请参见 [设置默认警报](#setting-a-default-alert) | N/A | GitLab 警报提供者为每个警报创建一个标题以 `alert(gatus):` 开头并以端点显示名称结尾的警报。如果将端点警报的 `send-on-resolved` 设置为 `true`,警报将在解决后自动关闭。请参见 [配置端点](https://docs.gitlab.com/ee/operations/incident_management/integrations.html#configuration) 以获取详细信息。 ``` alerting: gitlab: webhook-url: "https://gitlab.com/hlidotbe/example/alerts/notify/gatus/xxxxxxxxxxxxxxxx.json" authorization-key: "12345" endpoints: - name: example url: "https://twin.sh/health" interval: 5m conditions: - "[STATUS] == 200" - "[BODY].status == UP" - "[RESPONSE_TIME] < 75" alerts: - type: gitlab failure-threshold: 2 success-threshold: 3 send-on-resolved: true description: "Everything's burning AAAAAHHHHHHHHHHHHHHH" ``` 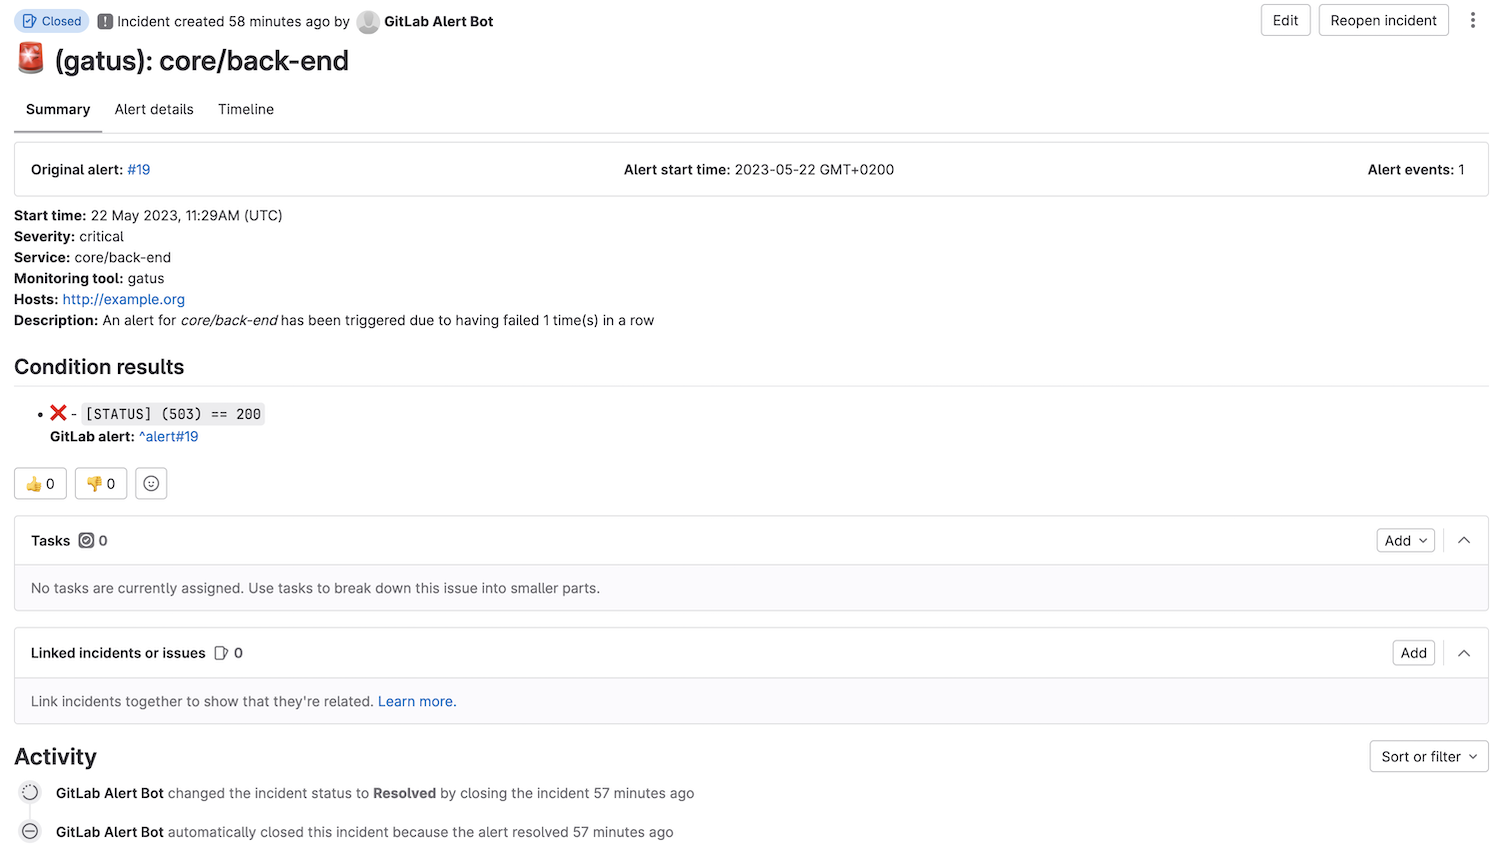 #### 配置 Google Chat 警报 | 参数 | 描述 | 默认值 | |------|------|--------| | `alerting.googlechat` | `googlechat` 类型警报的配置 | `{}` | | `alerting.googlechat.webhook-url` | Google Chat Webhook URL | 必填 `""` | | `alerting.googlechat.client` | 客户端配置。
请参见 [客户端配置](#client-configuration) | `{}` | | `alerting.googlechat.default-alert` | 默认警报配置。
请参见 [设置默认警报](#setting-a-default-alert) | N/A | | `alerting.googlechat.overrides` | 可能优先于默认配置的覆盖列表 | `[]` | | `alerting.googlechat.overrides[].group` | 将由此配置覆盖配置的端点组 | `""` | | `alerting.googlechat.overrides[].*` | 请参见 `alerting.googlechat.*` 参数 | `{}` | ``` alerting: googlechat: webhook-url: "https://chat.googleapis.com/v1/spaces/*******/messages?key=**********&token=********" endpoints: - name: website url: "https://twin.sh/health" interval: 5m conditions: - "[STATUS] == 200" - "[BODY].status == UP" - "[RESPONSE_TIME] < 300" alerts: - type: googlechat description: "healthcheck failed" send-on-resolved: true ``` #### 配置 Gotify 警报 | 参数 | 描述 | 默认值 | |------|------|--------| | `alerting.gotify` | `gotify` 类型警报的配置 | `{}` | | `alerting.gotify.server-url` | Gotify 服务器 URL | 必填 `""` | | `alerting.gotify.token` | 用于身份验证的令牌 | 必填 `""` | | `alerting.gotify.priority` | 根据 Gotify 标准设置的警报优先级 | `5` | | `alerting.gotify.title` | 通知标题 | `"Gatus:"` |
| `alerting.gotify.default-alert` | 默认警报配置。
请参见 [设置默认警报](#setting-a-default-alert) | N/A | 以下是通知的示例: 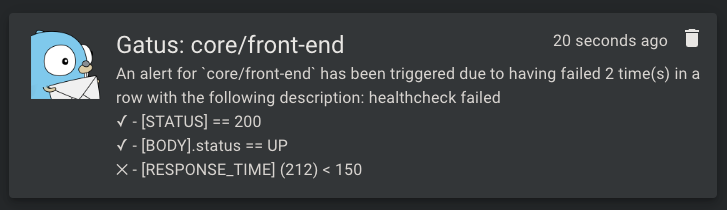 #### 配置 HomeAssistant 警报 | 参数 | 描述 | 默认值 | |------|------|--------| | `alerting.homeassistant.url` | HomeAssistant 实例 URL | 必填 `""` | | `alerting.homeassistant.token` | HomeAssistant 长效访问令牌 | 必填 `""` | | `alerting.homeassistant.default-alert` | 用于具有相应类型警报的端点的默认警报配置 | `{}` | | `alerting.homeassistant.overrides` | 可能优先于默认配置的覆盖列表 | `[]` | | `alerting.homeassistant.overrides[].group` | 将由此配置覆盖配置的端点组 | `""` | | `alerting.homeassistant.overrides[].*` | 请参见 `alerting.homeassistant.*` 参数 | `{}` | 警报将作为事件发送到 HomeAssistant,事件类型为 `gatus_alert`。事件数据包括: - `status`: "triggered" 或 "resolved" - `endpoint`: 被监控端点的名称 - `description`: 如果提供了警报描述 - `conditions`: 条件及其结果的列表 - `failure_count`: 连续失败次数(触发时) - `success_count`: 连续成功次数(解决时) 您可以在 HomeAssistant 自动化中使用这些事件来: - 发送通知 - 控制设备 - 触发场景 - 记录到历史记录 - 等等 HomeAssistant 自动化示例: ``` automation: - alias: "Gatus Alert Handler" trigger: platform: event event_type: gatus_alert action: - service: notify.notify data_template: title: "Gatus Alert: {{ trigger.event.data.event_data.endpoint }}" message: > Status: {{ trigger.event.data.event_data.status }} {% if trigger.event.data.event_data.description %} Description: {{ trigger.event.data.event_data.description }} {% endif %} {% for condition in trigger.event.data.event_data.conditions %} {{ '✅' if condition.success else '❌' }} {{ condition.condition }} {% endfor %} ``` 要获取您的 HomeAssistant 长效访问令牌: 1. 打开 HomeAssistant 2. 点击您的用户名(左下角) 3. 向下滚动到“长效访问令牌” 4. 点击“创建令牌” 5. 命名(例如,“Gatus”) 6. 复制令牌 - 您只会看到一次! #### 配置 IFTTT 警报 | 参数 | 描述 | 默认值 | |------|------|--------| | `alerting.ifttt` | `ifttt` 类型警报的配置 | `{}` | | `alerting.ifttt.webhook-key` | IFTTT Webhook 密钥 | 必填 `""` | | `alerting.ifttt.event-name` | IFTTT 事件名称 | 必填 `""` | | `alerting.ifttt.default-alert` | 默认警报配置。
请参见 [设置默认警报](#setting-a-default-alert) | N/A | | `alerting.ifttt.overrides` | 可能优先于默认配置的覆盖列表 | `[]` | | `alerting.ifttt.overrides[].group` | 将由此配置覆盖配置的端点组 | `""` | | `alerting.ifttt.overrides[].*` | 请参见 `alerting.ifttt.*` 参数 | `{}` | ``` alerting: ifttt: webhook-key: "YOUR_WEBHOOK_KEY" event-name: "gatus_alert" endpoints: - name: website url: "https://twin.sh/health" interval: 5m conditions: - "[STATUS] == 200" alerts: - type: ifttt send-on-resolved: true ``` #### 配置 Ilert 警报 | 参数 | 描述 | 默认值 | |------|------|--------| | `alerting.ilert` | `ilert` 类型警报的配置 | `{}` | | `alerting.ilert.integration-key` | ilert 警报源集成密钥 | `""` | | `alerting.ilert.default-alert` | 默认警报配置。
请参见 [设置默认警报](#setting-a-default-alert) | N/A | | `alerting.ilert.overrides` | 可能优先于默认配置的覆盖列表 | `[]` | | `alerting.ilert.overrides[].group` | 将由此配置覆盖配置的端点组 | `""` | | `alerting.ilert.overrides[].*` | 请参见 `alerting.ilert.*` 参数 | `{}` | 强烈建议将 `endpoints[].alerts[].send-on-resolved` 设置为 `true`,以用于 `ilert` 类型的警报,因为与其它警报不同,将此参数设置为 `true` 的操作不会创建另一个警报,而是将警报标记为在 ilert 上已解决。 行为: - 默认情况下,`alerting.ilert.integration-key` 用作集成密钥 - 如果被评估的端点属于一个组(`endpoints[].group`),且该组的值匹配 `alerting.ilert.overrides[].group`,则提供者将使用该覆盖的集成密钥,而不是 `alerting.ilert.integration-key` 的值 ``` alerting: ilert: integration-key: "********************************" # You can also add group-specific integration keys, which will # override the integration key above for the specified groups overrides: - group: "core" integration-key: "********************************" endpoints: - name: website url: "https://twin.sh/health" interval: 30s conditions: - "[STATUS] == 200" - "[BODY].status == UP" - "[RESPONSE_TIME] < 300" alerts: - type: ilert failure-threshold: 3 success-threshold: 5 send-on-resolved: true description: "healthcheck failed" ``` #### 配置 Incident.io 警报 | 参数 | 描述 | 默认值 | |------|------|--------| | `alerting.incident-io` | `incident-io` 类型警报的配置 | `{}` | | `alerting.incident-io.url` | 触发警报事件的 URL | 必填 `""` | | `alerting.incident-io.auth-token` | 用于身份验证的令牌 | 必填 `""` | | `alerting.incident-io.source-url` | 源 URL | `""` | | `alerting.incident-io.default-alert` | 默认警报配置。
请参见 [设置默认警报](#setting-a-default-alert) | N/A | | `alerting.incident-io.overrides` | 可能优先于默认配置的覆盖列表 | `[]` | | `alerting.incident-io.overrides[].group` | 将由此配置覆盖配置的端点组 | `""` | | `alerting.incident-io.overrides[].*` | 请参见 `alerting.incident-io.*` 参数 | `{}` | 要获取所需的警报源配置 ID 和身份验证令牌,必须配置一个 HTTP 警报。 #### 配置 Line 警报 | 参数 | 描述 | 默认值 | |------|------|--------| | `alerting.line` | `line` 类型警报的配置 | `{}` | | `alerting.line.channel-access-token` | Line Messaging API 通道访问令牌 | 必填 `""` | | `alerting.line.user-ids` | 要发送消息的 Line 用户 ID 列表(可以是用户 ID、房间 ID 或群组 ID) | 必填 `[]` | | `alerting.line.default-alert` | 默认警报配置。
请参见 [设置默认警报](#setting-a-default-alert) | N/A | | `alerting.line.overrides` | 可能优先于默认配置的覆盖列表 | `[]` | | `alerting.line.overrides[].group` | 将由此配置覆盖配置的端点组 | `""` | | `alerting.line.overrides[].*` | 请参见 `alerting.line.*` 参数 | `{}` | ``` alerting: line: channel-access-token: "YOUR_CHANNEL_ACCESS_TOKEN" user-ids: - "U1234567890abcdef" # This can be a group id, room id or user id - "U2345678901bcdefg" endpoints: - name: website url: "https://twin.sh/health" interval: 5m conditions: - "[STATUS] == 200" alerts: - type: line send-on-resolved: true ``` #### 配置 Matrix 警报 | 参数 | 描述 | 默认值 | |------|------|--------| | `alerting.matrix` | `matrix` 类型警报的配置 | `{}` | | `alerting.matrix.server-url` | Homeserver URL | `https://matrix-client.matrix.org` | | `alerting.matrix.access-token` | 机器人用户访问令牌(参见 https://webapps.stackexchange.com/q/131056) | 必填 `""` | | `alerting.matrix.internal-room-id` | 发送警报的内部房间 ID(在房间设置 > 高级中查找) | 必填 `""` | | `alerting.matrix.default-alert` | 默认警报配置。
请参见 [设置默认警报](#setting-a-default-alert) | N/A | | `alerting.matrix.overrides` | 可能优先于默认配置的覆盖列表 | `[]` | | `alerting.matrix.overrides[].group` | 将由此配置覆盖配置的端点组 | `""` | | `alerting.matrix.overrides[].*` | 请参见 `alerting.matrix.*` 参数 | `{}` | ``` alerting: matrix: server-url: "https://matrix-client.matrix.org" access-token: "123456" internal-room-id: "!example:matrix.org" endpoints: - name: website interval: 5m url: "https://twin.sh/health" conditions: - "[STATUS] == 200" - "[BODY].status == UP" - "[RESPONSE_TIME] < 300" alerts: - type: matrix send-on-resolved: true description: "healthcheck failed" ``` #### 配置 Mattermost 警报 | 参数 | 描述 | 默认值 | |------|------|--------| | `alerting.mattermost` | `mattermost` 类型警报的配置 | `{}` | | `alerting.mattermost.webhook-url` | Mattermost Webhook URL | 必填 `""` | | `alerting.mattermost.channel` | Mattermost 通道名称覆盖(可选) | `""` | | `alerting.mattermost.client` | 客户端配置。
请参见 [客户端配置](#client-configuration) | `{}` | | `alerting.mattermost.default-alert` | 默认警报配置。
请参见 [设置默认警报](#setting-a-default-alert) | N/A | | `alerting.mattermost.overrides` | 可能优先于默认配置的覆盖列表 | `[]` | | `alerting.mattermost.overrides[].group` | 将由此配置覆盖配置的端点组 | `""` | | `alerting.mattermost.overrides[].*` | 请参见 `alerting.mattermost.*` 参数 | `{}` | 以下是通知的示例: 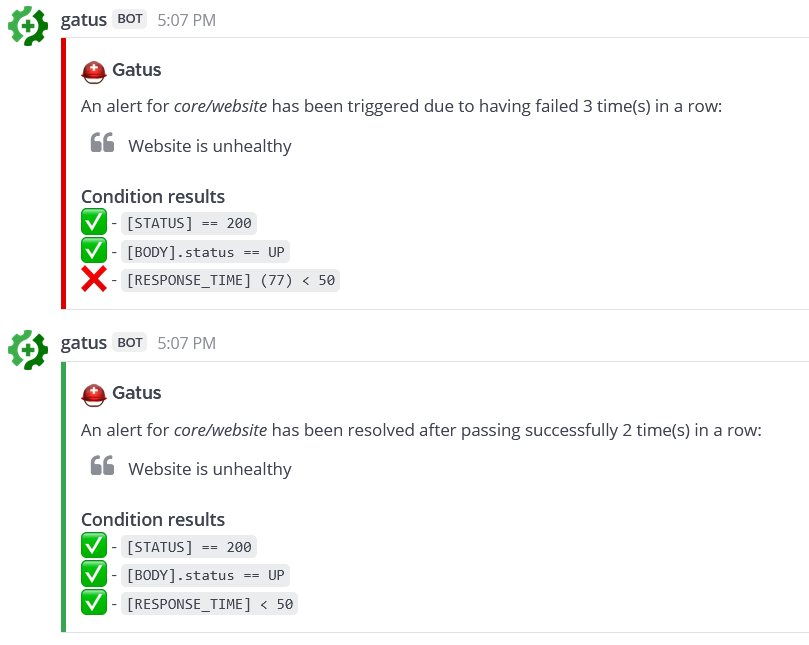 #### 配置 Messagebird 警报 | 参数 | 描述 | 默认值 | |------|------|--------| | `alerting.messagebird` | `messagebird` 类型警报的配置 | `{}` | | `alerting.messagebird.access-key` | Messagebird 访问密钥 | 必填 `""` | | `alerting.messagebird.originator` | 消息的发送者 | 必填 `""` | | `alerting.messagebird.recipients` | 消息的接收者列表 | 必填 `""` | | `alerting.messagebird.default-alert` | 默认警报配置。
请参见 [设置默认警报](#setting-a-default-alert) | N/A | 使用 Messagebird 发送 **SMS** 文本消息警报的示例: ``` alerting: messagebird: access-key: "..." originator: "31619191918" recipients: "31619191919,31619191920" endpoints: - name: website interval: 5m url: "https://twin.sh/health" conditions: - "[STATUS] == 200" - "[BODY].status == UP" - "[RESPONSE_TIME] < 300" alerts: - type: messagebird failure-threshold: 3 send-on-resolved: true description: "healthcheck failed" ``` #### 配置 New Relic 警报 | 参数 | 描述 | 默认值 | |------|------|--------| | `alerting.newrelic` | `newrelic` 类型警报的配置 | `{}` | | `alerting.newrelic.api-key` | New Relic API 密钥 | 必填 `""` | | `alerting.newrelic.account-id` | New Relic 账户 ID | 必填 `""` | | `alerting.newrelic.region` | 区域(US 或 EU) | `"US"` | | `alerting.newrelic.default-alert` | 默认警报配置。
请参见 [设置默认警报](#setting-a-default-alert) | N/A | | `alerting.newrelic.overrides` | 可能优先于默认配置的覆盖列表 | `[]` | | `alerting.newrelic.overrides[].group` | 将由此配置覆盖配置的端点组 | `""` | | `alerting.newrelic.overrides[].*` | 请参见 `alerting.newrelic.*` 参数 | `{}` | ``` alerting: newrelic: api-key: "YOUR_API_KEY" account-id: "1234567" region: "US" # or "EU" for European region endpoints: - name: example url: "https://example.org" interval: 5m conditions: - "[STATUS] == 200" alerts: - type: newrelic send-on-resolved: true ``` #### 配置 n8n 警报 | 参数 | 描述 | 默认值 | |------|------|--------| | `alerting.n8n` | `n8n` 类型警报的配置 | `{}` | | `alerting.n8n.webhook-url` | n8n webhook URL | 必填 `""` | | `alerting.n8n.title` | 发送到 n8n 的警报标题 | `""` | | `alerting.n8n.default-alert` | 默认警报配置。
请参见 [设置默认警报](#setting-a-default-alert) | N/A | | `alerting.n8n.overrides` | 可能优先于默认配置的覆盖列表 | `[]` | | `alerting.n8n.overrides[].group` | 将由此配置覆盖配置的端点组 | `""` | | `alerting.n8n.overrides[].*` | 请参见 `alerting.n8n.*` 参数 | `{}` | [n8n](https://n8n.io/) 是一个工作流自动化平台,允许您使用 webhook 跨不同的应用程序和服务自动化任务。 请参见 [n8n-nodes-gatus-trigger](https://github.com/TwiN/n8n-nodes-gatus-trigger) 获取可用于触发警报的 n8n 社区节点。 示例: 发送到 n8n webhook 的 JSON 有效载荷将包括: - `title`: 配置的标题 - `endpoint_name`: 端点名称 - `endpoint_group`: 端点组(如果有) - `endpoint_url`: 正在监控的 URL - `alert_description`: 自定义警报描述 - `resolved`: 布尔值,指示警报是否已解决 - `message`: 人类可读的警报消息 - `condition_results`: 包含其成功状态的条件结果数组 #### 配置 Ntfy 警报 | 参数 | 描述 | 默认值 | |------|------|--------| | `alerting.ntfy` | `ntfy` 类型警报的配置 | `{}` | | `alerting.ntfy.topic` | 警报将发布的订阅主题 | 必填 `""` | | `alerting.ntfy.url` | 目标服务器 URL | `https://ntfy.sh` | | `alerting.ntfy.token` | [访问令牌](https://docs.ntfy.sh/publish/#access-tokens) 用于限制主题的访问 | `""` | | `alerting.ntfy.email` | 用于额外电子邮件通知的电子邮件地址 | `""` | | `alerting.ntfy.click` | 点击通知时打开的网站 | `""` | | `alerting.ntfy.priority` | 警报的优先级 | `3` | | `alerting.ntfy.disable-firebase` | 是否禁用通过 Firebase 的消息推送投递。 [ntfy.sh 默认启用](https://docs.ntfy.sh/publish/#disable-firebase) | `false` | | `alerting.ntfy.disable-cache` | 是否禁用服务器端消息缓存。 [ntfy.sh 默认启用](https://docs.ntfy.sh/publish/#message-caching) | `false` | `alerting.ntfy.default-alert` | 默认警报配置。
请参见 [设置默认警报](#setting-a-default-alert) | N/A | | `alerting.ntfy.overrides` | 可能优先于默认配置的覆盖列表 | `[]` | | `alerting.ntfy.overrides[].group` | 将由此配置覆盖配置的端点组 | `""` | | `alerting.ntfy.overrides[].*` | 请参见 `alerting.ntfy.*` 参数 | `{}` | [ntfy](https://github.com/binwiederhier/ntfy) 是一个令人惊叹的项目,允许您订阅桌面 和移动通知,使其成为 Gatus 的一个很棒补充。 示例: ``` alerting: ntfy: topic: "gatus-test-topic" priority: 2 token: faketoken default-alert: failure-threshold: 3 send-on-resolved: true # You can also add group-specific to keys, which will # override the to key above for the specified groups overrides: - group: "other" topic: "gatus-other-test-topic" priority: 4 click: "https://example.com" endpoints: - name: website interval: 5m url: "https://twin.sh/health" conditions: - "[STATUS] == 200" - "[BODY].status == UP" - "[RESPONSE_TIME] < 300" alerts: - type: ntfy - name: other example group: other interval: 30m url: "https://example.com" conditions: - "[STATUS] == 200" - "[BODY].status == UP" alerts: - type: ntfy description: example ``` #### 配置 Opsgenie 警报 | 参数 | 描述 | 默认值 | |------|------|--------| | `alerting.opsgenie` | `opsgenie` 类型警报的配置 | `{}` | | `alerting.opsgenie.api-key` | Opsgenie API 密钥 | 必填 `""` | | `alerting.opsgenie.priority` | 警报优先级级别 | `P1` | | `alerting.opsgenie.source` | 警报来源字段 | `gatus` | | `alerting.opsgenie.entity-prefix` | 实体字段前缀 | `gatus-` | | `alerting.opsgenie.alias-prefix` | 别名字段前缀 | `gatus-healthcheck-` | | `alerting.opsgenie.tags` | 警报标签 | `[]` | | `alerting.opsgenie.default-alert` | 默认警报配置。
请参见 [设置默认警报](#setting-a-default-alert) | N/A | Opsgenie 提供者将自动打开和关闭警报。 ``` alerting: opsgenie: api-key: "00000000-0000-0000-0000-000000000000" ``` #### 配置 PagerDuty 警报 | 参数 | 描述 | 默认值 | |------|------|--------| | `alerting.pagerduty` | `pagerduty` 类型警报的配置 | `{}` | | `alerting.pagerduty.integration-key` | PagerDuty Events API v2 集成密钥 | 必填 `""` | | `alerting.pagerduty.default-alert` | 默认警报配置。
请参见 [设置默认警报](#setting-a-default-alert) | N/A | | `alerting.pagerduty.overrides` | 可能优先于默认配置的覆盖列表 | `[]` | | `alerting.pagerduty.overrides[].group` | 将由此配置覆盖配置的端点组 | `""` | | `alerting.pagerduty.overrides[].*` | 请参见 `alerting.pagerduty.*` 参数 | `{}` | 强烈建议将 `endpoints[].alerts[].send-on-resolved` 设置为 `true`,以用于 `pagerduty` 类型的警报,因为与其它警报不同,将此参数设置为 `true` 的操作不会创建另一个事件,而是将事件标记为在 PagerDuty 上已解决。 行为: - 默认情况下,`alerting.pagerduty.integration-key` 用作集成密钥 - 如果被评估的端点属于一个组(`endpoints[].group`),且该组的值匹配 `alerting.pagerduty.overrides[].group`,则提供者将使用该覆盖的集成密钥,而不是 `alerting.pagerduty.integration-key` 的值 ``` alerting: pagerduty: integration-key: "********************************" # You can also add group-specific integration keys, which will # override the integration key above for the specified groups overrides: - group: "core" integration-key: "********************************" endpoints: - name: website url: "https://twin.sh/health" interval: 30s conditions: - "[STATUS] == 200" - "[BODY].status == UP" - "[RESPONSE_TIME] < 300" alerts: - type: pagerduty failure-threshold: 3 success-threshold: 5 send-on-resolved: true description: "healthcheck failed" - name: back-end group: core url: "https://example.org/" interval: 5m conditions: - "[STATUS] == 200" - "[CERTIFICATE_EXPIRATION] > 48h" alerts: - type: pagerduty failure-threshold: 3 success-threshold: 5 send-on-resolved: true description: "healthcheck failed" ``` #### 配置 Plivo 警报 | 参数 | 描述 | 默认值 | |------|------|--------| | `alerting.plivo` | `plivo` 类型警报的配置 | `{}` | | `alerting.plivo.auth-id` | Plivo Auth ID | 必填 `""` | | `alerting.plivo.auth-token` | Plivo Auth 令牌 | 必填 `""` | | `alerting.plivo.from` | 发送 SMS 的电话号码 | 必填 `""` | | `alerting.plivo.to` | 接收 SMS 的电话号码列表 | 必填 `[]` | | `alerting.plivo.default-alert` | 默认警报配置。
请参见 [设置默认警报](#setting-a-default-alert) | N/A | | `alerting.plivo.overrides` | 可能优先于默认配置的覆盖列表 | `[]` | | `alerting.plivo.overrides[].group` | 将由此配置覆盖配置的端点组 | `""` | | `alerting.plivo.overrides[].*` | 请参见 `alerting.plivo.*` 参数 | `{}` | ``` alerting: plivo: auth-id: "MAXXXXXXXXXXXXXXXXXX" auth-token: "your-auth-token" from: "+1234567890" to: - "+0987654321" - "+1122334455" endpoints: - name: website interval: 30s url: "https://twin.sh/health" conditions: - "[STATUS] == 200" - "[BODY].status == UP" - "[RESPONSE_TIME] < 300" alerts: - type: plivo failure-threshold: 5 send-on-resolved: true description: "healthcheck failed" ``` #### 配置 Pushover 警报 | 参数 | 描述 | 默认值 | |------|------|--------| | `alerting.pushover` | `pushover` 类型警报的配置 | `{}` | | `alerting.pushover.application-token` | Pushover 应用程序令牌 | `""` | | `alerting.pushover.user-key` | 用户或群组密钥 | `""` | | `alerting.pushover.title` | 所有消息发送的固定标题 | `"Gatus:"` |
| `alerting.pushover.priority` | 所有消息的优先级,范围从 -2(很低)到 2(紧急) | `0` |
| `alerting.pushover.resolved-priority` | 解决时覆盖消息的优先级,范围从 -2(很低)到 2(紧急) | `0` |
| `alerting.pushover.sound` | 所有消息的声音
请参见 [声音](https://pushover.net/api#sounds) 获取所有有效选项 | `""` | | `alerting.pushover.ttl` | 设置消息的生存时间,以便自动从 Pushover 通知中删除 | `0` | | `alerting.pushover.device` | 发送消息的设备(可选)
请参见 [设备](https://pushover.net/api#identifiers) 获取详细信息 | `""`(所有设备) | | `alerting.pushover.default-alert` | 默认警报配置。
请参见 [设置默认警报](#setting-a-default-alert) | N/A | ``` alerting: pushover: application-token: "******************************" user-key: "******************************" endpoints: - name: website url: "https://twin.sh/health" interval: 30s conditions: - "[STATUS] == 200" - "[BODY].status == UP" - "[RESPONSE_TIME] < 300" alerts: - type: pushover failure-threshold: 3 success-threshold: 5 send-on-resolved: true description: "healthcheck failed" ``` #### 配置 Rocket.Chat 警报 | 参数 | 描述 | 默认值 | |------|------|--------| | `alerting.rocketchat` | `rocketchat` 类型警报的配置 | `{}` | | `alerting.rocketchat.webhook-url` | Rocket.Chat 传入 Webhook URL | 必填 `""` | | `alerting.rocketchat.channel` | 可选的通道覆盖 | `""` | | `alerting.rocketchat.default-alert` | 默认警报配置。
请参见 [设置默认警报](#setting-a-default-alert) | N/A | | `alerting.rocketchat.overrides` | 可能优先于默认配置的覆盖列表 | `[]` | | `alerting.rocketchat.overrides[].group` | 将由此配置覆盖配置的端点组 | `""` | | `alerting.rocketchat.overrides[].*` | 请参见 `alerting.rocketchat.*` 参数 | `{}` | ``` alerting: rocketchat: webhook-url: "https://your-rocketchat.com/hooks/YOUR_WEBHOOK_ID/YOUR_TOKEN" channel: "#alerts" # Optional endpoints: - name: website url: "https://twin.sh/health" interval: 5m conditions: - "[STATUS] == 200" alerts: - type: rocketchat send-on-resolved: true ``` 以下是通知的示例:  #### 配置 SendGrid 警报 | 参数 | 描述 | 默认值 | |------|------|--------| | `alerting.sendgrid` | `sendgrid` 类型警报的配置 | `{}` | | `alerting.sendgrid.api-key` | SendGrid API 密钥 | 必填 `""` | | `alerting.sendgrid.from` | 发送邮件的发件人地址 | 必填 `""` | | `alerting.sendgrid.to` | 接收警报的电子邮件地址(多个收件人用逗号分隔) | 必填 `""` | | `alerting.sendgrid.default-alert` | 默认警报配置。
请参见 [设置默认警报](#setting-a-default-alert) | N/A | | `alerting.sendgrid.overrides` | 可能优先于默认配置的覆盖列表 | `[]` | | `alerting.sendgrid.overrides[].group` | 将由此配置覆盖配置的端点组 | `""` | | `alerting.sendgrid.overrides[].*` | 请参见 `ing.sendgrid.*` 参数 | `{}` | ``` alerting: sendgrid: api-key: "SG.xxxxxxxxxxxxxxxxxxxxxxxxxxxxxxxxxxxxxxxxxxxxxxxxxxxxxxxxxxxxxxxxxxxx" from: "alerts@example.com" to: "admin@example.com,ops@example.com" endpoints: - name: website url: "https://twin.sh/health" interval: 5m conditions: - "[STATUS] == 200" alerts: - type: sendgrid send-on-resolved: true ``` #### 配置 Signal 警报 | 参数 | 描述 | 默认值 | |------|------|--------| | `alerting.signal` | `signal` 类型警报的配置 | `{}` | | `alerting.signal.api-url` | Signal API URL(例如 signal-cli-rest-api 实例) | 必填 `""` | | `alerting.signal.number` | 发送者电话号码 | 必填 `""` | | `alerting.signal.recipients` | 接收者电话号码列表 | 必填 `[]` | | `alerting.signal.default-alert` | 默认警报配置。
请参见 [设置默认警报](#setting-a-default-alert) | N/A | | `alerting.signal.overrides` | 可能优先于默认配置的覆盖列表 | `[]` | | `alerting.signal.overrides[].group` | 将由此配置覆盖配置的端点组 | `""` | | `alerting.signal.overrides[].*` | 请参见 `alerting.signal.*` 参数 | `{}` | ``` alerting: signal: api-url: "http://localhost:8080" number: "+1234567890" recipients: - "+0987654321" - "+1122334455" endpoints: - name: website url: "https://twin.sh/health" interval: 5m conditions: - "[STATUS] == 200" alerts: - type: signal send-on-resolved: true ``` #### 配置 SIGNL4 警报 SIGNL4 是一个移动警报和事件管理服务,通过移动推送、短信、语音电话和电子邮件向团队成员发送关键警报。 | 参数 | 描述 | 默认值 | |------|------|--------| | `alerting.signl4` | `signl4` 类型警报的配置 | `{}` | | `alerting.signl4.team-secret` | SIGNL4 团队密钥(Webhook URL 的一部分) | 必填 `""` | | `alerting.signl4.default-alert` | 默认警报配置。
请参见 [设置默认警报](#setting-a-default-alert) | N/A | | `alerting.signl4.overrides` | 可能优先于默认配置的覆盖列表 | `[]` | | `alerting.signl4.overrides[].group` | 将由此配置覆盖配置的端点组 | `""` | | `alerting.signl4.overrides[].*` | 请参见 `alerting.signl4.*` 参数 | `{}` | ``` alerting: signl4: team-secret: "your-team-secret-here" endpoints: - name: website url: "https://twin.sh/health" interval: 5m conditions: - "[STATUS] == 200" alerts: - type: signl4 send-on-resolved: true ``` #### 配置 Slack 警报 | 参数 | 描述 | 默认值 | |------|------|--------| | `alerting.slack` | `slack` 类型警报的配置 | `{}` | | `alerting.slack.webhook-url` | Slack Webhook URL | 必填 `""` | | `alerting.slack.title` | 通知标题 | `":helmet_with_white_cross: Gatus"` | | `alerting.slack.default-alert` | 默认警报配置。
请参见 [设置默认警报](#setting-a-default-alert) | N/A | | `alerting.slack.overrides` | 可能优先于默认配置的覆盖列表 | `[]` | | `alerting.slack.overrides[].group` | 将由此配置覆盖配置的端点组 | `""` | | `alerting.slack.overrides[].*` | 请参见 `alerting.slack.*` 参数 | `{}` | 以下是通知的示例: 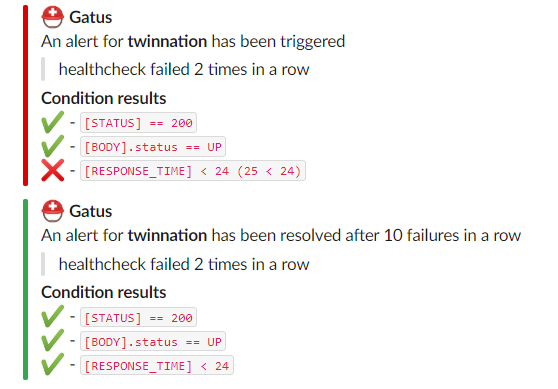 #### 配置 Splunk 警报 | 参数 | 描述 | 默认值 | |------|------|--------| | `alerting.splunk` | `splunk` 类型警报的配置 | `{}` | | `alerting.splunk.hec-url` | Splunk HEC (HTTP Event Collector) URL | 必填 `""` | | `alerting.splunk.hec-token` | Splunk HEC 令牌 | 必填 `""` | | `alerting.splunk.source` | 事件来源 | `"gatus"` | | `alerting.splunk.sourcetype` | 事件来源类型 | `"gatus:alert"` | | `alerting.splunk.index` | Splunk 索引 | `""` | | `alerting.splunk.default-alert` | 默认警报配置。
请参见 [设置默认警报](#setting-a-default-alert) | N/A | | `alerting.splunk.overrides` | 可能优先于默认配置的覆盖列表 | `[]` | | `alerting.splunk.overrides[].group` | 将由此配置覆盖配置的端点组 | `""` | | `alerting.splunk.overrides[].*` | 请参见 `alerting.splunk.*` 参数 | `{}` | ``` alerting: splunk: hec-url: "https://splunk.example.com:8088" hec-token: "YOUR_HEC_TOKEN" index: "main" # Optional endpoints: - name: website url: "https://twin.sh/health" interval: 5m conditions: - "[STATUS] == 200" alerts: - type: splunk send-on-resolved: true ``` #### 配置 Squadcast 警报 | 参数 | 描述 | 默认值 | |------|------|--------| | `alerting.squadcast` | `squadcast` 类型警报的配置 | `{}` | | `alerting.squadcast.webhook-url` | Squadcast webhook URL | 必填 `""` | | `alerting.squadcast.default-alert` | 默认警报配置。
请参见 [设置默认警报](#setting-a-default-alert) | N/A | | `alerting.squadcast.overrides` | 可能优先于默认配置的覆盖列表 | `[]` | | `alerting.squadcast.overrides[].group` | 将由此配置覆盖配置的端点组 | `""` | | `alerting.squadcast.overrides[].*` | 请参见 `alerting.squadcast.*` 参数 | `{}` | ``` alerting: squadcast: webhook-url: "https://api.squadcast.com/v3/incidents/api/YOUR_API_KEY" endpoints: - name: website url: "https://twin.sh/health" interval: 5m conditions: - "[STATUS] == 200" alerts: - type: squadcast send-on-resolved: true ``` #### 配置 Teams 警报(已弃用) | 参数 | 描述 | 默认值 | |------|------|--------| | `alerting.teams` | `teams` 类型警报的配置 | `{}` | | `alerting.teams.webhook-url` | Teams Webhook URL | 必填 `""` | | `alerting.teams.default-alert` | 默认警报配置。
请参见 [设置默认警报](#setting-a-default-alert) | N/A | | `alerting.teams.title` | 通知标题 | `"🚨 Gatus"` | | `alerting.teams.client.insecure` | 是否跳过 TLS 验证 | `false` | | `alerting.teams.overrides` | 可能优先于默认配置的覆盖列表 | `[]` | | `alerting.teams.overrides[].group` | 将由此配置覆盖配置的端点组 | `""` | | `alerting.teams.overrides[].*` | 请参见 `alerting.teams.*` 参数 | `{}` | 以下是通知的示例: 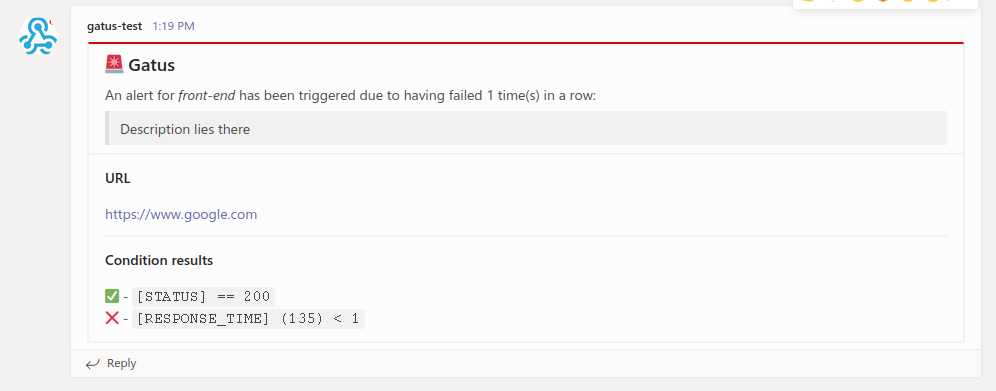 #### 配置 Teams Workflow 警报 | 参数 | 描述 | 默认值 | |------|------|--------| | `alerting.teams-workflows` | `teams` 类型警报的配置 | `{}` | | `alerting.teams-workflows.webhook-url` | Teams Webhook URL | 必填 `""` | | `alerting.teams-workflows.title` | 通知标题 | `"⛑ Gatus"` | | `alerting.teams-workflows.default-alert` | 默认警报配置。
请参见 [设置默认警报](#setting-a-default-alert) | N/A | | `alerting.teams-workflows.overrides` | 可能优先于默认配置的覆盖列表 | `[]` | | `alerting.teams-workflows.overrides[].group` | 将由此配置覆盖配置的端点组 | `""` | | `alerting.teams-workflows.overrides[].*` | 请参见 `alerting.teams-workflows.*` 参数 | `{}` | 以下是通知的示例: 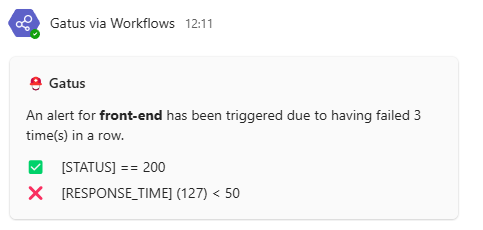 #### 配置 Telegram 警报 | 参数 | 描述 | 默认值 | |------|------|--------| | `alerting.telegram` | `telegram` 类型警报的配置 | `{}` | | `alerting.telegram.token` | Telegram Bot 令牌 | 必填 `""` | | `alerting.telegram.id` | Telegram Chat ID | 必填 `""` | | `alerting.telegram.topic-id` | Telegram 主题 ID,在群组中对应 `message_thread_id` | `""` | | `alerting.tele.api-url` | Telegram API URL | `https://api.telegram.org` | | `alerting.telegram.client` | 客户端配置。
请参见 [客户端配置](#client-configuration) | `{}` | | `alerting.telegram.default-alert` | 默认警报配置。
请参见 [设置默认警报](#setting-a-default-alert) | N/A | | `alerting.telegram.overrides` | 可能优先于默认配置的覆盖列表 | `[]` | | `alerting.telegram.overrides[].group` | 将由此配置覆盖配置的端点组 | `""` | | `alerting.telegram.overrides[].*` | 请参见 `alerting.telegram.*` 参数 | `{}` | 以下是通知的示例: 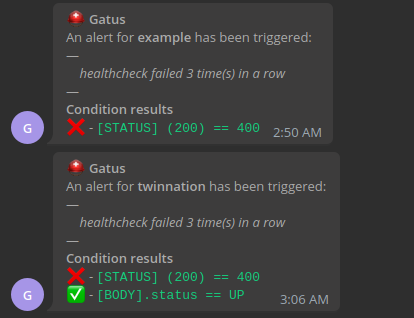 #### 配置 Twilio 警报 | 参数 | 描述 | 默认值 | |------|------|--------| | `alerting.twilio` | 设置 Twilio 类型警报的配置 | `{}` | | `alerting.twilio.sid` | Twilio 账户 SID | 必填 `""` | | `alerting.twilio.token` | Twilio 身份验证令牌 | 必填 `""` | | `alerting.twilio.from` | 发送 Twilio 警报的电话号码 | 必填 `""` | | `alerting.twilio.to` | 接收 Twilio 警报的电话号码 | 必填 `""` | | `alerting.twilio.default-alert` | 默认警报配置。
请参见 [设置默认警报](#setting-a-default-alert) | N/A | 支持自定义消息模板,可通过以下附加参数配置: | 参数 | 描述 | 默认值 | |------|------|--------| | `alerting.twilio.text-twilio-triggered` | 自定义消息模板,用于触发的警报。支持 `[ENDPOINT]`、`[ALERT_DESCRIPTION]` | `""` | | `alerting.twilio.text-twilio-resolved` | 自定义消息模板,用于已解决的警报。支持 `[ENDPOINT]`、`[ALERT_DESCRIPTION]` | `""` | ``` alerting: twilio: sid: "..." token: "..." from: "+1-234-567-8901" to: "+1-234-567-8901" # Custom message templates using placeholders (optional) # Supports both old format {endpoint}/{description} and new format [ENDPOINT]/[ALERT_DESCRIPTION] text-twilio-triggered: "🚨 ALERT: [ENDPOINT] is down! [ALERT_DESCRIPTION]" text-twilio-resolved: "✅ RESOLVED: [ENDPOINT] is back up! [ALERT_DESCRIPTION]" endpoints: - name: website interval: 30s url: "https://twin.sh/health" conditions: - "[STATUS] == 200" - "[BODY].status == UP" - "[RESPONSE_TIME] < 300" alerts: - type: twilio failure-threshold: 5 send-on-resolved: true description: "healthcheck failed" ``` #### 配置 Vonage 警报 | 参数 | 描述 | 默认值 | |------|------|--------| | `alerting.vonage` | 配置 Vonage 类型警报 | `{}` | | `alerting.vonage.api-key` | Vonage API 密钥 | 必填 `""` | | `alerting.vonage.api-secret` | Vonage API 密钥 | 必填 `""` | | `alerting.vonage.from` | 发送者名称或电话号码 | 必填 `""` | | `alerting.vonage.to` | 接收者电话号码 | 必填 `""` | | `alerting.vonage.default-alert` | 默认警报配置。
请参见 [设置默认警报](#setting-a-default-alert) | N/A | | `alerting.vonage.overrides` | 可能优先于默认配置的覆盖列表 | `[]` | | `alerting.vonage.overrides[].group` | 将由此配置覆盖配置的端点组 | `""` | | `alerting.vonage.overrides[].*` | 请参见 `alerting.vonage.*` 参数 | `{}` | 发送 Vonage 警报的示例: ``` endpoints: - name: website url: "https://example.org" alerts: - type: vonage failure-threshold: 5 send-on-resolved: true description: "healthcheck failed" ``` #### 配置 Webex 警报 | 参数 | 描述 | 默认值 | |------|------|--------| | `alerting.webex` | 配置 Webex 类型警报 | `{}` | | `alerting.webex.webhook-url` | Webex Teams 传入 Webhook URL | 必填 `""` | | `alerting.webex.default-alert` | 默认警报配置。
请参见 [设置默认警报](#setting-a-default-alert) | N/A | | `alerting.webex.overrides` | 可能优先于默认配置的覆盖列表 | `[]` | | `alerting.webex.overrides[].group` | 将由此配置覆盖配置的端点组 | `""` | | `alerting.webex.overrides[].*` | 请参见 `alerting.webex.*` 参数 | `{}` | ``` alerting: webex: webhook-url: "https://webexapis.com/v1/webhooks/incoming/YOUR_WEBHOOK_ID" endpoints: - name: website url: "https://twin.sh/health" interval: 5m conditions: - "[STATUS] == 200" alerts: - type: webex send-on-resolved: true ``` #### 配置 Zapier 警报 | 参数 | 描述 | 默认值 | |------|------|--------| | `alerting.zapier` | 配置 Zapier 类型警报 | `{}` | | `alerting.zapier.webhook-url` | Zapier Webhook URL | 必填 `""` | | `alerting.zapier.default-alert` | 默认警报配置。
请参见 [设置默认警报](#setting-a-default-alert) | N/A | | `alerting.zapier.overrides` | 可能优先于默认配置的覆盖列表 | `[]` | | `alerting.zapier.overrides[].group` | 将由此配置覆盖配置的端点组 | `""` | | `alerting.zapier.overrides[].*` | 请参见 `alerting.zapier.*` 参数 | `{}` | ``` alerting: zapier: webhook-url: "https://hooks.zapier.com/hooks/catch/YOUR_WEBHOOK_ID/" endpoints: - name: website url: "https://twin.sh/health" interval: 5m conditions: - "[STATUS] == 200" alerts: - type: zapier send-on-resolved: true ``` #### 配置 Zulip 警报 | 参数 | 描述 | 默认值 | |------|------|--------| | `alerting.zulip` | 配置 Zulip 类型警报 | `{}` | | `alerting.zulip.bot-email` | Bot 电子邮件 | 必填 `""` | | `alerting.zulip.bot-api-key` | Bot API 密钥 | 必填 `""` | | `alerting.zulip.domain` | 完整的组织域名(例如 yourZulipDomain.zulipchat.com) | 必填 `""` | | `alerting.zulip.channel-id` | 发送警报的频道 ID | 必填 `""` | | `alerting.zulip.overrides` | 优先级可能高于默认配置的覆盖列表 | `[]` | | `alerting.zulip.overrides[].group` | 将被此配置覆盖的端点组 | `""` | | `alerting.zulip.overrides[].*` | 参考 `alerting.zulip.*` 参数 | `{}` | ``` alerting: zulip: bot-email: gatus-bot@some.zulip.org bot-api-key: "********************************" domain: some.zulip.org channel-id: 123456 endpoints: - name: website url: "https://twin.sh/health" interval: 5m conditions: - "[STATUS] == 200" - "[BODY].status == UP" - "[RESPONSE_TIME] < 300" alerts: - type: zulip description: "healthcheck failed" send-on-resolved: true ``` #### 配置自定义告警 | 参数 | 描述 | 默认值 | |:------------------------------------|:-----------------------------------------------------------------------------------|:--------------| | `alerting.custom` | 失败或告警时自定义动作的配置 | `{}` | | `alerting.custom.url` | 自定义告警请求 URL | 必填 `""` | | `alerting.custom.method` | 请求方法 | `GET` | | `alerting.custom.body` | 自定义告警请求体 | `""` | | `alerting.custom.headers` | 自定义告警请求头 | `{}` | | `alerting.custom.client` | 客户端配置。
参考 [客户端配置](#client-configuration)。 | `{}` | | `alerting.custom.default-alert` | 默认告警配置。
参考 [设置默认告警](#setting-a-default-alert) | N/A | | `alerting.custom.overrides` | 优先级可能高于默认配置的覆盖列表 | `[]` | | `alerting.custom.overrides[].group` | 将被此配置覆盖的端点组 | `""` | | `alerting.custom.overrides[].*` | 参考 `alerting.custom.*` 参数 | `{}` | 虽然它们被称为告警,但你可以使用此功能调用任何内容。 例如,你可以通过拥有一个跟踪新部署的应用程序来自动化回滚, 并利用 Gatus,当端点开始失败时,Gatus 可以调用该应用程序端点。你的应用程序 会检查出问题的端点是否属于最近部署的应用程序,如果是, 则自动回滚。 此外,你可以在正文(`alerting.custom.body`)和 URL(`alerting.custom.url`)中使用以下占位符: - `[ALERT_DESCRIPTION]`(从 `endpoints[].alerts[].description` 解析) - `[ENDPOINT_NAME]`(从 `endpoints[].name` 解析) - `[ENDPOINT_GROUP]`(从 `endpoints[].group` 解析) - `[ENDPOINT_URL]`(从 `endpoints[].url` 解析) - `[RESULT_ERRORS]`(从给定健康检查的健康评估解析) - `[RESULT_CONDITIONS]`(从给定健康检查的健康评估解析的条件结果) - 如果你有一个使用 `custom` 提供程序并设置 `send-on-resolved` 为 `true` 的告警, 你可以使用 `[ALERT_TRIGGERED_OR_RESOLVED]` 占位符来区分通知。 上述占位符将被替换为 `TRIGGERED` 或 `RESOLVED`,但可以修改 (本节末尾有详细说明)。 为了所有意图和目的,我们将使用 Slack Webhook 配置自定义告警,但你可以调用任何你想要的内容。 ``` alerting: custom: url: "https://hooks.slack.com/services/**********/**********/**********" method: "POST" body: | { "text": "[ALERT_TRIGGERED_OR_RESOLVED]: [ENDPOINT_GROUP] - [ENDPOINT_NAME] - [ALERT_DESCRIPTION] - [RESULT_ERRORS]" } endpoints: - name: website url: "https://twin.sh/health" interval: 30s conditions: - "[STATUS] == 200" - "[BODY].status == UP" - "[RESPONSE_TIME] < 300" alerts: - type: custom failure-threshold: 10 success-threshold: 3 send-on-resolved: true description: "health check failed" ``` 注意,你可以像这样自定义 `[ALERT_TRIGGERED_OR_RESOLVED]` 占位符的已解析值: ``` alerting: custom: placeholders: ALERT_TRIGGERED_OR_RESOLVED: TRIGGERED: "partial_outage" RESOLVED: "operational" ``` 因此,第一个示例节中的 `[ALERT_TRIGGERED_OR_RESOLVED]` 在告警触发时将替换为 `partial_outage`,在告警解决时将替换为 `operational`。 #### 设置默认告警 | 参数 | 描述 | 默认值 | |:---------------------------------------------|:------------------------------------------------------------------------------|:--------| | `alerting.*.default-alert.enabled` | 是否启用告警 | N/A | | `alerting.*.default-alert.failure-threshold` | 触发告警前所需的连续失败次数 | N/A | | `alerting.*.default-alert.success-threshold` | 在持续事件被标记为解决之前所需的连续成功次数 | N/A | | `alerting.*.default-alert.send-on-resolved` | 告警被标记为解决后是否发送通知 | N/A | | `alerting.*.default-alert.description` | 告警描述。将包含在发送的告警中 | N/A | 虽然你可以直接在端点定义中指定告警配置,但这很繁琐,可能导致配置文件非常长。 为了避免此类问题,你可以在每个提供程序配置中使用 `default-alert` 参数: ``` alerting: slack: webhook-url: "https://hooks.slack.com/services/**********/**********/**********" default-alert: description: "health check failed" send-on-resolved: true failure-threshold: 5 success-threshold: 5 ``` 这样,你的 Gatus 配置看起来会更整洁: ``` endpoints: - name: example url: "https://example.org" conditions: - "[STATUS] == 200" alerts: - type: slack - name: other-example url: "https://example.com" conditions: - "[STATUS] == 200" alerts: - type: slack ``` 它还允许你执行以下操作: ``` endpoints: - name: example url: "https://example.org" conditions: - "[STATUS] == 200" alerts: - type: slack failure-threshold: 5 - type: slack failure-threshold: 10 - type: slack failure-threshold: 15 ``` 当然,你也可以混合使用告警类型: ``` alerting: slack: webhook-url: "https://hooks.slack.com/services/**********/**********/**********" default-alert: failure-threshold: 3 pagerduty: integration-key: "********************************" default-alert: failure-threshold: 5 endpoints: - name: endpoint-1 url: "https://example.org" conditions: - "[STATUS] == 200" alerts: - type: slack - type: pagerduty - name: endpoint-2 url: "https://example.org" conditions: - "[STATUS] == 200" alerts: - type: slack - type: pagerduty ``` ### 维护 如果你有维护窗口,你可能不希望被告警打扰。 要做到这一点,你需要使用维护配置: | 参数 | 描述 | 默认值 | |:-----------------------|:-----------------------------------------------------------------------------------------------------------------------------------------------------------------------------------|:--------------| | `maintenance.enabled` | 维护周期是否启用 | `true` | | `maintenance.start` | 维护窗口开始时间(格式为 `hh:mm`,例如 `23:00`) | 必填 `""` | | `maintenance.duration` | 维护窗口持续时间(例如 `1h`、`30m`) | 必填 `""` | | `maintenance.timezone` | 维护窗口时区格式(例如 `Europe/Amsterdam`)。
参考 [时区数据库时间列表](https://en.wikipedia.org/wiki/List_of_tz_database_time_zones) 获取更多信息 | `UTC` | | `maintenance.every` | 维护周期适用的星期几(例如 `[Monday, Thursday]`)。
如果留空,则维护窗口每天应用 | `[]` | 示例如下: ``` maintenance: start: 23:00 duration: 1h timezone: "Europe/Amsterdam" every: [Monday, Thursday] ``` 注意你也可以按行单独指定每一天: ``` maintenance: start: 23:00 duration: 1h timezone: "Europe/Amsterdam" every: - Monday - Thursday ``` 你也可以为每个端点指定维护窗口: ``` endpoints: - name: endpoint-1 url: "https://example.org" maintenance-windows: - start: "07:30" duration: 40m timezone: "Europe/Berlin" - start: "14:30" duration: 1h timezone: "Europe/Berlin" ``` ### 安全 | 参数 | 描述 | 默认值 | |:-----------------|:-----------------------------|:--------| | `security` | 安全配置 | `{}` | | `security.basic` | HTTP 基本认证配置 | `{}` | | `security.oidc` | OpenID Connect 配置 | `{}` | #### 基本认证 | 参数 | 描述 | 默认值 | |:----------------------------------------|:-----------------------------------------------------------------------------------|:--------------| | `security.basic` | HTTP 基本认证配置 | `{}` | | `security.basic.username` | 基本认证用户名。 | 必填 `""` | | `security.basic.password-bcrypt-base64` | 使用 Bcrypt 哈希并以 base64 编码的密码,用于基本认证。 | 必填 `""` | 以下示例将要求你使用用户名 `john.doe` 和密码 `hunter2` 进行认证: ``` security: basic: username: "john.doe" password-bcrypt-base64: "JDJhJDEwJHRiMnRFakxWazZLdXBzRERQazB1TE8vckRLY05Yb1hSdnoxWU0yQ1FaYXZRSW1McmladDYu" ``` #### OIDC | 参数 | 描述 | 默认值 | |:---------------------------------|:---------------------------------------------------------------|:--------------| | `security.oidc` | OpenID Connect 配置 | `{}` | | `security.oidc.issuer-url` | 发行者 URL | 必填 `""` | | `security.oidc.redirect-url` | 重定向 URL。必须以 `/authorization-code/callback` 结尾 | 必填 `""` | | `security.oidc.client-id` | 客户端 ID | 必填 `""` | | `security.oidc.client-secret` | 客户端密钥 | 必填 `""` | | `security.oidc.scopes` | 请求的权限范围。唯一需要的权限是 `openid`。 | 必填 `[]` | | `security.oidc.allowedjects` | 允许的主体列表。如果为空,则允许所有主体。 | `[]` | | `security.oidc.session-ttl` | 会话生存时间(例如 `8h`、`1h30m`、`2h`)。 | `8h` | ``` security: oidc: issuer-url: "https://example.okta.com" redirect-url: "https://status.example.com/authorization-code/callback" client-id: "123456789" client-secret: "abcdefghijk" scopes: ["openid"] # You may optionally specify a list of allowed subjects. If this is not specified, all subjects will be allowed. #allowed-subjects: ["johndoe@example.com"] # You may optionally specify a session time-to-live. If this is not specified, defaults to 8 hours. #session-ttl: 8h ``` 对使用 OIDC 感到困惑?阅读 [使用 Auth0 通过 OIDC 保护 Gatus](https://twin.sh/articles/56/securing-gatus-with-oidc-using-auth0)。 ### TLS 加密 Gatus 支持使用 TLS 进行基础加密。要启用此功能,必须提供 PEM 格式的证书文件。 以下示例展示了一个配置,使 gatus 在 4443 端口响应 HTTPS 请求: ``` web: port: 4443 tls: certificate-file: "certificate.crt" private-key-file: "private.key" ``` ### 指标 要启用指标,你必须将 `metrics` 设置为 `true`。这样做将在与应用程序配置的相同端口(`web.port`)上的 `/metrics` 端点公开 Prometheus 友好型指标。 | 指标名称 | 类型 | 描述 | 标签 | 相关端点类型 | |:---------------------------------------------|:--------|:-------------------------------------------------------------------|:------------------------------|:------------------------| | gatus_results_total | counter | 每个端点每个成功状态的次数 | key, group, name, type, success | 全部 | | gatus_results_code_total | counter | 按代码统计的总次数 | key, group, name, type, code | DNS、HTTP | | gatus_results_connected_total | counter | 成功建立连接的总次数 | key, group, name, type | 全部 | | gatus_results_duration_seconds | gauge | 请求持续时间(秒) | key, group, name, type | 全部 | | gatus_results_certificate_expiration_seconds | gauge | 证书到期前的秒数 | key, group, name, type | HTTP、STARTTLS | | gatus_results_domain_expiration_seconds | gauge | 域名到期前的秒数 | key, group, name, type | HTTP、STARTTLS | | gatus_results_endpoint_success | gauge | 显示端点是否成功(0 失败,1 成功) | key, group, name, type | 全部 | 参考 [examples/docker-compose-grafana-prometheus](.examples/docker-compose-grafana-prometheus) 获取更多文档以及示例。 #### 自定义标签 你可以通过在 `extra-labels` 字段下定义键值对,为端点的 Prometheus 指标添加自定义标签。例如: ``` endpoints: - name: front-end group: core url: "https://twin.sh/health" interval: 5m conditions: - "[STATUS] == 200" - "[BODY].status == UP" - "[RESPONSE_TIME] < 150" extra-labels: environment: staging ``` ### 连接性 | 参数 | 描述 | 默认值 | |:--------------------------------|:-----------------------------------|:--------------| | `connectivity` | 连接性配置 | `{}` | | `connectivity.checker` | 连接性检查器配置 | 必填 `{}` | | `connectivity.checker.target` | 用于验证连接性的目标主机 | 必填 `""` | | `connectivity.checker.interval` | 检查连接性的间隔 | `1m` | 由于 Gatus 用于监控其他服务,Gatus 本身可能会失去互联网连接。 为了防止 Gatus 在自身不健康时将端点报告为不健康,你可以配置 Gatus 定期检查互联网连接。 当连接性检查器认为连接不可用时,所有端点执行都会被跳过。 ``` connectivity: checker: target: 1.1.1.1:53 interval: 60s ``` ### 远程实例(实验性) 此功能允许你从远程 Gatus 实例检索端点状态。 主要有两个用例: - 你有多个在不同机器上运行的 Gatus 实例,并希望通过单个仪表板可视化状态 - 你有一个或多个无法公开访问(例如在防火墙后)的 Gatus 实例,并希望检索 这是一个实验性功能。它可能会随时被移除或以破坏性方式更新。此外, 此功能存在已知问题。如果你有反馈,请在 [#64](https://github.com/TwiN/gatus/issues/64) 中留言。 请自行承担使用风险。 | 参数 | 描述 | 默认值 | |:--------------------------------|:--------------------------------------|:--------------| | `remote` | 远程配置 | `{}` | | `remote.instances` | 远程实例列表 | 必填 `[]` | | `remote.instances.endpoint-prefix` | 为所有端点名称添加的前缀字符串 | `""` | | `remote.instances.url` | 用于检索端点状态的 URL | 必填 `""` | ``` remote: instances: - endpoint-prefix: "status.example.org-" url: "https://status.example.org/api/v1/endpoints/statuses" ``` ## 部署 许多示例可以在 [.examples](.examples) 文件夹中找到,但本节将重点介绍最流行的部署 Gatus 的方式。 ### Docker 要在本地使用 Docker 运行 Gatus: ``` docker run -p 8080:8080 --name gatus ghcr.io/twin/gatus:stable ``` 除了使用 [.examples](.examples) 文件夹中提供的示例之外,你还可以通过创建配置文件来本地尝试,我们将它称为 `config.yaml`,然后运行以下命令: ``` docker run -p 8080:8080 --mount type=bind,source="$(pwd)"/config.yaml,target=/config/config.yaml --name gatus ghcr.io/twin/gatus:stable ``` 如果你在 Windows 上,将 `"$(pwd)"` 替换为当前目录的绝对路径,例如: ``` docker run -p 8080:8080 --mount type=bind,source=C:/Users/Chris/Desktop/config.yaml,target=/config/config.yaml --name gatus ghcr.io/twin/gatus:stable ``` 要本地构建镜像: ``` docker build . -t ghcr.io/twin/gatus:stable ``` ### Helm 图表 [Helm](https://helm.sh) 必须安装才能使用图表。 请参考 Helm 的 [文档](https://helm.sh/docs/) 以开始使用。 设置好 Helm 后,按如下方式添加存储库: ``` helm repo add twin https://twin.github.io/helm-charts helm repo update helm install gatus twin/gatus ``` 要获取更多详细信息,请检查 [图表配置](https://github.com/TwiN/helm-charts/blob/master/charts/gatus/README.md)。 ### Terraform #### Kubernetes Gatus 可以使用以下模块在 Kubernetes 上通过 Terraform 部署:[terraform-kubernetes-gatus](https://github.com/TwiN/terraform-kubernetes-gatus)。 ## 运行测试 ``` go test -v ./... ``` ## 在生产环境中使用 参考 [部署](#deployment) 章节。 ## 常见问题解答 ### 发送 GraphQL 请求 通过将 `endpoints[].graphql` 设置为 `true`,请求体将自动被标准的 GraphQL `query` 参数包裹。 例如,以下配置: ``` endpoints: - name: filter-users-by-gender url: http://localhost:8080/playground method: POST graphql: true body: | { users(gender: "female") { id name gender avatar } } conditions: - "[STATUS] == 200" - "[BODY].data.users[0].gender == female" ``` 将向 `http://localhost:8080/playground` 发送 `POST` 请求,请求体如下: ``` {"query":" {\n users(gender: \"female\") {\n id\n name\n gender\n avatar\n }\n }"} ``` ### 推荐间隔 为了确保 Gatus 提供可靠且准确的结果(即响应时间),Gatus 限制了可以同时评估的端点/套件数量。 换句话说,即使你有多个具有相同间隔的端点,它们也不保证同时运行。 并发评估的数量由 `concurrency` 配置参数决定,默认为 `3`。 你可以通过运行 Gatus 并配置多个具有非常短且不现实的间隔(例如 1 毫秒)的端点来测试这一点。你会注意到响应时间不会波动——这是因为虽然端点在不同的 goroutine 中进行评估,但存在一个信号量控制同时运行的端点/套件数量。 不幸的是,这样做有一个缺点。如果你有很多端点,包括一些非常慢或容易超时的(默认超时为 10 秒),这些慢速评估可能会阻止其他端点/套件被评估。 间隔不包括请求本身的持续时间,这意味着如果一个端点的间隔为 30 秒,而请求需要 2 秒完成,则两次评估之间的时间戳将是 32 秒,而不是 30 秒。 虽然这不会阻止 Gatus 对所有其他端点执行健康检查,但可能会导致 Gatus 无法遵守配置的间隔。例如,假设 `concurrency` 设置为 `1`: - 端点 A 的间隔为 5 秒,超时时间为 10 秒 - 端点 B 的间隔为 5 秒,执行时间为 1 毫秒 - 端点 B 将无法每 5 秒运行一次,因为端点 A 的健康评估耗时比其间隔长 总结一下,虽然 Gatus 可以处理你设置的任何间隔,但最好让慢速请求使用更大的间隔。 作为经验法则,我个人将更复杂的健康检查间隔设置为 `5m`(5 分钟),将用于告警的简单健康检查(如 PagerDuty/Twilio)间隔设置为 `30s`。 ### 默认超时 | 端点类型 | 超时时间 | |:----------|:--------| | HTTP | 10s | | TCP | 0s | | ICMP | 10s | 要修改超时,请参考 [客户端配置](#client-configuration)。 ### 监控 TCP 端点 通过将 `endpoints[].url` 前缀加上 `tcp://`,你可以以非常基础的级别监控 TCP 端点: ``` endpoints: - name: redis url: "tcp://127.0.0.1:6379" interval: 30s conditions: - "[CONNECTED] == true" ``` 如果设置了 `endpoints[].body`,则会发送该内容,响应的前 1024 字节将包含在 `[BODY]` 中。 占位符 `[STATUS]` 以及字段 `endpoints[].headers`、 `endpoints[].method` 和 `endpoints[].graphql` 不支持 TCP 端点。 这适用于数据库(如 Postgres、MySQL 等)和缓存(如 Redis、Memcached 等)等应用程序。 ### 监控 UDP 端点 通过将 `endpoints[].url` 前缀加上 `udp://`,你可以以非常基础的级别监控 UDP 端点: ``` endpoints: - name: example url: "udp://example.org:80" conditions: - "[CONNECTED] == true" ``` 如果设置了 `endpoints[].body`,则会发送该内容,响应的前 1024 字节将包含在 `[BODY]` 中。 占位符 `[STATUS]` 以及字段 `endpoints[].headers`、 `endpoints[].method` 和 `endpoints[].graphql` 不支持 UDP 端点。 这适用于基于 UDP 的应用程序。 ### 监控 SCTP 端点 通过将 `endpoints[].url` 前缀加上 `sctp://`,你可以以非常基础的级别监控 SCTP 端点: ``` endpoints: - name: example url: "sctp://127.0.0.1:38412" conditions: - "[CONNECTED] == true" ``` 占位符 `[STATUS]` 和 `[BODY]` 以及字段 `endpoints[].body`、`endpoints[].headers`、 `endpoints[].method` 和 `endpoints[].graphql` 不支持 SCTP 端点。 这适用于基于 SCTP 的应用程序。 ### 监控 WebSocket 端点 通过将 `endpoints[].url` 前缀加上 `ws://` 或 `wss://`,你可以监控 WebSocket 端点: ``` endpoints: - name: example url: "wss://echo.websocket.org/" body: "status" conditions: - "[CONNECTED] == true" - "[BODY] == pat(*served by*)" ``` 占位符 `[BODY]` 包含查询的输出,`[CONNECTED]` 显示连接是否成功建立。你可以使用 Go 模板语法。 ### 使用 gRPC 监控端点 你可以通过将 `endpoints[].url` 前缀加上 `grpc://` 或 `grpcs://` 来监控 gRPC 服务。 Gatus 会针对目标执行标准的 `grpc.health.v1.Health/Check` RPC。 对于启用 TLS 的服务器,使用 `grpcs://` 并根据需要配置客户端 TLS: ``` endpoints: - name: my-grpcs url: grpcs://example.com:443 conditions: - "[CONNECTED] == true" - "[BODY].status == SERVING" client: timeout: 5s insecure: false # set true to skip cert verification (not recommended) tls: certificate-file: /path/to/cert.pem # optional mTLS client cert private-key-file: /path/to/key.pem # optional mTLS client key ``` 注意事项: - 健康检查目标默认服务(`service: ""`)。如果需要,可以稍后添加对自定义服务名称的支持。 - 响应体仅在条件或套件存储映射需要时才会被暴露为类似 `{"status":"SERVING"}` 的最小 JSON 对象。 - 超时、自定义 DNS 解析器和 SSH 隧道通过现有的 [`client` 配置](#client-configuration) 得到尊重。 ### 使用 ICMP 监控端点 通过将 `endpoints[].url` 前缀加上 `icmp://`,你可以使用 ICMP(或更常见的“ping”或“echo”)以非常基础的级别监控端点: ``` endpoints: - name: ping-example url: "icmp://example.com" conditions: - "[CONNECTED] == true" ``` 仅支持 `[CONNECTED]`、`[IP]` 和 `[RESPONSE_TIME]` 占位符的端点类型为 ICMP。 你可以指定带 `icmp://` 前缀的域名或 IP 地址。 如果你在 Linux 上运行 Gatus,请阅读 Linux 部分 [https://github.com/prometheus-community/pro-bing#linux] 如果遇到任何问题。 从 `v5.31.0` 开始,这不再需要添加 `CAP_NET_RAW` 权限,对于没有特权的 ping,除非以 root 身份运行,否则 ICMP 检查将无法工作。详见 #1346。 ### 使用 DNS 查询监控端点 在端点中定义 `dns` 配置会自动将该端点标记为 DNS 类型端点: ``` endpoints: - name: example-dns-query url: "8.8.8.8" # Address of the DNS server to use dns: query-name: "example.com" query-type: "A" conditions: - "[BODY] == 93.184.215.14" - "[DNS_RCODE] == NOERROR" ``` 对于 DNS 类型的端点,有两个可以在条件中使用的占位符: - `[BODY]` 解析为查询的输出。例如,类型为 `A` 的查询将返回 IPv4。 - `[DNS_RCODE]` 解析为查询返回的响应代码名称,例如 `NOERROR`、`FORMERR`、`SERVFAIL`、`NXDOMAIN` 等。 ### 使用 SSH 监控端点 你可以通过将 `endpoints[].url` 前缀加上 `ssh://` 来使用 SSH 监控端点: ``` endpoints: # Password-based SSH example - name: ssh-example-password url: "ssh://example.com:22" # port is optional. Default is 22. ssh: username: "username" password: "password" body: | { "command": "echo '{\"memory\": {\"used\": 512}}'" } interval: 1m conditions: - "[CONNECTED] == true" - "[STATUS] == 0" - "[BODY].memory.used > 500" # Key-based SSH example - name: ssh-example-key url: "ssh://example.com:22" # port is optional. Default is 22. ssh: username: "username" private-key: | -----BEGIN RSA PRIVATE KEY----- TESTRSAKEY... -----END RSA PRIVATE KEY----- interval: 1m conditions: - "[CONNECTED] == true" - "[STATUS] == 0" ``` 你也可以在不指定用户名、密码和私钥字段的情况下使用无认证来监控端点: ``` endpoints: - name: ssh-example url: "ssh://example.com:22" # port is optional. Default is 22. ssh: username: "" password: "" private-key: "" interval: 1m conditions: - "[CONNECTED] == true" - "[STATUS] == 0" ``` 支持以下占位符用于 SSH 类型的端点: - `[CONNECTED]` 解析为 `true`,如果 SSH 连接成功,否则为 `false` - `[STATUS]` 解析为在远程服务器上执行命令的退出代码(例如 `0` 表示成功) - `[BODY]` 解析为在远程服务器上执行命令的标准输出 - `[IP]` 解析为服务器的 IP 地址 - `[RESPONSE_TIME]` 解析为建立连接并执行命令所花费的时间 ### 使用 STARTTLS 监控端点 如果你有一个邮件服务器并希望确保其没有问题,通过 STARTTLS 监控将是一个良好的初步指示: ``` endpoints: - name: starttls-smtp-example url: "starttls://smtp.gmail.com:587" interval: 30m client: timeout: 5s conditions: - "[CONNECTED] == true" - "[CERTIFICATE_EXPIRATION] > 48h" ``` ### 使用 TLS 监控端点 监控使用 SSL/TLS 加密的端点(如 LDAP over TLS)有助于检测证书过期: ``` endpoints: - name: tls-ldaps-example url: "tls://ldap.example.com:636" interval: 30m client: timeout: 5s conditions: - "[CONNECTED] == true" - "[CERTIFICATE_EXPIRATION] > 48h" ``` 如果设置了 `endpoints[].body`,则会发送该内容,响应的前 1024 字节将包含在 `[BODY]` 中。 占位符 `[STATUS]` 以及字段 `endpoints[].headers`、 `endpoints[].method` 和 `endpoints[].graphql` 不支持 TLS 端点。 ### 监控域名过期 你可以通过使用 `[DOMAIN_EXPIRATION]` 占位符来监控所有端点类型(除 DNS 外)的域名过期: ``` endpoints: - name: check-domain-and-certificate-expiration url: "https://example.org" interval: 1h conditions: - "[DOMAIN_EXPIRATION] > 720h" - "[CERTIFICATE_EXPIRATION] > 240h" ``` ### 并发性 默认情况下,Gatus 允许同时监控最多 3 个端点/套件。这在性能和资源使用之间提供了平衡,同时保持准确的响应时间测量。 你可以使用 `concurrency` 参数配置并发级别: ``` # 允许同时监控 10 个端点/套件 concurrency: 10 # 允许无限制的同时监控 concurrency: 0 # 使用默认并发数 (3) # 并发度:3 ``` **重要注意事项:** - 更高的并发性可以提高监控性能(当你有很多端点时) - 使用 `[RESPONSE_TIME]` 占位符的条件在极高并发性下可能不太准确,因为系统资源争用 - 设置为 `0` 表示无限制并发(等同于已弃用的 `disable-monitoring-lock: true`) **更高并发性的使用场景:** - 你有很多要监控的端点 - 你希望以非常短的间隔(< 5 秒)监控端点 - 你使用 Gatus 进行负载测试场景 **遗留配置:** `disable-monitoring-lock` 参数已弃用但仍支持向后兼容。它等同于设置 `concurrency: 0`。 ### 实时重载配置 为了方便起见,Gatus 会在加载的配置文件更新时自动实时重载配置。 默认情况下,如果更新后的配置无效,应用程序将退出,但你可以配置 Gatus 在配置文件更新为无效配置时继续运行,方法是设置 `skip-invalid-config-update` 为 `true`。 请记住,在每次更新配置文件后,确保配置文件的有效性对你最有利(通过查看日志并确保你不会看到以下消息): ``` The configuration file was updated, but it is not valid. The old configuration will continue being used. ``` 不这样做可能导致在应用程序因任何原因重新启动时,Gatus 无法启动。 **如果你没有使用文件存储**,在 Gatus 运行时更新配置文件与重新启动应用程序的效果相同。 ### 端点分组 端点分组用于将多个端点分组到仪表板上。 ``` endpoints: - name: frontend group: core url: "https://example.org/" interval: 5m conditions: - "[STATUS] == 200" - name: backend group: core url: "https://example.org/" interval: 5m conditions: - "[STATUS] == 200" - name: monitoring group: internal url: "https://example.org/" interval: 5m conditions: - "[STATUS] == 200" - name: nas group: internal url: "https://example.org/" interval: 5m conditions: - "[STATUS] == 200" - name: random endpoint that is not part of a group url: "https://example.org/" interval: 5m conditions: - "[STATUS] == 200" ``` 上述配置将产生如下仪表板(按分组排序): 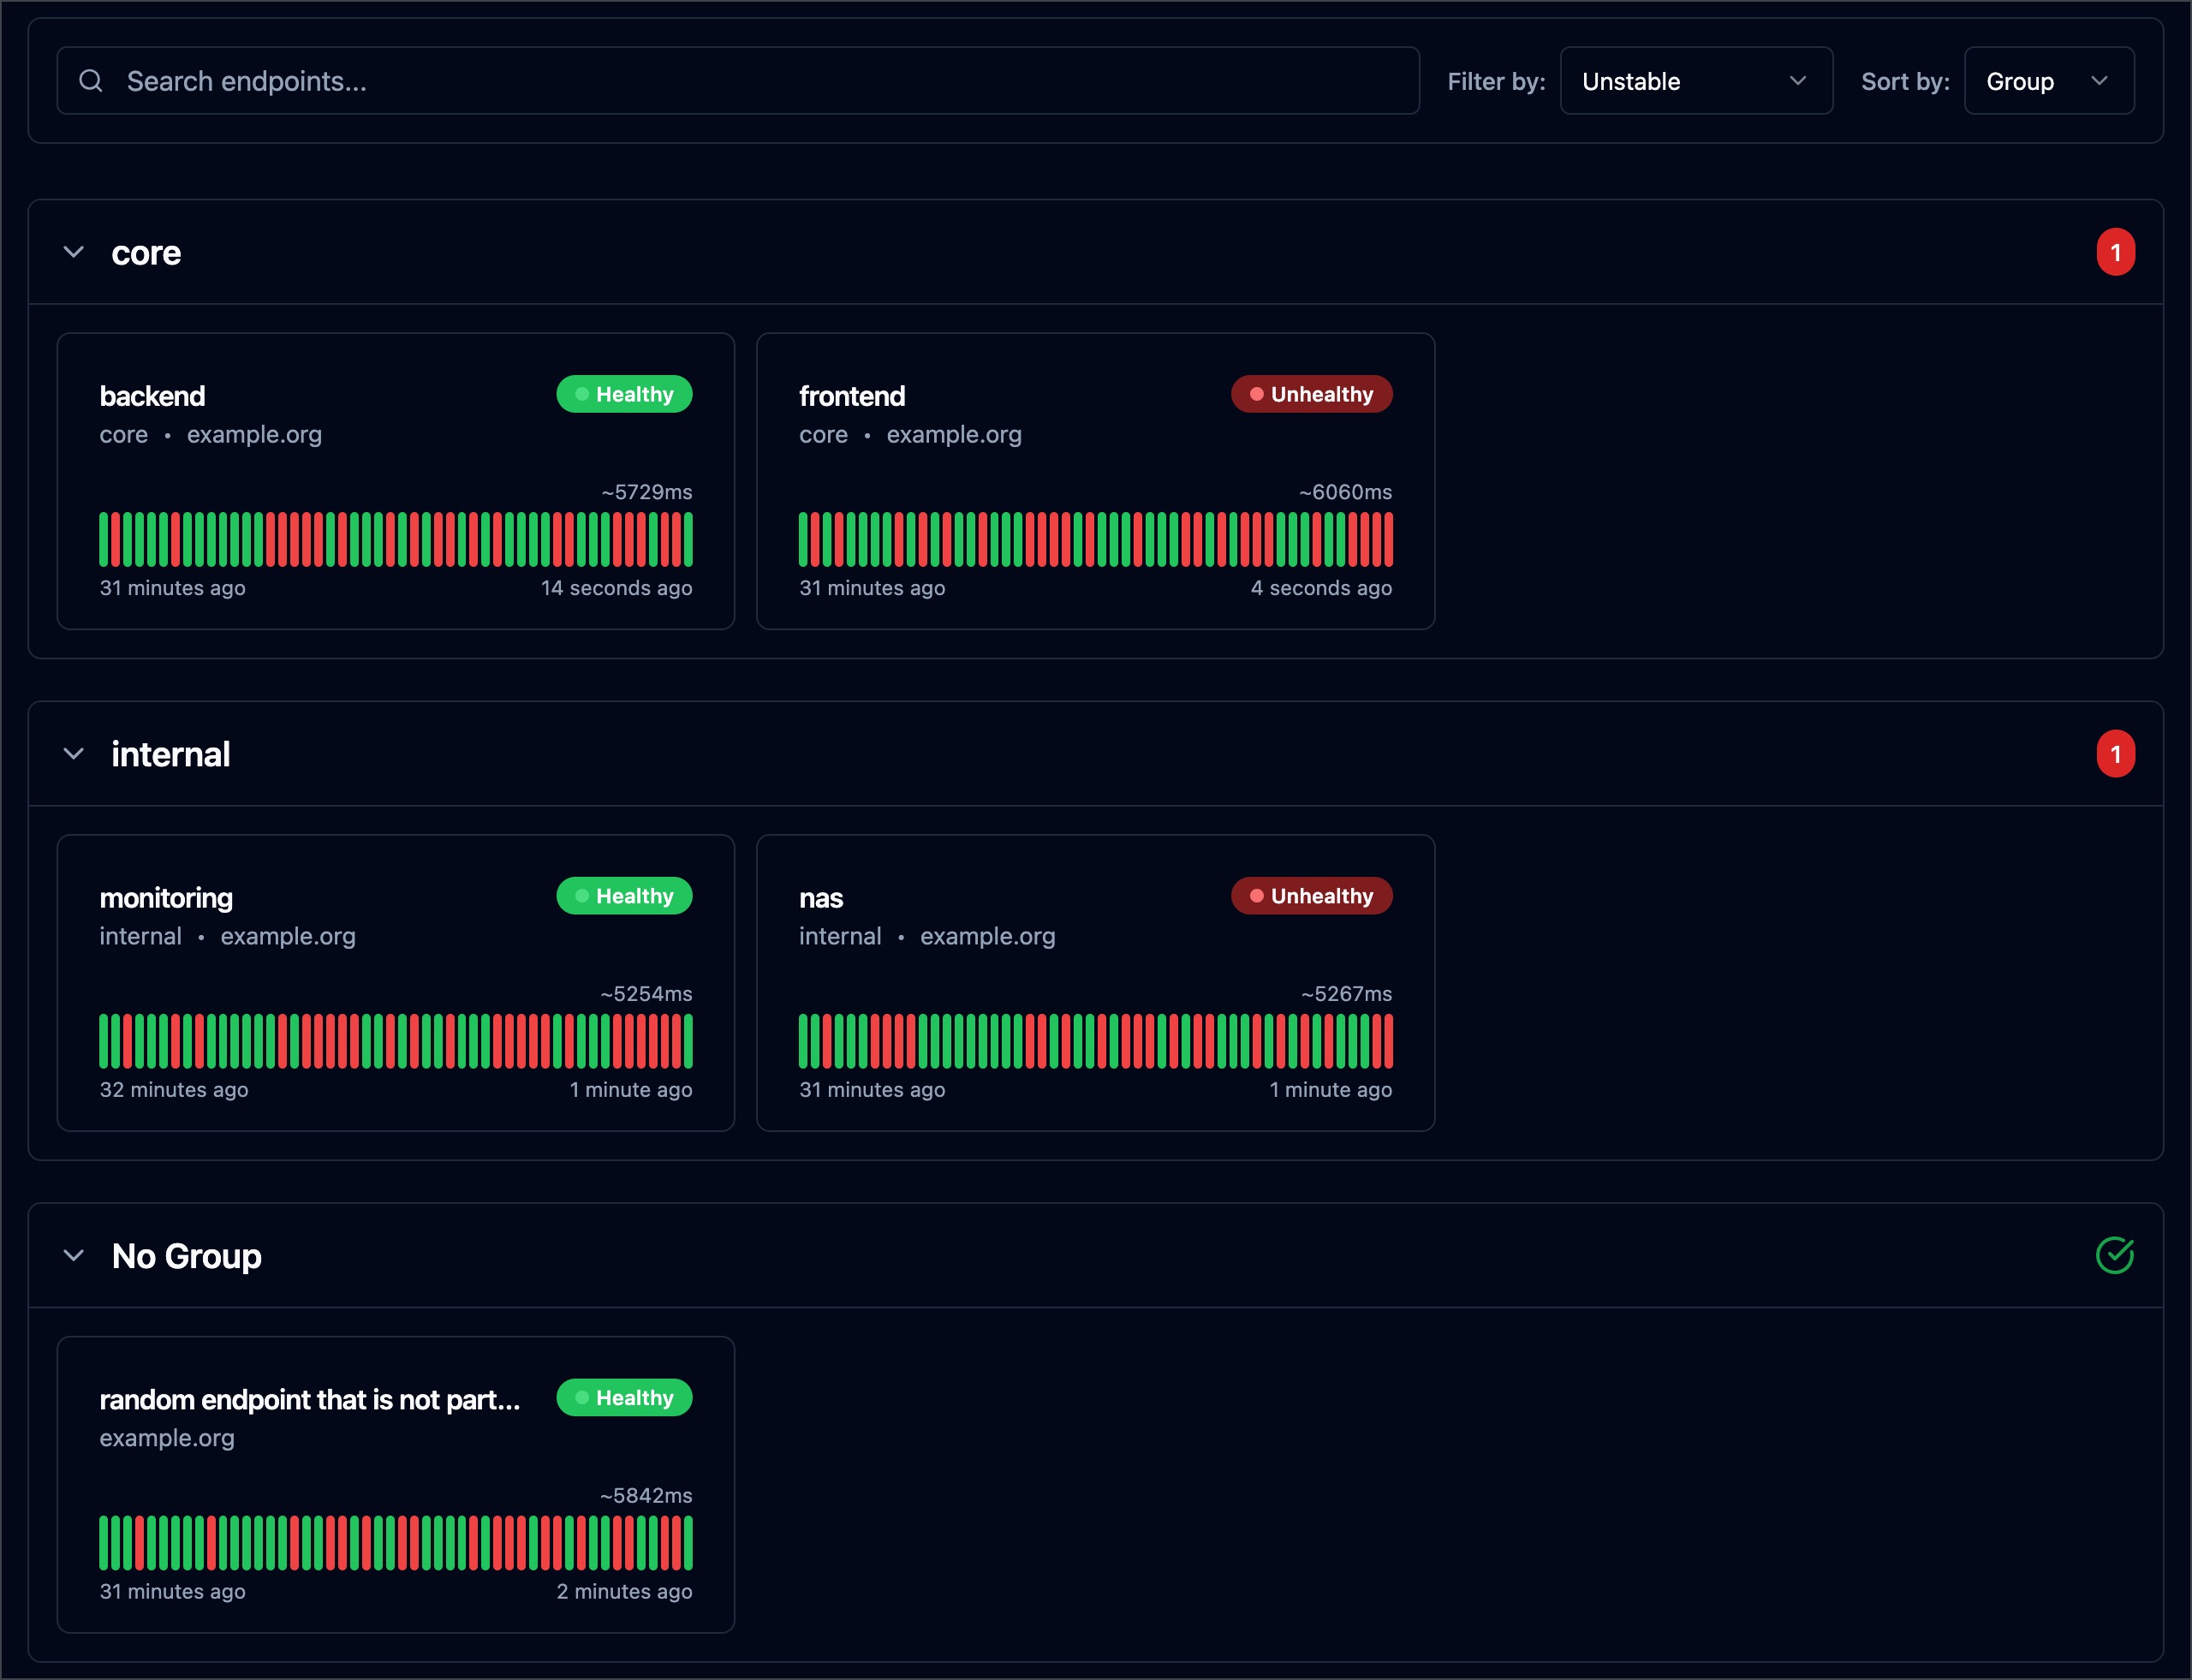 ### 如何默认按分组排序? 在配置文件中设置 `ui.default-sort-by` 为 `group`: ``` ui: default-sort-by: group ``` 请注意,如果用户已经按其他字段对仪表板进行了排序,则默认排序不会应用,除非用户清除其浏览器的本地存储。 ###自定义路径下暴露 Gatus 目前,你可以使用完全限定域名(FQDN)暴露 Gatus UI,例如 `status.example.org`。但它不支持基于路径的路由,这意味着你无法通过类似 `example.org/status/` 的 URL 暴露它。 更多相关信息,请参见 https://github.com/TwiN/gatus/issues/88。 ### 在自定义端口下暴露 Gatus 默认情况下,Gatus 在端口 `8080` 上公开,但可以通过设置 `web.port` 参数指定不同的端口: ``` web: port: 8081 ``` 如果你使用的是 Heroku 之类的 PaaS,它不允许你设置自定义端口,而是通过环境变量公开端口,请参考 [在配置文件中使用环境变量](#use-environment-variables-in-config-files)。 ### 在配置文件中使用环境变量 你可以在配置文件中直接使用环境变量,它们将从环境中替换: ``` web: port: ${PORT} ui: title: $TITLE ``` ⚠️ 当配置参数包含 `$` 符号时,你必须使用 `$$` 转义 `$`。 ### 配置启动延迟 如果出于任何原因,你需要 Gatus 在监控端点之前等待一段时间,可以使用 `GATUS_DELAY_START_SECONDS` 环境变量让 Gatus 在启动时休眠。 ### 保持配置小巧 虽然这与 Gatus 无关,但你可以利用 YAML 锚点来创建默认配置。 如果你有一个大型配置文件,这有助于保持整洁。
### 代理客户端配置
你可以通过在客户端配置中设置 `proxy-url` 参数来配置代理:
```
endpoints:
- name: website
url: "https://twin.sh/health"
client:
proxy-url: http://proxy.example.com:8080
conditions:
- "[STATUS] == 200"
```
### 如何修复 431 请求头字段太大的错误
根据你的部署环境和前置的中间件或反向代理,你可能会遇到此问题。这可能是因为请求头太大,例如大的 Cookie。
默认情况下,`web.read-buffer-size` 设置为 `8192`,但通过增加此值可以增大读缓冲区大小:
```
web:
read-buffer-size: 32768
```
### 徽章
#### 可用性


Gatus 可以自动为监控的端点生成 SVG 可用性徽章。
这允许你在各自应用程序的 README 中放置徽章,甚至可以创建自己的状态页面。
生成徽章的路径如下:
```
/api/v1/endpoints/{key}/uptimes/{duration}/badge.svg
```
其中:
- `{duration}` 为 `30d`、`7d`、`24h` 或 `1h`
- `{key}` 的模式为 `_`,其中两个变量中的空格、`/`、`_`、`,`、`.`、`#`、`+` 和 `&` 都被替换为 `-`
例如,如果你想获取过去 24 小时内 `core` 组中 `frontend` 端点的可用性数据,URL 将如下所示:
```
https://example.com/api/v1/endpoints/core_frontend/uptimes/7d/badge.svg
```
如果想显示不属于任何组的端点,必须将组值留空:
```
https://example.com/api/v1/endpoints/_frontend/uptimes/7d/badge.svg
```
示例:
```

```
如果你想查看每个可用性徽章的视觉示例,可以直接在端点详情页面导航。
#### 健康状态

生成健康状态徽章的路径如下:
```
/api/v1/endpoints/{key}/health/badge.svg
```
其中:
- `{key}` 的模式为 `_`,其中两个变量中的空格、`/`、`_`、`,`、`.`、`#`、`+` 和 `&` 都被替换为 `-`
例如,如果你想获取 `core` 组中 `frontend` 端点的当前状态,URL 将如下所示:
```
https://example.com/api/v1/endpoints/core_frontend/health/badge.svg
```
#### Health (Shields.io)

生成 Shields.io 健康状态徽章的路径如下:
```
/api/v1/endpoints/{key}/health/badge.shields
```
其中:
- `{key}` 的模式为 `_`,其中两个变量中的空格、`/`、`_`、`,`、`.`、`#`、`+` 和 `&` 都被替换为 `-`
例如,如果你想获取 `core` 组中 `frontend` 端点的当前状态,URL 将如下所示:
```
https://example.com/api/v1/endpoints/core_frontend/health/badge.shields
```
更多关于 Shields.io 徽章端点的信息,请参考 [这里](https://shields.io/badges/endpoint-badge)。
#### 响应时间


生成响应时间徽章的路径如下:
```
/api/v1/endpoints/{key}/response-times/{duration}/badge.svg
```
其中:
- `{duration}` 为 `30d`、`7d`、`24h` 或 `1h`
- `{key}` 的模式为 `_`,其中两个变量中的空格、`/`、`_`、`,`、`.`、`#`、`+` 和 `&` 都被替换为 `-`
例如,如果你想获取过去 24 小时内 `core` 组中 `frontend` 端点的响应时间数据,URL 将如下所示:
```
/api/v1/endpoints/{key}/response-times/{duration}/chart.svg
```
其中:
- `{duration}` 为 `30d`、`7d` 或 `24h`
- `{key}` 的模式为 `_`,其中两个变量中的空格、`/`、`_`、`,`、`.`、`#`、`+` 和 `&` 都被替换为 `-`
#### 响应时间(图表)


生成响应时间图表的路径如下:
```
/api/v1/endpoints/{key}/response-times/{duration}/chart.svg
```
其中:
- `{duration}` 为 `30d`、`7d` 或 `24h`
- `{key}` 的模式为 `_`,其中两个变量中的空格、`/`、`_`、`,`、`.`、`#`、`+` 和 `&` 都被替换为 `-`
#### 响应时间阈值自定义
要更改响应时间徽章的阈值,可以在端点配置中添加相应的配置。
数组中的值对应以下级别 [优秀、良好、一般、较差、糟糕]
必须提供全部五个值(以毫秒为单位)。
```
endpoints:
- name: nas
group: internal
url: "https://example.org/"
interval: 5m
conditions:
- "[STATUS] == 200"
ui:
badge:
response-time:
thresholds: [550, 850, 1350, 1650, 1750]
```
### API
Gatus 提供了一个简单的只读 API,可以用于以编程方式确定点状态和历史记录。
所有端点均可通过以下端点发起 GET 请求获取:
```
/api/v1/endpoints/statuses
```
示例:https://status.twin.sh/api/v1/endpoints/statuses
特定端点也可按如下模式查询:
```
/api/v1/endpoints/{group}_{endpoint}/statuses
```
示例:https://status.twin.sh/api/v1/endpoints/core_blog-home/statuses
如果请求头中包含 `Accept-Encoding: gzip`,则使用 Gzip 压缩。
API 将返回 `Content-Type: application/json` 响应的 JSON 有效载荷。
查询 API 无需该标头。
#### 以编程方式与 API 交互
参考 [TwiN/gatus-sdk](https://github.com/TwiN/gatus-sdk)
#### 原始数据
Gatus 公开其监控端点的原始数据。
这允许你在自己的应用程序中跟踪和聚合数据。对于例如如果你想追踪某个时间段的正常运行时间。
##### 可用性数据
获取端点原始可用性数据的路径如下:
```
/api/v1/endpoints/{key}/uptimes/{duration}
```
其中:
- `{duration}` 为 `30d`、`7d`、`24h` 或 `1h`
- `{key}` 的模式为 `_`,其中两个变量中的空格、`/`、`_`、`,`、`.`、`#`、`+` 和 `&` 都被替换为 `-`
例如,如果你想获取过去 24 小时内 `core` 组中 `frontend` 端点的原始可用性数据,URL 将如下所示:
```
https://example.com/api/v1/endpoints/core_frontend/uptimes/24h
```
##### 响应时间数据
获取端点原始响应时间数据的路径如下:
```
/api/v1/endpoints/{key}/response-times/{duration}
```
其中:
- `{duration}` 为 `30d`、`7d`、`24h` 或 `1h`
- `{key}` 的模式为 `_`,其中两个变量中的空格、`/`、`_`、`,`、`.`、`#`、`+` 和 `&` 都被替换为 `-`
例如,如果你想获取过去 24 小时内 `core` 组中 `frontend` 端点的原始响应时间数据,URL 将如下所示:
```
https://example.com/api/v1/endpoints/core_frontend/response-times/24h
```
### 安装为二进制文件
你可以使用以下命令下载 Gatus 二进制文件:
```
go install github.com/TwiN/gatus/v5@latest
```
### 高级设计概述
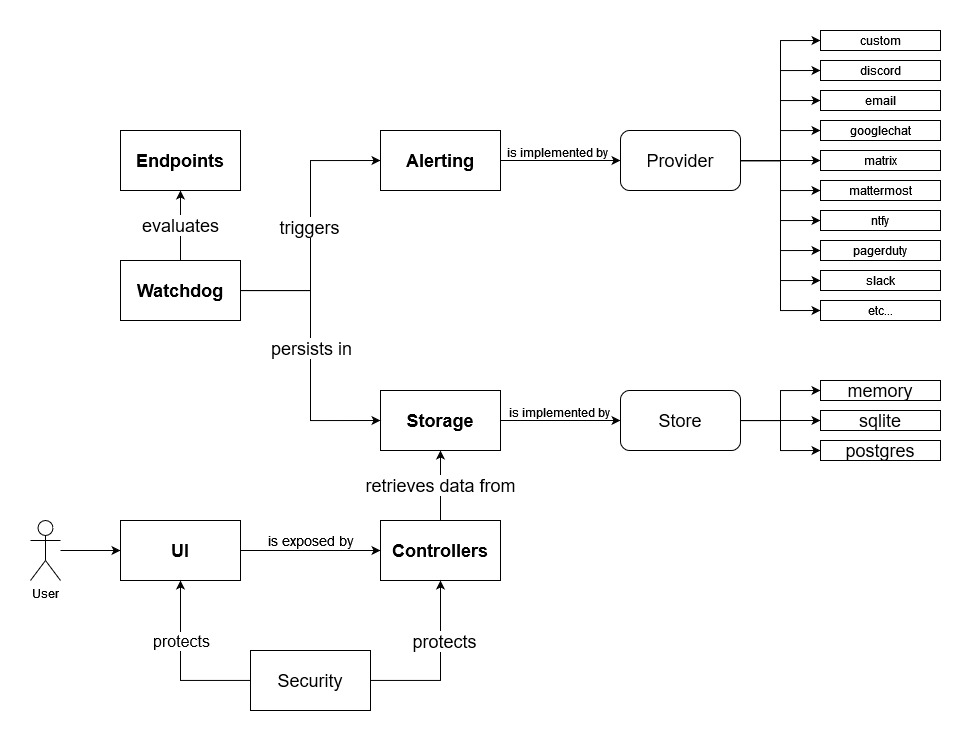
快速开始
``` docker run -p 8080:8080 --name gatus ghcr.io/twin/gatus:stable ``` 你也可以使用 Docker Hub: ``` docker run -p 8080:8080 --name gatus twinproduction/gatus:stable ``` 更多细节请参见 [使用文档](#usage)Example Domain
*)" # Body must contain the specified header ``` 这个示例看起来会类似这样: 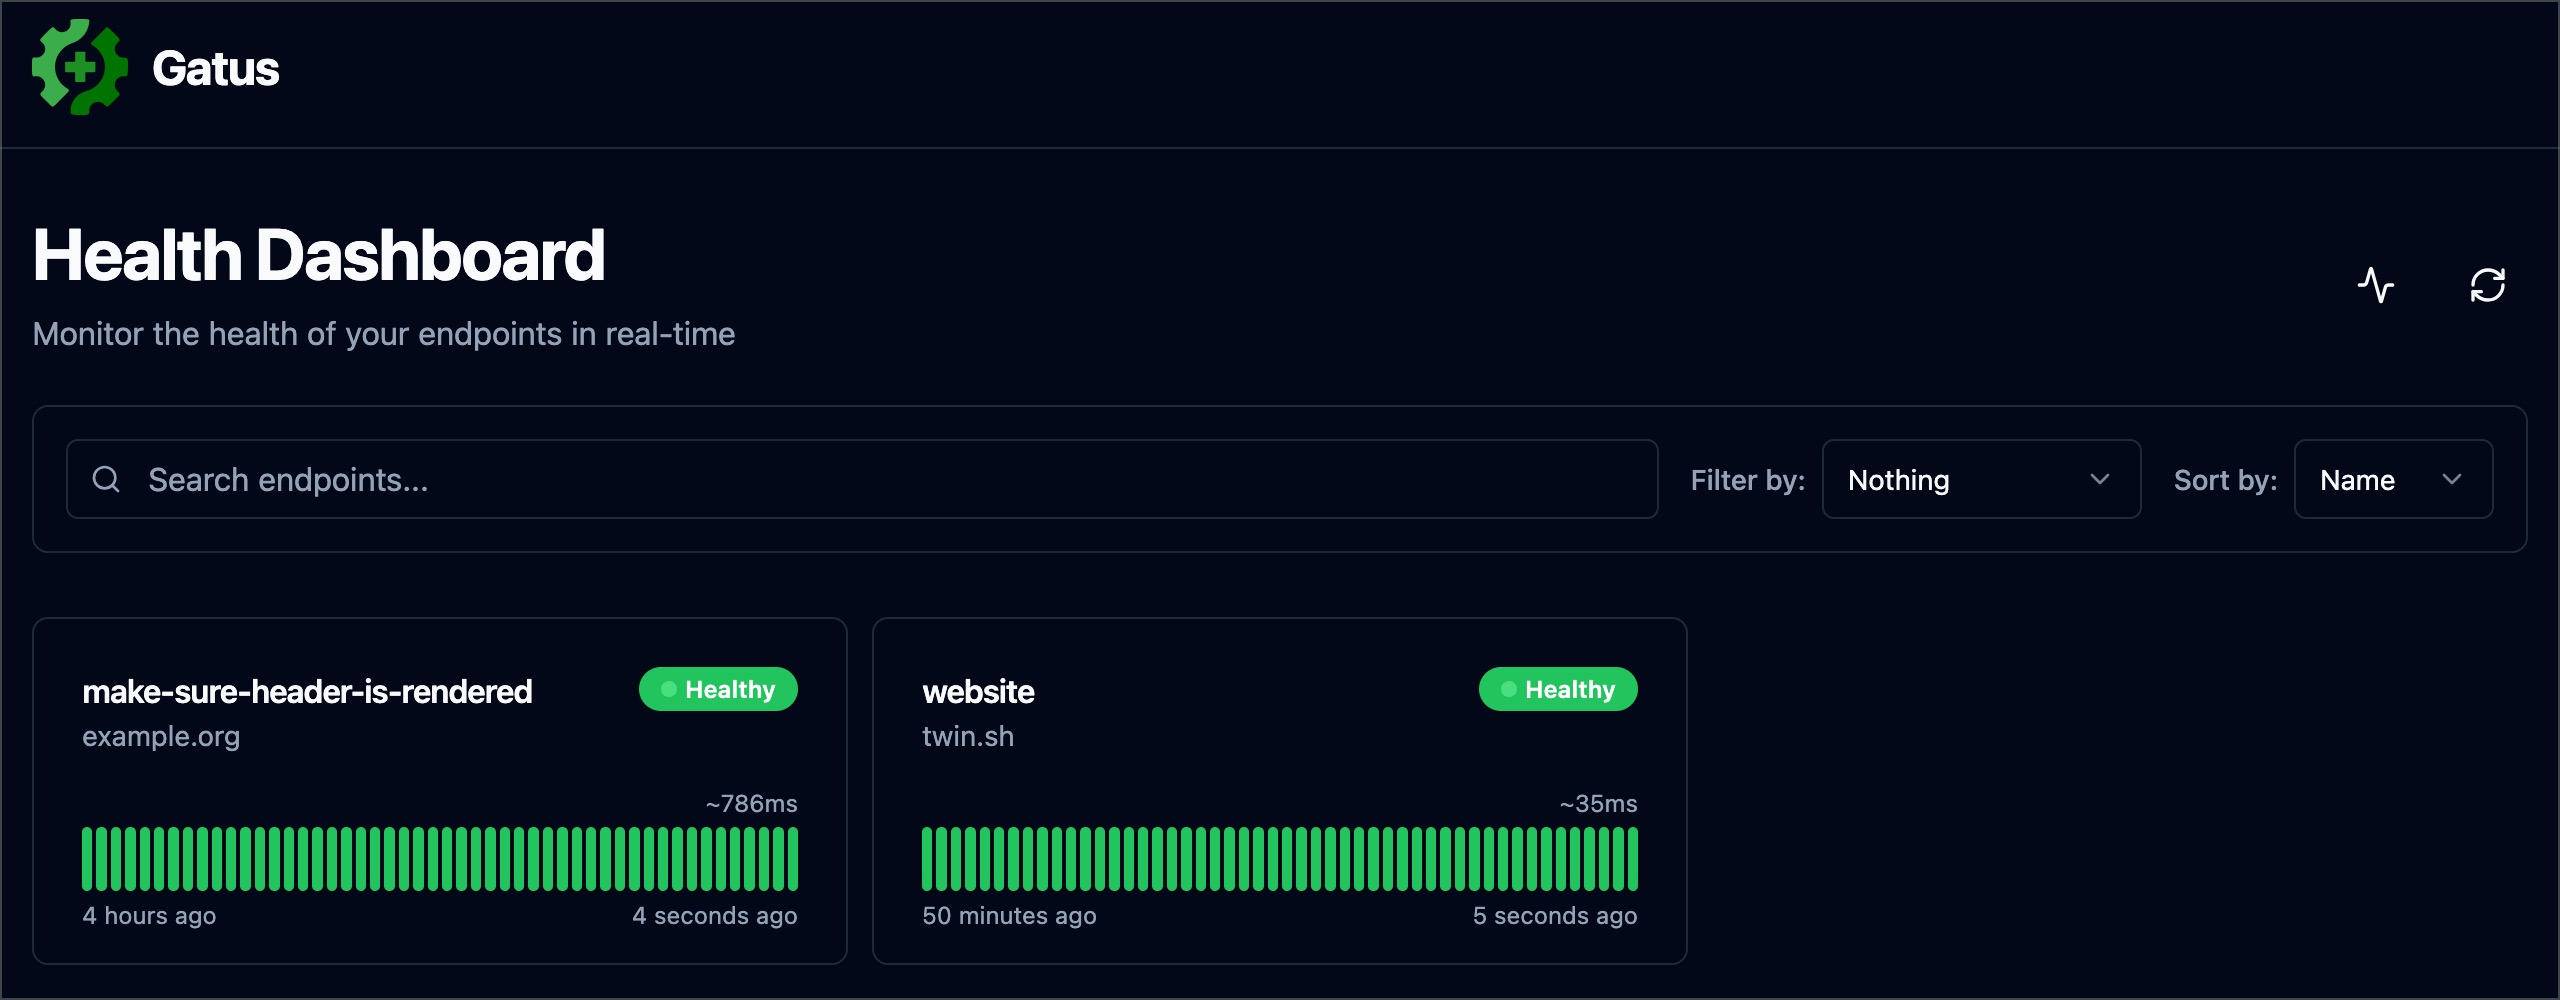 如果你想在本地测试,请参阅 [Docker](#docker)。 ## 配置 默认情况下,配置文件应位于 `config/config.yaml`。 你可以通过设置 `GATUS_CONFIG_PATH` 环境变量来指定自定义路径。 如果 `GATUS_CONFIG_PATH` 指向一个目录,则该目录及其 子目录中的所有 `*.yaml` 和 `*.yml` 文件都会像下面这样合并: - 所有映射/对象都会深度合并(即,你可以在一个文件中定义 `alerting.slack`,在另一个文件中定义 `alerting.pagerduty`) - 所有切片/数组都会追加(即,你可以在多个文件中定义 `endpoints`,每个端点都会添加到最终的端点列表中) - 具有原始值的参数(例如 `metrics`、`alerting.slack.webhook-url` 等)只能定义一次,以避免任何歧义 - 明确来说,这意味着你不能在两个文件中为 `alerting.slack.webhook-url` 定义不同的值。所有文件在处理之前都会合并为一个。这是有意为之的设计。 如果你想在本地测试,请参阅 [Docker](#docker)。 ## 配置 | 参数 | 描述 | 默认值 | |:---|:---|:---| | `metrics` | 是否在 `/metrics` 暴露指标。 | `false` | | `storage` | [存储配置](#storage)。 | `{}` | | `alerting` | [告警配置](#alerting)。 | `{}` | | `announcements` | [公告配置](#announcements)。 | `[]` | | `endpoints` | [端点配置](#endpoints)。 | 必需 `[]` | | `external-endpoints` | [外部端点配置](#external-endpoints)。 | `[]` | | `security` | [安全配置](#security)。 | `{}` | | `concurrency` | 并发监控的端点/套件最大数量。设为 `0` 表示无限制。参见 [并发](#concurrency)。 | `3` | | `disable-monitoring-lock` | 是否[禁用监控锁](#disable-monitoring-lock)。**已弃用**:请改用 `concurrency: 0`。 | `false` | | `skip-invalid-config-update` | 是否忽略无效的配置更新。参见[实时重载配置](#reloading-configuration-on-the-fly)。 | `false` | | `web` | [Web 配置](#web)。 | `{}` | | `ui` | [UI 配置](#ui)。 | `{}` | | `maintenance` | [维护配置](#maintenance)。 | `{}` | 如果你希望输出更详细的日志,可以将 `GATUS_LOG_LEVEL` 环境变量设置为 `DEBUG`。 相反,如果希望减少日志输出,可以将上述环境变量设置为 `WARN`、`ERROR` 或 `FATAL`。 `GATUS_LOG_LEVEL` 的默认值为 `INFO`。 ### 端点 端点是你想要监控的 URL、应用程序或服务。每个端点都有一个条件列表, 在指定的间隔上进行评估。如果任何条件失败,则该端点被视为不健康。 然后可以配置告警,以便在端点不健康达到某个阈值时触发。 | 参数 | 描述 | 默认值 | |:---|:---|:---| | `endpoints` | 要监控的端点列表。 | 必需 `[]` | | `endpoints[].enabled` | 是否监控该端点。 | `true` | | `endpoints[].name` | 端点名称。可以是任意值。 | 必需 `""` | | `endpoints[].group` | 组名称。用于在仪表板上将多个端点分组。
参见[端点分组](#endpoint-groups)。 | `""` | | `endpoints[].url` | 发送请求的 URL | 必需 `""` | | `endpoints[].method` | 请求方法。 | `GET` | | `endpoints[].conditions` | 用于确定端点健康状况的条件。
参见[条件](#conditions)。 | `[]` | | `endpoints[].interval` | 每次状态检查之间的持续时间。 | `60s` | | `endpoints[].graphql` | 是否将请求体包装为查询参数(`{"query":"$body"}`)。 | `false` | | `endpoints[].body` | 请求体。 | `""` | | `endpoints[].headers` | 请求头。 | `{}` | | `endpoints[].dns` | DNS 查询端点的配置。
参见[使用 DNS 查询监控端点](#monitoring-an-endpoint-using-dns-queries)。 | `""` | | `endpoints[].dns.query-type` | 查询类型(例如 MX)。 | `""` | | `endpoints[].dns.query-name` | 查询名称(例如 example.com)。 | `""` | | `endpoints[].ssh` | SSH 端点配置。
参见[使用 SSH 监控端点](#monitoring-an-endpoint-using-ssh)。 | `""` | | `endpoints[].ssh.username` | SSH 用户名(例如 example)。 | 必需 `""` | | `endpoints[].ssh.password` | SSH 密码(例如 password)。 | 必需 `""` | | `endpoints[].alerts` | 给定端点的所有告警列表。
参见[告警](#alerting)。 | `[]` | | `endpoints[].maintenance-windows` | 给定端点的所有维护窗口列表。
参见[维护](#maintenance)。 | `[]` | | `endpoints[].client` | [客户端配置](#client-configuration)。 | `{}` | | `endpoints[].ui` | 端点级别的 UI 配置。
参见[UI 配置](#ui)。 | `{}` | | `endpoints[].ui.hide-conditions` | 是否从结果中隐藏条件。请注意,这只会隐藏从启用此选项起评估的条件。 | `false` | | `endpoints[].ui.hide-hostname` | 是否从结果中隐藏主机名。 | `false` | | `endpoints[].ui.hide-port` | 是否从结果中隐藏端口。 | `false` | | `endpoints[].ui.hide-url` | 如果 URL 包含令牌,是否隐藏 URL。 | `false` | | `endpoints[].ui.hide-errors` | 是否从结果中隐藏错误。 | `false` | | `endpoints[].ui.dont-resolve-failed-conditions` | 是否在 UI 中解析失败的条件。 | `false` | | `endpoints[].ui.resolve-successful-conditions` | 是否在 UI 中解析成功的条件(有助于在检查通过时公开正文断言)。 | `false` | | `endpoints[].ui.badge.response-time` | 响应时间阈值列表。每当达到阈值时,徽章会显示不同的颜色。 | `[50, 200, 300, 500, 750]` | | `endpoints[].extra-labels` | 要添加到指标的额外标签。适用于将端点分组。 | `{}` | | `endpoints[].always-run` | (仅套件)即使套件中的先前端点失败,也是否执行此端点。 | `false` | | `endpoints[].store` | (仅套件)从响应中提取并存储在套件上下文中的值的映射(即使在失败时也存储)。 | `{}` | 你可以在请求体(`endpoints[].body`)中使用以下占位符: - `[ENDPOINT_NAME]`(从 `endpoints[].name` 解析) - `[ENDPOINT_GROUP]`(从 `endpoints[].group` 解析) - `[ENDPOINT_URL]`(从 `endpoints[].url` 解析) - `[LOCAL_ADDRESS]`(解析为本地 IP 和端口,例如 `192.0.2.1:25` 或 `[2001:db8::1]:80`) - `[RANDOM_STRING_N]`(解析为长度为 N 的随机字符串和字母(最大:8192)) ### 外部端点 与常规端点不同,外部端点不由 Gatus 监控,而是通过程序推送。 这允许你监控任何内容,即使所监控的内容在 Gatus 通常无法访问的环境中。 例如: - 你可以创建一个驻留在私有网络中的代理,并将你的服务状态推送到公开暴露的 Gatus 实例 - 你可以监控 Gatus 不支持的服务 - 你可以在使用 Gatus 作为仪表板的同时实现自己的监控系统 | 参数 | 描述 | 默认值 | |:---|:---|:---| | `external-endpoints` | 要监控的端点列表。 | `[]` | | `external-endpoints[].enabled` | 是否监控该端点。 | `true` | | `external-endpoints[].name` | 端点名称。可以是任意值。 | 必需 `""` | | `external-endpoints[].group` | 组名称。用于在仪表板上将多个端点分组。
参见[端点分组](#endpoint-groups)。 | `""` | | `external-endpoints[].token` | 推送状态所需的 Bearer 令牌。 | 必需 `""` | | `external-endpoints[].alerts` | 给定端点的所有告警列表。
参见[告警](#alerting)。 | `[]` | | `external-endpoints[].heartbeat` | 心跳配置,用于监控外部端点停止发送更新。 | `{}` | | `external-endpoints[].heartbeat.interval` | 期望的更新间隔。如果在此间隔内未收到更新,将触发告警。必须至少为 10 秒。 | `0`(禁用) | 示例: ``` external-endpoints: - name: ext-ep-test group: core token: "potato" heartbeat: interval: 30m # Automatically create a failure if no update is received within 30 minutes alerts: - type: discord description: "healthcheck failed" send-on-resolved: true ``` 要推送外部端点的状态,可以使用 [gatus-cli](https://github.com/TwiN/gatus-cli): ``` gatus-cli external-endpoint push --url https://status.example.org --key "core_ext-ep-test" --token "potato" --success ``` 或发送 HTTP 请求: ``` POST /api/v1/endpoints/{key}/external?success={success}&error={error}&duration={duration} ``` 其中: - `{key}` 的格式为 `
仅当 `storage.type` 为 `sqlite` 或 `postgres` 时有效。 | `false` | | `storage.maximum-number-of-results` | 每个端点结果的最大数量。 | `100` | | `storage.maximum-number-of-events` | 每个端点事件的最大数量。 | `50` | 每个端点的健康检查结果以及正常运行时间和事件数据必须持久化, 以便在仪表板上显示。这些参数允许你配置相应的存储。 - 如果 `storage.type` 为 `memory`(默认): ``` # 请注意,这是默认值,您可以完全省略存储配置以达到相同的结果。 # 因为数据存储在内存中,所以数据在重启后不会保留。 storage: type: memory maximum-number-of-results: 200 maximum-number-of-events: 5 ``` - 如果 `storage.type` 为 `sqlite`,`storage.path` 不能为空: ``` storage: type: sqlite path: data.db ``` 参见 [examples/docker-compose-sqlite-storage](.examples/docker-compose-sqlite-storage) 获取示例。 - 如果 `storage.type` 为 `postgres`,`storage.path` 必须为连接 URL: ``` storage: type: postgres path: "postgres://user:password@127.0.0.1:5432/gatus?sslmode=disable" ``` 参见 [examples/docker-compose-postgres-storage](.examples/docker-compose-postgres-storage) 获取示例。 ### 客户端配置 为了支持广泛的环境,每个被监控的端点都有独立的客户端配置用于发送请求。 | 参数 | 描述 | 默认值 | |:---|:---|:---| | `client.insecure` | 是否跳过验证服务器证书链和主机名。 | `false` | | `client.ignore-redirect` | 是否忽略重定向(`true`)或跟随重定向(`false`,默认)。 | `false` | | `client.timeout` | 超时时间。 | `10s` | | `client.dns-resolver` | 使用 `{proto}://{host}:{port}` 格式覆盖 DNS 解析器。 | `""` | | `client.oauth2` | OAuth2 客户端配置。 | `{}` | | `client.oauth2.token-url` | 令牌端点 URL。 | 必需 `""` | | `client.oauth2.client-id` | 用于 `Client credentials flow` 的客户端 ID。 | 必需 `""` | | `client.oauth2.client-secret` | 用于 `Client credentials flow` 的客户端密钥。 | 必需 `""` | | `client.oauth2.scopes[]` | 用于 `Client credentials flow` 的作用域列表。 | 必需 `[""]` | | `client.proxy-url` | 使用的代理 URL。 | `""` | | `client.identity-aware-proxy` | Google Identity-Aware-Proxy 客户端配置。 | `{}` | | `client.tls.certificate-file` | 用于 mTLS 的客户端证书(PEM 格式)。 | `""` | | `client.tls.private-key-file` | 用于 mTLS 的客户端私钥(PEM 格式)。 | `""` | | `client.tls.renegotiation` | 提供的重协商支持类型(`never`、`freely`、`once`)。 | `"never"` | | `client.network` | ICMP 端点客户端使用的网络(`ip`、`ip4` 或 `ip6`)。 | `"ip"` | | `client.tunnel` | 用于此端点的 SSH 隧道名称。参见[隧道](#tunneling)。 | `""` | 此默认配置如下: ``` client: insecure: false ignore-redirect: false timeout: 10s ``` 请注意,此配置仅在 `endpoints[]`、`alerting.mattermost` 和 `alerting.custom` 下可用。 以下是 `endpoints[]` 中客户端配置的示例: CODE_BLOCK_14/> 此示例展示了如何指定自定义 DNS 解析器: ``` endpoints: - name: with-custom-dns-resolver url: "https://your.health.api/health" client: dns-resolver: "tcp://8.8.8.8:53" conditions: - "[STATUS] == 200" ``` 此示例展示了如何使用 `client.oauth2` 配置查询带有 Bearer 令牌的后端 API: ``` endpoints: - name: with-custom-oauth2 url: "https://your.health.api/health" client: oauth2: token-url: https://your-token-server/token client-id: 00000000-0000-0000-0000-000000000000 client-secret: your-client-secret scopes: ['https://your.health.api/.default'] conditions: - "[STATUS] == 200" ``` 此示例展示了如何使用 `client.identity-aware-proxy` 配置查询带有 Bearer 令牌的后端 API(使用 Google Identity-Aware-Proxy): ``` endpoints: - name: with-custom-iap url: "https://my.iap.protected.app/health" client: identity-aware-proxy: audience: "XXXXXXXX-XXXXXXXXXXXX.apps.googleusercontent.com" conditions: - "[STATUS] == 200" ``` 此示例展示了如何使用 `client.tls` 配置对后端 API 执行 mTLS 查询: ``` endpoints: - name: website url: "https://your.mtls.protected.app/health" client: tls: certificate-file: /path/to/user_cert.pem private-key-file: /path/to/user_key.pem renegotiation: once conditions: - "[STATUS] == 200" ``` ### 隧道 Gatus 支持 SSH 隧道以通过跳板主机或堡垒服务器监控内部服务。 这对于无法直接从 Gatus 部署位置访问的服务特别有用。 SSH 隧道在 `tunneling` 部分全局定义,然后在端点的客户端配置中按名称引用。 | 参数 | 描述 | 默认值 | |:---|:---|:---| | `tunneling` | SSH 隧道配置。 | `{}` | | `tunneling.
参见下表获取所有有效类型。 | 必需 `""` | | `alerts[].enabled` | 是否启用该告警。 | `true` | | `alerts[].failure-threshold` | 连续失败次数达到该值后触发告警。 | `3` | | `alerts[].success-threshold` | 连续成功次数达到该值后标记问题已解决。 | `2` | | `alerts[].minimum-reminder-interval` | 告警提醒的最小间隔时间。例如 `"30m"`、`"1h45m30s"` 或 `"24h"`。如果为空或为 `0`,则禁用提醒。不得低于 `5m`。 | `0` | | `alerts[].send-on-resolved` | 告警解决后是否发送通知。 | `false` | | `alerts[].description` | 告警描述。将在发送的告警中包含。 | `""` | | `alerts[].provider-override` | 针对该告警类型覆盖全局提供者配置。 | `{}` | 以下是端点级别的告警配置示例: ``` endpoints: - name: example url: "https://example.org" conditions: - "[STATUS] == 200" alerts: - type: slack description: "healthcheck failed" send-on-resolved: true ``` 你也可以通过 `alerts[].provider-override` 全局覆盖提供者配置,例如: ``` endpoints: - name: example url: "https://example.org" conditions: - "[STATUS] == 200" alerts: - type: slack provider-override: webhook-url: "https://hooks.slack.com/services/**********/**********/**********" ``` | 参数 | 描述 | 默认值 | |:---|:---|---| | `alerting.awsses` | `aws-ses` 类型告警的配置。
参见[配置 AWS SES 告警](#configuring-aws-ses-alerts)。 | `{}` | | `alerting.clickup` | `clickup` 类型告警的配置。
参见[配置 ClickUp 告警](#configuring-clickup-alerts)。 | `{}` | | `alerting.custom` | 自定义动作在失败或告警时的配置。
参见[配置自定义告警](#configuring-custom-alerts)。 | `{}` | | `alerting.datadog` | `datadog` 类型告警的配置。
参见[配置 Datadog 告警](#configuring-datadog-alerts)。 | `{}` | | `alerting.discord` | `discord` 类型告警的配置。
参见[配置 Discord 告警](#configuring-discord-alerts)。 | `{}` | | `alerting.email` | `email` 类型告警的配置。
参见[配置 Email 告警](#configuring-email-alerts)。 | `{}` | | `alerting.gitea` | `gitea` 类型告警的配置。
参见[配置 Gitea 告警](#configuring-gitea-alerts)。 | `{}` | | `alerting.github` | `github` 类型告警的配置。
参见[配置 GitHub 告警](#configuring-github-alerts)。 | `{}` | | `alerting.gitlab` | `gitlab` 类型告警的配置。
参见[配置 GitLab 告警](#configuring-gitlab-alerts)。 | `{}` | | `alerting.googlechat` | `googlechat` 类型告警的配置。
参见[配置 Google Chat 告警](#configuring-google-chat-alerts)。 | `{}` | | `alerting.gotify` | `gotify` 类型告警的配置。
参见[配置 Gotify 告警](#configuring-gotify-alerts)。 | `{}` | | `alerting.homeassistant` | `homeassistant` 类型告警的配置。
参见[配置 HomeAssistant 告警](#configuring-homeassistant-alerts)。 | `{}` | | `alerting.ifttt` | `ifttt` 类型告警的配置。
参见[配置 IFTTT 告警](#configuring-ifttt-alerts)。 | `{}` | | `alerting.ilert` | `ilert` 类型告警的配置。
参见[配置 Ilert 告警](#configuring-ilert-alerts)。 | `{}` | | `alerting.incident-io` | `incident-io` 类型告警的配置。
参见[配置 Incident.io 告警](#configuring-incidentio-alerts)。 | `{}` | | `alerting.line` | `line` 类型告警的配置。
参见[配置 Line 告警](#configuring-line-alerts)。 | `{}` | | `alerting.matrix` | `matrix` 类型告警的配置。
参见[配置 Matrix 告警](#configuring-matrix-alerts)。 | `{}` | | `alerting.mattermost` | `mattermost` 类型告警的配置。
参见[配置 Mattermost 告警](#configuring-mattermost-alerts)。 | `{}` | | `alerting.messagebird` | `messagebird` 类型告警的配置。
参见[配置 Messagebird 告警](#configuring-messagebird-alerts)。 | `{}` | | `alerting.n8n` | `n8n` 类型告警的配置。
参见[配置 n8n 告警](#configuring-n8n-alerts)。 | `{}` | | `alerting.newrelic` | `newrelic` 类型告警的配置。
参见[配置 New Relic 告警](#configuring-new-relic-alerts)。 | `{}` | | `alerting.ntfy` | `ntfy` 类型告警的配置。
参见[配置 Ntfy 告警](#conditions)。 | `{}` | | `alerting.opsgenie` | `opsgenie` 类型告警的配置。
参见[配置 Opsgenie 告警](#configuring-opsgenie-alerts)。 | `{}` | | `alerting.pagerduty` | `pagerduty` 类型告警的配置。
参见[配置 PagerDuty 告警](#configuring-pagerduty-alerts)。 | `{}` | | `alerting.plivo` | `plivo` 类型告警的配置。
参见[配置 Plivo 告警](#configuring-plivo-alerts)。 | `{}` | | `alerting.pushover` | `pushover` 类型告警的配置。
参见[配置 Pushover 告警](#configuring-pushover-alerts)。 | `{}` | | `alerting.rocketchat` | `rocketchat` 类型告警的配置。
参见[配置 Rocket.Chat 告警](#configuring-rocketchat-alerts)。 | `{}` | | `alerting.sendgrid` | `sendgrid` 类型告警的配置。
参见[配置 SendGrid 告警](#configuring-sendgrid-alerts)。 | `{}` | | `alerting.signal` | `signal` 类型告警的配置。
参见[配置 Signal 告警](#configuring-signal-alerts)。 | `{}` | | `alerting.signl4` | `signl4` 类型告警的配置。
参见[配置 SIGNL4 告警](#configuring-signl4-alerts)。 | `{}` | | `alerting.slack` | `slack` 类型告警的配置。
参见[配置 Slack 告警](#configuring-slack-alerts)。 | `{}` | | `alerting.splunk` | `splunk` 类型告警的配置。
参见[配置 Splunk 告警](#configuring-splunk-alerts)。 | `{}` | | `alerting.squadcast` | `squadcast` 类型告警的配置。
参见[配置 Squadcast 告警](#configuring-squadcast-alerts)。 | `{}` | | `alerting.teams` | `teams` 类型告警的配置。*(已弃用)*
参见[配置 Teams 告警](#configuring-teams-alerts-deprecated)。 | `{}` | | `alerting.teams-workflows` | `teams-workflows` 类型告警的配置。
参见[配置 Teams Workflow 告警](#configuring-teams-workflow-alerts)。 | `{}` | | `alerting.telegram` | `telegram` 类型告警的配置。
参见[配置 Telegram 告警](#configuring-telegram-alerts)。 | `{}` | | `alerting.twilio` | `twilio` 类型告警的配置。
参见[配置 Twilio 告警](#configuring-twilio-alerts)。 | `{}` | | `alerting.vonage` | `vonage` 类型告警的配置。
参见[配置 Vonage 告警](#configuring-vonage-alerts)。 | `{}` | | `alerting.webex` | `webex` 类型告警的配置。
参见[配置 Webex 告警](#configuring-webex-alerts)。 | `{}` | | `alerting.zapier` | `zapier` 类型告警的配置。
参见[配置 Zapier 告警](#configuring-zapier-alerts)。 | `{}` | | `alerting.zulip` | `zulip` 类型告警的配置。
参见[配置 Zulip 告警](#configuring-zulip-alerts)。 | `{}` | #### 配置 AWS SES 告警 | 参数 | 描述 | 默认值 | |:---|:---|---| | `alerting.aws-ses` | `aws-ses` 类型告警的配置。
参见[配置 AWS SES 告警](#configuring-aws-ses-alerts)。 | `{}` | | `alerting.aws-ses.access-key-id` | AWS Access Key ID。 | 可选 `""` | | `alerting.aws-ses.secret-access-key` | AWS Secret Access Key。 | 可选 `""` | | `alerting.aws-ses.region` | AWS 区域。 | 必需 `""` | | `alerting.aws-ses.from` | 发送邮件的邮箱地址(需在 SES 中注册)。 | 必需 `""` | | `alerting.aws-ses.to` | 逗号分隔的收件人邮箱地址列表。 | 必需 `""` | | `alerting.aws-ses.default-alert` | 默认告警配置。
参见[设置默认告警](#setting-a-default-alert)。 | N/A | | `alerting.aws-ses.overrides` | 可能优先于默认配置的覆盖列表。 | `[]` | | `alerting.aws-ses.overrides[].group` | 该配置将覆盖此组端点的配置。 | `""` | | `alerting.aws-ses.overrides[].*` | 参考 `alerting.aws-ses.*` 参数。 | `{}` | 如果 `access-key-id` 和 `secret-access-key` 未定义,Gatus 将回退到 IAM 身份验证。 确保你有 `ses:SendEmail` 权限。 #### 配置 ClickUp 告警 | 参数 | 描述 | 默认值 | |:---|:---|---| | `alerting.clickup` | `clickup` 类型告警的配置。 | `{}` | | `alerting.clickup.list-id` | ClickUp 列表 ID,用于创建任务。 | 必需 `""` | | `alerting.clickup.token` | ClickUp API 令牌。 | 必需 `""` | | `alerting.clickup.api-url` | 自定义 API URL。 | `https://api.clickup.com/api/v2` | | `alerting.clickup.assignees` | 要指派的任务用户 ID 列表。 | `[]` | | `alerting.clickup.status` | 创建任务的初始状态。 | `""` | | `alerting.clickup.priority` | 优先级:`urgent`、`high`、`normal`、`low` 或 `none`。 | `normal` | | `alerting.clickup.notify-all` | 创建任务时是否通知所有指派用户。 | `true` | | `alerting.clickup.name` | 自定义任务名称模板(支持占位符)。 | `Health Check: [ENDPOINT_GROUP]:[ENDPOINT_NAME]` | | `alerting.clickup.content` | 自定义任务内容模板(支持占位符)。 | `Triggered: [ENDPOINT_GROUP] - [ENDPOINT_NAME] - [ALERT_DESCRIPTION] - [RESULT_ERRORS]` | | `alerting.clickup.default-alert` | 默认告警配置。
参见[设置默认告警](#setting-a-default-alert)。 | N/A | | `alerting.clickup.overrides` | 可能优先于默认配置的覆盖列表。 | `[]` | | `alerting.clickup.overrides[].group` | 将由此配置覆盖配置的端点组 | `""` | | `alerting.clickup.overrides[].*` | 请参见 `alerting.clickup.*` 参数 | `{}` | ClickUp 警报提供者在 ClickUp 列表中创建任务,当触发警报时。如果将端点警报的 `send-on-resolved` 设置为 `true`,任务将在警报解决后自动关闭。 `name` 和 `content` 中支持以下占位符: - `[ENDPOINT_GROUP]` - 从 `endpoints[].group` 解析 - `[ENDPOINT_NAME]` - 从 `endpoints[].name` 解析 - `[ALERT_DESCRIPTION]` - 从 `endpoints[].alerts[].description` 解析 - `[RESULT_ERRORS]` - 从健康评估错误解析 ``` alerting: clickup: list-id: "123456789" token: "pk_xxxxxxxxxxxxxxxxxxxxxxxxxxxxxxxx" assignees: - "12345" - "67890" status: "in progress" priority: high name: "Health Check Alert: [ENDPOINT_GROUP] - [ENDPOINT_NAME]" content: "Alert triggered for [ENDPOINT_GROUP] - [ENDPOINT_NAME] - [ALERT_DESCRIPTION] - [RESULT_ERRORS]" endpoints: - name: website url: "https://twin.sh/health" interval: 5m conditions: - "[STATUS] == 200" alerts: - type: clickup send-on-resolved: true ``` 要获取您的 ClickUp API 令牌,请参考:[生成或重新生成个人 API 令牌](https://developer.clickup.com/docs/authentication#:~:text=the%20API%20docs.-,Generate%20or%20regenerate%20a%20Personal%20API%20Token,-Log%20in%20to) 要查找您的列表 ID: 1. 打开您希望创建任务的 ClickUp 列表 2. 列表 ID 位于 URL 中:`https://app.clickup.com/{workspace_id}/v/l/li/{list_id}` 要查找指派者 ID: 1. 访问 `https://app.clickup.com/{workspace_id}/teams-pulse/teams/people` 2. 悬停在团队成员上 3. 点击三个点(更多菜单) 4. 点击 `Copy member ID` #### 配置 Datadog 警报 | 参数 | 描述 | 默认值 | |------|------|--------| | `alerting.datadog` | `datadog` 类型警报的配置 | `{}` | | `alerting.datadog.api-key` | Datadog API 密钥 | 必填 `""` | | `alerting.datadog.site` | Datadog 站点(例如 datadoghq.com、datadoghq.eu) | `"datadoghq.com"` | | `alerting.datadog.tags` | 要包含的附加标签 | `[]` | | `alerting.datadog.default-alert` | 默认警报配置。
请参见 [设置默认警报](#setting-a-default-alert) | N/A | | `alerting.datadog.overrides` | 可能优先于默认配置的覆盖列表 | `[]` | | `alerting.datadog.overrides[].group` | 将由此配置覆盖配置的端点组 | `""` | | `alerting.datadog.overrides[].*` | 请参见 `alerting.datadog.*` 参数 | `{}` | ``` alerting: datadog: api-key: "YOUR_API_KEY" site: "datadoghq.com" # or datadoghq.eu for EU region tags: - "environment:production" - "team:platform" endpoints: - name: website url: "https://twin.sh/health" interval: 5m conditions: - "[STATUS] == 200" alerts: - type: datadog send-on-resolved: true ``` #### 配置 Discord 警报 | 参数 | 描述 | 默认值 | |------|------|--------| | `alerting.discord` | `discord` 类型警报的配置 | `{}` | | `alerting.discord.webhook-url` | Discord Webhook URL | 必填 `""` | | `alerting.discord.title` | 通知标题 | `":helmet_with_white_cross: Gatus"` | | `alerting.discord.message-content` | 在嵌入之前发送的消息内容(用于提及用户/角色,例如 `<@123>`) | `""` | | `alerting.discord.default-alert` | 默认警报配置。
请参见 [设置默认警报](#setting-a-default-alert) | N/A | | `alerting.discord.overrides` | 可能优先于默认配置的覆盖列表 | `[]` | | `alerting.discord.overrides[].group` | 将由此配置覆盖配置的端点组 | `""` | | `alerting.discord.overrides[].*` | 请参见 `alerting.discord.*` 参数 | `{}` | ``` alerting: discord: webhook-url: "https://discord.com/api/webhooks/**********/**********" endpoints: - name: website url: "https://twin.sh/health" interval: 5m conditions: - "[STATUS] == 200" - "[BODY].status == UP" - "[RESPONSE_TIME] < 300" alerts: - type: discord description: "healthcheck failed" send-on-resolved: true ``` #### 配置 Email 警报 | 参数 | 描述 | 默认值 | |------|------|--------| | `alerting.email` | `email` 类型警报的配置 | `{}` | | `alerting.email.from` | 发送警报的电子邮件 | 必填 `""` | | `alerting.email.username` | 用于发送警报的 SMTP 服务器用户名。如果为空,则使用 `alerting.email.from` | `""` | | `alerting.email.password` | 用于发送警报的 SMTP 服务器密码。如果为空,则不进行身份验证 | `""` | | `alerting.email.host` | 邮件服务器主机(例如 `smtp.gmail.com`) | 必填 `""` | | `alerting.email.port` | 邮件服务器监听端口(例如 `587`) | 必填 `0` | | `alerting.email.to` | 接收警报的电子邮件地址 | 必填 `""` | | `alerting.email.default-alert` | 默认警报配置。
请参见 [设置默认警报](#setting-a-default-alert) | N/A | | `alerting.email.client.insecure` | 是否跳过 TLS 验证 | `false` | | `alerting.email.overrides` | 可能优先于默认配置的覆盖列表 | `[]` | | `alerting.email.overrides[].group` | 将由此配置覆盖配置的端点组 | `""` | | `alerting.email.overrides[].*` | 请参见 `alerting.email.*` 参数 | `{}` | ``` alerting: email: from: "from@example.com" username: "from@example.com" password: "hunter2" host: "mail.example.com" port: 587 to: "recipient1@example.com,recipient2@example.com" client: insecure: false # You can also add group-specific to keys, which will # override the to key above for the specified groups overrides: - group: "core" to: "recipient3@example.com,recipient4@example.com" endpoints: - name: website url: "https://twin.sh/health" interval: 5m conditions: - "[STATUS] == 200" - "[BODY].status == UP" - "[RESPONSE_TIME] < 300" alerts: - type: email description: "healthcheck failed" send-on-resolved: true - name: back-end group: core url: "https://example.org/" interval: 5m conditions: - "[STATUS] == 200" - "[CERTIFICATE_EXPIRATION] > 48h" alerts: - type: email description: "healthcheck failed" send-on-resolved: true ``` #### 配置 Gitea 警报 | 参数 | 描述 | 默认值 | |------|------|--------| | `alerting.gitea` | `gitea` 类型警报的配置 | `{}` | | `alerting.gitea.repository-url` | Gitea 仓库 URL(例如 `https://gitea.com/TwiN/example`) | 必填 `""` | | `alerting.gitea.token` | 用于身份验证的个人访问令牌。
必须至少具有问题的 RW 权限和元数据的 RO 权限 | 必填 `""` | | `alerting.gitea.default-alert` | 默认警报配置。
请参见 [设置默认警报](#setting-a-default-alert) | N/A | Gitea 警报提供者为每个警报创建一个标题以 `alert(gatus):` 开头并以端点显示名称结尾的问题。如果将端点警报的 `send-on-resolved` 设置为 `true`,问题将在警报解决后自动关闭。 ``` alerting: gitea: repository-url: "https://gitea.com/TwiN/test" token: "349d63f16......" endpoints: - name: example url: "https://twin.sh/health" interval: 5m conditions: - "[STATUS] == 200" - "[BODY].status == UP" - "[RESPONSE_TIME] < 75" alerts: - type: gitea failure-threshold: 2 success-threshold: 3 send-on-resolved: true description: "Everything's burning AAAAAHHHHHHHHHHHHHHH" ```  #### 配置 GitHub 警报 | 参数 | 描述 | 默认值 | |------|------|--------| | `alerting.github` | `github` 类型警报的配置 | `{}` | | `alerting.github.repository-url` | GitHub 仓库 URL(例如 `https://github.com/TwiN/example`) | 必填 `""` | | `alerting.github.token` | 用于身份验证的个人访问令牌。
必须至少具有问题的 RW 权限和元数据的 RO 权限 | 必填 `""` | | `alerting.github.default-alert` | 默认警报配置。
请参见 [设置默认警报](#setting-a-default-alert) | N/A | GitHub 警报提供者为每个警报创建一个标题以 `alert(gatus):` 开头并以端点显示名称结尾的问题。如果将端点警报的 `send-on-resolved` 设置为 `true`,问题将在警报解决后自动关闭。 ``` alerting: github: repository-url: "https://github.com/TwiN/test" token: "github_pat_12345..." endpoints: - name: example url: "https://twin.sh/health" interval: 5m conditions: - "[STATUS] == 200" - "[BODY].status == UP" - "[RESPONSE_TIME] < 75" alerts: - type: github failure-threshold: 2 success-threshold: 3 send-on-resolved: true description: "Everything's burning AAAAAHHHHHHHHHHHHHHH" ```  #### 配置 GitLab 警报 | 参数 | 描述 | 默认值 | |------|------|--------| | `alerting.gitlab` | `gitlab` 类型警报的配置 | `{}` | | `alerting.gitlab.webhook-url` | GitLab 警报 Webhook URL(例如 `https://gitlab.com/yourusername/example/alerts/notify/gatus/xxxxxxxxxxxxxxxx.json`) | 必填 `""` | | `alerting.gitlab.authorization-key` | GitLab 警报授权密钥 | 必填 `""` | | `alerting.gitlab.severity` | 覆盖默认严重性(critical),可以是 `critical, high, medium, low, info, unknown` 之一 | `""` | | `alerting.gitlab.monitoring-tool` | 覆盖监控工具名称(gatus) | `"g"` | | `alerting.gitlab.environment-name` | 设置 GitLab 环境名称。需要在仪表板上显示警报 | `""` | | `alerting.gitlab.service` | 覆盖端点显示名称 | `""` | | `alerting.gitlab.default-alert` | 默认警报配置。
请参见 [设置默认警报](#setting-a-default-alert) | N/A | GitLab 警报提供者为每个警报创建一个标题以 `alert(gatus):` 开头并以端点显示名称结尾的警报。如果将端点警报的 `send-on-resolved` 设置为 `true`,警报将在解决后自动关闭。请参见 [配置端点](https://docs.gitlab.com/ee/operations/incident_management/integrations.html#configuration) 以获取详细信息。 ``` alerting: gitlab: webhook-url: "https://gitlab.com/hlidotbe/example/alerts/notify/gatus/xxxxxxxxxxxxxxxx.json" authorization-key: "12345" endpoints: - name: example url: "https://twin.sh/health" interval: 5m conditions: - "[STATUS] == 200" - "[BODY].status == UP" - "[RESPONSE_TIME] < 75" alerts: - type: gitlab failure-threshold: 2 success-threshold: 3 send-on-resolved: true description: "Everything's burning AAAAAHHHHHHHHHHHHHHH" ```  #### 配置 Google Chat 警报 | 参数 | 描述 | 默认值 | |------|------|--------| | `alerting.googlechat` | `googlechat` 类型警报的配置 | `{}` | | `alerting.googlechat.webhook-url` | Google Chat Webhook URL | 必填 `""` | | `alerting.googlechat.client` | 客户端配置。
请参见 [客户端配置](#client-configuration) | `{}` | | `alerting.googlechat.default-alert` | 默认警报配置。
请参见 [设置默认警报](#setting-a-default-alert) | N/A | | `alerting.googlechat.overrides` | 可能优先于默认配置的覆盖列表 | `[]` | | `alerting.googlechat.overrides[].group` | 将由此配置覆盖配置的端点组 | `""` | | `alerting.googlechat.overrides[].*` | 请参见 `alerting.googlechat.*` 参数 | `{}` | ``` alerting: googlechat: webhook-url: "https://chat.googleapis.com/v1/spaces/*******/messages?key=**********&token=********" endpoints: - name: website url: "https://twin.sh/health" interval: 5m conditions: - "[STATUS] == 200" - "[BODY].status == UP" - "[RESPONSE_TIME] < 300" alerts: - type: googlechat description: "healthcheck failed" send-on-resolved: true ``` #### 配置 Gotify 警报 | 参数 | 描述 | 默认值 | |------|------|--------| | `alerting.gotify` | `gotify` 类型警报的配置 | `{}` | | `alerting.gotify.server-url` | Gotify 服务器 URL | 必填 `""` | | `alerting.gotify.token` | 用于身份验证的令牌 | 必填 `""` | | `alerting.gotify.priority` | 根据 Gotify 标准设置的警报优先级 | `5` | | `alerting.gotify.title` | 通知标题 | `"Gatus:
请参见 [设置默认警报](#setting-a-default-alert) | N/A | 以下是通知的示例:  #### 配置 HomeAssistant 警报 | 参数 | 描述 | 默认值 | |------|------|--------| | `alerting.homeassistant.url` | HomeAssistant 实例 URL | 必填 `""` | | `alerting.homeassistant.token` | HomeAssistant 长效访问令牌 | 必填 `""` | | `alerting.homeassistant.default-alert` | 用于具有相应类型警报的端点的默认警报配置 | `{}` | | `alerting.homeassistant.overrides` | 可能优先于默认配置的覆盖列表 | `[]` | | `alerting.homeassistant.overrides[].group` | 将由此配置覆盖配置的端点组 | `""` | | `alerting.homeassistant.overrides[].*` | 请参见 `alerting.homeassistant.*` 参数 | `{}` | 警报将作为事件发送到 HomeAssistant,事件类型为 `gatus_alert`。事件数据包括: - `status`: "triggered" 或 "resolved" - `endpoint`: 被监控端点的名称 - `description`: 如果提供了警报描述 - `conditions`: 条件及其结果的列表 - `failure_count`: 连续失败次数(触发时) - `success_count`: 连续成功次数(解决时) 您可以在 HomeAssistant 自动化中使用这些事件来: - 发送通知 - 控制设备 - 触发场景 - 记录到历史记录 - 等等 HomeAssistant 自动化示例: ``` automation: - alias: "Gatus Alert Handler" trigger: platform: event event_type: gatus_alert action: - service: notify.notify data_template: title: "Gatus Alert: {{ trigger.event.data.event_data.endpoint }}" message: > Status: {{ trigger.event.data.event_data.status }} {% if trigger.event.data.event_data.description %} Description: {{ trigger.event.data.event_data.description }} {% endif %} {% for condition in trigger.event.data.event_data.conditions %} {{ '✅' if condition.success else '❌' }} {{ condition.condition }} {% endfor %} ``` 要获取您的 HomeAssistant 长效访问令牌: 1. 打开 HomeAssistant 2. 点击您的用户名(左下角) 3. 向下滚动到“长效访问令牌” 4. 点击“创建令牌” 5. 命名(例如,“Gatus”) 6. 复制令牌 - 您只会看到一次! #### 配置 IFTTT 警报 | 参数 | 描述 | 默认值 | |------|------|--------| | `alerting.ifttt` | `ifttt` 类型警报的配置 | `{}` | | `alerting.ifttt.webhook-key` | IFTTT Webhook 密钥 | 必填 `""` | | `alerting.ifttt.event-name` | IFTTT 事件名称 | 必填 `""` | | `alerting.ifttt.default-alert` | 默认警报配置。
请参见 [设置默认警报](#setting-a-default-alert) | N/A | | `alerting.ifttt.overrides` | 可能优先于默认配置的覆盖列表 | `[]` | | `alerting.ifttt.overrides[].group` | 将由此配置覆盖配置的端点组 | `""` | | `alerting.ifttt.overrides[].*` | 请参见 `alerting.ifttt.*` 参数 | `{}` | ``` alerting: ifttt: webhook-key: "YOUR_WEBHOOK_KEY" event-name: "gatus_alert" endpoints: - name: website url: "https://twin.sh/health" interval: 5m conditions: - "[STATUS] == 200" alerts: - type: ifttt send-on-resolved: true ``` #### 配置 Ilert 警报 | 参数 | 描述 | 默认值 | |------|------|--------| | `alerting.ilert` | `ilert` 类型警报的配置 | `{}` | | `alerting.ilert.integration-key` | ilert 警报源集成密钥 | `""` | | `alerting.ilert.default-alert` | 默认警报配置。
请参见 [设置默认警报](#setting-a-default-alert) | N/A | | `alerting.ilert.overrides` | 可能优先于默认配置的覆盖列表 | `[]` | | `alerting.ilert.overrides[].group` | 将由此配置覆盖配置的端点组 | `""` | | `alerting.ilert.overrides[].*` | 请参见 `alerting.ilert.*` 参数 | `{}` | 强烈建议将 `endpoints[].alerts[].send-on-resolved` 设置为 `true`,以用于 `ilert` 类型的警报,因为与其它警报不同,将此参数设置为 `true` 的操作不会创建另一个警报,而是将警报标记为在 ilert 上已解决。 行为: - 默认情况下,`alerting.ilert.integration-key` 用作集成密钥 - 如果被评估的端点属于一个组(`endpoints[].group`),且该组的值匹配 `alerting.ilert.overrides[].group`,则提供者将使用该覆盖的集成密钥,而不是 `alerting.ilert.integration-key` 的值 ``` alerting: ilert: integration-key: "********************************" # You can also add group-specific integration keys, which will # override the integration key above for the specified groups overrides: - group: "core" integration-key: "********************************" endpoints: - name: website url: "https://twin.sh/health" interval: 30s conditions: - "[STATUS] == 200" - "[BODY].status == UP" - "[RESPONSE_TIME] < 300" alerts: - type: ilert failure-threshold: 3 success-threshold: 5 send-on-resolved: true description: "healthcheck failed" ``` #### 配置 Incident.io 警报 | 参数 | 描述 | 默认值 | |------|------|--------| | `alerting.incident-io` | `incident-io` 类型警报的配置 | `{}` | | `alerting.incident-io.url` | 触发警报事件的 URL | 必填 `""` | | `alerting.incident-io.auth-token` | 用于身份验证的令牌 | 必填 `""` | | `alerting.incident-io.source-url` | 源 URL | `""` | | `alerting.incident-io.default-alert` | 默认警报配置。
请参见 [设置默认警报](#setting-a-default-alert) | N/A | | `alerting.incident-io.overrides` | 可能优先于默认配置的覆盖列表 | `[]` | | `alerting.incident-io.overrides[].group` | 将由此配置覆盖配置的端点组 | `""` | | `alerting.incident-io.overrides[].*` | 请参见 `alerting.incident-io.*` 参数 | `{}` | 要获取所需的警报源配置 ID 和身份验证令牌,必须配置一个 HTTP 警报。 #### 配置 Line 警报 | 参数 | 描述 | 默认值 | |------|------|--------| | `alerting.line` | `line` 类型警报的配置 | `{}` | | `alerting.line.channel-access-token` | Line Messaging API 通道访问令牌 | 必填 `""` | | `alerting.line.user-ids` | 要发送消息的 Line 用户 ID 列表(可以是用户 ID、房间 ID 或群组 ID) | 必填 `[]` | | `alerting.line.default-alert` | 默认警报配置。
请参见 [设置默认警报](#setting-a-default-alert) | N/A | | `alerting.line.overrides` | 可能优先于默认配置的覆盖列表 | `[]` | | `alerting.line.overrides[].group` | 将由此配置覆盖配置的端点组 | `""` | | `alerting.line.overrides[].*` | 请参见 `alerting.line.*` 参数 | `{}` | ``` alerting: line: channel-access-token: "YOUR_CHANNEL_ACCESS_TOKEN" user-ids: - "U1234567890abcdef" # This can be a group id, room id or user id - "U2345678901bcdefg" endpoints: - name: website url: "https://twin.sh/health" interval: 5m conditions: - "[STATUS] == 200" alerts: - type: line send-on-resolved: true ``` #### 配置 Matrix 警报 | 参数 | 描述 | 默认值 | |------|------|--------| | `alerting.matrix` | `matrix` 类型警报的配置 | `{}` | | `alerting.matrix.server-url` | Homeserver URL | `https://matrix-client.matrix.org` | | `alerting.matrix.access-token` | 机器人用户访问令牌(参见 https://webapps.stackexchange.com/q/131056) | 必填 `""` | | `alerting.matrix.internal-room-id` | 发送警报的内部房间 ID(在房间设置 > 高级中查找) | 必填 `""` | | `alerting.matrix.default-alert` | 默认警报配置。
请参见 [设置默认警报](#setting-a-default-alert) | N/A | | `alerting.matrix.overrides` | 可能优先于默认配置的覆盖列表 | `[]` | | `alerting.matrix.overrides[].group` | 将由此配置覆盖配置的端点组 | `""` | | `alerting.matrix.overrides[].*` | 请参见 `alerting.matrix.*` 参数 | `{}` | ``` alerting: matrix: server-url: "https://matrix-client.matrix.org" access-token: "123456" internal-room-id: "!example:matrix.org" endpoints: - name: website interval: 5m url: "https://twin.sh/health" conditions: - "[STATUS] == 200" - "[BODY].status == UP" - "[RESPONSE_TIME] < 300" alerts: - type: matrix send-on-resolved: true description: "healthcheck failed" ``` #### 配置 Mattermost 警报 | 参数 | 描述 | 默认值 | |------|------|--------| | `alerting.mattermost` | `mattermost` 类型警报的配置 | `{}` | | `alerting.mattermost.webhook-url` | Mattermost Webhook URL | 必填 `""` | | `alerting.mattermost.channel` | Mattermost 通道名称覆盖(可选) | `""` | | `alerting.mattermost.client` | 客户端配置。
请参见 [客户端配置](#client-configuration) | `{}` | | `alerting.mattermost.default-alert` | 默认警报配置。
请参见 [设置默认警报](#setting-a-default-alert) | N/A | | `alerting.mattermost.overrides` | 可能优先于默认配置的覆盖列表 | `[]` | | `alerting.mattermost.overrides[].group` | 将由此配置覆盖配置的端点组 | `""` | | `alerting.mattermost.overrides[].*` | 请参见 `alerting.mattermost.*` 参数 | `{}` | 以下是通知的示例:  #### 配置 Messagebird 警报 | 参数 | 描述 | 默认值 | |------|------|--------| | `alerting.messagebird` | `messagebird` 类型警报的配置 | `{}` | | `alerting.messagebird.access-key` | Messagebird 访问密钥 | 必填 `""` | | `alerting.messagebird.originator` | 消息的发送者 | 必填 `""` | | `alerting.messagebird.recipients` | 消息的接收者列表 | 必填 `""` | | `alerting.messagebird.default-alert` | 默认警报配置。
请参见 [设置默认警报](#setting-a-default-alert) | N/A | 使用 Messagebird 发送 **SMS** 文本消息警报的示例: ``` alerting: messagebird: access-key: "..." originator: "31619191918" recipients: "31619191919,31619191920" endpoints: - name: website interval: 5m url: "https://twin.sh/health" conditions: - "[STATUS] == 200" - "[BODY].status == UP" - "[RESPONSE_TIME] < 300" alerts: - type: messagebird failure-threshold: 3 send-on-resolved: true description: "healthcheck failed" ``` #### 配置 New Relic 警报 | 参数 | 描述 | 默认值 | |------|------|--------| | `alerting.newrelic` | `newrelic` 类型警报的配置 | `{}` | | `alerting.newrelic.api-key` | New Relic API 密钥 | 必填 `""` | | `alerting.newrelic.account-id` | New Relic 账户 ID | 必填 `""` | | `alerting.newrelic.region` | 区域(US 或 EU) | `"US"` | | `alerting.newrelic.default-alert` | 默认警报配置。
请参见 [设置默认警报](#setting-a-default-alert) | N/A | | `alerting.newrelic.overrides` | 可能优先于默认配置的覆盖列表 | `[]` | | `alerting.newrelic.overrides[].group` | 将由此配置覆盖配置的端点组 | `""` | | `alerting.newrelic.overrides[].*` | 请参见 `alerting.newrelic.*` 参数 | `{}` | ``` alerting: newrelic: api-key: "YOUR_API_KEY" account-id: "1234567" region: "US" # or "EU" for European region endpoints: - name: example url: "https://example.org" interval: 5m conditions: - "[STATUS] == 200" alerts: - type: newrelic send-on-resolved: true ``` #### 配置 n8n 警报 | 参数 | 描述 | 默认值 | |------|------|--------| | `alerting.n8n` | `n8n` 类型警报的配置 | `{}` | | `alerting.n8n.webhook-url` | n8n webhook URL | 必填 `""` | | `alerting.n8n.title` | 发送到 n8n 的警报标题 | `""` | | `alerting.n8n.default-alert` | 默认警报配置。
请参见 [设置默认警报](#setting-a-default-alert) | N/A | | `alerting.n8n.overrides` | 可能优先于默认配置的覆盖列表 | `[]` | | `alerting.n8n.overrides[].group` | 将由此配置覆盖配置的端点组 | `""` | | `alerting.n8n.overrides[].*` | 请参见 `alerting.n8n.*` 参数 | `{}` | [n8n](https://n8n.io/) 是一个工作流自动化平台,允许您使用 webhook 跨不同的应用程序和服务自动化任务。 请参见 [n8n-nodes-gatus-trigger](https://github.com/TwiN/n8n-nodes-gatus-trigger) 获取可用于触发警报的 n8n 社区节点。 示例: 发送到 n8n webhook 的 JSON 有效载荷将包括: - `title`: 配置的标题 - `endpoint_name`: 端点名称 - `endpoint_group`: 端点组(如果有) - `endpoint_url`: 正在监控的 URL - `alert_description`: 自定义警报描述 - `resolved`: 布尔值,指示警报是否已解决 - `message`: 人类可读的警报消息 - `condition_results`: 包含其成功状态的条件结果数组 #### 配置 Ntfy 警报 | 参数 | 描述 | 默认值 | |------|------|--------| | `alerting.ntfy` | `ntfy` 类型警报的配置 | `{}` | | `alerting.ntfy.topic` | 警报将发布的订阅主题 | 必填 `""` | | `alerting.ntfy.url` | 目标服务器 URL | `https://ntfy.sh` | | `alerting.ntfy.token` | [访问令牌](https://docs.ntfy.sh/publish/#access-tokens) 用于限制主题的访问 | `""` | | `alerting.ntfy.email` | 用于额外电子邮件通知的电子邮件地址 | `""` | | `alerting.ntfy.click` | 点击通知时打开的网站 | `""` | | `alerting.ntfy.priority` | 警报的优先级 | `3` | | `alerting.ntfy.disable-firebase` | 是否禁用通过 Firebase 的消息推送投递。 [ntfy.sh 默认启用](https://docs.ntfy.sh/publish/#disable-firebase) | `false` | | `alerting.ntfy.disable-cache` | 是否禁用服务器端消息缓存。 [ntfy.sh 默认启用](https://docs.ntfy.sh/publish/#message-caching) | `false` | `alerting.ntfy.default-alert` | 默认警报配置。
请参见 [设置默认警报](#setting-a-default-alert) | N/A | | `alerting.ntfy.overrides` | 可能优先于默认配置的覆盖列表 | `[]` | | `alerting.ntfy.overrides[].group` | 将由此配置覆盖配置的端点组 | `""` | | `alerting.ntfy.overrides[].*` | 请参见 `alerting.ntfy.*` 参数 | `{}` | [ntfy](https://github.com/binwiederhier/ntfy) 是一个令人惊叹的项目,允许您订阅桌面 和移动通知,使其成为 Gatus 的一个很棒补充。 示例: ``` alerting: ntfy: topic: "gatus-test-topic" priority: 2 token: faketoken default-alert: failure-threshold: 3 send-on-resolved: true # You can also add group-specific to keys, which will # override the to key above for the specified groups overrides: - group: "other" topic: "gatus-other-test-topic" priority: 4 click: "https://example.com" endpoints: - name: website interval: 5m url: "https://twin.sh/health" conditions: - "[STATUS] == 200" - "[BODY].status == UP" - "[RESPONSE_TIME] < 300" alerts: - type: ntfy - name: other example group: other interval: 30m url: "https://example.com" conditions: - "[STATUS] == 200" - "[BODY].status == UP" alerts: - type: ntfy description: example ``` #### 配置 Opsgenie 警报 | 参数 | 描述 | 默认值 | |------|------|--------| | `alerting.opsgenie` | `opsgenie` 类型警报的配置 | `{}` | | `alerting.opsgenie.api-key` | Opsgenie API 密钥 | 必填 `""` | | `alerting.opsgenie.priority` | 警报优先级级别 | `P1` | | `alerting.opsgenie.source` | 警报来源字段 | `gatus` | | `alerting.opsgenie.entity-prefix` | 实体字段前缀 | `gatus-` | | `alerting.opsgenie.alias-prefix` | 别名字段前缀 | `gatus-healthcheck-` | | `alerting.opsgenie.tags` | 警报标签 | `[]` | | `alerting.opsgenie.default-alert` | 默认警报配置。
请参见 [设置默认警报](#setting-a-default-alert) | N/A | Opsgenie 提供者将自动打开和关闭警报。 ``` alerting: opsgenie: api-key: "00000000-0000-0000-0000-000000000000" ``` #### 配置 PagerDuty 警报 | 参数 | 描述 | 默认值 | |------|------|--------| | `alerting.pagerduty` | `pagerduty` 类型警报的配置 | `{}` | | `alerting.pagerduty.integration-key` | PagerDuty Events API v2 集成密钥 | 必填 `""` | | `alerting.pagerduty.default-alert` | 默认警报配置。
请参见 [设置默认警报](#setting-a-default-alert) | N/A | | `alerting.pagerduty.overrides` | 可能优先于默认配置的覆盖列表 | `[]` | | `alerting.pagerduty.overrides[].group` | 将由此配置覆盖配置的端点组 | `""` | | `alerting.pagerduty.overrides[].*` | 请参见 `alerting.pagerduty.*` 参数 | `{}` | 强烈建议将 `endpoints[].alerts[].send-on-resolved` 设置为 `true`,以用于 `pagerduty` 类型的警报,因为与其它警报不同,将此参数设置为 `true` 的操作不会创建另一个事件,而是将事件标记为在 PagerDuty 上已解决。 行为: - 默认情况下,`alerting.pagerduty.integration-key` 用作集成密钥 - 如果被评估的端点属于一个组(`endpoints[].group`),且该组的值匹配 `alerting.pagerduty.overrides[].group`,则提供者将使用该覆盖的集成密钥,而不是 `alerting.pagerduty.integration-key` 的值 ``` alerting: pagerduty: integration-key: "********************************" # You can also add group-specific integration keys, which will # override the integration key above for the specified groups overrides: - group: "core" integration-key: "********************************" endpoints: - name: website url: "https://twin.sh/health" interval: 30s conditions: - "[STATUS] == 200" - "[BODY].status == UP" - "[RESPONSE_TIME] < 300" alerts: - type: pagerduty failure-threshold: 3 success-threshold: 5 send-on-resolved: true description: "healthcheck failed" - name: back-end group: core url: "https://example.org/" interval: 5m conditions: - "[STATUS] == 200" - "[CERTIFICATE_EXPIRATION] > 48h" alerts: - type: pagerduty failure-threshold: 3 success-threshold: 5 send-on-resolved: true description: "healthcheck failed" ``` #### 配置 Plivo 警报 | 参数 | 描述 | 默认值 | |------|------|--------| | `alerting.plivo` | `plivo` 类型警报的配置 | `{}` | | `alerting.plivo.auth-id` | Plivo Auth ID | 必填 `""` | | `alerting.plivo.auth-token` | Plivo Auth 令牌 | 必填 `""` | | `alerting.plivo.from` | 发送 SMS 的电话号码 | 必填 `""` | | `alerting.plivo.to` | 接收 SMS 的电话号码列表 | 必填 `[]` | | `alerting.plivo.default-alert` | 默认警报配置。
请参见 [设置默认警报](#setting-a-default-alert) | N/A | | `alerting.plivo.overrides` | 可能优先于默认配置的覆盖列表 | `[]` | | `alerting.plivo.overrides[].group` | 将由此配置覆盖配置的端点组 | `""` | | `alerting.plivo.overrides[].*` | 请参见 `alerting.plivo.*` 参数 | `{}` | ``` alerting: plivo: auth-id: "MAXXXXXXXXXXXXXXXXXX" auth-token: "your-auth-token" from: "+1234567890" to: - "+0987654321" - "+1122334455" endpoints: - name: website interval: 30s url: "https://twin.sh/health" conditions: - "[STATUS] == 200" - "[BODY].status == UP" - "[RESPONSE_TIME] < 300" alerts: - type: plivo failure-threshold: 5 send-on-resolved: true description: "healthcheck failed" ``` #### 配置 Pushover 警报 | 参数 | 描述 | 默认值 | |------|------|--------| | `alerting.pushover` | `pushover` 类型警报的配置 | `{}` | | `alerting.pushover.application-token` | Pushover 应用程序令牌 | `""` | | `alerting.pushover.user-key` | 用户或群组密钥 | `""` | | `alerting.pushover.title` | 所有消息发送的固定标题 | `"Gatus:
请参见 [声音](https://pushover.net/api#sounds) 获取所有有效选项 | `""` | | `alerting.pushover.ttl` | 设置消息的生存时间,以便自动从 Pushover 通知中删除 | `0` | | `alerting.pushover.device` | 发送消息的设备(可选)
请参见 [设备](https://pushover.net/api#identifiers) 获取详细信息 | `""`(所有设备) | | `alerting.pushover.default-alert` | 默认警报配置。
请参见 [设置默认警报](#setting-a-default-alert) | N/A | ``` alerting: pushover: application-token: "******************************" user-key: "******************************" endpoints: - name: website url: "https://twin.sh/health" interval: 30s conditions: - "[STATUS] == 200" - "[BODY].status == UP" - "[RESPONSE_TIME] < 300" alerts: - type: pushover failure-threshold: 3 success-threshold: 5 send-on-resolved: true description: "healthcheck failed" ``` #### 配置 Rocket.Chat 警报 | 参数 | 描述 | 默认值 | |------|------|--------| | `alerting.rocketchat` | `rocketchat` 类型警报的配置 | `{}` | | `alerting.rocketchat.webhook-url` | Rocket.Chat 传入 Webhook URL | 必填 `""` | | `alerting.rocketchat.channel` | 可选的通道覆盖 | `""` | | `alerting.rocketchat.default-alert` | 默认警报配置。
请参见 [设置默认警报](#setting-a-default-alert) | N/A | | `alerting.rocketchat.overrides` | 可能优先于默认配置的覆盖列表 | `[]` | | `alerting.rocketchat.overrides[].group` | 将由此配置覆盖配置的端点组 | `""` | | `alerting.rocketchat.overrides[].*` | 请参见 `alerting.rocketchat.*` 参数 | `{}` | ``` alerting: rocketchat: webhook-url: "https://your-rocketchat.com/hooks/YOUR_WEBHOOK_ID/YOUR_TOKEN" channel: "#alerts" # Optional endpoints: - name: website url: "https://twin.sh/health" interval: 5m conditions: - "[STATUS] == 200" alerts: - type: rocketchat send-on-resolved: true ``` 以下是通知的示例:  #### 配置 SendGrid 警报 | 参数 | 描述 | 默认值 | |------|------|--------| | `alerting.sendgrid` | `sendgrid` 类型警报的配置 | `{}` | | `alerting.sendgrid.api-key` | SendGrid API 密钥 | 必填 `""` | | `alerting.sendgrid.from` | 发送邮件的发件人地址 | 必填 `""` | | `alerting.sendgrid.to` | 接收警报的电子邮件地址(多个收件人用逗号分隔) | 必填 `""` | | `alerting.sendgrid.default-alert` | 默认警报配置。
请参见 [设置默认警报](#setting-a-default-alert) | N/A | | `alerting.sendgrid.overrides` | 可能优先于默认配置的覆盖列表 | `[]` | | `alerting.sendgrid.overrides[].group` | 将由此配置覆盖配置的端点组 | `""` | | `alerting.sendgrid.overrides[].*` | 请参见 `ing.sendgrid.*` 参数 | `{}` | ``` alerting: sendgrid: api-key: "SG.xxxxxxxxxxxxxxxxxxxxxxxxxxxxxxxxxxxxxxxxxxxxxxxxxxxxxxxxxxxxxxxxxxxx" from: "alerts@example.com" to: "admin@example.com,ops@example.com" endpoints: - name: website url: "https://twin.sh/health" interval: 5m conditions: - "[STATUS] == 200" alerts: - type: sendgrid send-on-resolved: true ``` #### 配置 Signal 警报 | 参数 | 描述 | 默认值 | |------|------|--------| | `alerting.signal` | `signal` 类型警报的配置 | `{}` | | `alerting.signal.api-url` | Signal API URL(例如 signal-cli-rest-api 实例) | 必填 `""` | | `alerting.signal.number` | 发送者电话号码 | 必填 `""` | | `alerting.signal.recipients` | 接收者电话号码列表 | 必填 `[]` | | `alerting.signal.default-alert` | 默认警报配置。
请参见 [设置默认警报](#setting-a-default-alert) | N/A | | `alerting.signal.overrides` | 可能优先于默认配置的覆盖列表 | `[]` | | `alerting.signal.overrides[].group` | 将由此配置覆盖配置的端点组 | `""` | | `alerting.signal.overrides[].*` | 请参见 `alerting.signal.*` 参数 | `{}` | ``` alerting: signal: api-url: "http://localhost:8080" number: "+1234567890" recipients: - "+0987654321" - "+1122334455" endpoints: - name: website url: "https://twin.sh/health" interval: 5m conditions: - "[STATUS] == 200" alerts: - type: signal send-on-resolved: true ``` #### 配置 SIGNL4 警报 SIGNL4 是一个移动警报和事件管理服务,通过移动推送、短信、语音电话和电子邮件向团队成员发送关键警报。 | 参数 | 描述 | 默认值 | |------|------|--------| | `alerting.signl4` | `signl4` 类型警报的配置 | `{}` | | `alerting.signl4.team-secret` | SIGNL4 团队密钥(Webhook URL 的一部分) | 必填 `""` | | `alerting.signl4.default-alert` | 默认警报配置。
请参见 [设置默认警报](#setting-a-default-alert) | N/A | | `alerting.signl4.overrides` | 可能优先于默认配置的覆盖列表 | `[]` | | `alerting.signl4.overrides[].group` | 将由此配置覆盖配置的端点组 | `""` | | `alerting.signl4.overrides[].*` | 请参见 `alerting.signl4.*` 参数 | `{}` | ``` alerting: signl4: team-secret: "your-team-secret-here" endpoints: - name: website url: "https://twin.sh/health" interval: 5m conditions: - "[STATUS] == 200" alerts: - type: signl4 send-on-resolved: true ``` #### 配置 Slack 警报 | 参数 | 描述 | 默认值 | |------|------|--------| | `alerting.slack` | `slack` 类型警报的配置 | `{}` | | `alerting.slack.webhook-url` | Slack Webhook URL | 必填 `""` | | `alerting.slack.title` | 通知标题 | `":helmet_with_white_cross: Gatus"` | | `alerting.slack.default-alert` | 默认警报配置。
请参见 [设置默认警报](#setting-a-default-alert) | N/A | | `alerting.slack.overrides` | 可能优先于默认配置的覆盖列表 | `[]` | | `alerting.slack.overrides[].group` | 将由此配置覆盖配置的端点组 | `""` | | `alerting.slack.overrides[].*` | 请参见 `alerting.slack.*` 参数 | `{}` | 以下是通知的示例:  #### 配置 Splunk 警报 | 参数 | 描述 | 默认值 | |------|------|--------| | `alerting.splunk` | `splunk` 类型警报的配置 | `{}` | | `alerting.splunk.hec-url` | Splunk HEC (HTTP Event Collector) URL | 必填 `""` | | `alerting.splunk.hec-token` | Splunk HEC 令牌 | 必填 `""` | | `alerting.splunk.source` | 事件来源 | `"gatus"` | | `alerting.splunk.sourcetype` | 事件来源类型 | `"gatus:alert"` | | `alerting.splunk.index` | Splunk 索引 | `""` | | `alerting.splunk.default-alert` | 默认警报配置。
请参见 [设置默认警报](#setting-a-default-alert) | N/A | | `alerting.splunk.overrides` | 可能优先于默认配置的覆盖列表 | `[]` | | `alerting.splunk.overrides[].group` | 将由此配置覆盖配置的端点组 | `""` | | `alerting.splunk.overrides[].*` | 请参见 `alerting.splunk.*` 参数 | `{}` | ``` alerting: splunk: hec-url: "https://splunk.example.com:8088" hec-token: "YOUR_HEC_TOKEN" index: "main" # Optional endpoints: - name: website url: "https://twin.sh/health" interval: 5m conditions: - "[STATUS] == 200" alerts: - type: splunk send-on-resolved: true ``` #### 配置 Squadcast 警报 | 参数 | 描述 | 默认值 | |------|------|--------| | `alerting.squadcast` | `squadcast` 类型警报的配置 | `{}` | | `alerting.squadcast.webhook-url` | Squadcast webhook URL | 必填 `""` | | `alerting.squadcast.default-alert` | 默认警报配置。
请参见 [设置默认警报](#setting-a-default-alert) | N/A | | `alerting.squadcast.overrides` | 可能优先于默认配置的覆盖列表 | `[]` | | `alerting.squadcast.overrides[].group` | 将由此配置覆盖配置的端点组 | `""` | | `alerting.squadcast.overrides[].*` | 请参见 `alerting.squadcast.*` 参数 | `{}` | ``` alerting: squadcast: webhook-url: "https://api.squadcast.com/v3/incidents/api/YOUR_API_KEY" endpoints: - name: website url: "https://twin.sh/health" interval: 5m conditions: - "[STATUS] == 200" alerts: - type: squadcast send-on-resolved: true ``` #### 配置 Teams 警报(已弃用) | 参数 | 描述 | 默认值 | |------|------|--------| | `alerting.teams` | `teams` 类型警报的配置 | `{}` | | `alerting.teams.webhook-url` | Teams Webhook URL | 必填 `""` | | `alerting.teams.default-alert` | 默认警报配置。
请参见 [设置默认警报](#setting-a-default-alert) | N/A | | `alerting.teams.title` | 通知标题 | `"🚨 Gatus"` | | `alerting.teams.client.insecure` | 是否跳过 TLS 验证 | `false` | | `alerting.teams.overrides` | 可能优先于默认配置的覆盖列表 | `[]` | | `alerting.teams.overrides[].group` | 将由此配置覆盖配置的端点组 | `""` | | `alerting.teams.overrides[].*` | 请参见 `alerting.teams.*` 参数 | `{}` | 以下是通知的示例:  #### 配置 Teams Workflow 警报 | 参数 | 描述 | 默认值 | |------|------|--------| | `alerting.teams-workflows` | `teams` 类型警报的配置 | `{}` | | `alerting.teams-workflows.webhook-url` | Teams Webhook URL | 必填 `""` | | `alerting.teams-workflows.title` | 通知标题 | `"⛑ Gatus"` | | `alerting.teams-workflows.default-alert` | 默认警报配置。
请参见 [设置默认警报](#setting-a-default-alert) | N/A | | `alerting.teams-workflows.overrides` | 可能优先于默认配置的覆盖列表 | `[]` | | `alerting.teams-workflows.overrides[].group` | 将由此配置覆盖配置的端点组 | `""` | | `alerting.teams-workflows.overrides[].*` | 请参见 `alerting.teams-workflows.*` 参数 | `{}` | 以下是通知的示例:  #### 配置 Telegram 警报 | 参数 | 描述 | 默认值 | |------|------|--------| | `alerting.telegram` | `telegram` 类型警报的配置 | `{}` | | `alerting.telegram.token` | Telegram Bot 令牌 | 必填 `""` | | `alerting.telegram.id` | Telegram Chat ID | 必填 `""` | | `alerting.telegram.topic-id` | Telegram 主题 ID,在群组中对应 `message_thread_id` | `""` | | `alerting.tele.api-url` | Telegram API URL | `https://api.telegram.org` | | `alerting.telegram.client` | 客户端配置。
请参见 [客户端配置](#client-configuration) | `{}` | | `alerting.telegram.default-alert` | 默认警报配置。
请参见 [设置默认警报](#setting-a-default-alert) | N/A | | `alerting.telegram.overrides` | 可能优先于默认配置的覆盖列表 | `[]` | | `alerting.telegram.overrides[].group` | 将由此配置覆盖配置的端点组 | `""` | | `alerting.telegram.overrides[].*` | 请参见 `alerting.telegram.*` 参数 | `{}` | 以下是通知的示例:  #### 配置 Twilio 警报 | 参数 | 描述 | 默认值 | |------|------|--------| | `alerting.twilio` | 设置 Twilio 类型警报的配置 | `{}` | | `alerting.twilio.sid` | Twilio 账户 SID | 必填 `""` | | `alerting.twilio.token` | Twilio 身份验证令牌 | 必填 `""` | | `alerting.twilio.from` | 发送 Twilio 警报的电话号码 | 必填 `""` | | `alerting.twilio.to` | 接收 Twilio 警报的电话号码 | 必填 `""` | | `alerting.twilio.default-alert` | 默认警报配置。
请参见 [设置默认警报](#setting-a-default-alert) | N/A | 支持自定义消息模板,可通过以下附加参数配置: | 参数 | 描述 | 默认值 | |------|------|--------| | `alerting.twilio.text-twilio-triggered` | 自定义消息模板,用于触发的警报。支持 `[ENDPOINT]`、`[ALERT_DESCRIPTION]` | `""` | | `alerting.twilio.text-twilio-resolved` | 自定义消息模板,用于已解决的警报。支持 `[ENDPOINT]`、`[ALERT_DESCRIPTION]` | `""` | ``` alerting: twilio: sid: "..." token: "..." from: "+1-234-567-8901" to: "+1-234-567-8901" # Custom message templates using placeholders (optional) # Supports both old format {endpoint}/{description} and new format [ENDPOINT]/[ALERT_DESCRIPTION] text-twilio-triggered: "🚨 ALERT: [ENDPOINT] is down! [ALERT_DESCRIPTION]" text-twilio-resolved: "✅ RESOLVED: [ENDPOINT] is back up! [ALERT_DESCRIPTION]" endpoints: - name: website interval: 30s url: "https://twin.sh/health" conditions: - "[STATUS] == 200" - "[BODY].status == UP" - "[RESPONSE_TIME] < 300" alerts: - type: twilio failure-threshold: 5 send-on-resolved: true description: "healthcheck failed" ``` #### 配置 Vonage 警报 | 参数 | 描述 | 默认值 | |------|------|--------| | `alerting.vonage` | 配置 Vonage 类型警报 | `{}` | | `alerting.vonage.api-key` | Vonage API 密钥 | 必填 `""` | | `alerting.vonage.api-secret` | Vonage API 密钥 | 必填 `""` | | `alerting.vonage.from` | 发送者名称或电话号码 | 必填 `""` | | `alerting.vonage.to` | 接收者电话号码 | 必填 `""` | | `alerting.vonage.default-alert` | 默认警报配置。
请参见 [设置默认警报](#setting-a-default-alert) | N/A | | `alerting.vonage.overrides` | 可能优先于默认配置的覆盖列表 | `[]` | | `alerting.vonage.overrides[].group` | 将由此配置覆盖配置的端点组 | `""` | | `alerting.vonage.overrides[].*` | 请参见 `alerting.vonage.*` 参数 | `{}` | 发送 Vonage 警报的示例: ``` endpoints: - name: website url: "https://example.org" alerts: - type: vonage failure-threshold: 5 send-on-resolved: true description: "healthcheck failed" ``` #### 配置 Webex 警报 | 参数 | 描述 | 默认值 | |------|------|--------| | `alerting.webex` | 配置 Webex 类型警报 | `{}` | | `alerting.webex.webhook-url` | Webex Teams 传入 Webhook URL | 必填 `""` | | `alerting.webex.default-alert` | 默认警报配置。
请参见 [设置默认警报](#setting-a-default-alert) | N/A | | `alerting.webex.overrides` | 可能优先于默认配置的覆盖列表 | `[]` | | `alerting.webex.overrides[].group` | 将由此配置覆盖配置的端点组 | `""` | | `alerting.webex.overrides[].*` | 请参见 `alerting.webex.*` 参数 | `{}` | ``` alerting: webex: webhook-url: "https://webexapis.com/v1/webhooks/incoming/YOUR_WEBHOOK_ID" endpoints: - name: website url: "https://twin.sh/health" interval: 5m conditions: - "[STATUS] == 200" alerts: - type: webex send-on-resolved: true ``` #### 配置 Zapier 警报 | 参数 | 描述 | 默认值 | |------|------|--------| | `alerting.zapier` | 配置 Zapier 类型警报 | `{}` | | `alerting.zapier.webhook-url` | Zapier Webhook URL | 必填 `""` | | `alerting.zapier.default-alert` | 默认警报配置。
请参见 [设置默认警报](#setting-a-default-alert) | N/A | | `alerting.zapier.overrides` | 可能优先于默认配置的覆盖列表 | `[]` | | `alerting.zapier.overrides[].group` | 将由此配置覆盖配置的端点组 | `""` | | `alerting.zapier.overrides[].*` | 请参见 `alerting.zapier.*` 参数 | `{}` | ``` alerting: zapier: webhook-url: "https://hooks.zapier.com/hooks/catch/YOUR_WEBHOOK_ID/" endpoints: - name: website url: "https://twin.sh/health" interval: 5m conditions: - "[STATUS] == 200" alerts: - type: zapier send-on-resolved: true ``` #### 配置 Zulip 警报 | 参数 | 描述 | 默认值 | |------|------|--------| | `alerting.zulip` | 配置 Zulip 类型警报 | `{}` | | `alerting.zulip.bot-email` | Bot 电子邮件 | 必填 `""` | | `alerting.zulip.bot-api-key` | Bot API 密钥 | 必填 `""` | | `alerting.zulip.domain` | 完整的组织域名(例如 yourZulipDomain.zulipchat.com) | 必填 `""` | | `alerting.zulip.channel-id` | 发送警报的频道 ID | 必填 `""` | | `alerting.zulip.overrides` | 优先级可能高于默认配置的覆盖列表 | `[]` | | `alerting.zulip.overrides[].group` | 将被此配置覆盖的端点组 | `""` | | `alerting.zulip.overrides[].*` | 参考 `alerting.zulip.*` 参数 | `{}` | ``` alerting: zulip: bot-email: gatus-bot@some.zulip.org bot-api-key: "********************************" domain: some.zulip.org channel-id: 123456 endpoints: - name: website url: "https://twin.sh/health" interval: 5m conditions: - "[STATUS] == 200" - "[BODY].status == UP" - "[RESPONSE_TIME] < 300" alerts: - type: zulip description: "healthcheck failed" send-on-resolved: true ``` #### 配置自定义告警 | 参数 | 描述 | 默认值 | |:------------------------------------|:-----------------------------------------------------------------------------------|:--------------| | `alerting.custom` | 失败或告警时自定义动作的配置 | `{}` | | `alerting.custom.url` | 自定义告警请求 URL | 必填 `""` | | `alerting.custom.method` | 请求方法 | `GET` | | `alerting.custom.body` | 自定义告警请求体 | `""` | | `alerting.custom.headers` | 自定义告警请求头 | `{}` | | `alerting.custom.client` | 客户端配置。
参考 [客户端配置](#client-configuration)。 | `{}` | | `alerting.custom.default-alert` | 默认告警配置。
参考 [设置默认告警](#setting-a-default-alert) | N/A | | `alerting.custom.overrides` | 优先级可能高于默认配置的覆盖列表 | `[]` | | `alerting.custom.overrides[].group` | 将被此配置覆盖的端点组 | `""` | | `alerting.custom.overrides[].*` | 参考 `alerting.custom.*` 参数 | `{}` | 虽然它们被称为告警,但你可以使用此功能调用任何内容。 例如,你可以通过拥有一个跟踪新部署的应用程序来自动化回滚, 并利用 Gatus,当端点开始失败时,Gatus 可以调用该应用程序端点。你的应用程序 会检查出问题的端点是否属于最近部署的应用程序,如果是, 则自动回滚。 此外,你可以在正文(`alerting.custom.body`)和 URL(`alerting.custom.url`)中使用以下占位符: - `[ALERT_DESCRIPTION]`(从 `endpoints[].alerts[].description` 解析) - `[ENDPOINT_NAME]`(从 `endpoints[].name` 解析) - `[ENDPOINT_GROUP]`(从 `endpoints[].group` 解析) - `[ENDPOINT_URL]`(从 `endpoints[].url` 解析) - `[RESULT_ERRORS]`(从给定健康检查的健康评估解析) - `[RESULT_CONDITIONS]`(从给定健康检查的健康评估解析的条件结果) - 如果你有一个使用 `custom` 提供程序并设置 `send-on-resolved` 为 `true` 的告警, 你可以使用 `[ALERT_TRIGGERED_OR_RESOLVED]` 占位符来区分通知。 上述占位符将被替换为 `TRIGGERED` 或 `RESOLVED`,但可以修改 (本节末尾有详细说明)。 为了所有意图和目的,我们将使用 Slack Webhook 配置自定义告警,但你可以调用任何你想要的内容。 ``` alerting: custom: url: "https://hooks.slack.com/services/**********/**********/**********" method: "POST" body: | { "text": "[ALERT_TRIGGERED_OR_RESOLVED]: [ENDPOINT_GROUP] - [ENDPOINT_NAME] - [ALERT_DESCRIPTION] - [RESULT_ERRORS]" } endpoints: - name: website url: "https://twin.sh/health" interval: 30s conditions: - "[STATUS] == 200" - "[BODY].status == UP" - "[RESPONSE_TIME] < 300" alerts: - type: custom failure-threshold: 10 success-threshold: 3 send-on-resolved: true description: "health check failed" ``` 注意,你可以像这样自定义 `[ALERT_TRIGGERED_OR_RESOLVED]` 占位符的已解析值: ``` alerting: custom: placeholders: ALERT_TRIGGERED_OR_RESOLVED: TRIGGERED: "partial_outage" RESOLVED: "operational" ``` 因此,第一个示例节中的 `[ALERT_TRIGGERED_OR_RESOLVED]` 在告警触发时将替换为 `partial_outage`,在告警解决时将替换为 `operational`。 #### 设置默认告警 | 参数 | 描述 | 默认值 | |:---------------------------------------------|:------------------------------------------------------------------------------|:--------| | `alerting.*.default-alert.enabled` | 是否启用告警 | N/A | | `alerting.*.default-alert.failure-threshold` | 触发告警前所需的连续失败次数 | N/A | | `alerting.*.default-alert.success-threshold` | 在持续事件被标记为解决之前所需的连续成功次数 | N/A | | `alerting.*.default-alert.send-on-resolved` | 告警被标记为解决后是否发送通知 | N/A | | `alerting.*.default-alert.description` | 告警描述。将包含在发送的告警中 | N/A | 虽然你可以直接在端点定义中指定告警配置,但这很繁琐,可能导致配置文件非常长。 为了避免此类问题,你可以在每个提供程序配置中使用 `default-alert` 参数: ``` alerting: slack: webhook-url: "https://hooks.slack.com/services/**********/**********/**********" default-alert: description: "health check failed" send-on-resolved: true failure-threshold: 5 success-threshold: 5 ``` 这样,你的 Gatus 配置看起来会更整洁: ``` endpoints: - name: example url: "https://example.org" conditions: - "[STATUS] == 200" alerts: - type: slack - name: other-example url: "https://example.com" conditions: - "[STATUS] == 200" alerts: - type: slack ``` 它还允许你执行以下操作: ``` endpoints: - name: example url: "https://example.org" conditions: - "[STATUS] == 200" alerts: - type: slack failure-threshold: 5 - type: slack failure-threshold: 10 - type: slack failure-threshold: 15 ``` 当然,你也可以混合使用告警类型: ``` alerting: slack: webhook-url: "https://hooks.slack.com/services/**********/**********/**********" default-alert: failure-threshold: 3 pagerduty: integration-key: "********************************" default-alert: failure-threshold: 5 endpoints: - name: endpoint-1 url: "https://example.org" conditions: - "[STATUS] == 200" alerts: - type: slack - type: pagerduty - name: endpoint-2 url: "https://example.org" conditions: - "[STATUS] == 200" alerts: - type: slack - type: pagerduty ``` ### 维护 如果你有维护窗口,你可能不希望被告警打扰。 要做到这一点,你需要使用维护配置: | 参数 | 描述 | 默认值 | |:-----------------------|:-----------------------------------------------------------------------------------------------------------------------------------------------------------------------------------|:--------------| | `maintenance.enabled` | 维护周期是否启用 | `true` | | `maintenance.start` | 维护窗口开始时间(格式为 `hh:mm`,例如 `23:00`) | 必填 `""` | | `maintenance.duration` | 维护窗口持续时间(例如 `1h`、`30m`) | 必填 `""` | | `maintenance.timezone` | 维护窗口时区格式(例如 `Europe/Amsterdam`)。
参考 [时区数据库时间列表](https://en.wikipedia.org/wiki/List_of_tz_database_time_zones) 获取更多信息 | `UTC` | | `maintenance.every` | 维护周期适用的星期几(例如 `[Monday, Thursday]`)。
如果留空,则维护窗口每天应用 | `[]` | 示例如下: ``` maintenance: start: 23:00 duration: 1h timezone: "Europe/Amsterdam" every: [Monday, Thursday] ``` 注意你也可以按行单独指定每一天: ``` maintenance: start: 23:00 duration: 1h timezone: "Europe/Amsterdam" every: - Monday - Thursday ``` 你也可以为每个端点指定维护窗口: ``` endpoints: - name: endpoint-1 url: "https://example.org" maintenance-windows: - start: "07:30" duration: 40m timezone: "Europe/Berlin" - start: "14:30" duration: 1h timezone: "Europe/Berlin" ``` ### 安全 | 参数 | 描述 | 默认值 | |:-----------------|:-----------------------------|:--------| | `security` | 安全配置 | `{}` | | `security.basic` | HTTP 基本认证配置 | `{}` | | `security.oidc` | OpenID Connect 配置 | `{}` | #### 基本认证 | 参数 | 描述 | 默认值 | |:----------------------------------------|:-----------------------------------------------------------------------------------|:--------------| | `security.basic` | HTTP 基本认证配置 | `{}` | | `security.basic.username` | 基本认证用户名。 | 必填 `""` | | `security.basic.password-bcrypt-base64` | 使用 Bcrypt 哈希并以 base64 编码的密码,用于基本认证。 | 必填 `""` | 以下示例将要求你使用用户名 `john.doe` 和密码 `hunter2` 进行认证: ``` security: basic: username: "john.doe" password-bcrypt-base64: "JDJhJDEwJHRiMnRFakxWazZLdXBzRERQazB1TE8vckRLY05Yb1hSdnoxWU0yQ1FaYXZRSW1McmladDYu" ``` #### OIDC | 参数 | 描述 | 默认值 | |:---------------------------------|:---------------------------------------------------------------|:--------------| | `security.oidc` | OpenID Connect 配置 | `{}` | | `security.oidc.issuer-url` | 发行者 URL | 必填 `""` | | `security.oidc.redirect-url` | 重定向 URL。必须以 `/authorization-code/callback` 结尾 | 必填 `""` | | `security.oidc.client-id` | 客户端 ID | 必填 `""` | | `security.oidc.client-secret` | 客户端密钥 | 必填 `""` | | `security.oidc.scopes` | 请求的权限范围。唯一需要的权限是 `openid`。 | 必填 `[]` | | `security.oidc.allowedjects` | 允许的主体列表。如果为空,则允许所有主体。 | `[]` | | `security.oidc.session-ttl` | 会话生存时间(例如 `8h`、`1h30m`、`2h`)。 | `8h` | ``` security: oidc: issuer-url: "https://example.okta.com" redirect-url: "https://status.example.com/authorization-code/callback" client-id: "123456789" client-secret: "abcdefghijk" scopes: ["openid"] # You may optionally specify a list of allowed subjects. If this is not specified, all subjects will be allowed. #allowed-subjects: ["johndoe@example.com"] # You may optionally specify a session time-to-live. If this is not specified, defaults to 8 hours. #session-ttl: 8h ``` 对使用 OIDC 感到困惑?阅读 [使用 Auth0 通过 OIDC 保护 Gatus](https://twin.sh/articles/56/securing-gatus-with-oidc-using-auth0)。 ### TLS 加密 Gatus 支持使用 TLS 进行基础加密。要启用此功能,必须提供 PEM 格式的证书文件。 以下示例展示了一个配置,使 gatus 在 4443 端口响应 HTTPS 请求: ``` web: port: 4443 tls: certificate-file: "certificate.crt" private-key-file: "private.key" ``` ### 指标 要启用指标,你必须将 `metrics` 设置为 `true`。这样做将在与应用程序配置的相同端口(`web.port`)上的 `/metrics` 端点公开 Prometheus 友好型指标。 | 指标名称 | 类型 | 描述 | 标签 | 相关端点类型 | |:---------------------------------------------|:--------|:-------------------------------------------------------------------|:------------------------------|:------------------------| | gatus_results_total | counter | 每个端点每个成功状态的次数 | key, group, name, type, success | 全部 | | gatus_results_code_total | counter | 按代码统计的总次数 | key, group, name, type, code | DNS、HTTP | | gatus_results_connected_total | counter | 成功建立连接的总次数 | key, group, name, type | 全部 | | gatus_results_duration_seconds | gauge | 请求持续时间(秒) | key, group, name, type | 全部 | | gatus_results_certificate_expiration_seconds | gauge | 证书到期前的秒数 | key, group, name, type | HTTP、STARTTLS | | gatus_results_domain_expiration_seconds | gauge | 域名到期前的秒数 | key, group, name, type | HTTP、STARTTLS | | gatus_results_endpoint_success | gauge | 显示端点是否成功(0 失败,1 成功) | key, group, name, type | 全部 | 参考 [examples/docker-compose-grafana-prometheus](.examples/docker-compose-grafana-prometheus) 获取更多文档以及示例。 #### 自定义标签 你可以通过在 `extra-labels` 字段下定义键值对,为端点的 Prometheus 指标添加自定义标签。例如: ``` endpoints: - name: front-end group: core url: "https://twin.sh/health" interval: 5m conditions: - "[STATUS] == 200" - "[BODY].status == UP" - "[RESPONSE_TIME] < 150" extra-labels: environment: staging ``` ### 连接性 | 参数 | 描述 | 默认值 | |:--------------------------------|:-----------------------------------|:--------------| | `connectivity` | 连接性配置 | `{}` | | `connectivity.checker` | 连接性检查器配置 | 必填 `{}` | | `connectivity.checker.target` | 用于验证连接性的目标主机 | 必填 `""` | | `connectivity.checker.interval` | 检查连接性的间隔 | `1m` | 由于 Gatus 用于监控其他服务,Gatus 本身可能会失去互联网连接。 为了防止 Gatus 在自身不健康时将端点报告为不健康,你可以配置 Gatus 定期检查互联网连接。 当连接性检查器认为连接不可用时,所有端点执行都会被跳过。 ``` connectivity: checker: target: 1.1.1.1:53 interval: 60s ``` ### 远程实例(实验性) 此功能允许你从远程 Gatus 实例检索端点状态。 主要有两个用例: - 你有多个在不同机器上运行的 Gatus 实例,并希望通过单个仪表板可视化状态 - 你有一个或多个无法公开访问(例如在防火墙后)的 Gatus 实例,并希望检索 这是一个实验性功能。它可能会随时被移除或以破坏性方式更新。此外, 此功能存在已知问题。如果你有反馈,请在 [#64](https://github.com/TwiN/gatus/issues/64) 中留言。 请自行承担使用风险。 | 参数 | 描述 | 默认值 | |:--------------------------------|:--------------------------------------|:--------------| | `remote` | 远程配置 | `{}` | | `remote.instances` | 远程实例列表 | 必填 `[]` | | `remote.instances.endpoint-prefix` | 为所有端点名称添加的前缀字符串 | `""` | | `remote.instances.url` | 用于检索端点状态的 URL | 必填 `""` | ``` remote: instances: - endpoint-prefix: "status.example.org-" url: "https://status.example.org/api/v1/endpoints/statuses" ``` ## 部署 许多示例可以在 [.examples](.examples) 文件夹中找到,但本节将重点介绍最流行的部署 Gatus 的方式。 ### Docker 要在本地使用 Docker 运行 Gatus: ``` docker run -p 8080:8080 --name gatus ghcr.io/twin/gatus:stable ``` 除了使用 [.examples](.examples) 文件夹中提供的示例之外,你还可以通过创建配置文件来本地尝试,我们将它称为 `config.yaml`,然后运行以下命令: ``` docker run -p 8080:8080 --mount type=bind,source="$(pwd)"/config.yaml,target=/config/config.yaml --name gatus ghcr.io/twin/gatus:stable ``` 如果你在 Windows 上,将 `"$(pwd)"` 替换为当前目录的绝对路径,例如: ``` docker run -p 8080:8080 --mount type=bind,source=C:/Users/Chris/Desktop/config.yaml,target=/config/config.yaml --name gatus ghcr.io/twin/gatus:stable ``` 要本地构建镜像: ``` docker build . -t ghcr.io/twin/gatus:stable ``` ### Helm 图表 [Helm](https://helm.sh) 必须安装才能使用图表。 请参考 Helm 的 [文档](https://helm.sh/docs/) 以开始使用。 设置好 Helm 后,按如下方式添加存储库: ``` helm repo add twin https://twin.github.io/helm-charts helm repo update helm install gatus twin/gatus ``` 要获取更多详细信息,请检查 [图表配置](https://github.com/TwiN/helm-charts/blob/master/charts/gatus/README.md)。 ### Terraform #### Kubernetes Gatus 可以使用以下模块在 Kubernetes 上通过 Terraform 部署:[terraform-kubernetes-gatus](https://github.com/TwiN/terraform-kubernetes-gatus)。 ## 运行测试 ``` go test -v ./... ``` ## 在生产环境中使用 参考 [部署](#deployment) 章节。 ## 常见问题解答 ### 发送 GraphQL 请求 通过将 `endpoints[].graphql` 设置为 `true`,请求体将自动被标准的 GraphQL `query` 参数包裹。 例如,以下配置: ``` endpoints: - name: filter-users-by-gender url: http://localhost:8080/playground method: POST graphql: true body: | { users(gender: "female") { id name gender avatar } } conditions: - "[STATUS] == 200" - "[BODY].data.users[0].gender == female" ``` 将向 `http://localhost:8080/playground` 发送 `POST` 请求,请求体如下: ``` {"query":" {\n users(gender: \"female\") {\n id\n name\n gender\n avatar\n }\n }"} ``` ### 推荐间隔 为了确保 Gatus 提供可靠且准确的结果(即响应时间),Gatus 限制了可以同时评估的端点/套件数量。 换句话说,即使你有多个具有相同间隔的端点,它们也不保证同时运行。 并发评估的数量由 `concurrency` 配置参数决定,默认为 `3`。 你可以通过运行 Gatus 并配置多个具有非常短且不现实的间隔(例如 1 毫秒)的端点来测试这一点。你会注意到响应时间不会波动——这是因为虽然端点在不同的 goroutine 中进行评估,但存在一个信号量控制同时运行的端点/套件数量。 不幸的是,这样做有一个缺点。如果你有很多端点,包括一些非常慢或容易超时的(默认超时为 10 秒),这些慢速评估可能会阻止其他端点/套件被评估。 间隔不包括请求本身的持续时间,这意味着如果一个端点的间隔为 30 秒,而请求需要 2 秒完成,则两次评估之间的时间戳将是 32 秒,而不是 30 秒。 虽然这不会阻止 Gatus 对所有其他端点执行健康检查,但可能会导致 Gatus 无法遵守配置的间隔。例如,假设 `concurrency` 设置为 `1`: - 端点 A 的间隔为 5 秒,超时时间为 10 秒 - 端点 B 的间隔为 5 秒,执行时间为 1 毫秒 - 端点 B 将无法每 5 秒运行一次,因为端点 A 的健康评估耗时比其间隔长 总结一下,虽然 Gatus 可以处理你设置的任何间隔,但最好让慢速请求使用更大的间隔。 作为经验法则,我个人将更复杂的健康检查间隔设置为 `5m`(5 分钟),将用于告警的简单健康检查(如 PagerDuty/Twilio)间隔设置为 `30s`。 ### 默认超时 | 端点类型 | 超时时间 | |:----------|:--------| | HTTP | 10s | | TCP | 0s | | ICMP | 10s | 要修改超时,请参考 [客户端配置](#client-configuration)。 ### 监控 TCP 端点 通过将 `endpoints[].url` 前缀加上 `tcp://`,你可以以非常基础的级别监控 TCP 端点: ``` endpoints: - name: redis url: "tcp://127.0.0.1:6379" interval: 30s conditions: - "[CONNECTED] == true" ``` 如果设置了 `endpoints[].body`,则会发送该内容,响应的前 1024 字节将包含在 `[BODY]` 中。 占位符 `[STATUS]` 以及字段 `endpoints[].headers`、 `endpoints[].method` 和 `endpoints[].graphql` 不支持 TCP 端点。 这适用于数据库(如 Postgres、MySQL 等)和缓存(如 Redis、Memcached 等)等应用程序。 ### 监控 UDP 端点 通过将 `endpoints[].url` 前缀加上 `udp://`,你可以以非常基础的级别监控 UDP 端点: ``` endpoints: - name: example url: "udp://example.org:80" conditions: - "[CONNECTED] == true" ``` 如果设置了 `endpoints[].body`,则会发送该内容,响应的前 1024 字节将包含在 `[BODY]` 中。 占位符 `[STATUS]` 以及字段 `endpoints[].headers`、 `endpoints[].method` 和 `endpoints[].graphql` 不支持 UDP 端点。 这适用于基于 UDP 的应用程序。 ### 监控 SCTP 端点 通过将 `endpoints[].url` 前缀加上 `sctp://`,你可以以非常基础的级别监控 SCTP 端点: ``` endpoints: - name: example url: "sctp://127.0.0.1:38412" conditions: - "[CONNECTED] == true" ``` 占位符 `[STATUS]` 和 `[BODY]` 以及字段 `endpoints[].body`、`endpoints[].headers`、 `endpoints[].method` 和 `endpoints[].graphql` 不支持 SCTP 端点。 这适用于基于 SCTP 的应用程序。 ### 监控 WebSocket 端点 通过将 `endpoints[].url` 前缀加上 `ws://` 或 `wss://`,你可以监控 WebSocket 端点: ``` endpoints: - name: example url: "wss://echo.websocket.org/" body: "status" conditions: - "[CONNECTED] == true" - "[BODY] == pat(*served by*)" ``` 占位符 `[BODY]` 包含查询的输出,`[CONNECTED]` 显示连接是否成功建立。你可以使用 Go 模板语法。 ### 使用 gRPC 监控端点 你可以通过将 `endpoints[].url` 前缀加上 `grpc://` 或 `grpcs://` 来监控 gRPC 服务。 Gatus 会针对目标执行标准的 `grpc.health.v1.Health/Check` RPC。 对于启用 TLS 的服务器,使用 `grpcs://` 并根据需要配置客户端 TLS: ``` endpoints: - name: my-grpcs url: grpcs://example.com:443 conditions: - "[CONNECTED] == true" - "[BODY].status == SERVING" client: timeout: 5s insecure: false # set true to skip cert verification (not recommended) tls: certificate-file: /path/to/cert.pem # optional mTLS client cert private-key-file: /path/to/key.pem # optional mTLS client key ``` 注意事项: - 健康检查目标默认服务(`service: ""`)。如果需要,可以稍后添加对自定义服务名称的支持。 - 响应体仅在条件或套件存储映射需要时才会被暴露为类似 `{"status":"SERVING"}` 的最小 JSON 对象。 - 超时、自定义 DNS 解析器和 SSH 隧道通过现有的 [`client` 配置](#client-configuration) 得到尊重。 ### 使用 ICMP 监控端点 通过将 `endpoints[].url` 前缀加上 `icmp://`,你可以使用 ICMP(或更常见的“ping”或“echo”)以非常基础的级别监控端点: ``` endpoints: - name: ping-example url: "icmp://example.com" conditions: - "[CONNECTED] == true" ``` 仅支持 `[CONNECTED]`、`[IP]` 和 `[RESPONSE_TIME]` 占位符的端点类型为 ICMP。 你可以指定带 `icmp://` 前缀的域名或 IP 地址。 如果你在 Linux 上运行 Gatus,请阅读 Linux 部分 [https://github.com/prometheus-community/pro-bing#linux] 如果遇到任何问题。 从 `v5.31.0` 开始,这不再需要添加 `CAP_NET_RAW` 权限,对于没有特权的 ping,除非以 root 身份运行,否则 ICMP 检查将无法工作。详见 #1346。 ### 使用 DNS 查询监控端点 在端点中定义 `dns` 配置会自动将该端点标记为 DNS 类型端点: ``` endpoints: - name: example-dns-query url: "8.8.8.8" # Address of the DNS server to use dns: query-name: "example.com" query-type: "A" conditions: - "[BODY] == 93.184.215.14" - "[DNS_RCODE] == NOERROR" ``` 对于 DNS 类型的端点,有两个可以在条件中使用的占位符: - `[BODY]` 解析为查询的输出。例如,类型为 `A` 的查询将返回 IPv4。 - `[DNS_RCODE]` 解析为查询返回的响应代码名称,例如 `NOERROR`、`FORMERR`、`SERVFAIL`、`NXDOMAIN` 等。 ### 使用 SSH 监控端点 你可以通过将 `endpoints[].url` 前缀加上 `ssh://` 来使用 SSH 监控端点: ``` endpoints: # Password-based SSH example - name: ssh-example-password url: "ssh://example.com:22" # port is optional. Default is 22. ssh: username: "username" password: "password" body: | { "command": "echo '{\"memory\": {\"used\": 512}}'" } interval: 1m conditions: - "[CONNECTED] == true" - "[STATUS] == 0" - "[BODY].memory.used > 500" # Key-based SSH example - name: ssh-example-key url: "ssh://example.com:22" # port is optional. Default is 22. ssh: username: "username" private-key: | -----BEGIN RSA PRIVATE KEY----- TESTRSAKEY... -----END RSA PRIVATE KEY----- interval: 1m conditions: - "[CONNECTED] == true" - "[STATUS] == 0" ``` 你也可以在不指定用户名、密码和私钥字段的情况下使用无认证来监控端点: ``` endpoints: - name: ssh-example url: "ssh://example.com:22" # port is optional. Default is 22. ssh: username: "" password: "" private-key: "" interval: 1m conditions: - "[CONNECTED] == true" - "[STATUS] == 0" ``` 支持以下占位符用于 SSH 类型的端点: - `[CONNECTED]` 解析为 `true`,如果 SSH 连接成功,否则为 `false` - `[STATUS]` 解析为在远程服务器上执行命令的退出代码(例如 `0` 表示成功) - `[BODY]` 解析为在远程服务器上执行命令的标准输出 - `[IP]` 解析为服务器的 IP 地址 - `[RESPONSE_TIME]` 解析为建立连接并执行命令所花费的时间 ### 使用 STARTTLS 监控端点 如果你有一个邮件服务器并希望确保其没有问题,通过 STARTTLS 监控将是一个良好的初步指示: ``` endpoints: - name: starttls-smtp-example url: "starttls://smtp.gmail.com:587" interval: 30m client: timeout: 5s conditions: - "[CONNECTED] == true" - "[CERTIFICATE_EXPIRATION] > 48h" ``` ### 使用 TLS 监控端点 监控使用 SSL/TLS 加密的端点(如 LDAP over TLS)有助于检测证书过期: ``` endpoints: - name: tls-ldaps-example url: "tls://ldap.example.com:636" interval: 30m client: timeout: 5s conditions: - "[CONNECTED] == true" - "[CERTIFICATE_EXPIRATION] > 48h" ``` 如果设置了 `endpoints[].body`,则会发送该内容,响应的前 1024 字节将包含在 `[BODY]` 中。 占位符 `[STATUS]` 以及字段 `endpoints[].headers`、 `endpoints[].method` 和 `endpoints[].graphql` 不支持 TLS 端点。 ### 监控域名过期 你可以通过使用 `[DOMAIN_EXPIRATION]` 占位符来监控所有端点类型(除 DNS 外)的域名过期: ``` endpoints: - name: check-domain-and-certificate-expiration url: "https://example.org" interval: 1h conditions: - "[DOMAIN_EXPIRATION] > 720h" - "[CERTIFICATE_EXPIRATION] > 240h" ``` ### 并发性 默认情况下,Gatus 允许同时监控最多 3 个端点/套件。这在性能和资源使用之间提供了平衡,同时保持准确的响应时间测量。 你可以使用 `concurrency` 参数配置并发级别: ``` # 允许同时监控 10 个端点/套件 concurrency: 10 # 允许无限制的同时监控 concurrency: 0 # 使用默认并发数 (3) # 并发度:3 ``` **重要注意事项:** - 更高的并发性可以提高监控性能(当你有很多端点时) - 使用 `[RESPONSE_TIME]` 占位符的条件在极高并发性下可能不太准确,因为系统资源争用 - 设置为 `0` 表示无限制并发(等同于已弃用的 `disable-monitoring-lock: true`) **更高并发性的使用场景:** - 你有很多要监控的端点 - 你希望以非常短的间隔(< 5 秒)监控端点 - 你使用 Gatus 进行负载测试场景 **遗留配置:** `disable-monitoring-lock` 参数已弃用但仍支持向后兼容。它等同于设置 `concurrency: 0`。 ### 实时重载配置 为了方便起见,Gatus 会在加载的配置文件更新时自动实时重载配置。 默认情况下,如果更新后的配置无效,应用程序将退出,但你可以配置 Gatus 在配置文件更新为无效配置时继续运行,方法是设置 `skip-invalid-config-update` 为 `true`。 请记住,在每次更新配置文件后,确保配置文件的有效性对你最有利(通过查看日志并确保你不会看到以下消息): ``` The configuration file was updated, but it is not valid. The old configuration will continue being used. ``` 不这样做可能导致在应用程序因任何原因重新启动时,Gatus 无法启动。 **如果你没有使用文件存储**,在 Gatus 运行时更新配置文件与重新启动应用程序的效果相同。 ### 端点分组 端点分组用于将多个端点分组到仪表板上。 ``` endpoints: - name: frontend group: core url: "https://example.org/" interval: 5m conditions: - "[STATUS] == 200" - name: backend group: core url: "https://example.org/" interval: 5m conditions: - "[STATUS] == 200" - name: monitoring group: internal url: "https://example.org/" interval: 5m conditions: - "[STATUS] == 200" - name: nas group: internal url: "https://example.org/" interval: 5m conditions: - "[STATUS] == 200" - name: random endpoint that is not part of a group url: "https://example.org/" interval: 5m conditions: - "[STATUS] == 200" ``` 上述配置将产生如下仪表板(按分组排序):  ### 如何默认按分组排序? 在配置文件中设置 `ui.default-sort-by` 为 `group`: ``` ui: default-sort-by: group ``` 请注意,如果用户已经按其他字段对仪表板进行了排序,则默认排序不会应用,除非用户清除其浏览器的本地存储。 ###自定义路径下暴露 Gatus 目前,你可以使用完全限定域名(FQDN)暴露 Gatus UI,例如 `status.example.org`。但它不支持基于路径的路由,这意味着你无法通过类似 `example.org/status/` 的 URL 暴露它。 更多相关信息,请参见 https://github.com/TwiN/gatus/issues/88。 ### 在自定义端口下暴露 Gatus 默认情况下,Gatus 在端口 `8080` 上公开,但可以通过设置 `web.port` 参数指定不同的端口: ``` web: port: 8081 ``` 如果你使用的是 Heroku 之类的 PaaS,它不允许你设置自定义端口,而是通过环境变量公开端口,请参考 [在配置文件中使用环境变量](#use-environment-variables-in-config-files)。 ### 在配置文件中使用环境变量 你可以在配置文件中直接使用环境变量,它们将从环境中替换: ``` web: port: ${PORT} ui: title: $TITLE ``` ⚠️ 当配置参数包含 `$` 符号时,你必须使用 `$$` 转义 `$`。 ### 配置启动延迟 如果出于任何原因,你需要 Gatus 在监控端点之前等待一段时间,可以使用 `GATUS_DELAY_START_SECONDS` 环境变量让 Gatus 在启动时休眠。 ### 保持配置小巧 虽然这与 Gatus 无关,但你可以利用 YAML 锚点来创建默认配置。 如果你有一个大型配置文件,这有助于保持整洁。
示例
``` default-endpoint: &defaults group: core interval: 5m client: insecure: true timeout: 30s conditions: - "[STATUS] == 200" endpoints: - name: anchor-example-1 <<: *defaults # This will merge the configuration under &defaults with this endpoint url: "https://example.org" - name: anchor-example-2 <<: *defaults group: example # This will override the group defined in &defaults url: "https://example.com" - name: anchor-example-3 <<: *defaults url: "https://twin.sh/health" conditions: # This will override the conditions defined in &defaults - "[STATUS] == 200" - "[BODY].status == UP" ```标签:CI/CD监控, Discord告警, DNS监控, Docker, EVTX分析, HTTP监控, ICMP监控, Kubernetes部署, PagerDuty告警, Python工具, SaaS监控, SEO监控, Slack告警, TCP监控, Teams告警, Twilio告警, 代理支持, 健康检查, 关键词监控, 可用性监控, 告警, 响应体检查, 响应时间监控, 子域名突变, 安全防御评估, 开发者导向, 开发者监控, 性能监控, 日志审计, 服务监控, 条件评估, 状态监控平台, 状态码检查, 状态页, 自动化监控, 证书过期监控, 请求拦截