parca-dev/parca

GitHub: parca-dev/parca

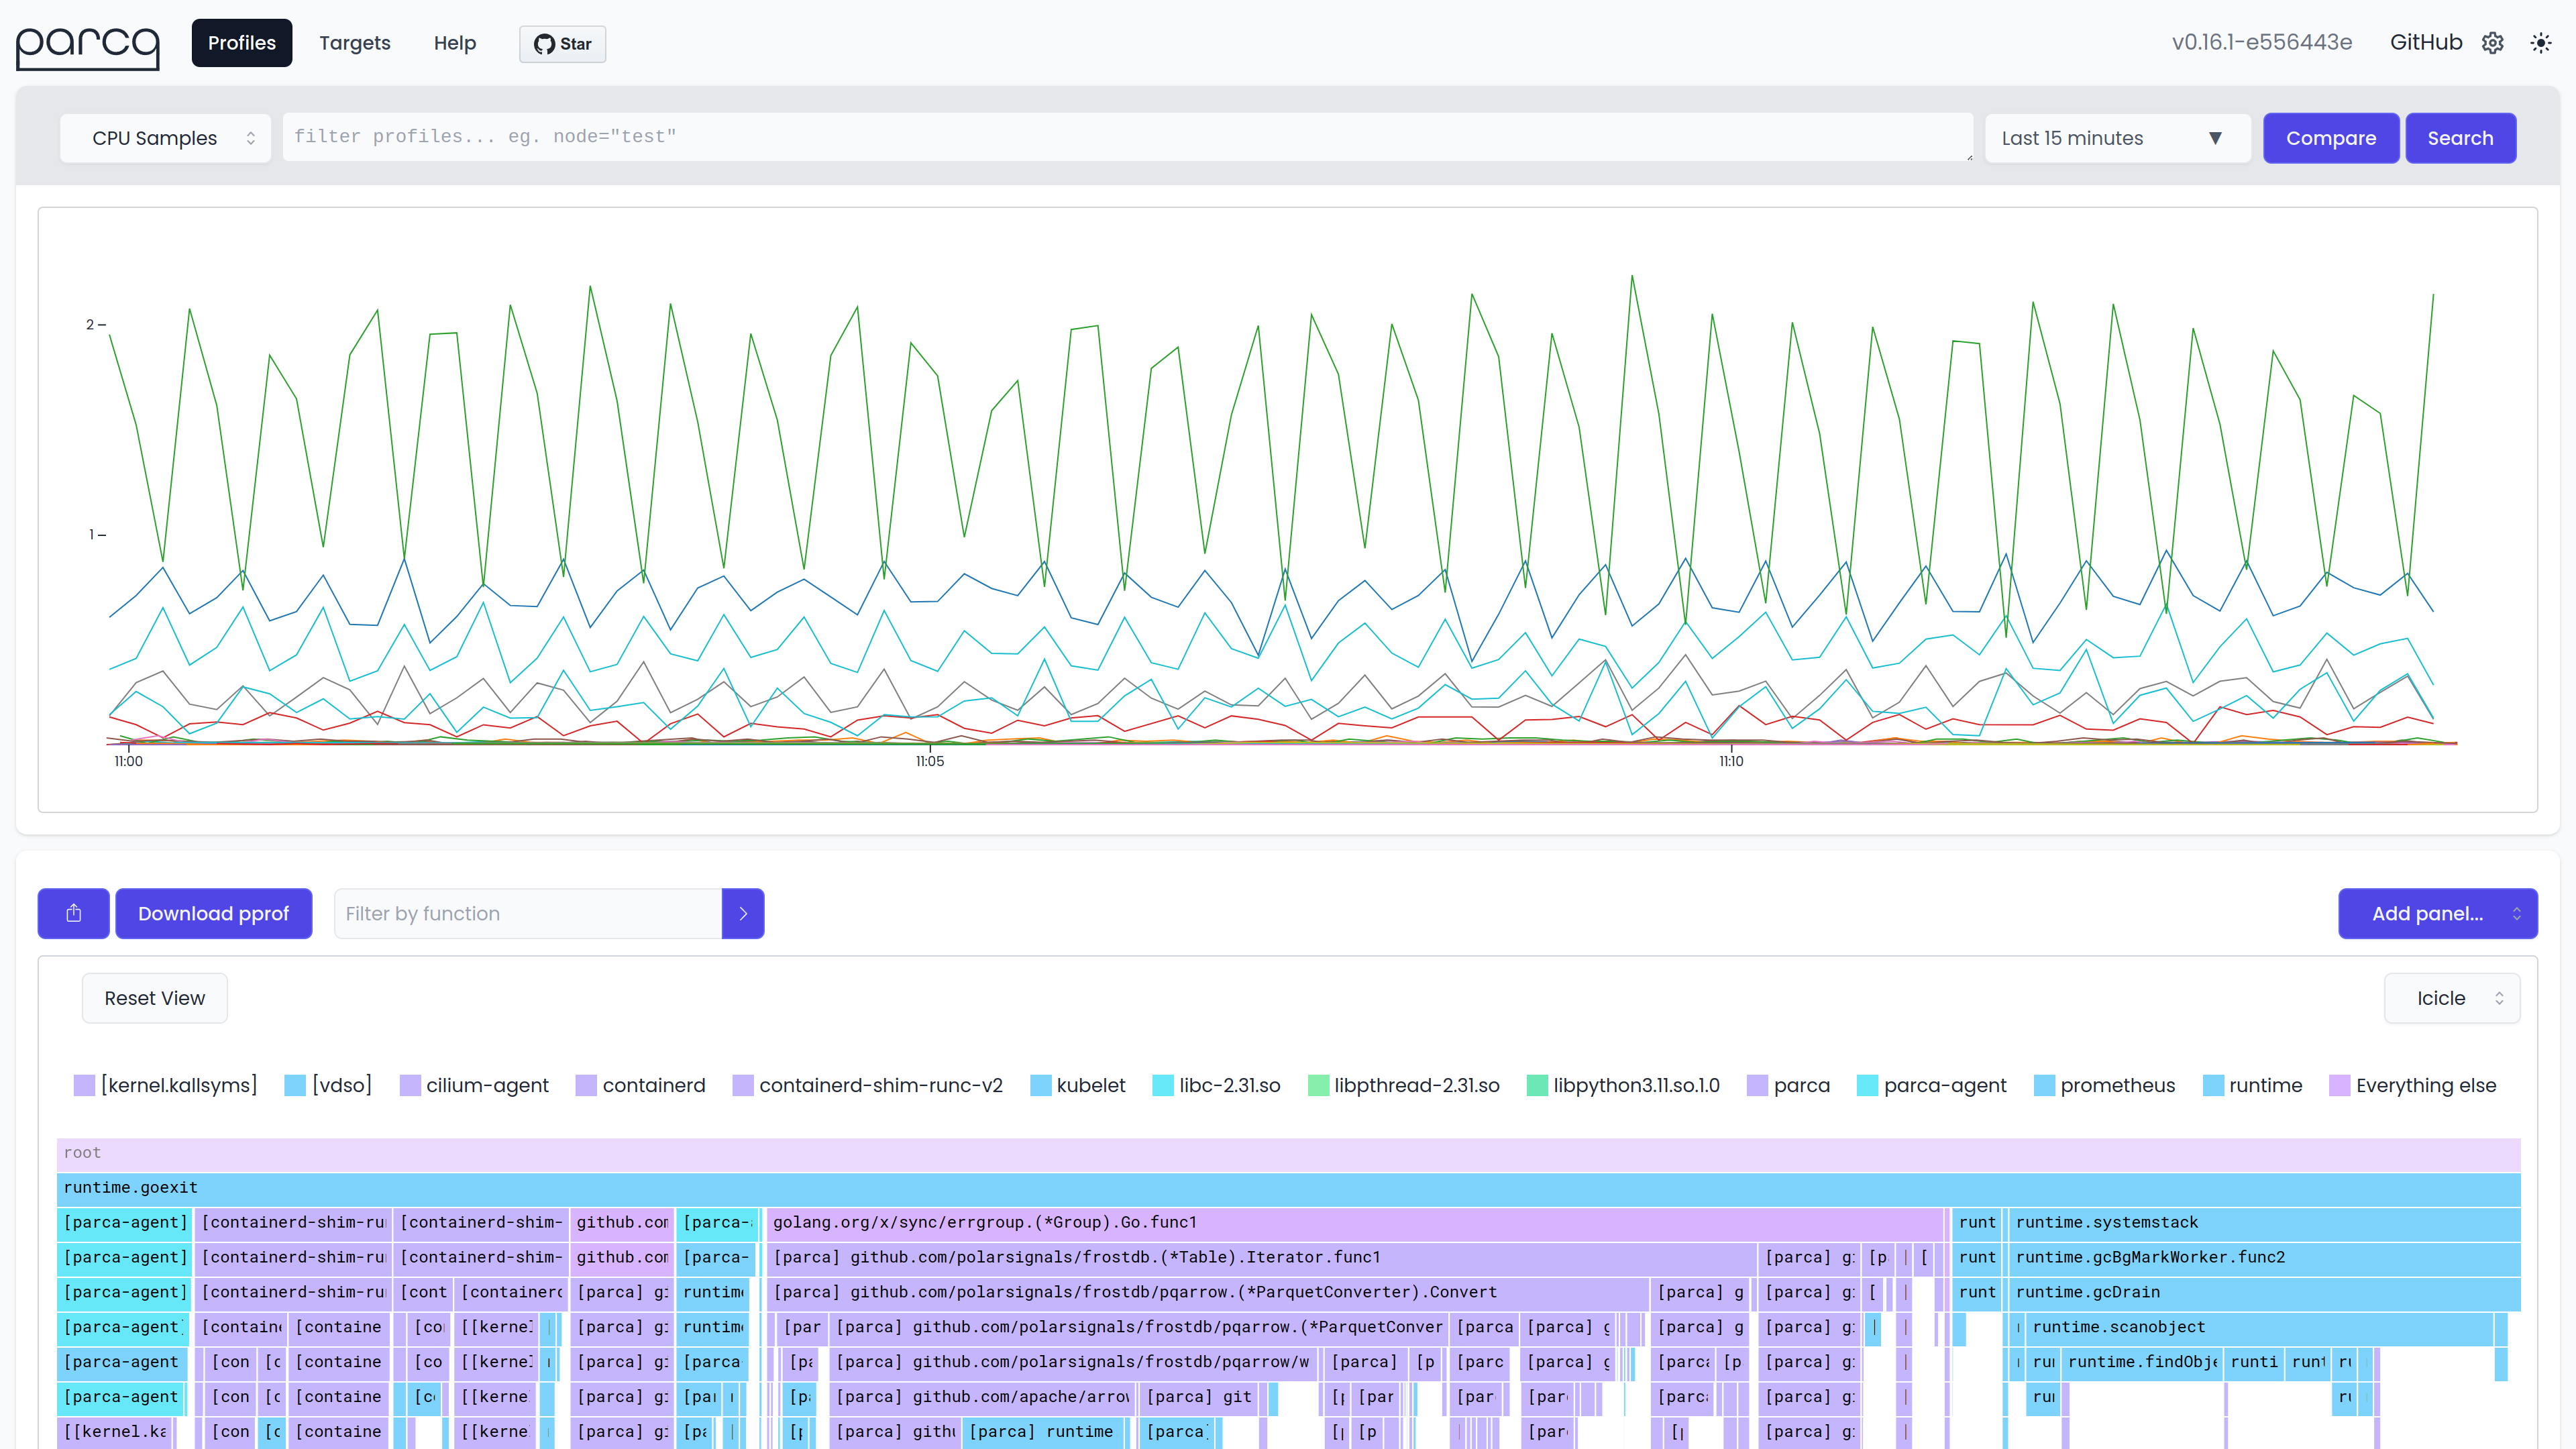
基于 eBPF 的持续性能分析平台,无需代码插桩即可监控 CPU 和内存使用并精确定位到代码行号。

Stars: 4806 | Forks: 247

[![Apache 2 License](https://img.shields.io/badge/license-Apache%202-blue.svg)](LICENSE) ![Build](https://static.pigsec.cn/wp-content/uploads/repos/2026/03/877e802a14230937.svg) ![Container](https://static.pigsec.cn/wp-content/uploads/repos/2026/03/f3bc22e1ff230939.svg) [![parca](https://snapcraft.io/parca/badge.svg)](https://snapcraft.io/parca-agent) ![Discord](https://img.shields.io/discord/877547706334199818?label=Discord) ![contributors](https://img.shields.io/github/all-contributors/parca-dev/parca?style=flat")

Parca: Continuous profiling for analysis of CPU, memory usage over time, and down to the line number.

持续性能分析,用于分析 CPU 和内存使用情况随时间的变化,并精确到代码行号。节省基础设施成本,提升性能,并增强可靠性。

Screenshot of Parca

## 功能特性 - [**eBPF Profiler**](https://www.parca.dev/docs/parca-agent): 单一 profiler,使用 eBPF,以极低的开销自动发现整个基础设施中的 Kubernetes 或 systemd 目标。支持 C、C++、Rust、Go 等! - **[Open Standards](https://www.parca.dev/docs/concepts/#pprof)**: 既可以使用基于 eBPF 的 profiler 生成 pprof 格式的 profile,也可以摄入任何 pprof 格式的 profile,从而实现广泛的语言支持和与现有工具的互操作性。 - [**优化的存储与查询**](https://www.parca.dev/docs/storage): 在保留原始数据的同时高效存储分析数据,并允许通过基于标签的搜索对数据进行切片和切块。聚合整个基础设施的分析数据,查看单一时间点的 profile 或在任何维度上进行比较。 ## 为什么选择 Parca? - **节省资金**: 许多组织有 20-30% 的资源浪费在易于优化的代码路径上。Parca Agent 旨在通过要求对整个基础设施进行 0 插桩来降低门槛。部署到您的基础设施中,立即开始使用! - **提升性能**: 利用随时间收集的分析数据,Parca 可以有把握且具有统计显著性地确定需要优化的热点路径。此外,它还可以显示任何标签维度(如部署、版本和区域)之间的差异。 - **理解事故**: 分析数据提供了对进程随时间执行内容的独特深入洞察。内存泄漏,以及导致意外行为的 CPU 或 I/O 瞬时峰值,这些传统上难以排查的问题在持续分析面前都变得轻而易举。 ## 反馈与支持 如果您有任何反馈,请在本项目的 GitHub Discussions 中开启一个讨论。 我们很想了解您的想法! ## 安装与文档 请查看 Parca 的网站以获取最新的深度安装指南和文档! [parca.dev](https://www.parca.dev/) ## 开发 您需要安装 [Go](https://golang.org/)、[Node](https://nodejs.org/en/download/) 和 [Pnpm](https://pnpm.io/)。 克隆项目 ``` git clone https://github.com/parca-dev/parca.git ``` 进入项目目录 ``` cd parca ``` 构建 UI 并编译 Go 二进制文件 ``` make build ``` ### 运行编译后的 Parca 二进制文件 二进制文件已编译到 `bin/parca`。 ``` ./bin/parca ``` 现在 Parca 已在本地运行,其 Web UI 可通过 http://localhost:7070/ 访问。 默认情况下,Parca 正在抓取其自身的 pprof 端点,您应该会看到 profile 随时间推移而出现。 抓取配置可以在存储库根目录下的 `parca.yaml` 中进行更改。 ### 配置 标志: ``` Usage: parca [flags] Flags: -h, --help Show context-sensitive help. --config-path="parca.yaml" Path to config file. --mode="all" Scraper only runs a scraper that sends to a remote gRPC endpoint. All runs all components. --http-address=":7070" Address to bind HTTP server to. --http-read-timeout=5s Timeout duration for HTTP server to read request body. --http-write-timeout=1m Timeout duration for HTTP server to write response body. --port="" (DEPRECATED) Use http-address instead. --log-level="info" Log level. --log-format="logfmt" Configure if structured logging as JSON or as logfmt --otlp-address=STRING The endpoint to send OTLP traces to. --otlp-exporter="grpc" The OTLP exporter to use. --otlp-insecure If true, disables TLS for OTLP exporters (both gRPC and HTTP). --cors-allowed-origins=CORS-ALLOWED-ORIGINS,... Allowed CORS origins. --version Show application version. --path-prefix="" Path prefix for the UI --mutex-profile-fraction=0 Fraction of mutex profile samples to collect. --block-profile-rate=0 Sample rate for block profile. --enable-persistence Turn on persistent storage for the metastore and profile storage. --storage-active-memory=536870912 Amount of memory to use for active storage. Defaults to 512MB. --storage-path="data" Path to storage directory. --storage-enable-wal Enables write ahead log for profile storage. --storage-snapshot-trigger-size=134217728 Number of bytes to trigger a snapshot. Defaults to 1/4 of active memory. This is only used if enable-wal is set. --storage-row-group-size=8192 Number of rows in each row group during compaction and persistence. Setting to <= 0 results in a single row group per file. --storage-index-on-disk Whether to store the index on disk instead of in memory. Useful to reduce the memory footprint of the store. --symbolizer-demangle-mode="simple" Mode to demangle C++ symbols. Default mode is simplified: no parameters, no templates, no return type --symbolizer-external-addr-2-line-path="" Path to addr2line utility, to be used for symbolization instead of native implementation --symbolizer-number-of-tries=3 Number of tries to attempt to symbolize an unsybolized location --debuginfo-cache-dir="/tmp" Path to directory where debuginfo is cached. --debuginfo-upload-max-size=1000000000 Maximum size of debuginfo upload in bytes. --debuginfo-upload-max-duration=15m Maximum duration of debuginfo upload. --debuginfo-uploads-signed-url Whether to use signed URLs for debuginfo uploads. --debuginfod-upstream-servers=debuginfod.elfutils.org,... Upstream debuginfod servers. Defaults to debuginfod.elfutils.org. It is an ordered list of servers to try. Learn more at https://sourceware.org/elfutils/Debuginfod.html --debuginfod-http-request-timeout=5m Timeout duration for HTTP request to upstream debuginfod server. Defaults to 5m --profile-share-server="api.pprof.me:443" gRPC address to send share profile requests to. --store-address=STRING gRPC address to send profiles and symbols to. --bearer-token=STRING Bearer token to authenticate with store ($PARCA_BEARER_TOKEN). --bearer-token-file=STRING File to read bearer token from to authenticate with store. --insecure Send gRPC requests via plaintext instead of TLS. --insecure-skip-verify Skip TLS certificate verification. --external-label=KEY=VALUE;... Label(s) to attach to all profiles in scraper-only mode. --grpc-headers=KEY=VALUE;... Additional gRPC headers to send with each request to the remote store (key=value pairs). ``` ## 由 Meticulous 测试 我们使用 Meticulous 自动测试我们的 UI,以防止任何意外的更改。 [](https://meticulous.ai/?utm_source=parca&utm_campaign=oss)
标签:API集成, APM, C++, CPU分析, Docker镜像, Go语言, JARM, MITM代理, NIDS, pprof, Profiling, Python工具, Rust, 低开销, 内存分析, 可观测性, 基础设施监控, 子域名突变, 容器化, 开源, 性能优化, 性能监控, 成本优化, 持续性能分析, 故障排查, 数据擦除, 日志审计, 检测绕过, 程序破解, 系统诊断, 网络流量审计, 自动化攻击, 行级定位