Olympian21/Splunk-SIEM-Log-Analysis
GitHub: Olympian21/Splunk-SIEM-Log-Analysis
在 Azure 上部署 Splunk SIEM 的实操实验,从 Windows 域控制器收集安全日志并构建实时仪表板和自动化警报,用于检测可疑登录活动。
Stars: 0 | Forks: 0
# Splunk SIEM 与日志分析实验
这是一个实操性质的 SOC 实验室,主要在 Azure 上部署 Splunk Enterprise,从 Active Directory 服务器转发 Windows 安全/系统/应用程序日志,并基于这些数据构建可运行的安全仪表板和自动化警报。
**工具:** Splunk Enterprise (免费版) · Splunk Universal Forwarder · Azure VM (Windows Server 2025 + Ubuntu)
**技能领域:** SIEM 运维 · SPL · 日志接入 · 安全仪表板 · 检测警报
**认证对标:** CompTIA Security+ · CySA+ · Splunk Core Certified User
## 在此观看实验操作演示!
https://www.loom.com/share/46adb7efd15342bba8f3c076e60395cd
## 解决的业务问题
一个中型组织每天跨工作站、域控制器、防火墙和云服务生成数以百万计的日志事件。如果没有一个集中搜索所有日志的平台,调查事件的安全团队必须分别登录每个系统并进行手动搜索——这恰恰在最需要速度的时候拖慢了进度。SIEM 通过将每个日志源拉入一个可搜索的 index 来解决这个问题,这样分析师就可以在一个地方而不是五个地方回答“发生了什么、何时发生、从哪里发生以及影响了什么”。
本实验端到端地构建了这个流水线:一台 Windows Server 域控制器将其 Security、System 和 Application 日志转发到 Splunk 实例,由 Splunk 对其进行索引,将其呈现在实时仪表板上,并在满足检测条件时触发自动化警报。这是每个 SOC Analyst、Security Engineer 和 Incident Responder 职位背后的核心工作流——而且相同的关联和警报模型可以直接应用到 Microsoft Sentinel、AWS Security Hub 或雇主碰巧使用的任何其他 SIEM 中。
## 架构 — 日志如何流入 Splunk
```
flowchart LR
subgraph ad["Windows Server VM (Lab 1 — Active Directory)"]
evt["Security / System / Application
Event Logs"] uf["Splunk Universal Forwarder
reads inputs.conf"] end subgraph net["Azure Network"] peer["NSG rules + VNet peering
port 9997"] end subgraph splunk["Ubuntu VM — Splunk Enterprise"] recv["Receiving Port 9997"] idx["Index: windows_logs"] spl["SPL Search Processor"] dash["Dashboard + Alert Scheduler"] ui["Web UI — port 8000"] end evt --> uf uf -->|encrypted, port 9997| peer peer --> recv recv --> idx idx --> spl spl --> dash dash --> ui ``` **流程解读:** Windows Event Logs 由 **Universal Forwarder** 读取,通过配置 `inputs.conf` 来监控 Security、System 和 Application 日志。转发器对这些数据进行压缩和加密,并通过**端口 9997**将其发送到 Splunk VM——只有在 NSG 规则和 VNet peering 都配置完毕后,这些流量才能成功跨越网络边界。在 Splunk 端,传入的事件会进入 **`windows_logs`** index,通过 **SPL** 变得可搜索,并以两种方式呈现:一个用于一目了然监控的**仪表板**,以及一个在满足检测条件时自动触发的**定时警报**——这两者都不需要分析师实时盯着屏幕才能运作。 ## 本仓库包含的内容 | 文件 | 说明内容 | |------|---------------| | `screenshots/windows-security-dashboard.png` | 填充了所有四个面板的完整“Windows Security Overview”仪表板 | | `screenshots/high-privileged-logon-alert.png` | High Privileged Logon Count 的已保存警报配置 | | `inputs.conf` | 用于将 Security/System/Application 日志收集到 `windows_logs` 的转发器配置 | | `spl-queries.txt` | 用于构建每个仪表板面板和警报的 SPL 搜索 | ## 安全仪表板 — "Windows Security Overview" 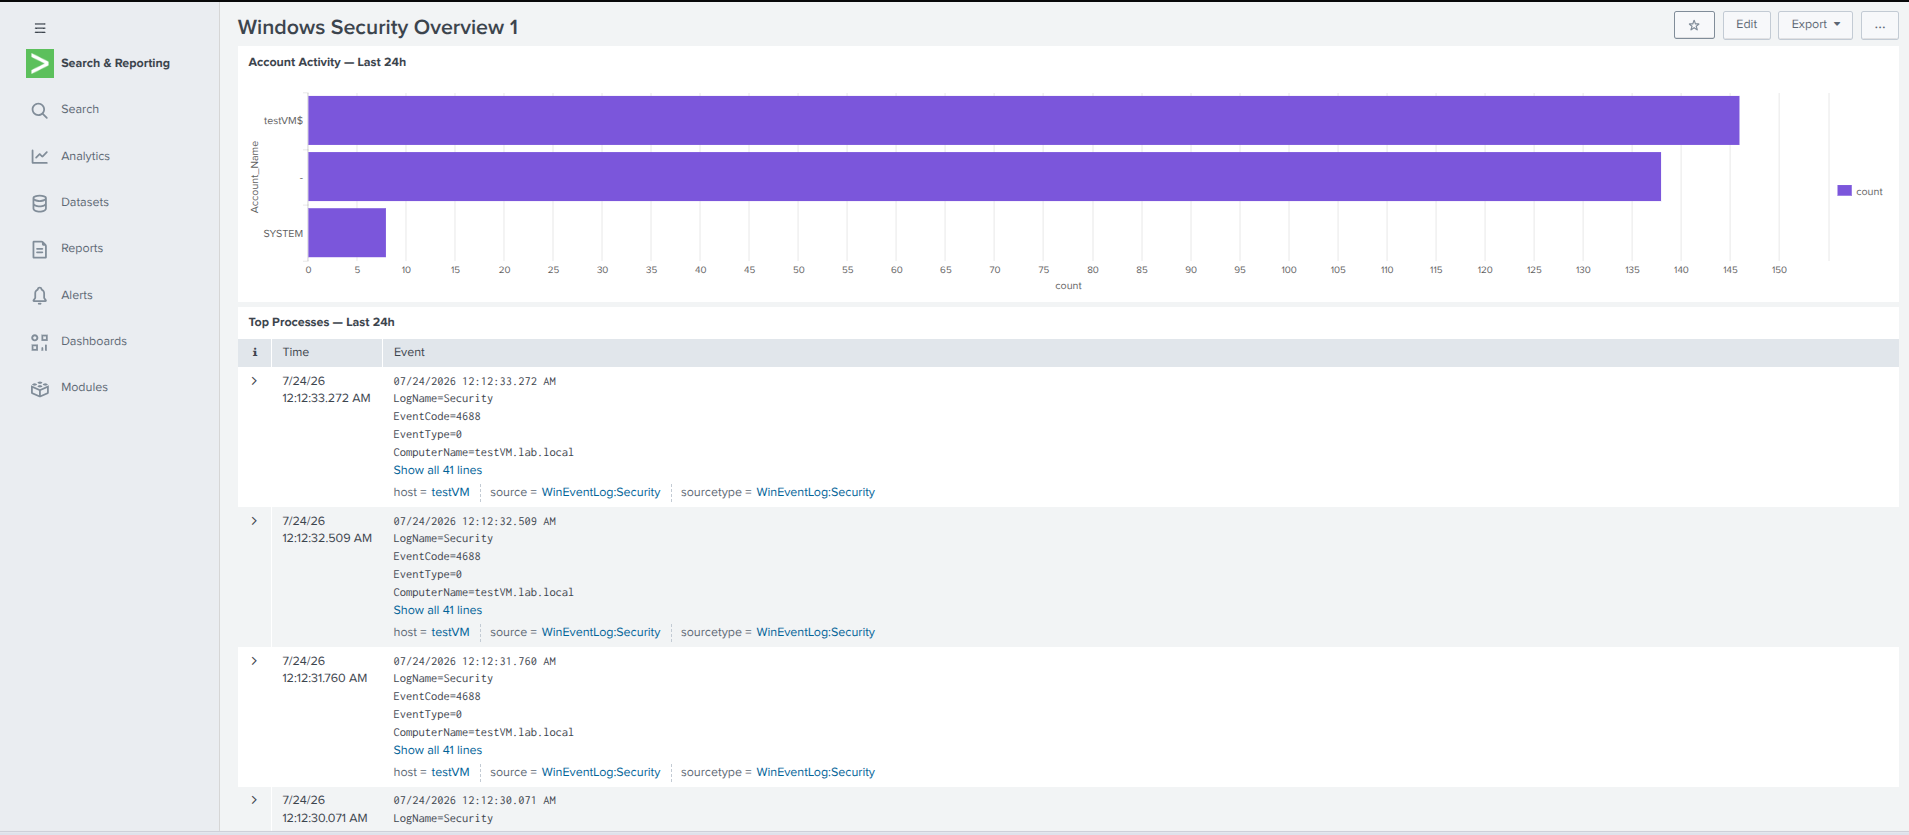 | 面板 | 搜索 | 可视化 | |-------|--------|----------------| | Account Activity — 过去 24 小时 | `index=windows_logs sourcetype=WinEventLog:Security EventCode=4624 \| stats count by Account_Name \| sort -count` | 条形图 | | Top Processes — 过去 24 小时 | `index=windows_logs sourcetype=WinEventLog:Security EventCode=4688 \| stats count by Creator_Process_Name \| sort -count \| head 20` | 事件列表 | | Login Activity Over Time | `index=windows_logs sourcetype=WinEventLog:Security EventCode=4624 \| timechart count` | 折线图 | | After-Hours Logins | `index=windows_logs sourcetype=WinEventLog:Security EventCode=4624 \| eval hour=strftime(_time,"%H") \| where hour<7 OR hour>19 \| table _time, Account_Name, Account_Domain, ComputerName \| sort -_time` | 事件列表 | ### 每个面板显示的内容及其重要性 **Account Activity** 面板按账户对成功登录 (Event ID 4624) 进行计数,这将大量单独的事件转化为直观的视觉答案,以回答“到底是谁在登录”——一个很少登录的账户突然激增,往往是出现异常的第一个明显迹象。**Top Processes** 对进程创建事件 (4688) 执行相同的操作,显示环境中运行最频繁的可执行文件;由于攻击者经常依赖常见的内置工具来伪装自己,因此了解这里的正常基线,正是让陌生的或不寻常的进程名称在日后变得显眼的关键。**Login Activity Over Time** 将登录量绘制为趋势线而不是单个数字,这很重要,因为基于流量的攻击——暴力破解尝试、密码喷涂——在原始事件列表中变得明显之前很久,就会在时间轴上呈现出一种形状。**After-Hours Logins** 将成功登录过滤到正常早 7 点至晚 7 点工作日之外的时间段;计算机账户(以 `$` 结尾)在夜间登录是常规操作,但人类账户在凌晨 3 点进行身份验证正是 SOC 分析师受过训练并会立即追查的那种异常,而这个面板将该列表直接呈现在你面前,无需手动搜索。 ## 自动化警报 — "High Privileged Logon Count" 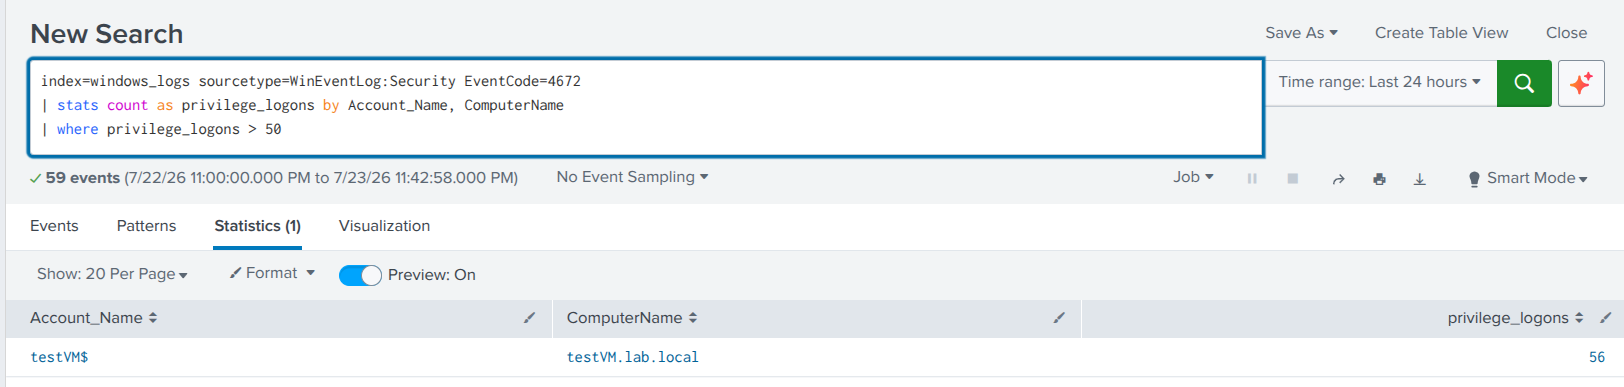 **搜索:** ``` index=windows_logs sourcetype=WinEventLog:Security EventCode=4672 | stats count as privilege_logons by Account_Name, ComputerName | where privilege_logons > 50 ``` **计划任务:** Cron `*/15 * * * *`(每 15 分钟) **触发条件:** 结果数 > 0 **触发动作:** 添加到 Triggered Alerts ### 这说明了什么及其重要性 只要账户在登录时被授予管理员级别权限,Event ID 4672 就会触发——因此,在短时间内一台机器上的一个账户出现大量此类事件是一个有意义的信号,而不是噪音。这个警报不需要人类记得去检查这种模式,而是每 15 分钟自动运行一次搜索,并在越过阈值的瞬间将命中记录到 Splunk 的 Triggered Alerts 历史记录中。这就是真实世界 SOC 检测背后的实际机制:系统持续监控,并且只在真正满足既定条件时才将工作呈现出来,而不是分析师盯着仪表板希望发现些什么。阈值 (50) 是一个起点,而不是固定的规则——随着时间的推移,根据真实的误报率对其进行调优是工作的一部分,而这种调优过程正是区分一个会被采取行动的检测和一个因警报疲劳而被忽略的检测的关键所在。 ## 第 1 步 — 获取 Splunk 免费版 Splunk Enterprise 免费下载,拥有 60 天的完整试用版,之后会自动转换为免费许可证——上限为每天 500MB 的索引量,对于家庭实验室来说绰绰有余。 ### 创建一个 Splunk 账户 Splunk 在下载前需要一个账户和填写注册表。临时电子邮件地址即可完成此操作——无需使用真实的个人信息: 1. 访问 `temp-mail.org/en/` —— 会自动生成一个临时电子邮件地址,无需注册。 2. 将该地址粘贴到 Splunk 注册表单的 Email 字段中;其余部分(姓名、公司、职位、电话)填入任意占位信息即可。 3. Splunk 会发送一封确认邮件——它会在一分钟内出现在临时邮箱中。点击确认链接以激活账户。 ### 在 Azure VM 上部署 | VM 设置 | 值 | |------------|-------| | 操作系统 | Ubuntu 22.04 LTS (符合免费层条件) | | 规格 | `Standard_B2s` (2 个 vCPU,4GB RAM —— Splunk 的最低配置) | | 磁盘 | 最少 30GB | | 入站 NSG 端口 | `8000` (Splunk Web UI) · `9997` (forwarder 输入) · `22` (SSH) | 将端口 `8000` 和 `22` 限制为仅你自己的 IP 地址,并将 `9997` 仅限制为 VNet 地址范围(例如 `10.0.0.0/16`)——这样只有网络上的其他 VM 才能转发日志,而不是公共互联网。 ### 通过 SSH 连接到 Linux VM Mac 和 Linux 都内置了 SSH——无需额外工具。 **首先修复密钥文件权限。** 从 Azure 下载的 `.pem` 密钥的初始权限过于开放;SSH 会拒绝使用它,直到权限被收紧: 跳过此步骤会产生 `UNPROTECTED PRIVATE KEY FILE` 警告并导致连接被拒绝。 **然后连接:** ``` ssh -i yourkey.pem azureuser@YOUR_VM_PUBLIC_IP ``` 将 `azureuser` 替换为创建 VM 时设置的管理员用户名,并将 `YOUR_VM_PUBLIC_IP` 替换为 Azure 门户中的当前公共 IP。接受主机指纹提示 (`yes`),然后输入密码。 ### 安装 Splunk 以下每条命令都按顺序通过该 SSH 会话执行。 **1 — 下载安装程序:** ``` wget -O splunk-10.2.2-linux-amd64.deb "https://download.splunk.com/products/splunk/releases/10.2.2/linux/splunk-10.2.2-80b90d638de6-linux-amd64.deb" ``` 如果出现 404 错误,说明 Splunk 已发布了更新的版本——登录 splunk.com,进入 Free Trials and Downloads,选择 Linux 的 `.deb` 包,并从下载页面复制当前的 `wget` 命令。 **2 — 安装软件包:** ``` sudo dpkg -i splunk-10.2.2-linux-amd64.deb ``` 这会将 Splunk 解压到 `/opt/splunk/`。关于缺少 Python 3.7 路径的警告在 Ubuntu 22.04 上是正常的,而且无害——Splunk 10.x 自带了 Python。 **3 — 启动 Splunk 并接受许可协议:** ``` sudo /opt/splunk/bin/splunk start --accept-license --run-as-root ``` 这里会设置 Web UI 的管理员用户名和密码——系统会以交互方式提示你输入。 **4 — 启用 Splunk 开机自启:** ``` sudo /opt/splunk/bin/splunk enable boot-start ``` 如果不这样做,每次 VM 重启后都需要通过 SSH 手动启动 Splunk。 ### 访问 Web UI ``` http://:8000
```
### 如果浏览器显示“无法访问此网站”
端口 8000 上的超时几乎总是由于缺少 NSG 规则。按顺序进行以下检查:
1. **添加端口 8000 的 NSG 规则**(最常见的原因) —— Azure 门户 → VM →
**Networking** → **Inbound port rules**。如果没有允许端口 8000 的规则,请添加一条:名称 `Allow-SplunkWebUI-MyIP`,源 `My IP address`,目标
端口 `8000`,协议 `TCP`,操作 `Allow`,优先级 `310`。
2. **确认 Splunk 正在运行:**
sudo /opt/splunk/bin/splunk status
如果显示已停止:`sudo /opt/splunk/bin/splunk start --accept-license --run-as-root`。
3. **确认 Splunk 正在监听端口 8000:**
sudo ss -tlnp | grep 8000
预期会看到一行显示 `0.0.0.0:8000` 并且进程
列中包含 `splunkd`。没有返回结果意味着 Splunk 没有运行;返回了一行但
浏览器仍然失败,则问题指向 NSG 规则。
4. **确认当前的公共 IP** —— Azure 门户 → VM → **Overview**。
除非设置为 Static,否则 Azure 会在停止/重启时重新分配公共 IP,因此始终从门户获取当前的 IP,而不是使用保存的
书签。
5. **为转发器添加端口 9997 的入站规则** —— 源
`IP Addresses`,Source IP = Windows VM 的私有 IP,目标端口
`9997`,协议 `TCP`,操作 `Allow`,优先级 `320`。
6. **设置 VNet Peering** 如果 Windows Server VM 和 Splunk VM 位于
不同的 VNet 中 —— 仅靠 NSG 规则无法让两个独立的 VNet 相互通信;peering 在它们之间建立私有连接。给
peering 链接指定描述性名称(例如 `splunk-vnet-to-ad-vnet` /
`ad-vnet-to-splunk-vnet`),并等待两个链接都显示 **Connected**
后再进行测试。之后,在 Windows VM 上重启转发器:
`Restart-Service SplunkForwarder`。
**未来实验室的最佳实践:** 从一开始就将每个实验室 VM 放在一个共享的 VNet 中,每个 VM 位于自己的子网中(例如 AD 使用 `10.0.1.0/24`,Splunk 使用 `10.0.2.0/24`)——同一个 VNet 中的 VM 只需通过 NSG 规则即可自由通信,无需 peering。
**要阻止公共 IP 在会话之间更改:** VM →
**Networking** → 公共 IP 资源 → **Configuration** → 将
**Assignment** 设置为 **Static**。
## 第 2 步 — 配置数据输入
### A 部分 — 在 Splunk 中启用接收
1. 登录到 Splunk Web UI。
2. **Settings → Forwarding and Receiving → Configure Receiving → New
Receiving Port** → 输入 `9997` → **Save**。
3. **Settings → Indexes → Create New Index** → 将其命名为 `windows_logs` →
**Save**。
### B 部分 — 在 Windows Server 上安装 Forwarder
在实验 1 的 Windows Server VM 上完成——而不是 Splunk Ubuntu VM。
1. 在 Windows Server VM 上,转到
`splunk.com/en_us/download/universal-forwarder.html` 并使用下载 Enterprise 时使用的相同 Splunk 账户登录。
2. 下载 **Windows 64-bit** 安装程序——该页面还列出了 32 位
和 ARM 选项;64 位是正确的选择。
3. 运行安装程序。当要求提供 **Deployment Server** 时,将其留
空——将其设置为 Splunk VM 的 IP 会导致转发器连接到错误的地址,从而导致没有数据流入。
4. 当要求提供 **Receiving Indexer** 时,输入 Splunk VM 的**私有**
IP 和端口 `9997`(例如 `10.2.0.4:9997`)。
5. 使用默认设置完成安装。
### C 部分 — 配置 inputs.conf
`inputs.conf` 告诉转发器确切要收集哪些日志。文件
位置:
```
C:\Program Files\SplunkUniversalForwarder\etc\system\local\inputs.conf
```
(如果 `local` 文件夹不存在,请先创建它。)VS Code 是
编辑此文件最简单的工具——从 `code.visualstudio.com` 将其安装在 Windows VM 上,
然后以 **管理员身份** 运行,这样它才能将其保存到 `Program Files` 中。
```
# Windows Server VM 上的文件位置:
# C:\Program Files\SplunkUniversalForwarder\etc\system\local\inputs.conf
[WinEventLog://Security]
# Security 日志包含所有身份验证事件 — 登录、失败、锁定
disabled = 0
start_from = oldest
current_only = 0
evt_resolve_ad_obj = 1
index = windows_logs
[WinEventLog://System]
# System 日志包含 OS 级别的事件 — 服务启动/停止、驱动程序故障
disabled = 0
index = windows_logs
[WinEventLog://Application]
# Application 日志包含来自已安装应用程序的事件
disabled = 0
index = windows_logs
```
保存后,在管理员 PowerShell 中重启转发器:
```
Restart-Service SplunkForwarder
```
## 第 2 步 D — 生成测试日志数据
全新的 Windows Server VM 的 Security/System/Application 日志几乎是空的。
此 PowerShell 脚本(在 Windows Server VM 上以管理员身份运行)
模拟真实活动——失败的登录、成功登录、服务重启、应用程序警告和账户锁定——通过创建一个临时本地账户,针对其生成登录活动,然后
将其删除。VM 上的任何内容都不会被永久更改。
```
# ============================================================
# Lab 3 Log Generator - 在 Windows VM 上以管理员身份运行
# 输出保存至 C:\lab3-log-output.txt
# ============================================================
$logFile = 'C:\lab3-log-output.txt'
$timestamp = Get-Date -Format 'yyyy-MM-dd HH:mm:ss'
function Log($message, $color = 'White') {
Write-Host $message -ForegroundColor $color
Add-Content -Path $logFile -Value "[$timestamp] $message"
}
if (Test-Path $logFile) { Remove-Item $logFile }
Add-Content -Path $logFile -Value "Lab 3 Log Generator - Run started at $timestamp"
Add-Content -Path $logFile -Value '============================================='
Log 'Starting log generation...' Green
$testUser = 'labtest.user'
$testPass = ConvertTo-SecureString 'TempPass123!' -AsPlainText -Force
New-LocalUser -Name $testUser -Password $testPass -Description 'Splunk lab test account' -ErrorAction SilentlyContinue
Log "Created test user: $testUser" Gray
Log 'Generating failed logon attempts (Security log activity)...' Yellow
$wrongPass = ConvertTo-SecureString 'WrongPassword!' -AsPlainText -Force
1..15 | ForEach-Object {
$cred = New-Object System.Management.Automation.PSCredential($testUser, $wrongPass)
Start-Process -FilePath 'cmd.exe' -Credential $cred -ArgumentList '/c exit' -ErrorAction SilentlyContinue
Start-Sleep -Milliseconds 500
}
Log ' Generated 15 failed logon attempts' Gray
Log 'Generating successful login event (4624)...' Yellow
$correctPass = ConvertTo-SecureString 'TempPass123!' -AsPlainText -Force
$cred = New-Object System.Management.Automation.PSCredential($testUser, $correctPass)
Start-Process -FilePath 'cmd.exe' -Credential $cred -ArgumentList '/c whoami' -Wait -ErrorAction SilentlyContinue
Log ' Generated successful login (Event ID 4624)' Gray
Log 'Generating service events (7036)...' Yellow
$services = @('Spooler','Schedule','Netlogon')
$services | ForEach-Object {
Stop-Service -Name $_ -Force -ErrorAction SilentlyContinue
Start-Sleep -Seconds 2
Start-Service -Name $_ -ErrorAction SilentlyContinue
Start-Sleep -Seconds 1
Log " Stopped and restarted service: $_" Gray
}
Log 'Generating application log events...' Yellow
$eventSource = 'SplunkLabTest'
if (-not [System.Diagnostics.EventLog]::SourceExists($eventSource)) {
New-EventLog -LogName Application -Source $eventSource -ErrorAction SilentlyContinue
}
1..5 | ForEach-Object {
Write-EventLog -LogName Application -Source $eventSource -EventId 1001 `
-EntryType Warning -Message 'Splunk lab test event - application warning'
Start-Sleep -Milliseconds 300
}
Log ' Generated 5 application log entries (Event ID 1001)' Gray
Log 'Generating account lockout event (4740)...' Yellow
$badCred = ConvertTo-SecureString 'BadPass!' -AsPlainText -Force
1..20 | ForEach-Object {
$cred = New-Object System.Management.Automation.PSCredential($testUser, $badCred)
Start-Process -FilePath 'cmd.exe' -Credential $cred -ArgumentList '/c exit' -ErrorAction SilentlyContinue
Start-Sleep -Milliseconds 200
}
Log ' Account lockout triggered (Event ID 4740)' Gray
Start-Sleep -Seconds 3
Remove-LocalUser -Name $testUser -ErrorAction SilentlyContinue
Log "Removed test user: $testUser" Gray
Log 'Restarting forwarder to ship events to Splunk...' Yellow
Restart-Service SplunkForwarder -ErrorAction SilentlyContinue
Log ' SplunkForwarder restarted' Gray
$endTime = Get-Date -Format 'yyyy-MM-dd HH:mm:ss'
Add-Content -Path $logFile -Value '============================================='
Add-Content -Path $logFile -Value "Run completed at $endTime"
Add-Content -Path $logFile -Value 'Wait 60 seconds then run: index=windows_logs | head 100'
```
完成后,等待 60 秒让转发器发送事件,将
Splunk 时间范围设置为 **All Time**,然后运行:
```
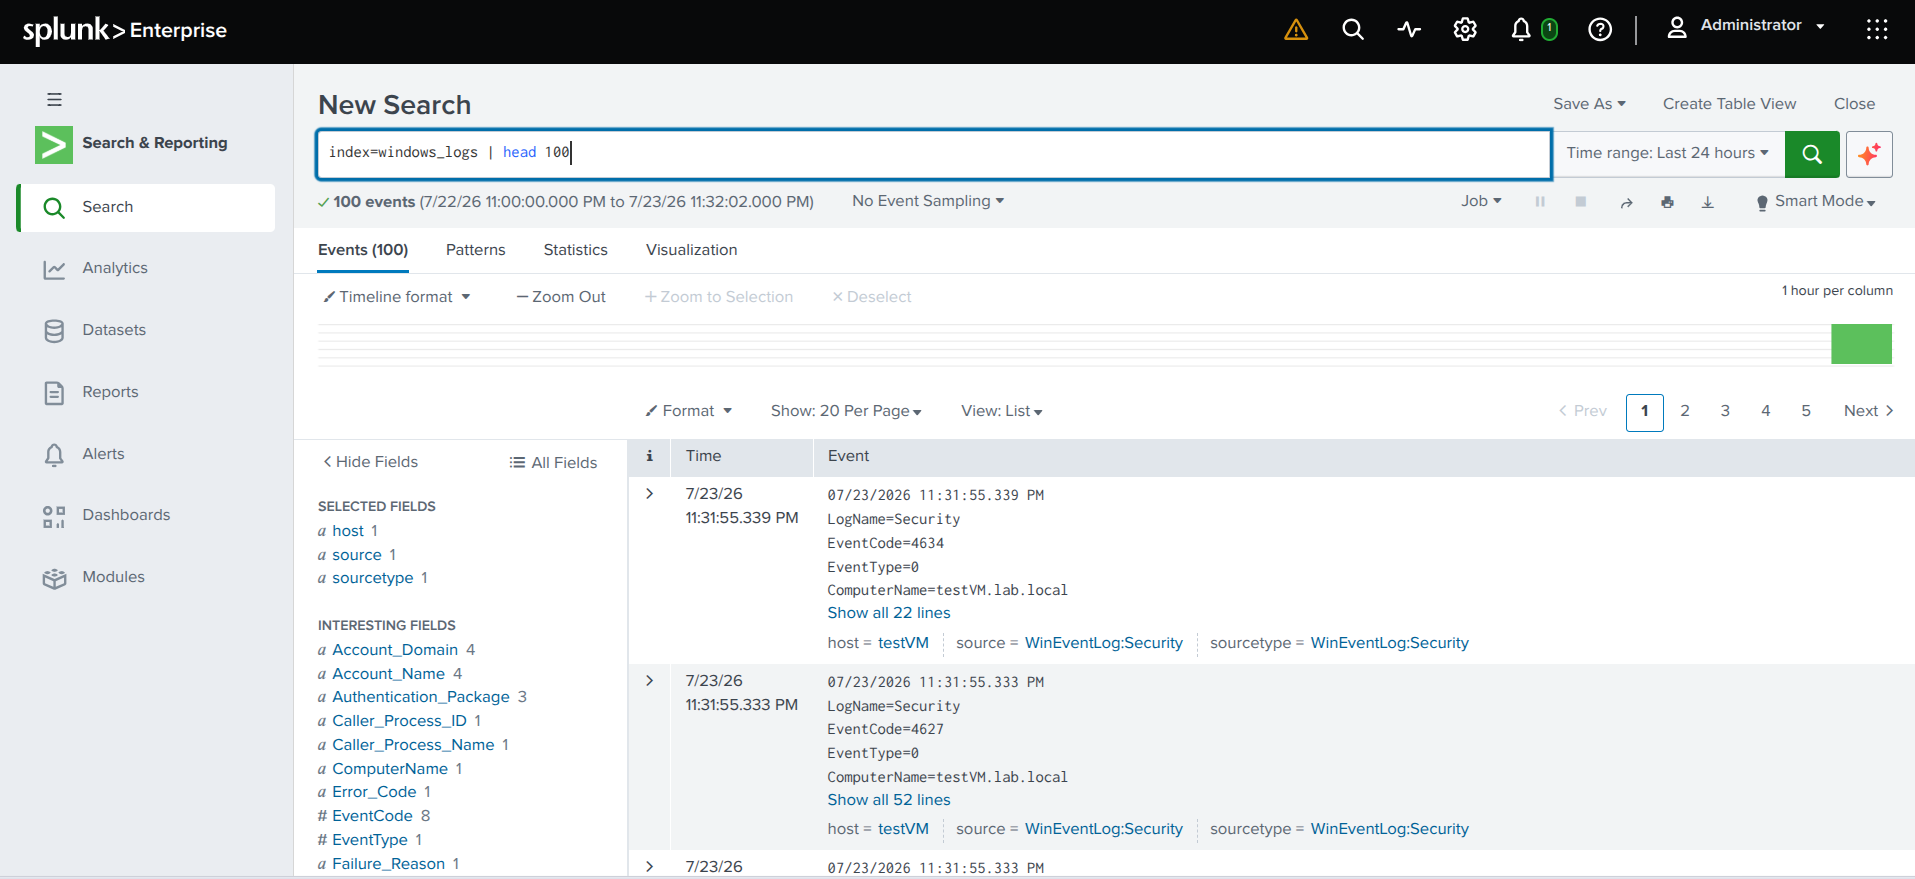
index=windows_logs | head 100
```
应出现来自 Security、System 和 Application 的事件。
## 第 3 步 — 基础 SPL 搜索
所有搜索都在 Search & Reporting 应用的搜索栏中运行,并在
右侧选择时间范围。
**确认数据正在流入:**
```
index=windows_logs | head 100
```
无返回结果 → 检查 Windows VM 上的 `SplunkForwarder` 是否正在运行。
**查找成功登录 (EventCode 4624):**
```
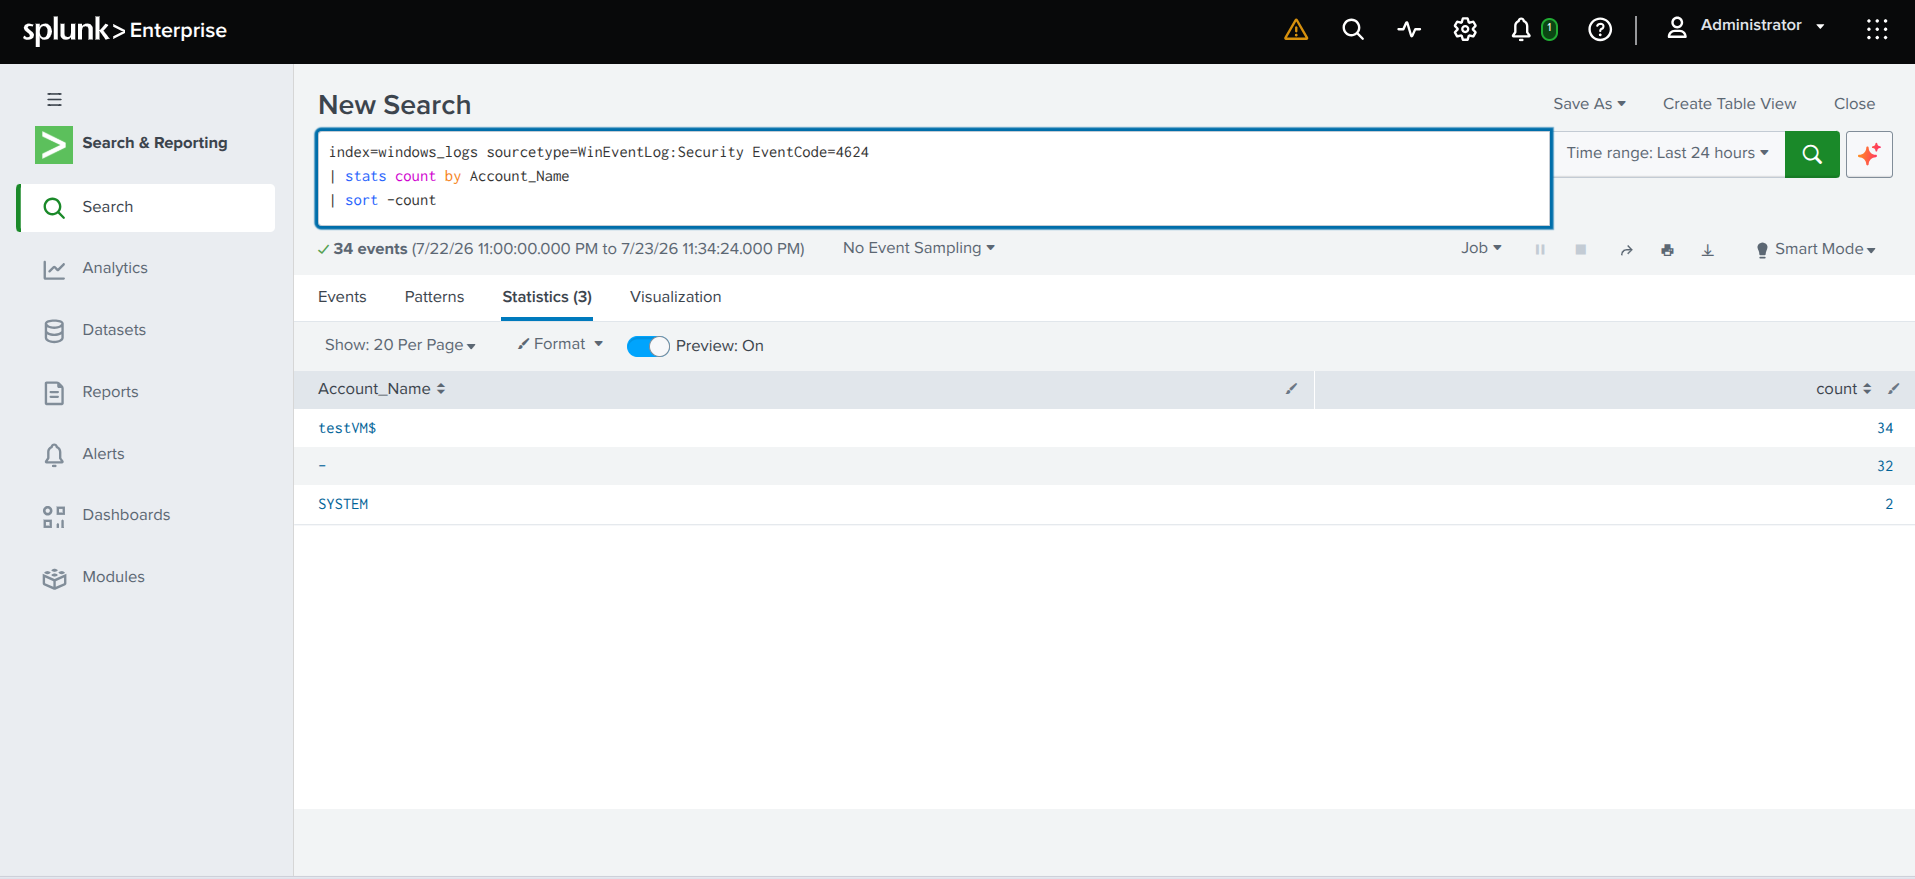
index=windows_logs sourcetype=WinEventLog:Security EventCode=4624
| stats count by Account_Name
| sort -count
```
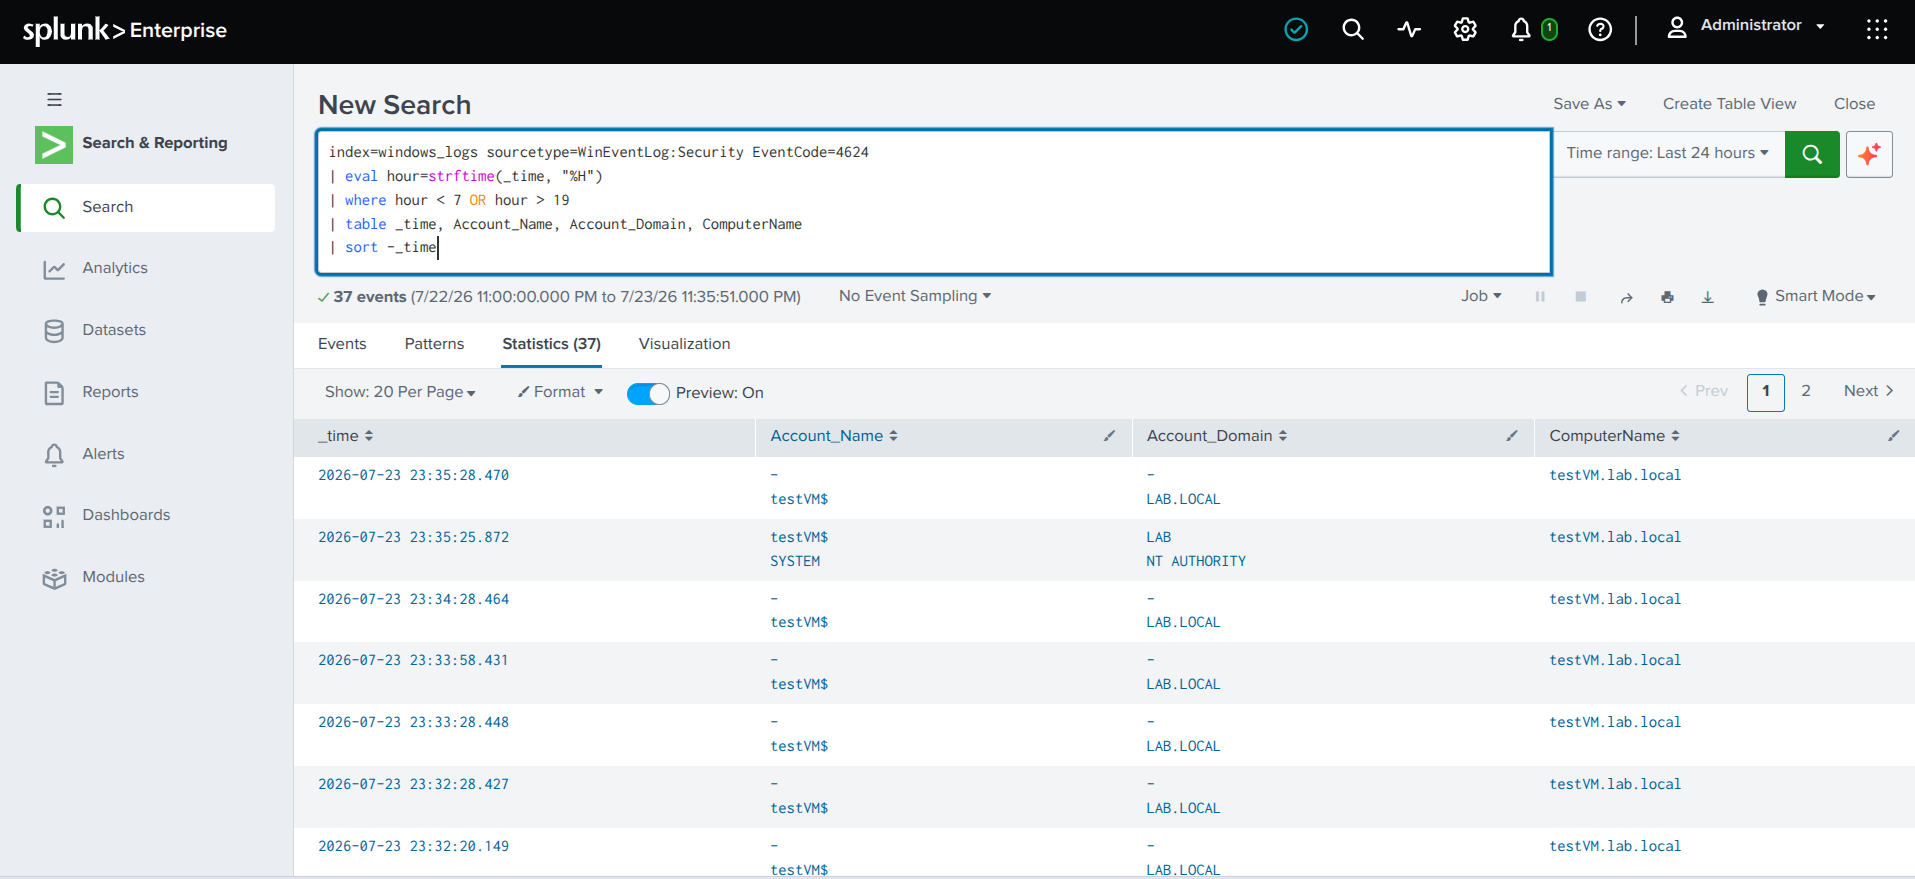
**检测非工作时间登录:**
```
index=windows_logs sourcetype=WinEventLog:Security EventCode=4624
| eval hour=strftime(_time, "%H")
| where hour < 7 OR hour > 19
| table _time, Account_Name, Account_Domain, ComputerName
| sort -_time
```
以 `$` 结尾的账户名是计算机账户,在夜间出现是正常的;人类账户在非工作时间进行身份验证则需要进行审查。
## 第 4 步 — 构建安全仪表板
1. **Dashboards → Create New Dashboard.**
2. 标题为 `Windows Security Overview`,将 Description 留空,
权限设为私有,类型选择 **Classic Dashboards → Create → Create
Dashboard**。
3. 为上面面板表格中的每一行点击 **Add Panel** —— New Search,
粘贴 SPL,选择列出的可视化效果,然后保存。
完整的面板表格、屏幕截图以及每个面板显示内容的说明
都在上面的 [安全仪表板](#security-dashboard--windows-security-overview)
部分中。
## 第 5 步 — 创建自动化警报
1. 在搜索栏中运行特权登录搜索(在上面的
[自动化警报](#automated-alert--high-privileged-logon-count) 部分
中),首先确认它能正常工作。
2. **Save As → Alert.**
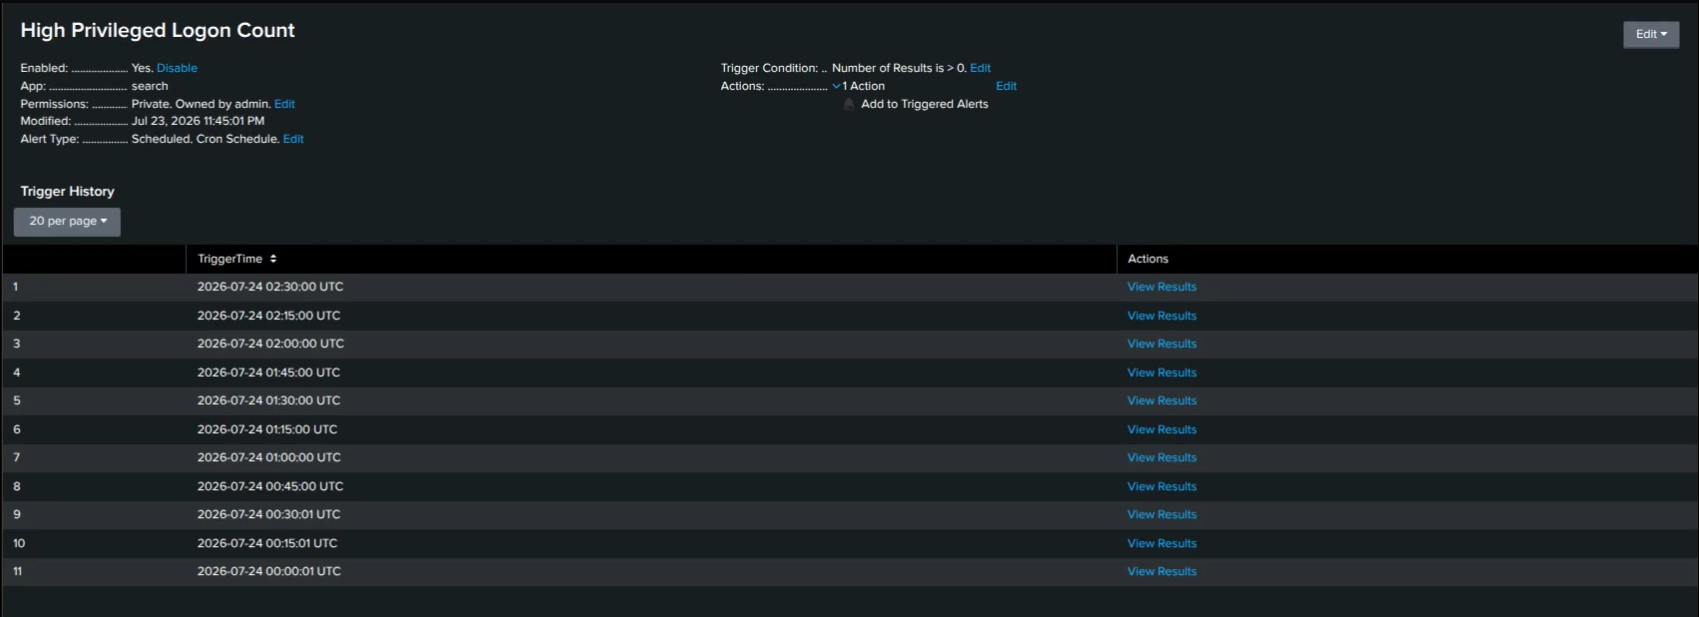
3. 名称:`High Privileged Logon Count`。警报类型:**Scheduled**。通过
**Cron Schedule** 每 15 分钟运行一次:`*/15 * * * *`。
4. 触发条件:**Number of Results is greater than 0**。
5. 触发动作:**Add to Triggered Alerts** —— 将每次触发记录到
**Activity → Triggered Alerts** 中,附带时间戳和结果计数,无需
邮件或工单系统集成。
6. **Save.**
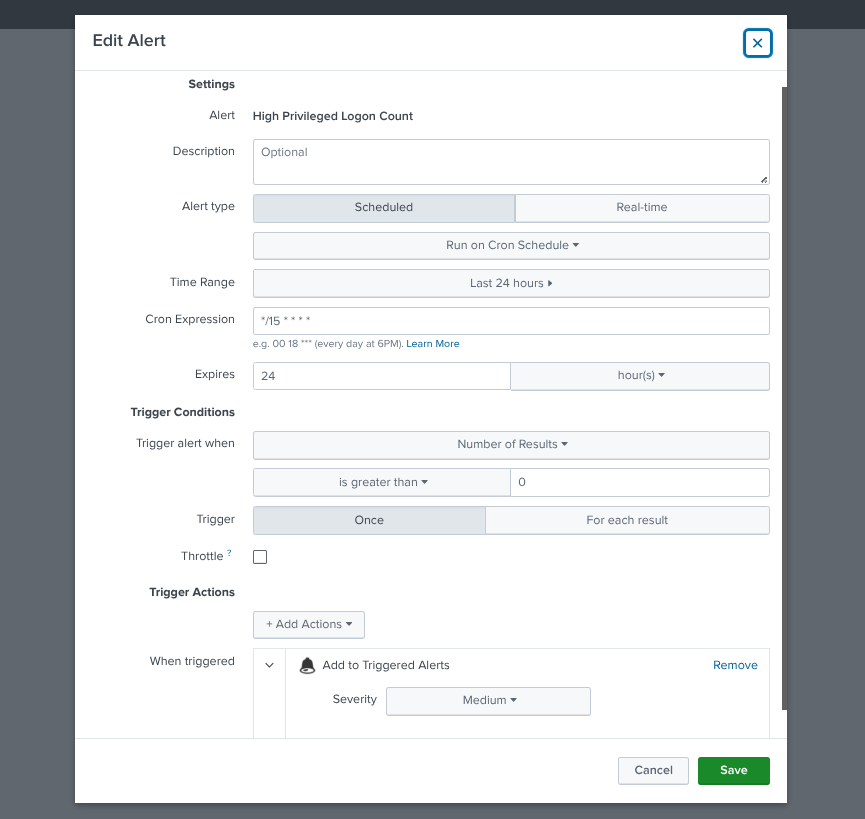
触发范围太广的警报会造成警报疲劳;而范围太窄则会
错过真正的威胁——这里的阈值是一个起点,可随着时间推移
根据真实的误报率进行调优。
## 验证 — 确认实验正常运行
| 检查项目 | 如何验证 |
|-------|---------------|
| 数据正在流入 Splunk | `index=windows_logs \| head 10` 返回近期事件 |
| 登录活动搜索有效 | EventCode=4624 搜索立即返回结果 |
| 仪表板显示数据 | Windows Security Overview 仪表板显示已填充的面板 |
| 警报处于活动状态 | **Settings → Searches, Reports, and Alerts** 显示警报已启用 |
## 关键要点
- SIEM 的价值不在于数据本身——而在于将来自每个系统的分散日志
汇集到一个在发生事件时能够快速搜索的地方。
- 可靠地接入数据(转发器配置、NSG 规则、VNet peering)通常是
SIEM 部署中最困难的部分,而不是编写搜索语句。
- 一个好的安全仪表板能一目了然地回答特定问题——谁在
登录、运行了什么、流量趋势是否异常、在正常时间之外
是否发生了任何事情——而不是仅仅显示原始数据。
- 自动化警报将检测从“希望有人能注意到”转变为
一个主动监控的系统,并且只在满足真实
条件时才打断人类。
Event Logs"] uf["Splunk Universal Forwarder
reads inputs.conf"] end subgraph net["Azure Network"] peer["NSG rules + VNet peering
port 9997"] end subgraph splunk["Ubuntu VM — Splunk Enterprise"] recv["Receiving Port 9997"] idx["Index: windows_logs"] spl["SPL Search Processor"] dash["Dashboard + Alert Scheduler"] ui["Web UI — port 8000"] end evt --> uf uf -->|encrypted, port 9997| peer peer --> recv recv --> idx idx --> spl spl --> dash dash --> ui ``` **流程解读:** Windows Event Logs 由 **Universal Forwarder** 读取,通过配置 `inputs.conf` 来监控 Security、System 和 Application 日志。转发器对这些数据进行压缩和加密,并通过**端口 9997**将其发送到 Splunk VM——只有在 NSG 规则和 VNet peering 都配置完毕后,这些流量才能成功跨越网络边界。在 Splunk 端,传入的事件会进入 **`windows_logs`** index,通过 **SPL** 变得可搜索,并以两种方式呈现:一个用于一目了然监控的**仪表板**,以及一个在满足检测条件时自动触发的**定时警报**——这两者都不需要分析师实时盯着屏幕才能运作。 ## 本仓库包含的内容 | 文件 | 说明内容 | |------|---------------| | `screenshots/windows-security-dashboard.png` | 填充了所有四个面板的完整“Windows Security Overview”仪表板 | | `screenshots/high-privileged-logon-alert.png` | High Privileged Logon Count 的已保存警报配置 | | `inputs.conf` | 用于将 Security/System/Application 日志收集到 `windows_logs` 的转发器配置 | | `spl-queries.txt` | 用于构建每个仪表板面板和警报的 SPL 搜索 | ## 安全仪表板 — "Windows Security Overview"  | 面板 | 搜索 | 可视化 | |-------|--------|----------------| | Account Activity — 过去 24 小时 | `index=windows_logs sourcetype=WinEventLog:Security EventCode=4624 \| stats count by Account_Name \| sort -count` | 条形图 | | Top Processes — 过去 24 小时 | `index=windows_logs sourcetype=WinEventLog:Security EventCode=4688 \| stats count by Creator_Process_Name \| sort -count \| head 20` | 事件列表 | | Login Activity Over Time | `index=windows_logs sourcetype=WinEventLog:Security EventCode=4624 \| timechart count` | 折线图 | | After-Hours Logins | `index=windows_logs sourcetype=WinEventLog:Security EventCode=4624 \| eval hour=strftime(_time,"%H") \| where hour<7 OR hour>19 \| table _time, Account_Name, Account_Domain, ComputerName \| sort -_time` | 事件列表 | ### 每个面板显示的内容及其重要性 **Account Activity** 面板按账户对成功登录 (Event ID 4624) 进行计数,这将大量单独的事件转化为直观的视觉答案,以回答“到底是谁在登录”——一个很少登录的账户突然激增,往往是出现异常的第一个明显迹象。**Top Processes** 对进程创建事件 (4688) 执行相同的操作,显示环境中运行最频繁的可执行文件;由于攻击者经常依赖常见的内置工具来伪装自己,因此了解这里的正常基线,正是让陌生的或不寻常的进程名称在日后变得显眼的关键。**Login Activity Over Time** 将登录量绘制为趋势线而不是单个数字,这很重要,因为基于流量的攻击——暴力破解尝试、密码喷涂——在原始事件列表中变得明显之前很久,就会在时间轴上呈现出一种形状。**After-Hours Logins** 将成功登录过滤到正常早 7 点至晚 7 点工作日之外的时间段;计算机账户(以 `$` 结尾)在夜间登录是常规操作,但人类账户在凌晨 3 点进行身份验证正是 SOC 分析师受过训练并会立即追查的那种异常,而这个面板将该列表直接呈现在你面前,无需手动搜索。 ## 自动化警报 — "High Privileged Logon Count"  **搜索:** ``` index=windows_logs sourcetype=WinEventLog:Security EventCode=4672 | stats count as privilege_logons by Account_Name, ComputerName | where privilege_logons > 50 ``` **计划任务:** Cron `*/15 * * * *`(每 15 分钟) **触发条件:** 结果数 > 0 **触发动作:** 添加到 Triggered Alerts ### 这说明了什么及其重要性 只要账户在登录时被授予管理员级别权限,Event ID 4672 就会触发——因此,在短时间内一台机器上的一个账户出现大量此类事件是一个有意义的信号,而不是噪音。这个警报不需要人类记得去检查这种模式,而是每 15 分钟自动运行一次搜索,并在越过阈值的瞬间将命中记录到 Splunk 的 Triggered Alerts 历史记录中。这就是真实世界 SOC 检测背后的实际机制:系统持续监控,并且只在真正满足既定条件时才将工作呈现出来,而不是分析师盯着仪表板希望发现些什么。阈值 (50) 是一个起点,而不是固定的规则——随着时间的推移,根据真实的误报率对其进行调优是工作的一部分,而这种调优过程正是区分一个会被采取行动的检测和一个因警报疲劳而被忽略的检测的关键所在。 ## 第 1 步 — 获取 Splunk 免费版 Splunk Enterprise 免费下载,拥有 60 天的完整试用版,之后会自动转换为免费许可证——上限为每天 500MB 的索引量,对于家庭实验室来说绰绰有余。 ### 创建一个 Splunk 账户 Splunk 在下载前需要一个账户和填写注册表。临时电子邮件地址即可完成此操作——无需使用真实的个人信息: 1. 访问 `temp-mail.org/en/` —— 会自动生成一个临时电子邮件地址,无需注册。 2. 将该地址粘贴到 Splunk 注册表单的 Email 字段中;其余部分(姓名、公司、职位、电话)填入任意占位信息即可。 3. Splunk 会发送一封确认邮件——它会在一分钟内出现在临时邮箱中。点击确认链接以激活账户。 ### 在 Azure VM 上部署 | VM 设置 | 值 | |------------|-------| | 操作系统 | Ubuntu 22.04 LTS (符合免费层条件) | | 规格 | `Standard_B2s` (2 个 vCPU,4GB RAM —— Splunk 的最低配置) | | 磁盘 | 最少 30GB | | 入站 NSG 端口 | `8000` (Splunk Web UI) · `9997` (forwarder 输入) · `22` (SSH) | 将端口 `8000` 和 `22` 限制为仅你自己的 IP 地址,并将 `9997` 仅限制为 VNet 地址范围(例如 `10.0.0.0/16`)——这样只有网络上的其他 VM 才能转发日志,而不是公共互联网。 ### 通过 SSH 连接到 Linux VM Mac 和 Linux 都内置了 SSH——无需额外工具。 **首先修复密钥文件权限。** 从 Azure 下载的 `.pem` 密钥的初始权限过于开放;SSH 会拒绝使用它,直到权限被收紧: 跳过此步骤会产生 `UNPROTECTED PRIVATE KEY FILE` 警告并导致连接被拒绝。 **然后连接:** ``` ssh -i yourkey.pem azureuser@YOUR_VM_PUBLIC_IP ``` 将 `azureuser` 替换为创建 VM 时设置的管理员用户名,并将 `YOUR_VM_PUBLIC_IP` 替换为 Azure 门户中的当前公共 IP。接受主机指纹提示 (`yes`),然后输入密码。 ### 安装 Splunk 以下每条命令都按顺序通过该 SSH 会话执行。 **1 — 下载安装程序:** ``` wget -O splunk-10.2.2-linux-amd64.deb "https://download.splunk.com/products/splunk/releases/10.2.2/linux/splunk-10.2.2-80b90d638de6-linux-amd64.deb" ``` 如果出现 404 错误,说明 Splunk 已发布了更新的版本——登录 splunk.com,进入 Free Trials and Downloads,选择 Linux 的 `.deb` 包,并从下载页面复制当前的 `wget` 命令。 **2 — 安装软件包:** ``` sudo dpkg -i splunk-10.2.2-linux-amd64.deb ``` 这会将 Splunk 解压到 `/opt/splunk/`。关于缺少 Python 3.7 路径的警告在 Ubuntu 22.04 上是正常的,而且无害——Splunk 10.x 自带了 Python。 **3 — 启动 Splunk 并接受许可协议:** ``` sudo /opt/splunk/bin/splunk start --accept-license --run-as-root ``` 这里会设置 Web UI 的管理员用户名和密码——系统会以交互方式提示你输入。 **4 — 启用 Splunk 开机自启:** ``` sudo /opt/splunk/bin/splunk enable boot-start ``` 如果不这样做,每次 VM 重启后都需要通过 SSH 手动启动 Splunk。 ### 访问 Web UI ``` http://
标签:Active Directory, Azure, Plaso, 安全告警, 安全运营中心, 网络映射