RizwanSid7/azure-sre-agent-sandbox
GitHub: RizwanSid7/azure-sre-agent-sandbox
一个基于 Azure SRE Agent 和 Managed Grafana 的 SRE 实验沙盒,通过模拟虚拟机 CPU 故障演示 AI 辅助的基础设施监控与自动化根因分析。
Stars: 0 | Forks: 0
# 配备 Managed Grafana 和 VM 事故模拟的 Azure SRE Agent 沙盒
## 1. 项目简介
本项目演示了 Cloud/SRE 团队如何利用 Azure SRE Agent 和 Azure Managed Grafana 更快地排查基础设施问题。
在本实验中,我部署了一个 Azure SRE Agent 沙盒,添加了真实的 Ubuntu VM 工作负载,安装了 Nginx,模拟了高 CPU 事故,并利用 SRE Agent 对 VM 进行了分析。它成功检测到了 CPU 飙升,将其与 `az vm run-command` 关联起来,并建议了后续的排查/修复步骤。
### 简要说明
当应用程序或服务器变慢时,工程师通常需要手动检查许多地方:VM 指标、日志、仪表盘、活动日志以及最近的更改。本项目展示了 Azure SRE Agent 如何帮助总结当前发生的情况,并更快地指向可能的根本原因。
### 技术说明
本项目使用了 Azure SRE Agent(具备 Azure 资源上下文)以及连接到 Azure Monitor 指标的 Azure Managed Grafana。系统部署了一个演示 VM 工作负载,安装了 Nginx,模拟了 CPU 飙升,随后 SRE Agent 通过读取 Azure 资源数据、指标和活动信号执行了调查。
## 2. 架构
```
User Browser
|
| HTTP
v
Public IP
|
v
Ubuntu VM: vm-sre-demo
|
v
Nginx Web Server
|
v
Azure Monitor Metrics
|
v
Azure Managed Grafana
|
v
Azure SRE Agent
|
v
Investigation Summary + Probable Root Cause + Recommended Actions
```
### 使用的 Azure 资源
| 资源 | 用途 |
|---|---|
| Azure SRE Agent | AI 辅助的 SRE 调查和事故分析 |
| Azure Managed Grafana | Azure Monitor 指标的可视化 |
| Managed Identity | Azure 资源使用的安全标识,无需存储机密 |
| Ubuntu VM | 项目的真实工作负载 |
| Nginx | 在 VM 上运行的简单 Web 服务器 |
| Public IP | 允许通过浏览器访问 Nginx 页面 |
| Network Security Group | 允许/控制入站 HTTP 流量 |
| Virtual Network/Subnet | VM 的网络基础 |
| Azure Monitor | 存储并公开 VM 指标,例如 CPU 百分比 |
| Azure Resource Graph | 帮助查询 Azure 资源和元数据 |
| RBAC | 控制用户、Grafana 和 SRE Agent 托管标识的访问权限 |
## 3. 本项目解决的问题
在生产环境中,当应用程序变慢或不可用时,Cloud 工程师和 SRE 团队通常需要手动检查:
- VM 状态
- CPU、内存、磁盘和网络指标
- 应用程序可用性
- 活动日志
- 最近的部署/更改事件
- Grafana 仪表盘
- Azure Monitor 指标
- 根本原因指示符
这种手动调查会增加平均恢复时间 (MTTR)。
本项目展示了 Azure SRE Agent 如何通过以下方式提供帮助:
- 查找受影响的资源
- 总结 VM 健康状况
- 检测 CPU 异常
- 将飙升与近期活动关联起来
- 建议可能的根本原因
- 推荐后续排查步骤
## 4. 真实用例
### 场景
托管在 VM 上的 Web 应用程序变慢。
### 调查流程
1. Nginx Web 服务器正在 Azure VM 上运行。
2. 有意启动一个高 CPU 进程。
3. Azure Monitor 捕获 CPU 指标。
4. Grafana 以图形方式显示 CPU 指标。
5. Azure SRE Agent 对 VM 进行调查。
6. Agent 识别出 CPU 飙升,并将其与最近的 `run-command` 活动关联起来。
7. CPU 进程被停止。
8. SRE Agent 总结事故和修复情况。
## 5. 优势
- 演示真实的 SRE 风格事故调查
- 使用真实的 Azure 资源,而非纸上谈兵
- 展示 Azure SRE Agent 的实际运行情况
- 将 Azure Managed Grafana 与 Azure Monitor 集成
- 模拟类似生产的 CPU 事故
- 加深对 RBAC、Managed Identity、Azure Monitor、Grafana 和故障排除的理解
- 提供带有截图的强有力的 GitHub 作品集证明
- 对 Azure Cloud 工程师、SRE、DevOps、平台工程师和监控岗位非常有用
## 6. 实践技能
- Azure SRE Agent
- Azure Managed Grafana
- Azure Monitor 指标
- Azure Resource Graph
- RBAC 和 Managed Identity
- VM 部署和故障排除
- Linux/Nginx 操作
- 事故模拟
- 根本原因分析
- Grafana 仪表盘
- Azure CLI
- Azure Developer CLI (`azd`)
- 生产级文档
## 7. 前置条件
所需工具:
- Git
- Azure CLI
- Azure Developer CLI (`azd`)
- Azure 订阅
- PowerShell
- 可通过浏览器访问 Azure Portal、Azure SRE Agent 和 Grafana
检查工具:
```
git --version
az version
azd version
```
## 8. 初始设置
```
### 项目 Workspace
```powershell
cd C:\Users\admin\Documents\Azure-SRE-Lab\azure-sre-agent-sandbox
### Azure 登录
```powershell
az login
azd auth login --tenant-id
az account set --subscription
```
### 创建 AZD 环境
```
azd env new sreagent-sbx
azd env set AZURE_LOCATION eastus2
azd env set AZURE_SUBSCRIPTION_ID
azd env get-values
```
### 注册所需的 Provider
```
az provider register --namespace Microsoft.App
az provider register --namespace Microsoft.Dashboard
az provider register --namespace Microsoft.ManagedIdentity
```
检查 Provider 注册状态:
```
az provider show --namespace Microsoft.App --query registrationState -o tsv
az provider show --namespace Microsoft.Dashboard --query registrationState -o tsv
az provider show --namespace Microsoft.ManagedIdentity --query registrationState -o tsv
```
预期输出:
```
Registered
Registered
Registered
```
### 验证 Bicep
```
az bicep build --file infra/main.bicep
```
## 9. 部署 Azure SRE Agent 沙盒
```
azd up
```
预期资源:
- Resource group
- Azure SRE Agent
- Azure Managed Grafana
- Managed Identity
- RBAC 分配
检查部署输出:
```
azd env get-values
```
有用的输出:
```
AZURE_ENV_NAME
AZURE_LOCATION
AZURE_RESOURCE_GROUP
AZURE_GRAFANA_ENDPOINT
AZURE_GRAFANA_MCP_ENDPOINT
AZURE_SRE_AGENT_NAME
AZURE_SRE_AGENT_ID
AZURE_USER_ASSIGNED_IDENTITY_ID
```
## 10. 验证 Azure 资源
```
az resource list -g rg-sreagent-sbx-sre --query "[].{Name:name,Type:type,Location:location}" -o table
```
预期的基础资源:
```
id-sreagent-sbx
amg-sreagent-sbx
sre-sreagent-sbx
```
添加 VM 后,将显示额外的资源:
```
vm-sre-demo
vm-sre-demoVMNic
Public IP
NSG
Disk
VNet
```
## 11. RBAC 配置
### 授予用户 SRE Agent 管理员权限
```
$objectId = az ad signed-in-user show --query id -o tsv
$sreAgentId = "/subscriptions//resourceGroups/rg-sreagent-sbx-sre/providers/Microsoft.App/agents/sre-sreagent-sbx"
az role assignment create `
--assignee $objectId `
--role "SRE Agent Administrator" `
--scope $sreAgentId
```
### 授予 SRE Agent 托管标识 Reader 权限
```
$agentPrincipalId = az identity show `
--resource-group rg-sreagent-sbx-sre `
--name id-sreagent-sbx `
--query principalId `
-o tsv
az role assignment create `
--assignee-object-id $agentPrincipalId `
--assignee-principal-type ServicePrincipal `
--role "Reader" `
--scope "/subscriptions/"
```
### 授予用户 Grafana Admin 权限
```
$objectId = az ad signed-in-user show --query id -o tsv
$grafanaId = "/subscriptions//resourceGroups/rg-sreagent-sbx-sre/providers/Microsoft.Dashboard/grafana/amg-sreagent-sbx"
az role assignment create `
--assignee $objectId `
--role "Grafana Admin" `
--scope $grafanaId
```
### 授予 Grafana 读取 Azure Monitor 指标的权限
```
$grafanaPrincipalId = az resource show `
--ids "/subscriptions//resourceGroups/rg-sreagent-sbx-sre/providers/Microsoft.Dashboard/grafana/amg-sreagent-sbx" `
--query identity.principalId `
-o tsv
az role assignment create `
--assignee-object-id $grafanaPrincipalId `
--assignee-principal-type ServicePrincipal `
--role "Monitoring Reader" `
--scope "/subscriptions//resourceGroups/rg-sreagent-sbx-sre"
az role assignment create `
--assignee-object-id $grafanaPrincipalId `
--assignee-principal-type ServicePrincipal `
--role "Reader" `
--scope "/subscriptions//resourceGroups/rg-sreagent-sbx-sre"
```
## 12. 创建演示 VM 工作负载
### 创建 Ubuntu VM
```
az vm create `
--resource-group rg-sreagent-sbx-sre `
--name vm-sre-demo `
--image Ubuntu2204 `
--admin-username azureuser `
--generate-ssh-keys `
--size Standard_B1s
```
### 开放 HTTP 端口 80
```
az vm open-port `
--resource-group rg-sreagent-sbx-sre `
--name vm-sre-demo `
--port 80 `
--priority 100
```
### 安装 Nginx
```
az vm run-command invoke `
--resource-group rg-sreagent-sbx-sre `
--name vm-sre-demo `
--command-id RunShellScript `
--scripts "sudo apt update && sudo apt install nginx -y && sudo systemctl enable nginx && sudo systemctl start nginx"
```
### 获取 Public IP
```
az vm show `
--resource-group rg-sreagent-sbx-sre `
--name vm-sre-demo `
-d `
--query publicIps `
-o tsv
```
在浏览器中打开:
```
http://
```
预期输出:
```
Welcome to nginx!
```
## 13. 从 PowerShell 验证 VM 和 Nginx
### VM 状态
```
az vm show `
--resource-group rg-sreagent-sbx-sre `
--name vm-sre-demo `
-d `
--query "{Name:name,PowerState:powerState,PublicIP:publicIps,Location:location}" `
-o table
```
### Nginx 状态
```
az vm run-command invoke `
--resource-group rg-sreagent-sbx-sre `
--name vm-sre-demo `
--command-id RunShellScript `
--scripts "systemctl is-active nginx && curl -I http://localhost"
```
预期结果:
```
active
HTTP/1.1 200 OK
```
## 14. 使用的 Azure SRE Agent 提示词
打开 Azure SRE Agent:
```
https://sre.azure.com
```
选择:
```
sre-sreagent-sbx
```
### 提示词 1:资源发现
```
What Azure resources are available in this SRE Agent environment?
```
### 提示词 2:VM 发现
```
Can you identify the VM named vm-sre-demo and summarize its current status?
```
### 提示词 3:Resource Group 摘要
```
What resources are currently deployed in rg-sreagent-sbx-sre?
```
### 提示词 4:CPU 调查
```
Investigate the VM named vm-sre-demo. Check if there is any recent CPU or performance issue and summarize the possible root cause.
```
### 提示词 5:指标和活动检查
```
Check recent metrics and activity for vm-sre-demo and suggest next troubleshooting steps.
```
### 提示词 6:修复摘要
```
The high CPU process has been stopped. Can you summarize the incident, probable root cause, impact, and remediation?
```
## 15. 模拟高 CPU 事故
启动高 CPU 进程:
```
az vm run-command invoke `
--resource-group rg-sreagent-sbx-sre `
--name vm-sre-demo `
--command-id RunShellScript `
--scripts "yes > /dev/null &"
```
等待 5-10 分钟,以便 Azure Monitor 指标显示。
从 Azure Monitor 检查 CPU 指标:
```
az monitor metrics list `
--resource "/subscriptions//resourceGroups/rg-sreagent-sbx-sre/providers/Microsoft.Compute/virtualMachines/vm-sre-demo" `
--metric "Percentage CPU" `
--interval PT1M `
--aggregation Average `
--output table
```
停止高 CPU 进程:
```
az vm run-command invoke `
--resource-group rg-sreagent-sbx-sre `
--name vm-sre-demo `
--command-id RunShellScript `
--scripts "sudo pkill yes"
```
验证进程是否已停止:
```
az vm run-command invoke `
--resource-group rg-sreagent-sbx-sre `
--name vm-sre-demo `
--command-id RunShellScript `
--scripts "pgrep yes || echo 'No high CPU yes process running'"
```
预期输出:
```
No high CPU yes process running
```
## 16. Grafana 集成步骤
使用以下命令的输出端点打开 Grafana:
```
azd env get-values
```
### 检查 Azure Monitor 数据源的 GUI 步骤
1. 打开 Azure Managed Grafana。
2. 转到 **Connections**。
3. 点击 **Data sources**。
4. 打开 **Azure Monitor**。
5. 确认数据源可用。
### 查看 VM CPU 指标的 GUI 步骤
1. 转到 **Explore**。
2. 选择 **Azure Monitor** 作为数据源。
3. 选择 **Service: Metrics**。
4. 选择 VM 资源:
- Subscription:CloudMastery
- Resource Group:`rg-sreagent-sbx-sre`
- Resource Type:`Microsoft.Compute/virtualMachines`
- Resource:`vm-sre-demo`
5. 选择指标 namespace:
- `microsoft.compute/virtualmachines`
6. 选择指标:
- `Percentage CPU`
7. 选择聚合方式:
- `Average`
8. 设置时间范围:
- 过去 30 分钟或过去 1 小时
9. 点击 **Run query**。
### 创建仪表盘的 GUI 步骤
1. 转到 **Dashboards**。
2. 点击 **New Dashboard**。
3. 点击 **Add visualization**。
4. 选择 **Azure Monitor**。
5. 使用:
- Resource:`vm-sre-demo`
- Metric:`Percentage CPU`
- Aggregation:`Average`
6. 设置面板标题:
```
VM CPU Utilization - vm-sre-demo
```
7. 将仪表盘保存为:
```
Azure SRE VM Monitoring Dashboard
```
## 17. 截图
将所有截图存储在以下位置:
```
screenshots/
```
推荐的截图命名方式:
```
01-azure-resource-group-overview.png
02-azure-sre-agent-resource.png
03-azure-managed-grafana-resource.png
04-vm-sre-demo-overview.png
05-nginx-webserver-working.png
06-sre-agent-vm-discovery.png
07-sre-agent-cpu-spike-analysis.png
08-sre-agent-root-cause-analysis.png
09-sre-agent-recommended-next-steps.png
10-sre-agent-remediation-summary.png
11-grafana-azure-monitor-datasource.png
12-grafana-vm-cpu-metric.png
13-grafana-vm-cpu-dashboard.png
14-powershell-azd-deployment-success.png
15-powershell-azd-env-values.png
16-powershell-resource-list.png
17-powershell-vm-public-ip.png
18-powershell-nginx-status.png
19-powershell-high-cpu-simulation.png
20-powershell-azure-monitor-cpu-metric.png
21-powershell-stop-high-cpu-process.png
22-powershell-verify-cpu-process-stopped.png
23-powershell-cleanup-azd-down.png
24-powershell-resource-group-deleted.png
```
### 截图库
## | 步骤 | 截图 |
|---|---|
| Azure Resource Group | 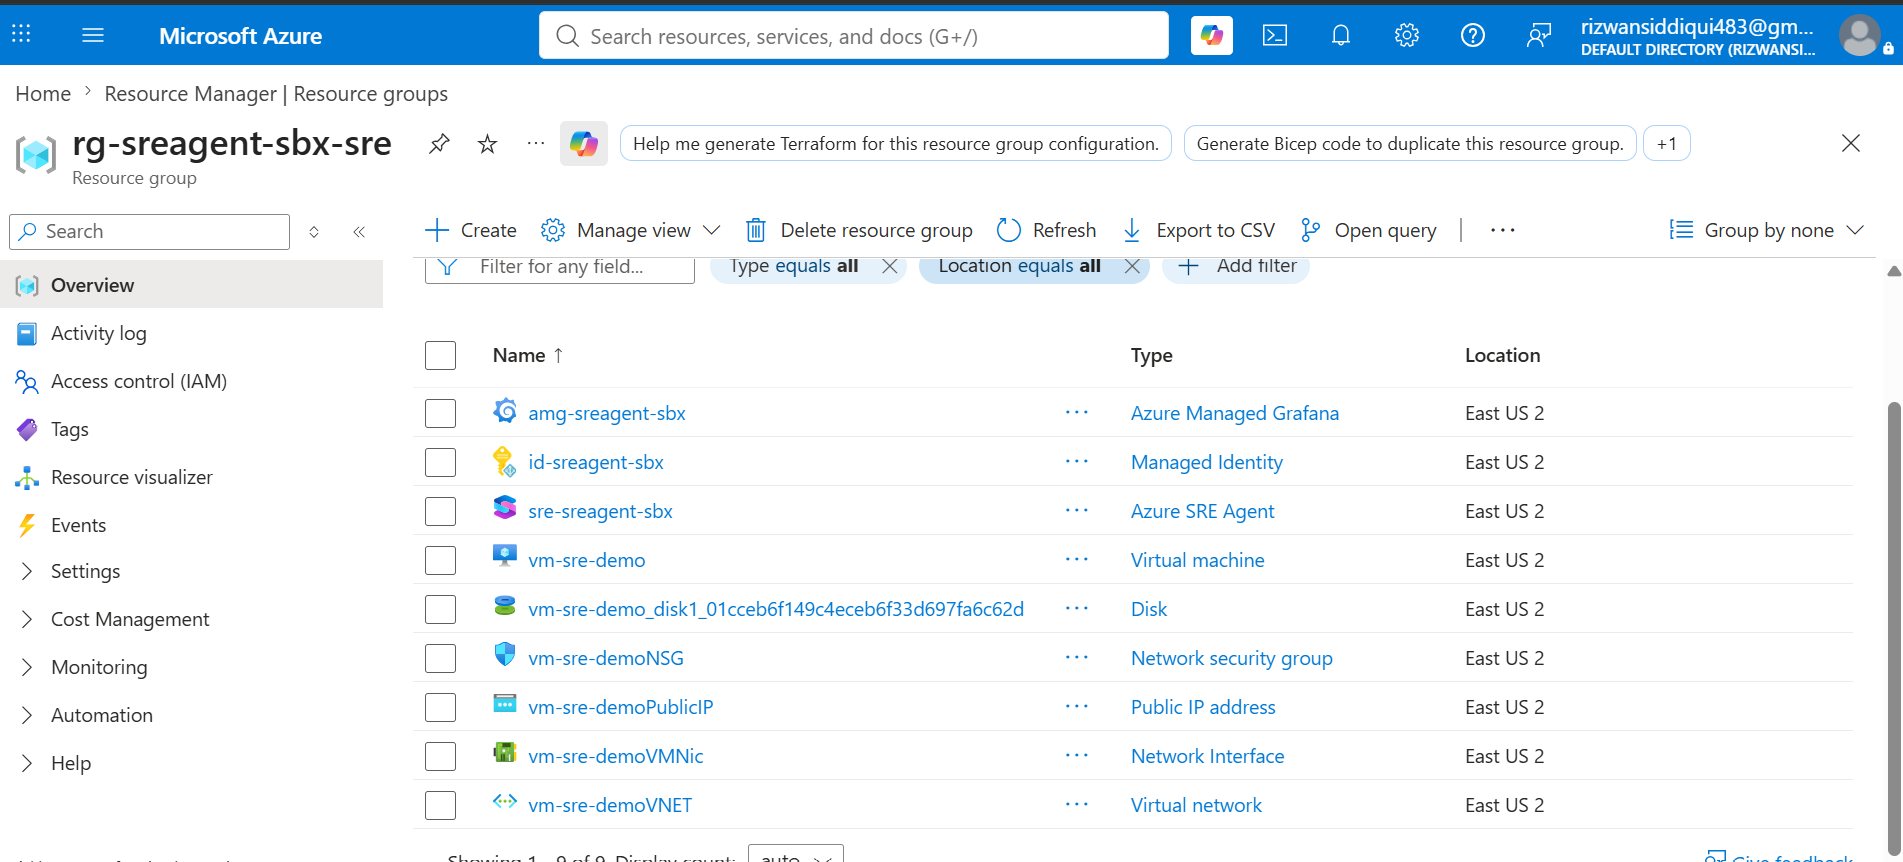 |
| Azure SRE Agent Resource | 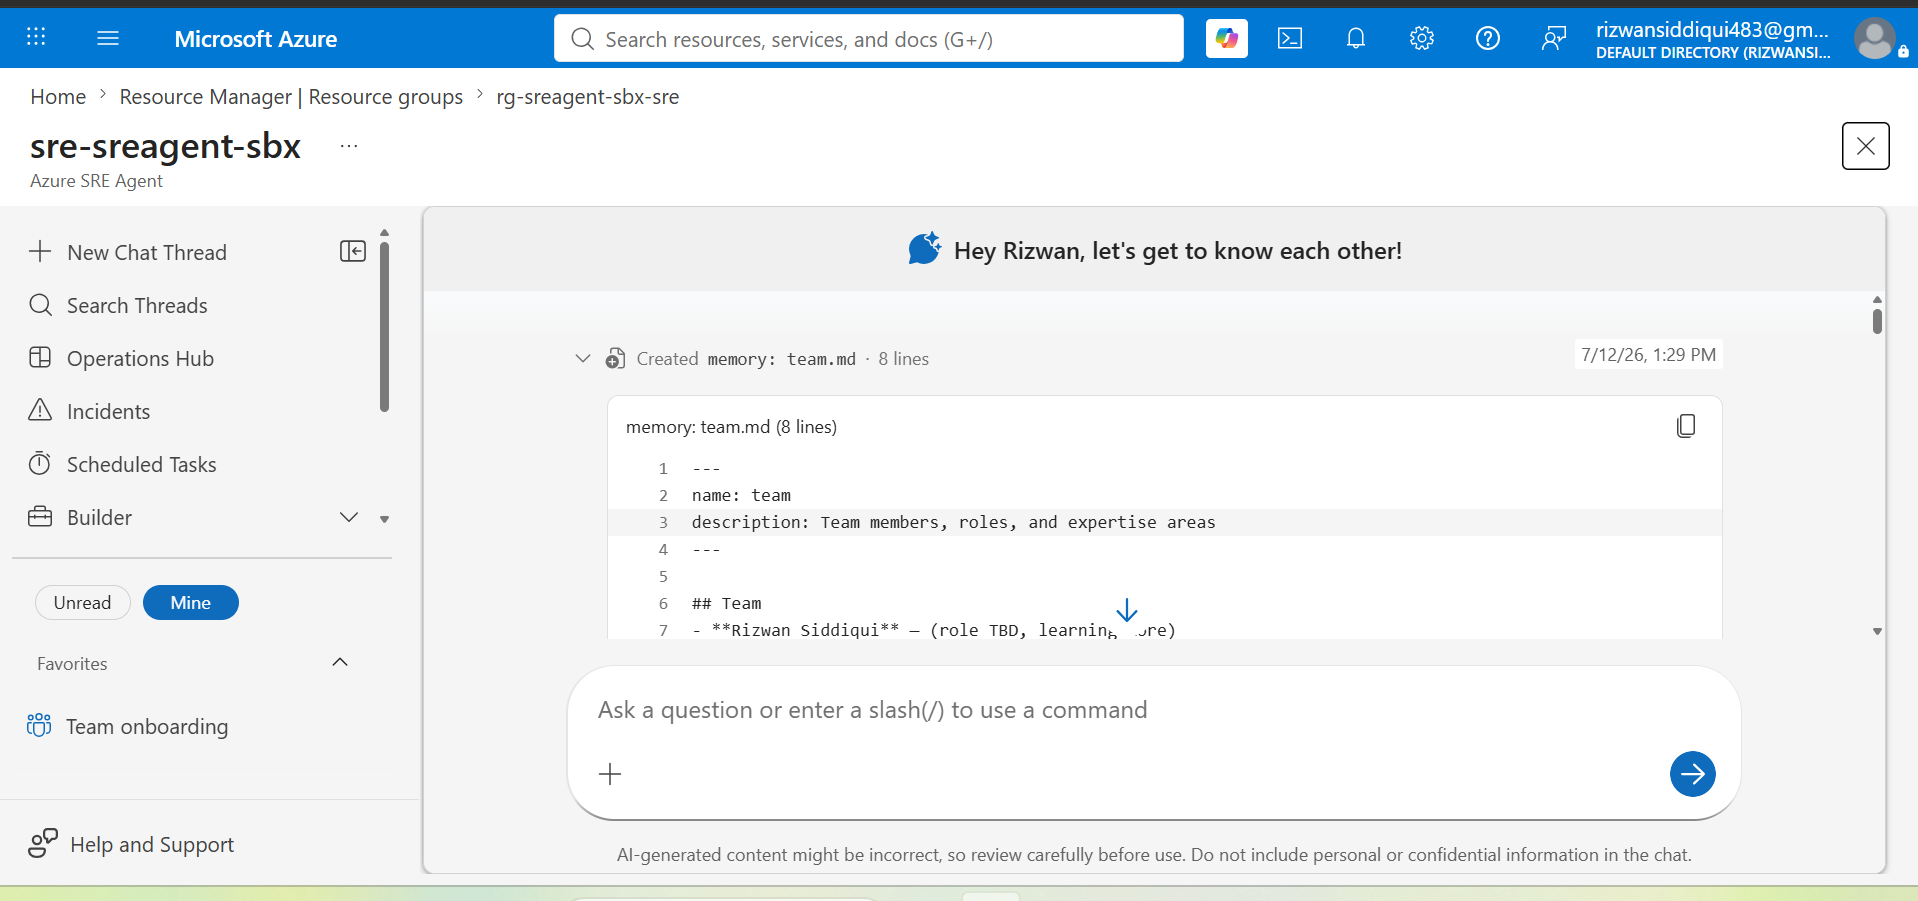 |
| Azure Managed Grafana Resource | 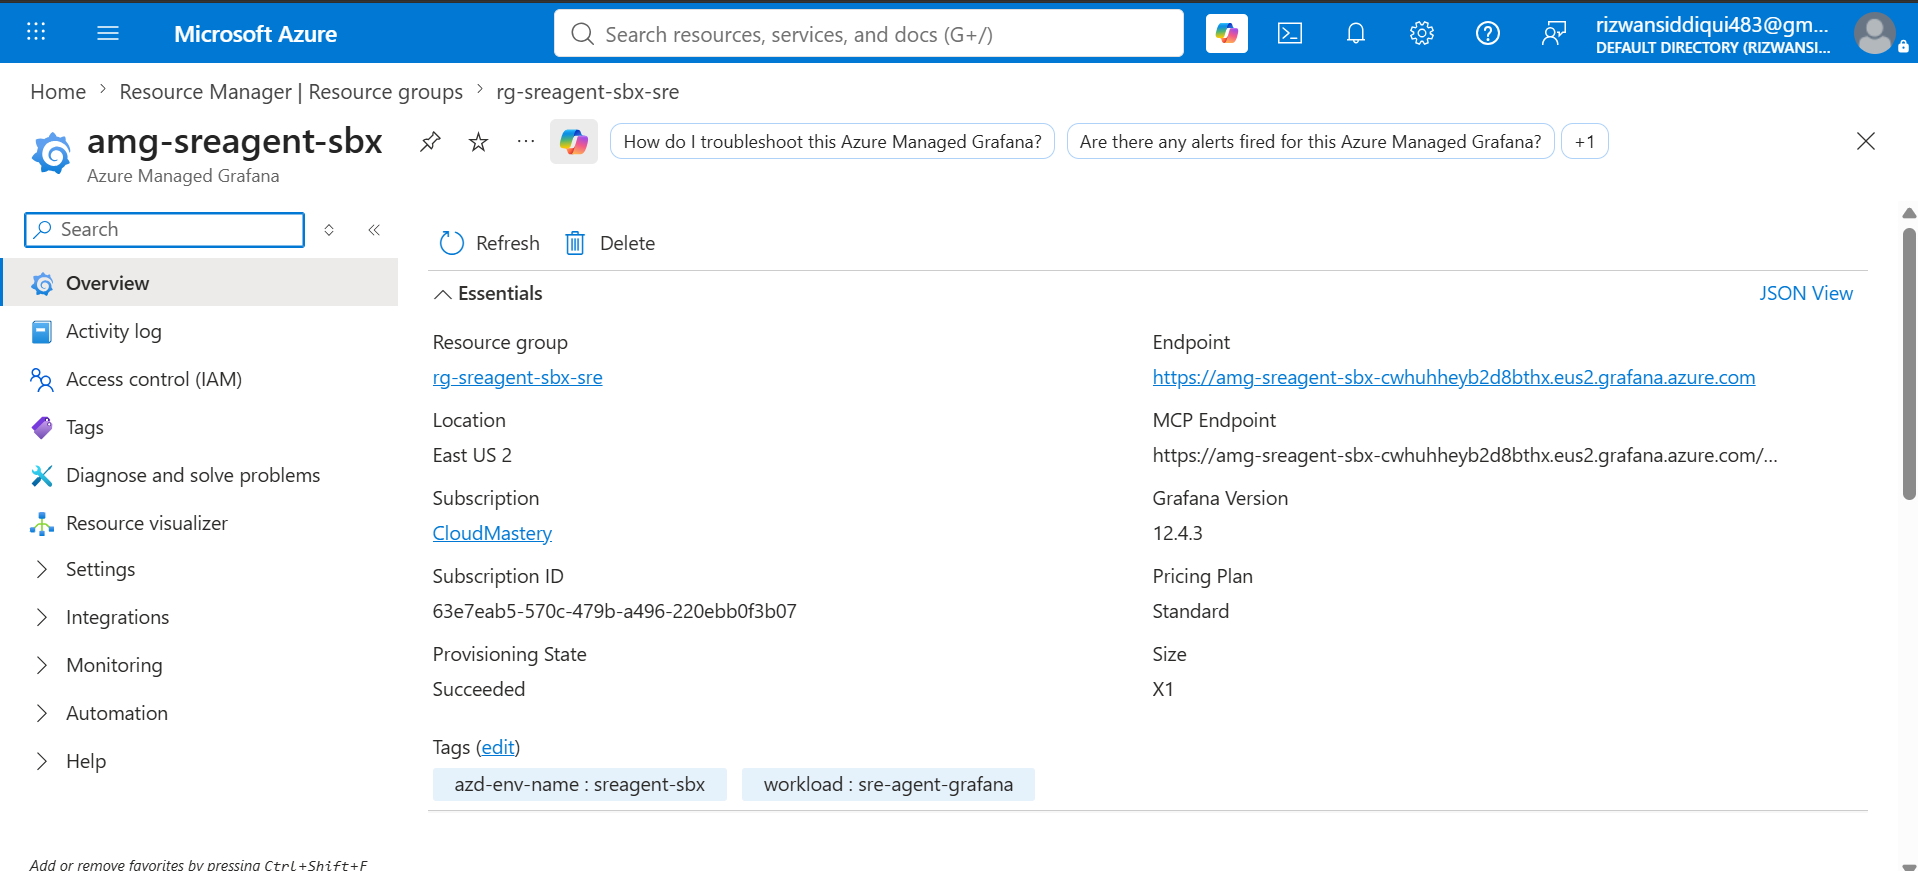 |
| Nginx Web 服务器 | 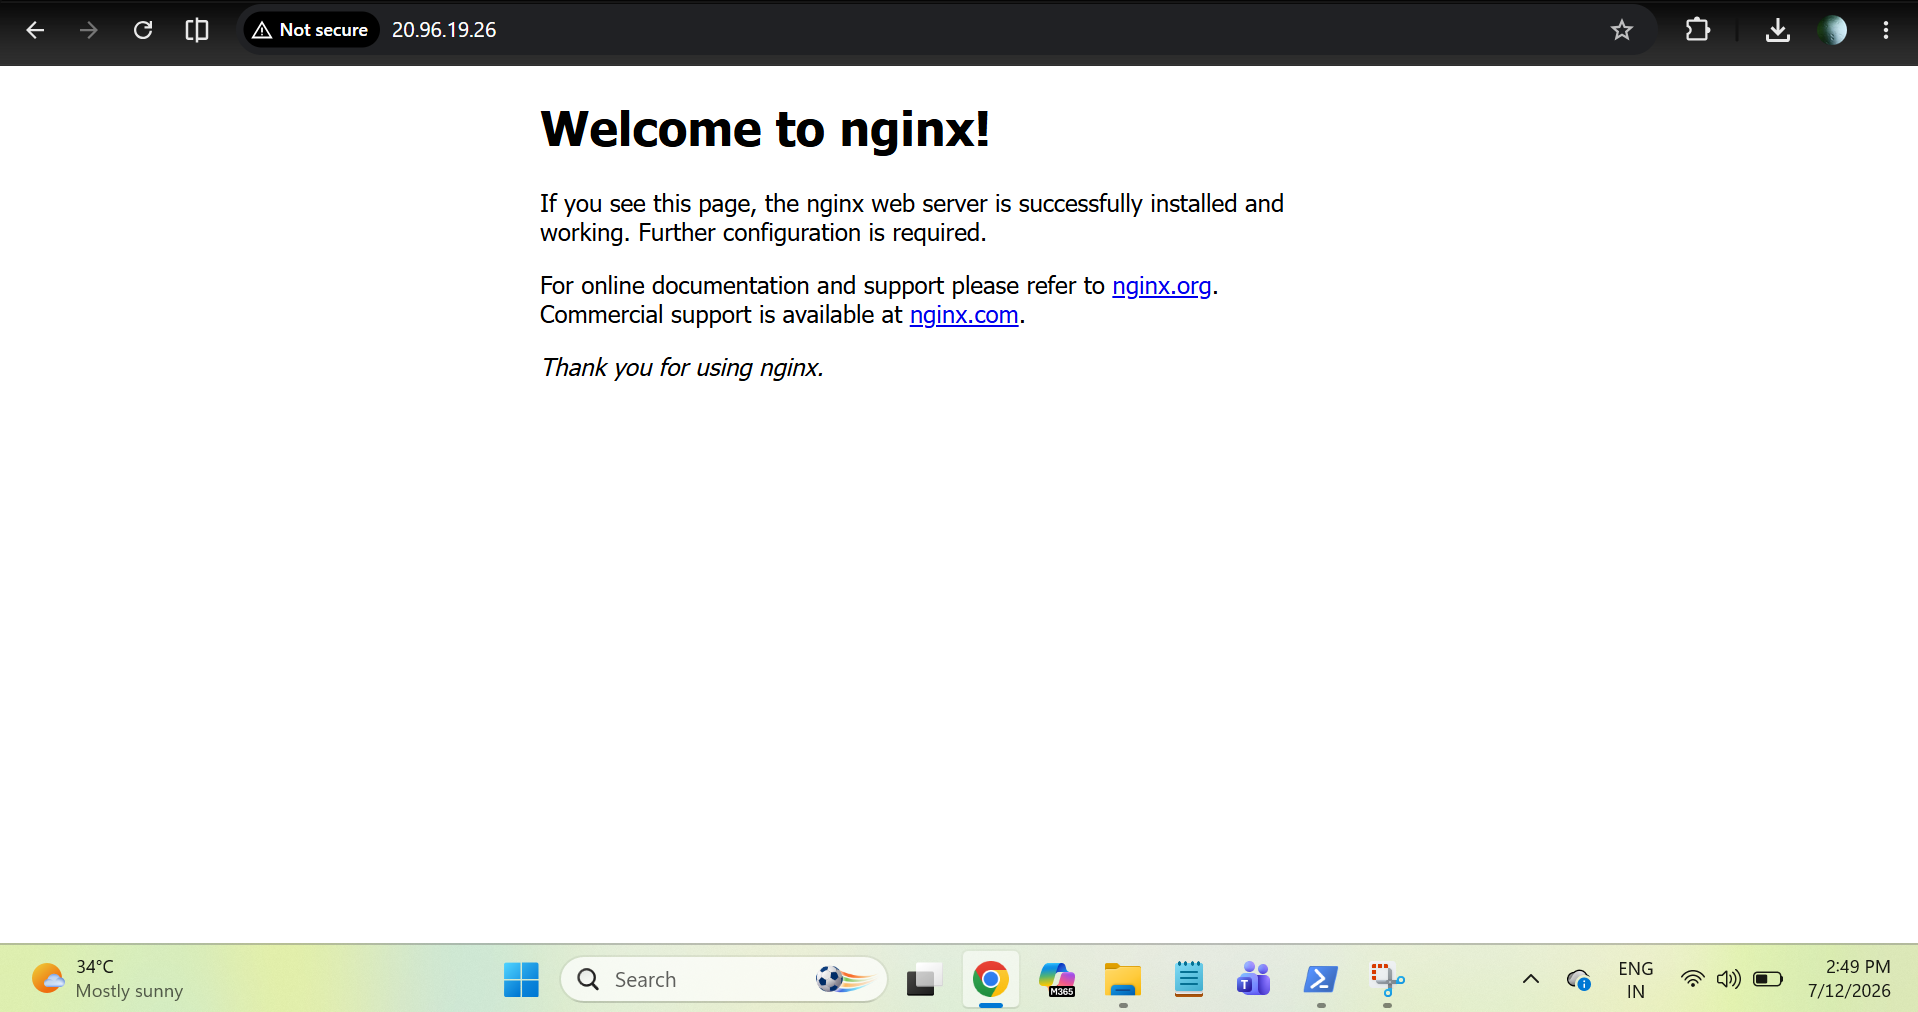 |
| SRE Agent VM 发现 | 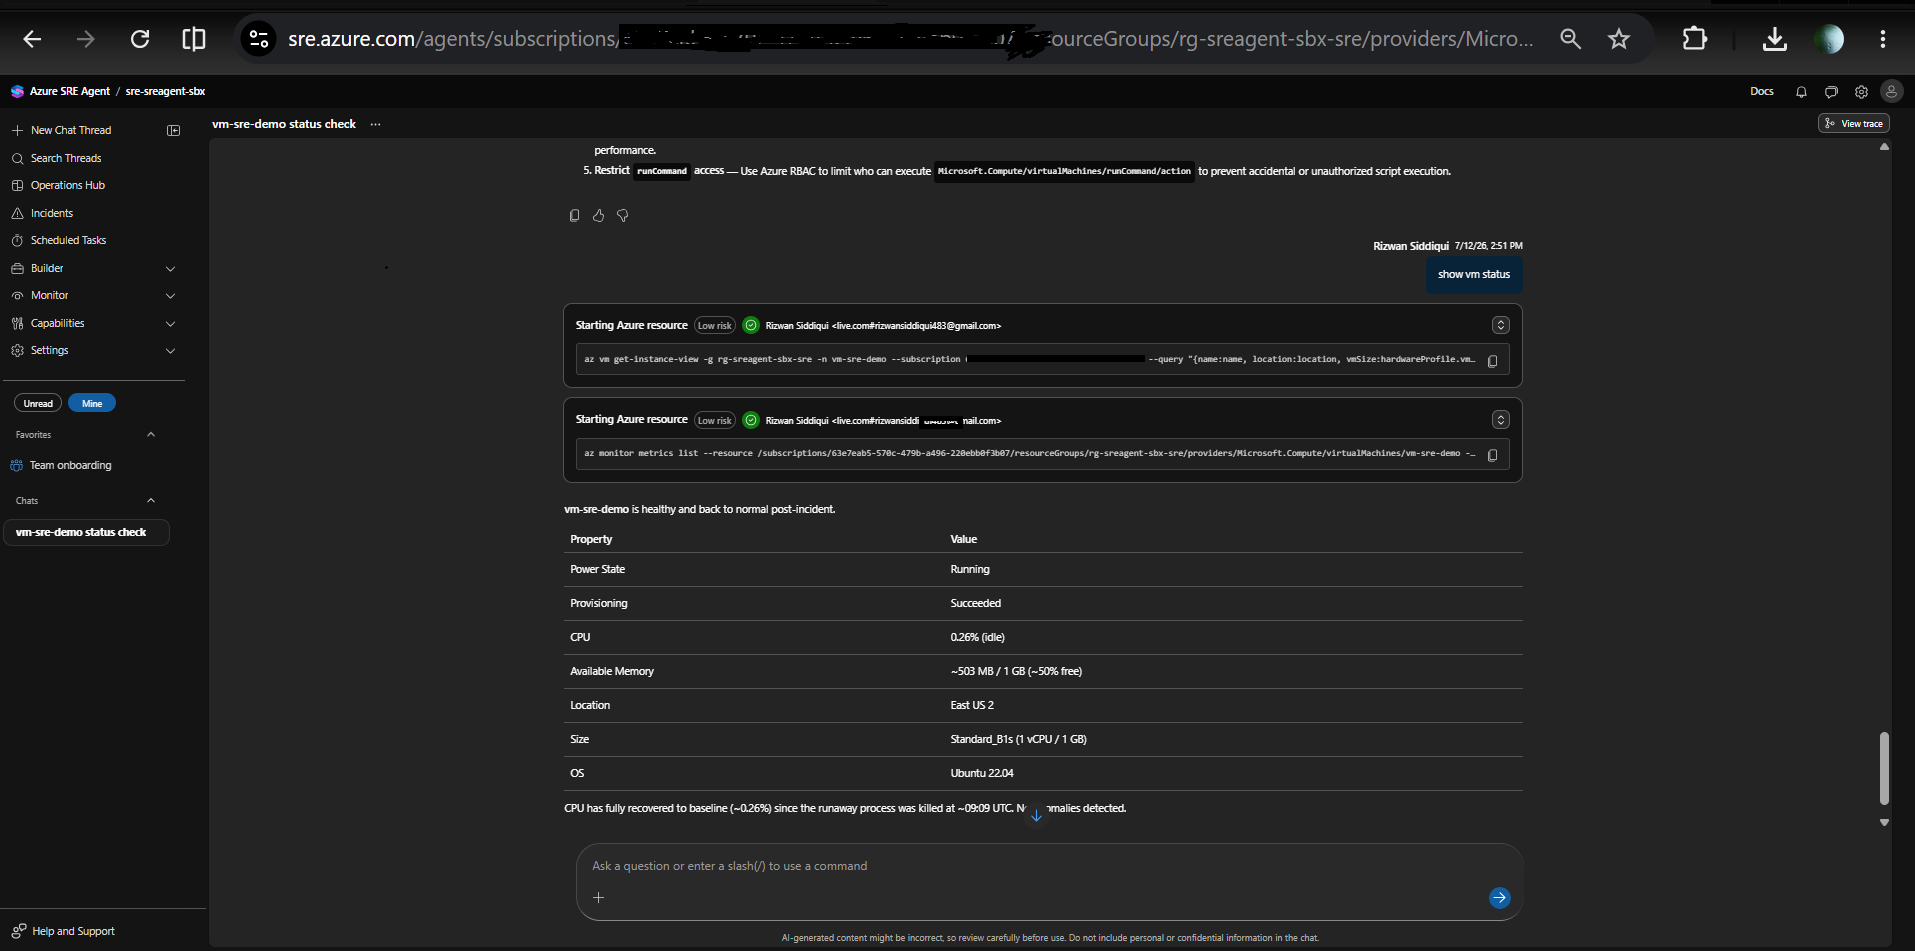 |
| SRE Agent CPU 飙升分析 | 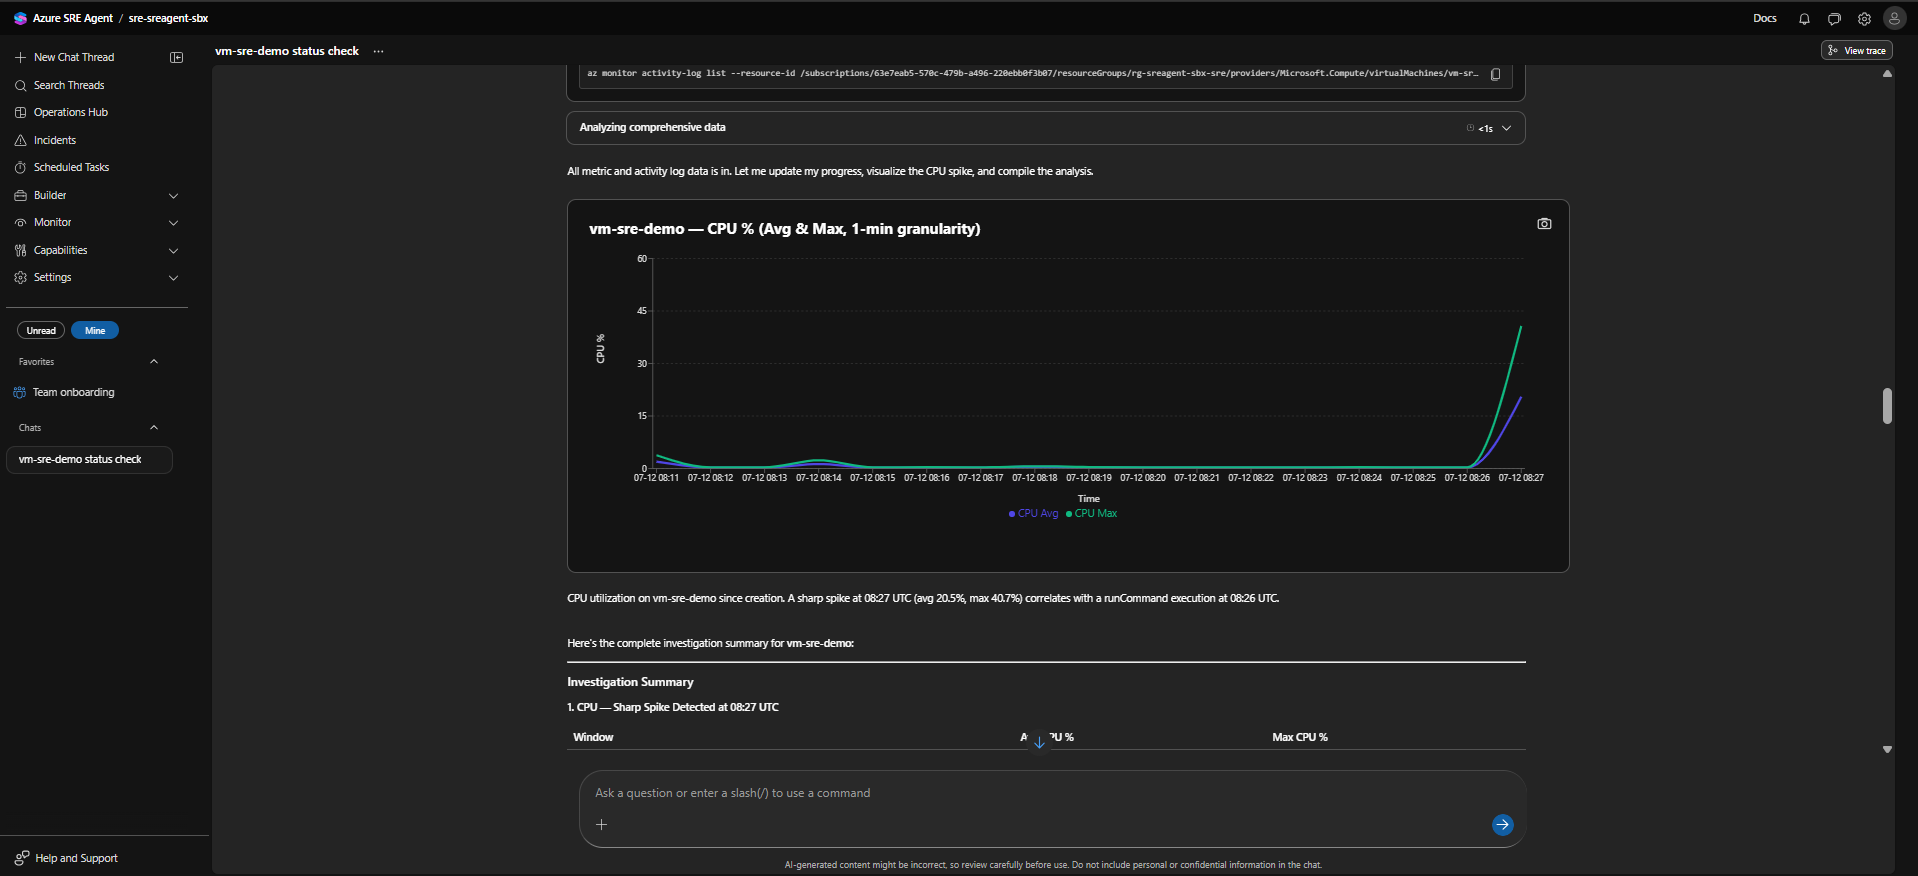 |
| SRE Agent 推荐的后续步骤 | 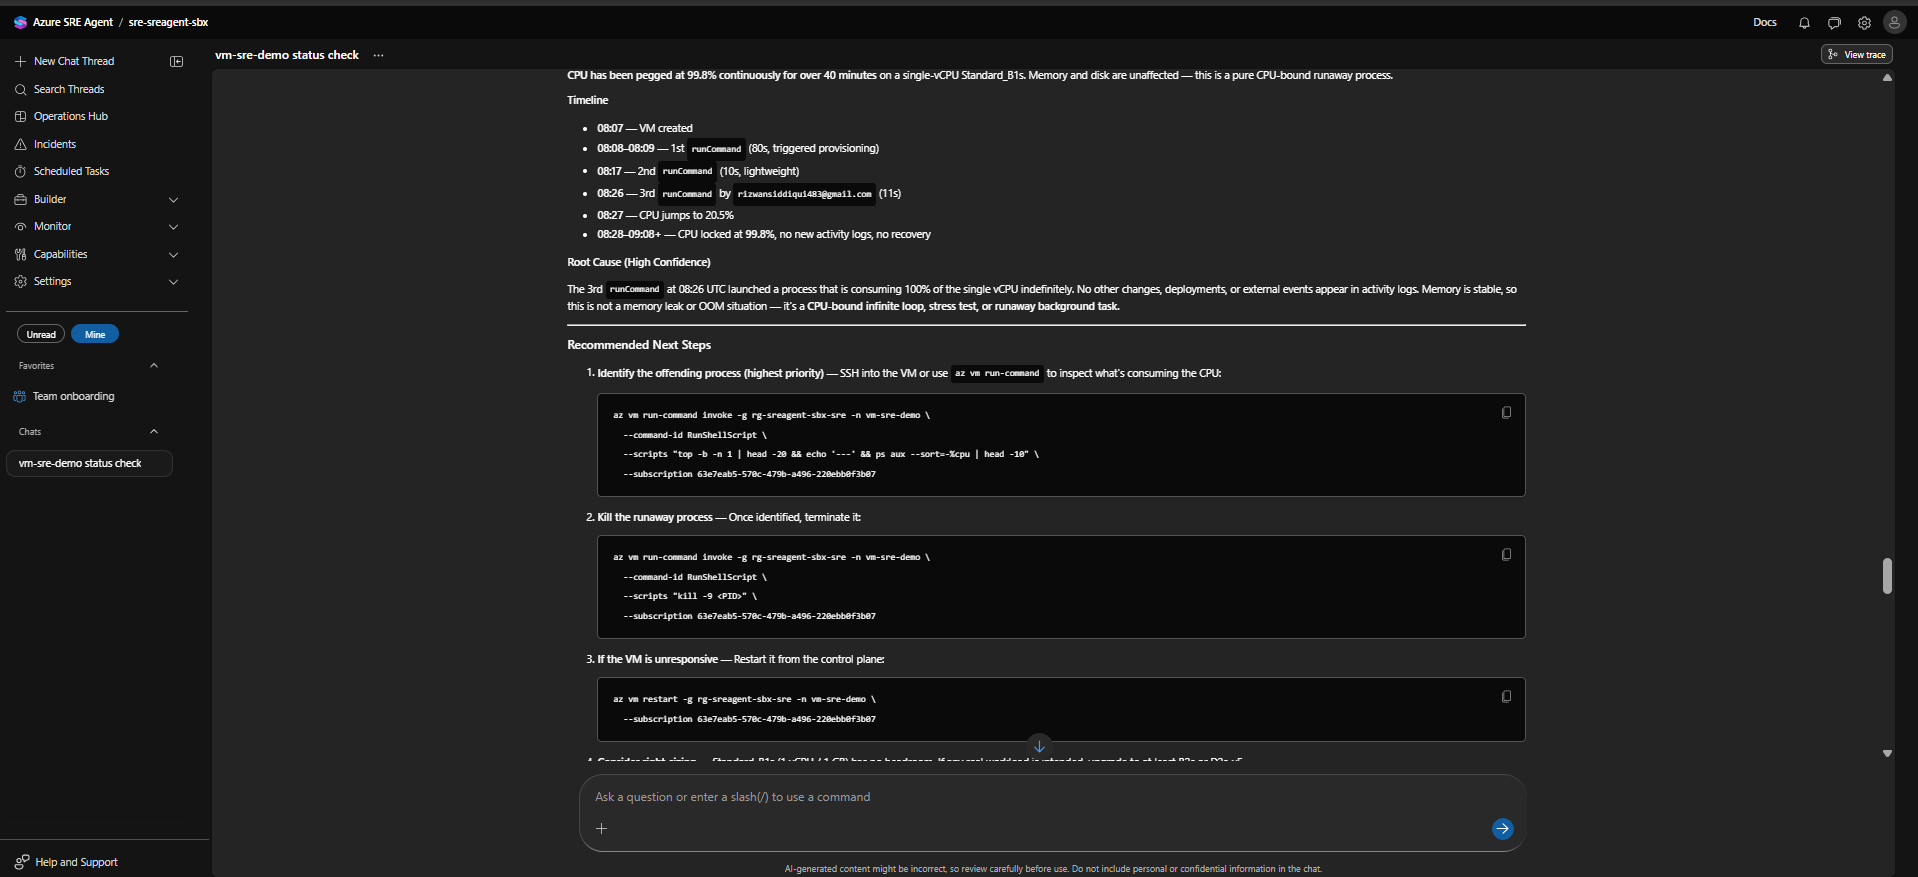 |
| SRE Agent 修复摘要 | 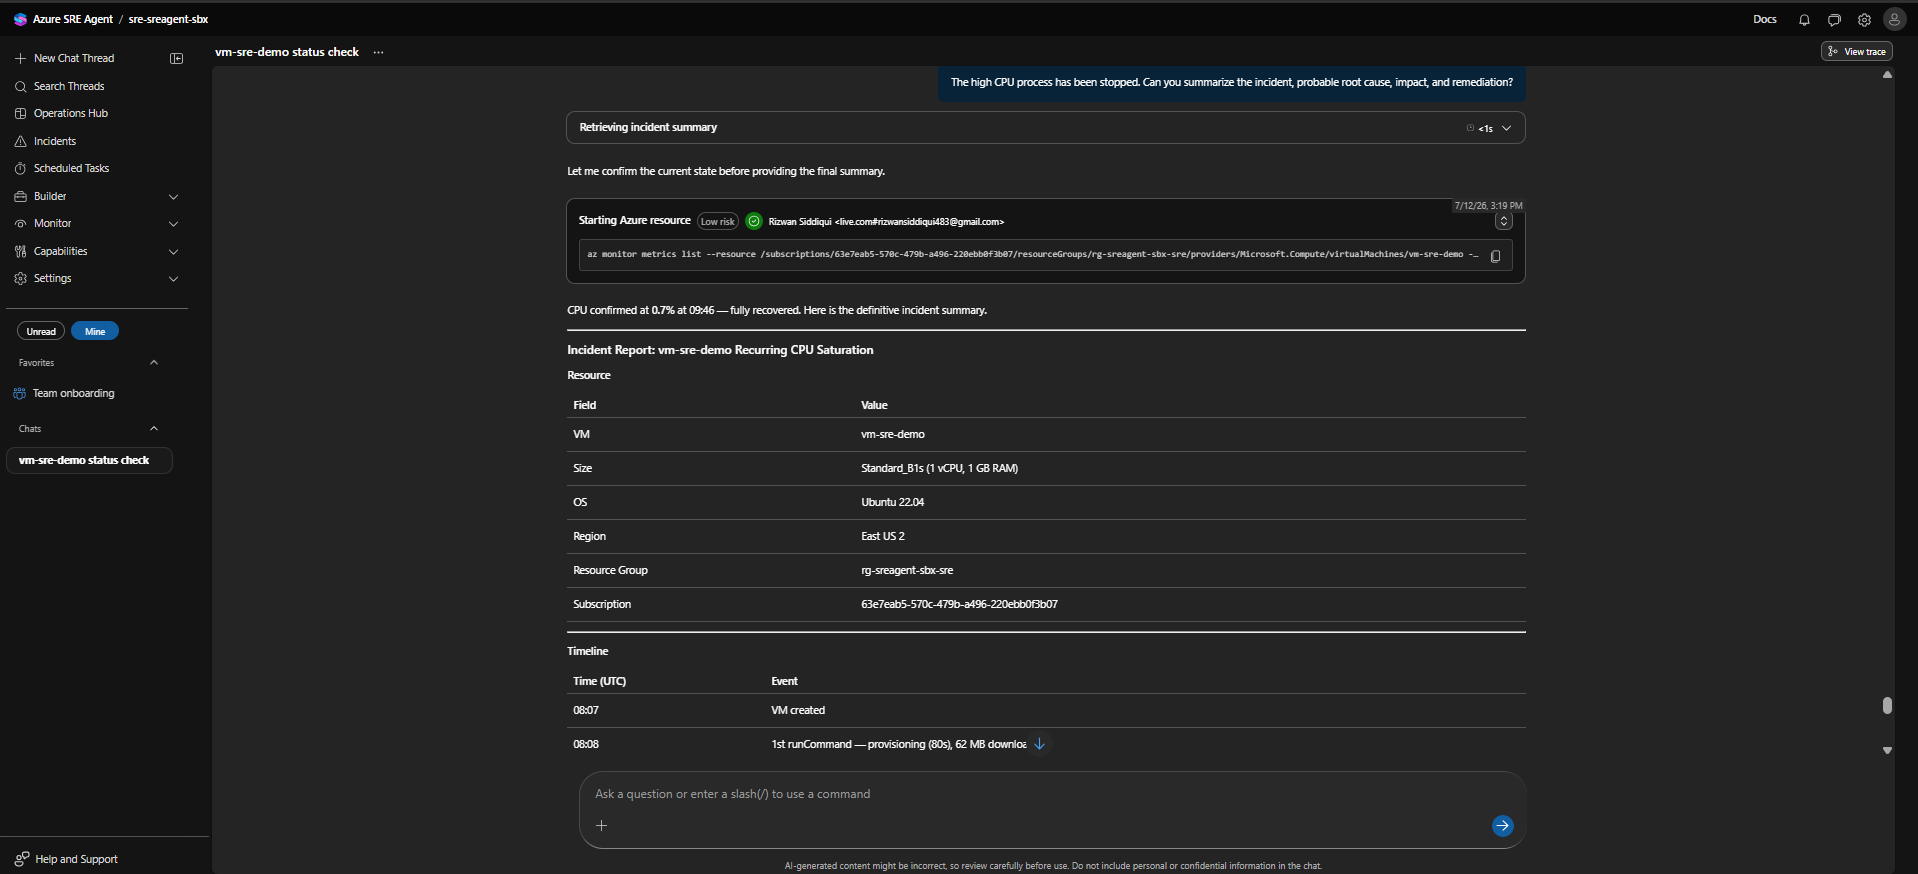 |
| Grafana CPU 指标 | 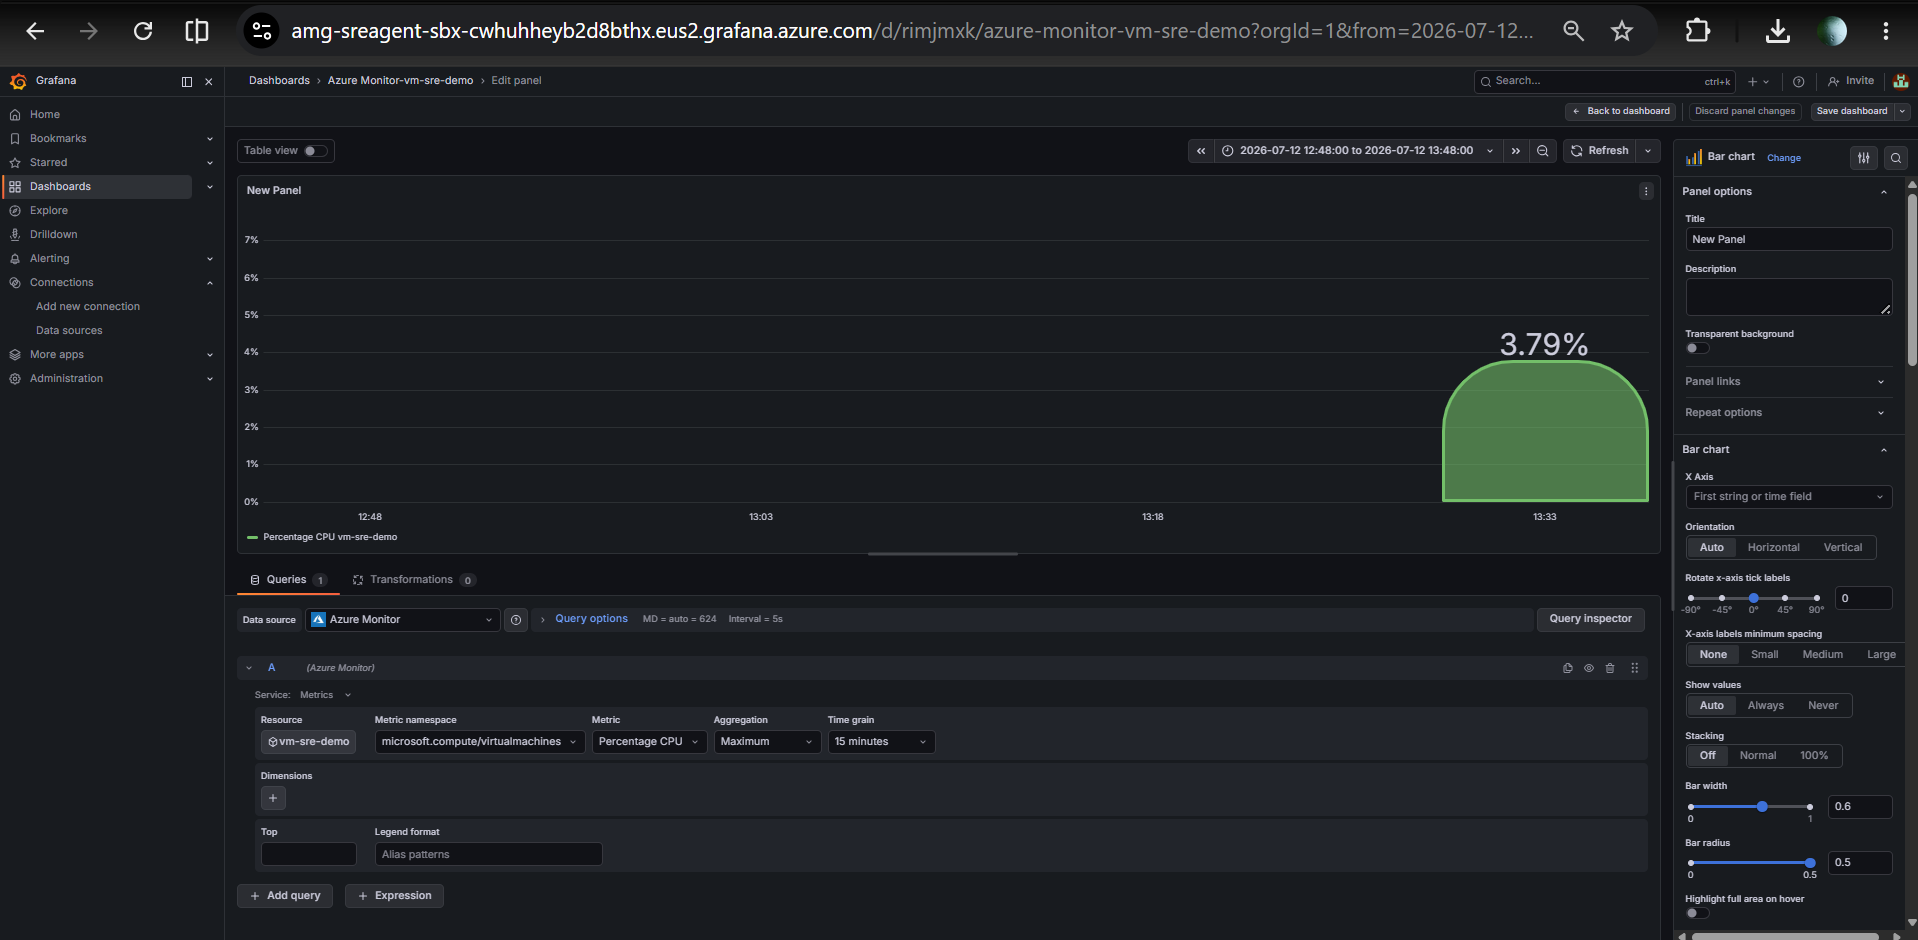 |
| Grafana CPU 平均值和最大值图表 | 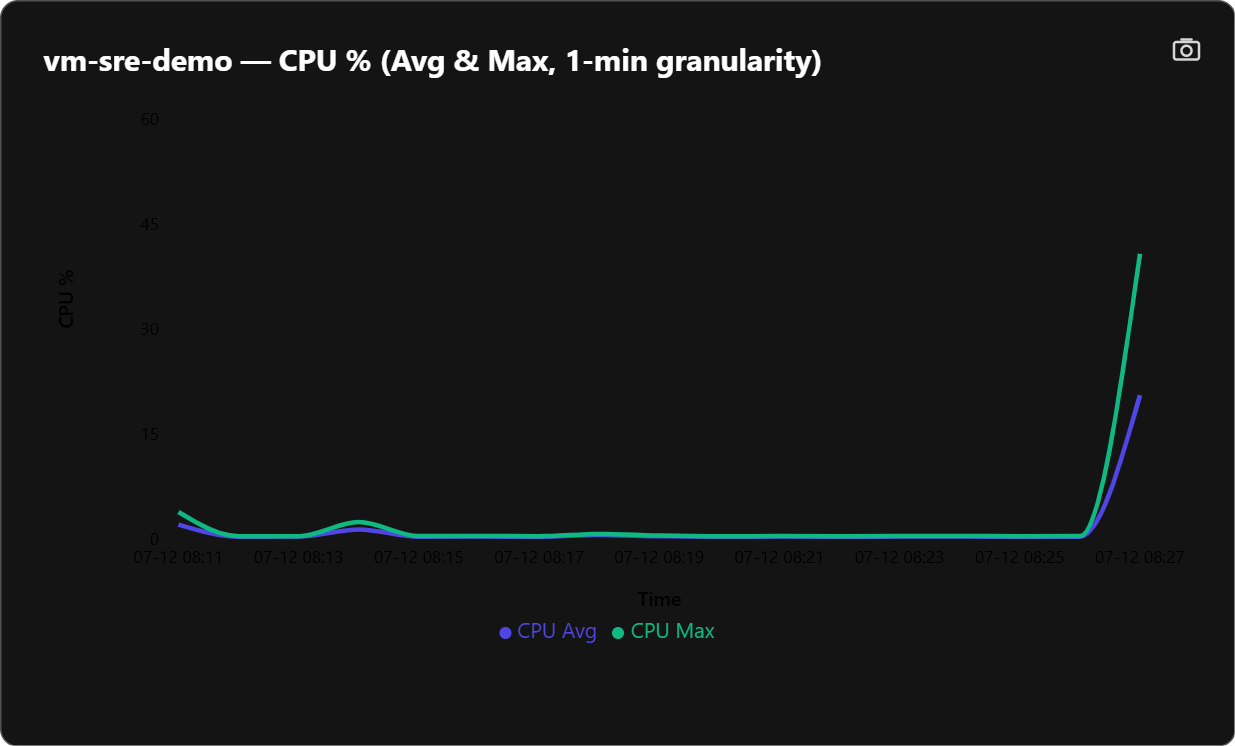 |
| Grafana CPU 完整时间线 | 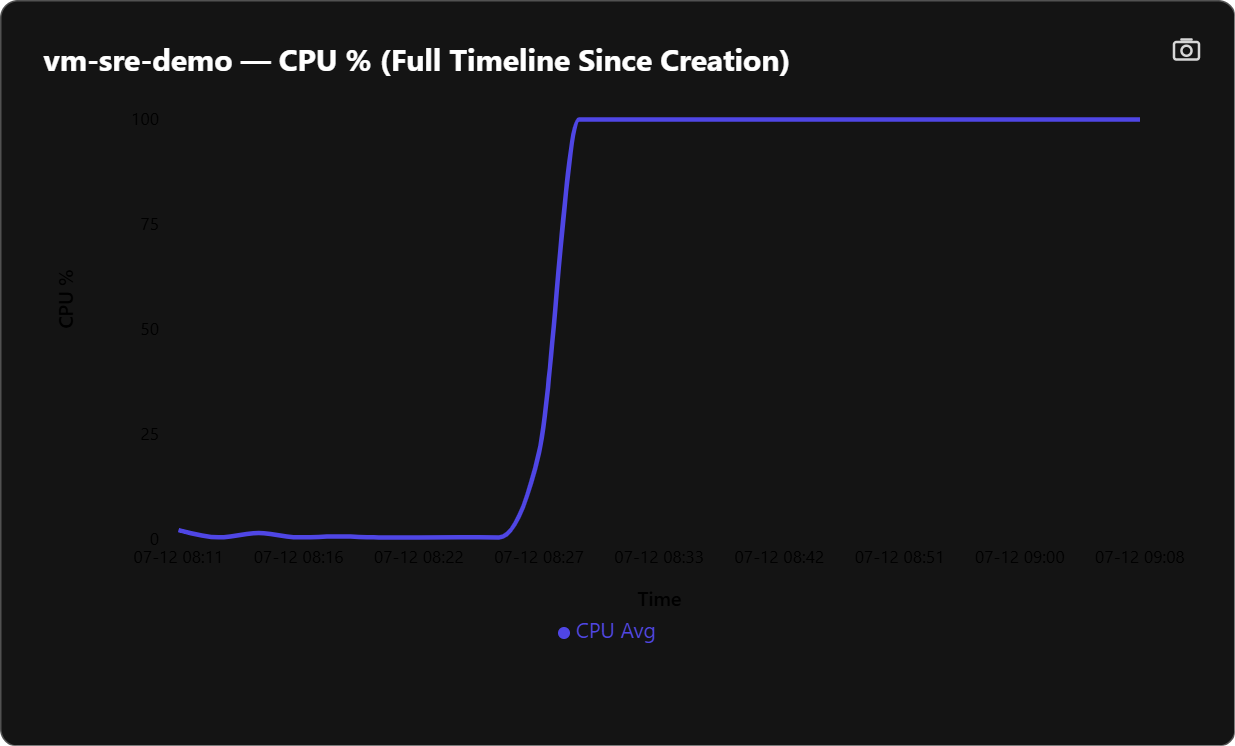 |
| PowerShell AZD 环境变量 | 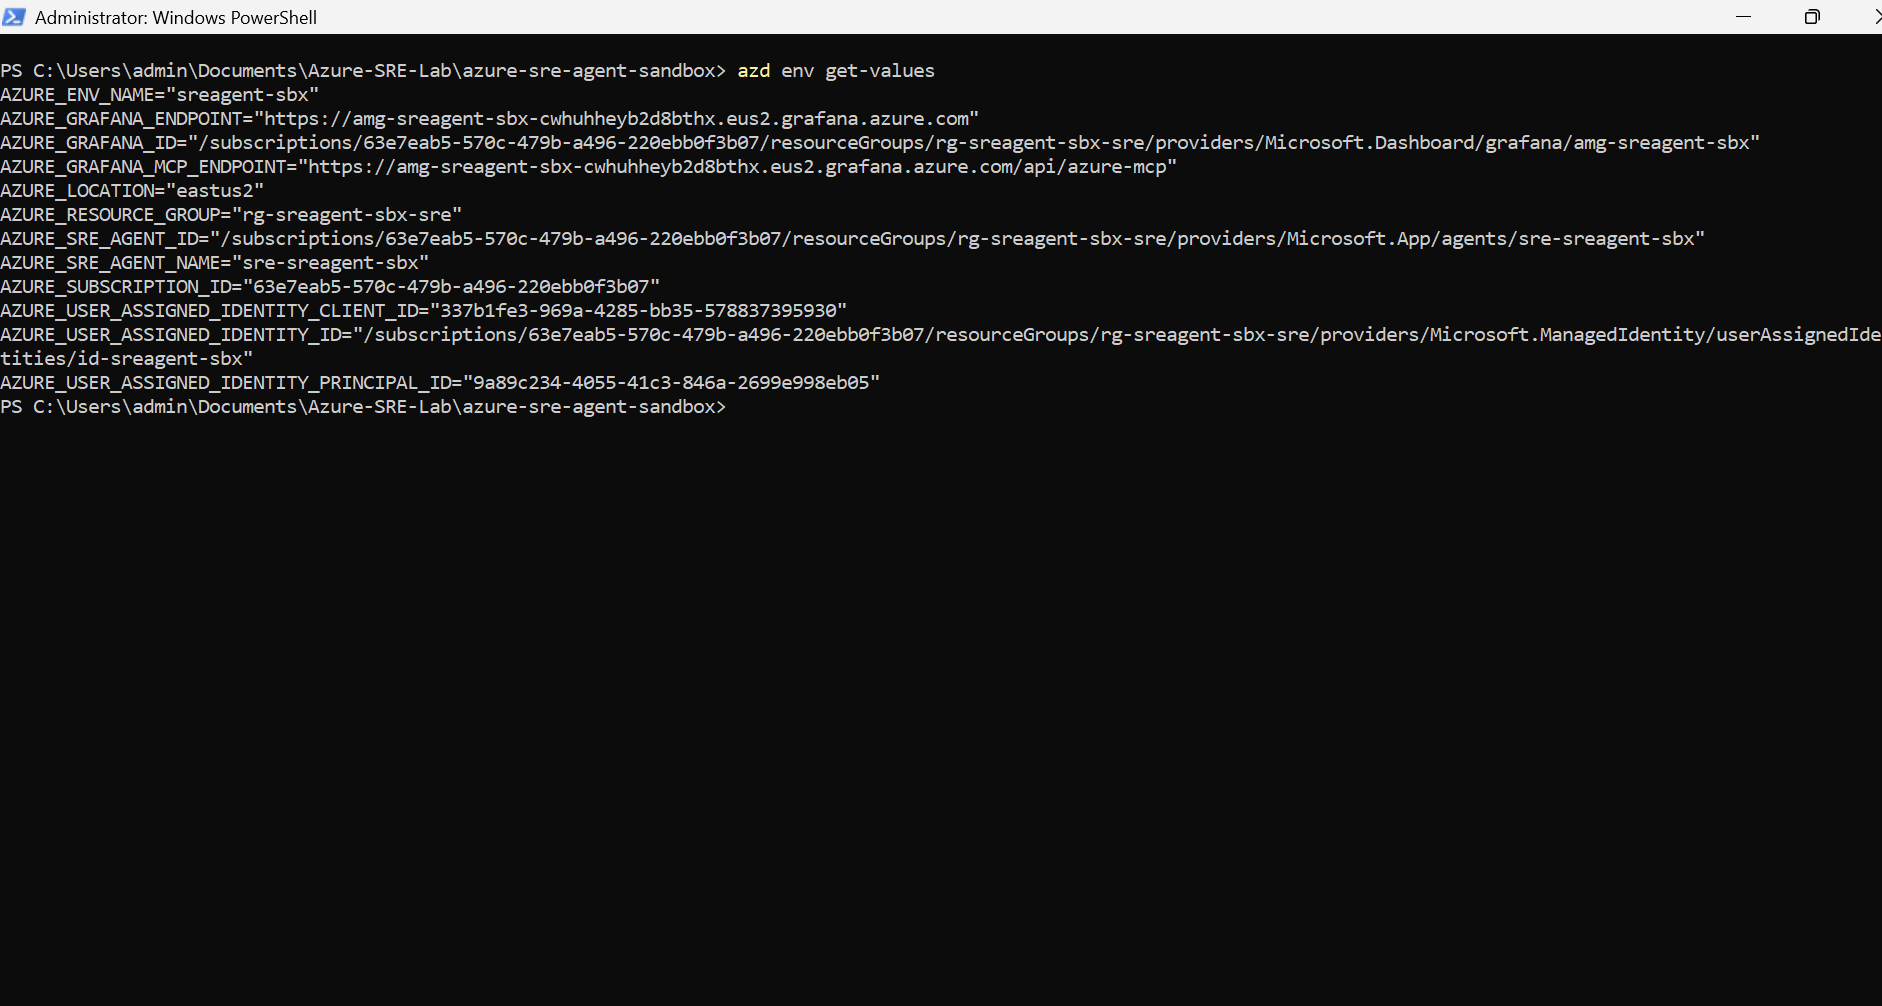 |
| PowerShell VM 公共 IP | 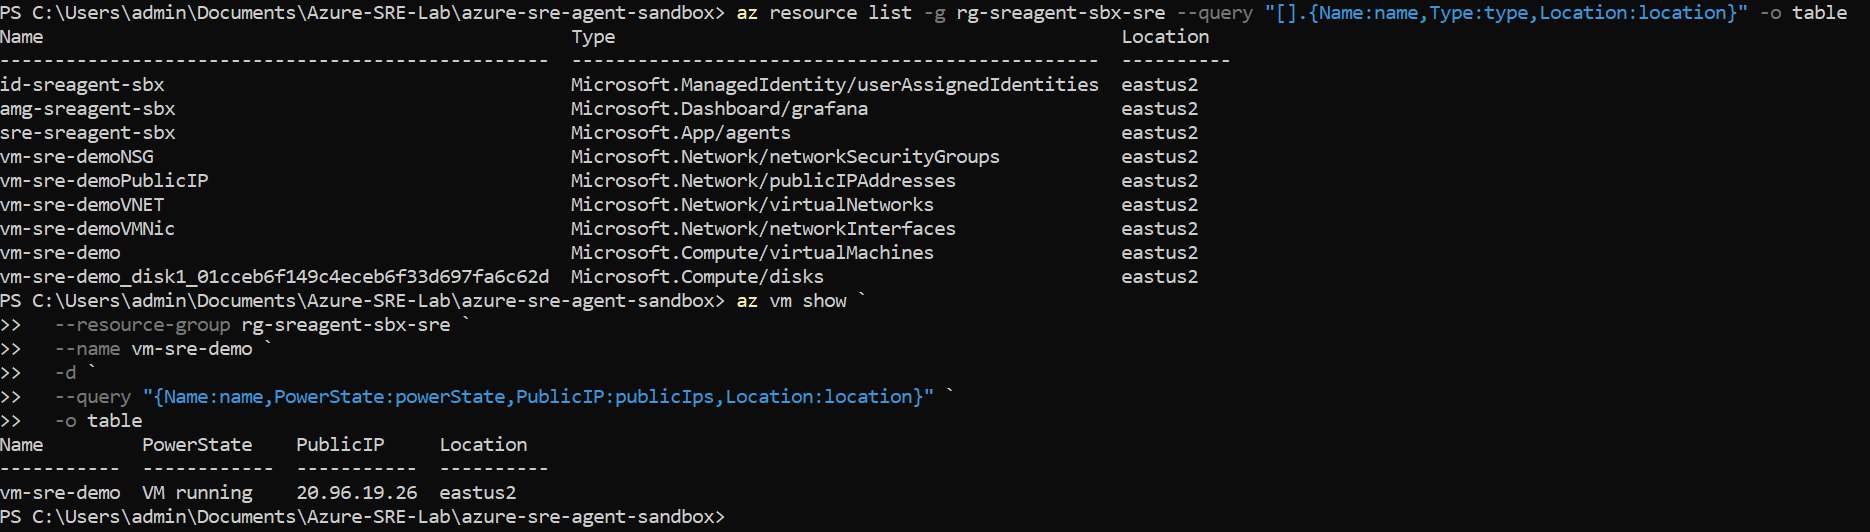 |
| PowerShell Nginx 状态 | 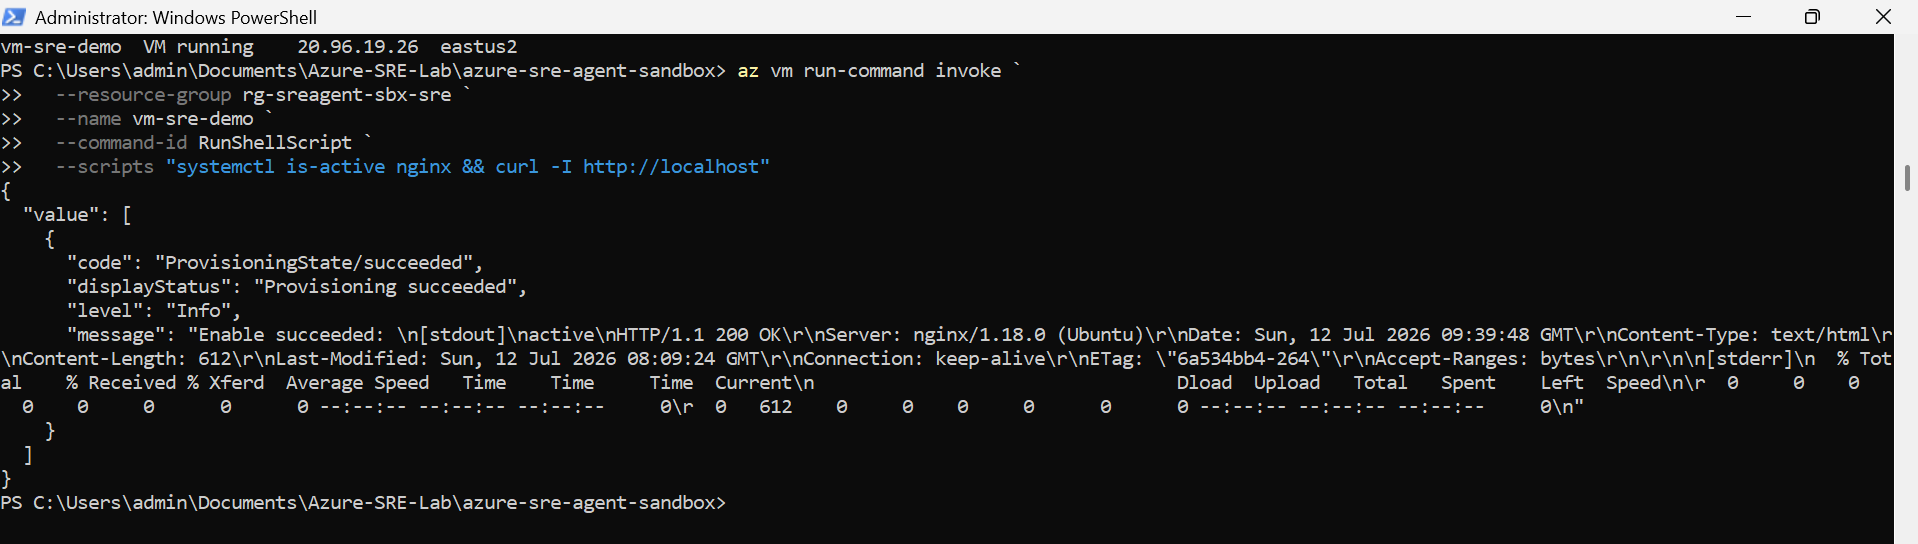 |
| PowerShell 高 CPU 模拟 | 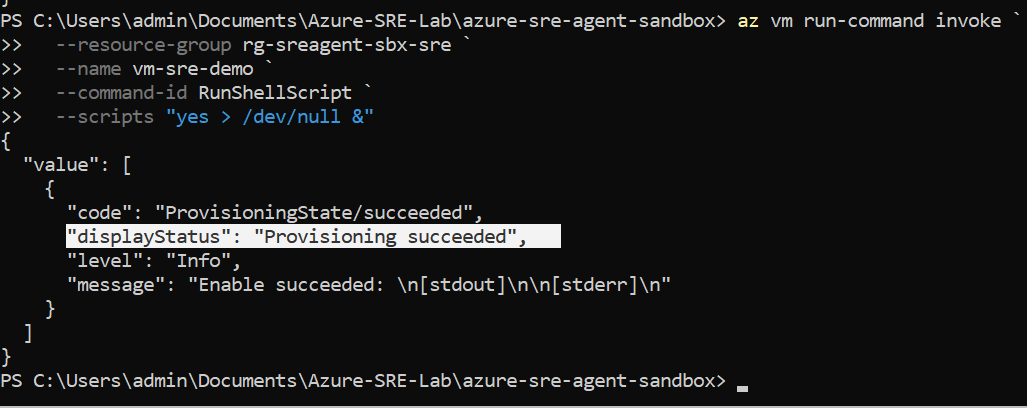 |
| PowerShell 停止高 CPU 进程 | 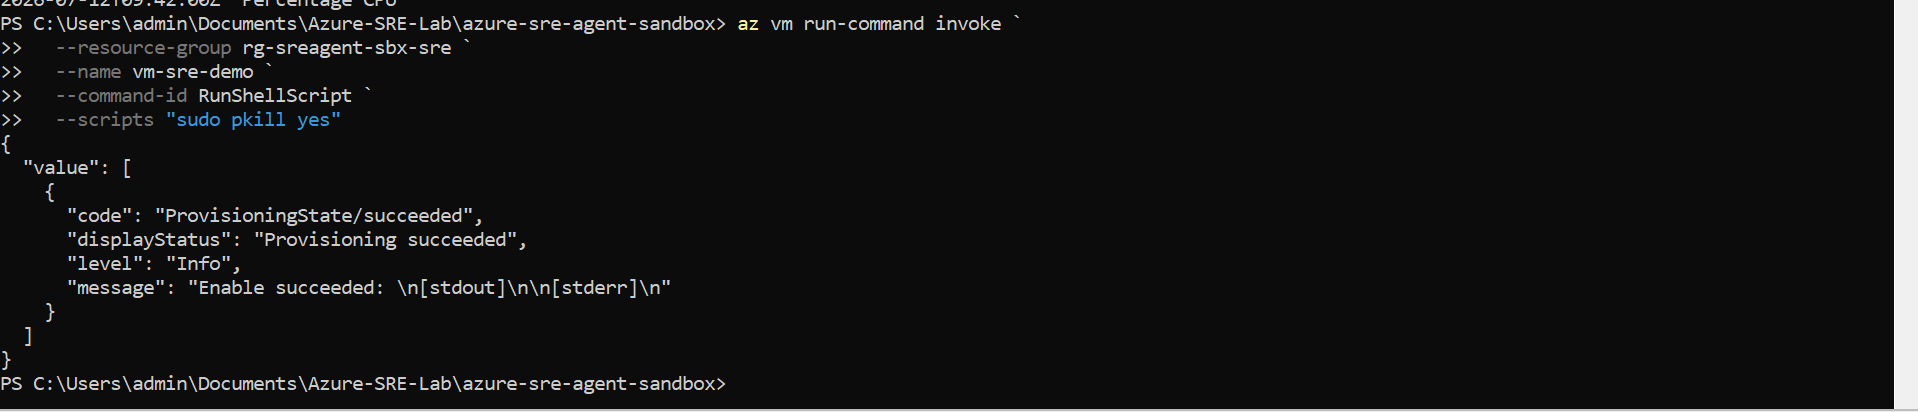 |
| PowerShell 验证 CPU 进程已停止 | 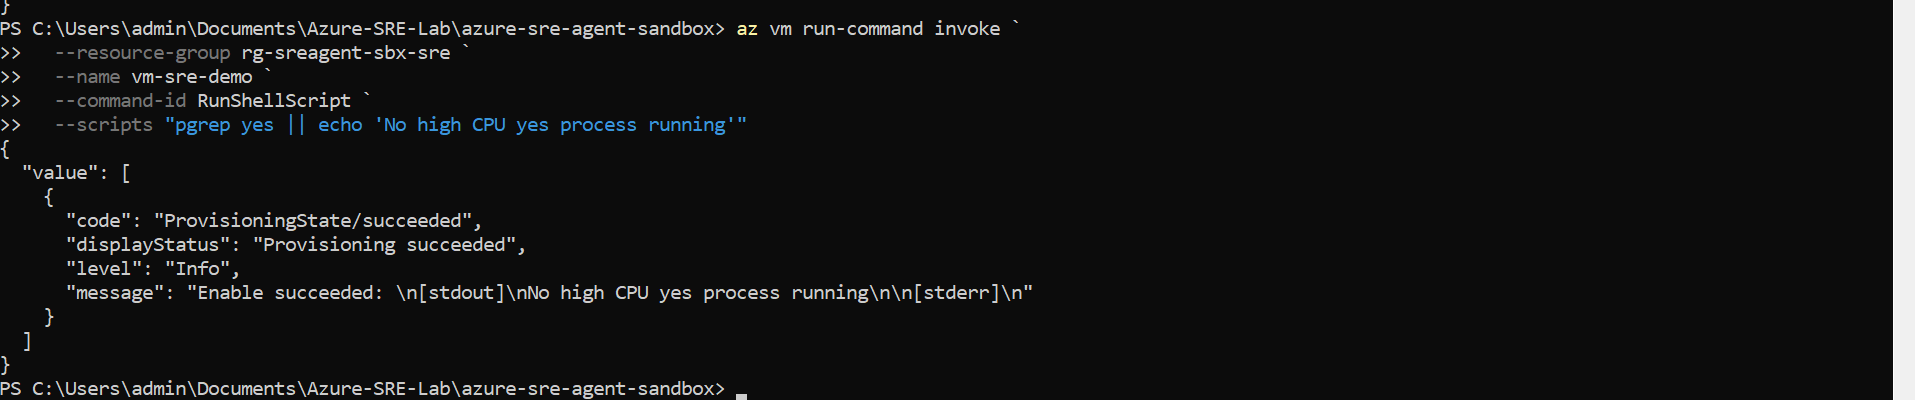 |
## 18. 生产环境视角
在生产环境中,这种架构可以帮助监控和调查:
- VM
- Web 应用程序
- API
- 数据库
- 存储
- 网络组件
- AKS/容器工作负载
- App Service
- Azure SQL/PostgreSQL/MySQL
- 通过 Azure Arc 或外部监控工具连接的本地系统
生产流程:
```
Application / VM / Database / AKS
|
v
Azure Monitor / Application Insights / Log Analytics / Prometheus
|
v
Grafana Dashboards
|
v
Azure SRE Agent
|
v
Incident investigation + probable root cause + recommended actions
```
## 19. 何时使用此项目模式
在以下情况下使用此模式:
- 需要监控多个 Cloud 资源
- 工程师花费大量时间手动检查仪表盘
- 事故需要更快地进行调查
- 团队需要 AI 辅助的根本原因分析
- 生产工作负载具有日志、指标和依赖项
- SRE/DevOps 团队需要降低 MTTR
不要将此模式用作唯一的监控解决方案。它应该作为现有监控、告警、仪表盘和事故响应流程的补充。
## 20. 限制
- Azure SRE Agent 依赖于可用的遥测数据和权限。
- 如果缺少指标/日志,调查质量将受到限制。
- 必须正确配置 RBAC 权限。
- Grafana 需要适当的数据源和托管标识访问权限。
- 在执行生产操作之前,工程师应审查 SRE Agent建议。
- 如果不关闭资源,成本可能会增加。
- VM 指标可能需要几分钟才能在 Azure Monitor/Grafana 中显示。
- 本实验在 Nginx 中使用的是 HTTP,而不是 HTTPS。
- 本实验使用的是简单的 VM 工作负载,而不是完整的生产应用程序。
## 21. 成本考量
本实验会创建产生费用的 Azure 资源:
- Azure SRE Agent
- Azure Managed Grafana
- Virtual Machine
- Disk
- Public IP
- 网络资源
- Azure Monitor 指标使用量
为了降低成本:
- 仅在测试时运行实验。
- 截图完成后停止 CPU 模拟。
- 完成后删除资源。
- 避免让环境彻夜运行。
- 除非需要,否则避免部署 AKS 或更大的 VM。
清理命令:
```
azd down --purge --force
```
验证删除:
```
az group exists --name rg-sreagent-sbx-sre
```
预期输出:
```
false
```
## 22. 最佳实践
### 安全性
- 使用 Managed Identity 代替机密。
- 使用最小权限的 RBAC。
- 避免提交订阅 ID、租户 ID 或个人电子邮件。
- 在上传截图前对敏感值进行模糊处理。
- 避免公开暴露生产环境的 Grafana URL。
- 在真实工作负载中使用 HTTPS。
### 监控
- 使用 Azure Monitor 指标获取平台信号。
- 使用 Log Analytics 获取日志。
- 使用 Application Insights 跟踪应用程序性能和依赖项。
- 使用 Grafana 仪表盘进行可视化。
- 针对生产事故使用告警规则。
### 成本
- 保持实验资源为临时状态。
- 演示时使用小型 VM 规格。
- 测试后删除资源。
- 在 Azure Cost Management 中设置预算和告警。
### 文档
- 使用清晰的截图。
- 按顺序为截图编号。
- 解释事故流程。
- 包含命令和预期输出。
- 解释每个 Azure 资源的作用。
## 23. 如何改进
### 添加 Application Insights
使用 Application Insights 跟踪:
- 请求持续时间
- 失败的请求
- 异常
- 依赖项调用
- Application Map
### 添加 Log Analytics
使用 Log Analytics 收集:
- Syslog
- Nginx 日志
- VM 客户机日志
- 自定义应用程序日志
### 添加 Azure Monitor Alerts
为以下情况创建告警:
- CPU > 80%
- VM 不可用
- 磁盘使用率高
- HTTP 失败
- 内存压力
### 添加数据库监控
添加 Azure SQL、PostgreSQL 或 MySQL 并监控:
- CPU
- 存储
- 连接数
- 查询性能
- 死锁/慢查询
### 添加 AKS/容器监控
添加 AKS 或 Container Apps 并监控:
- Pod 重启
- 节点 CPU/内存
- 容器日志
- Prometheus 指标
### 添加自动化
添加 GitHub Actions 以自动部署项目:
- 验证 Bicep
- 运行部署
- 检查输出
- 测试后销毁资源
## 24. 面试说明
### 简要说明
本项目部署了 Azure SRE Agent、Azure Managed Grafana 和一个真实的 VM 工作负载。我在 VM 上安装了 Nginx,模拟了 CPU 事故,并使用 SRE Agent 调查问题,找出了可能的根本原因。
### 技术说明
我使用 Azure Developer CLI 和 Bicep 部署了 Azure SRE Agent 和 Azure Managed Grafana。我配置了 RBAC 和托管标识,以便 SRE Agent 和 Grafana 能够读取 Azure 资源和 Azure Monitor 指标。然后,我创建了一个运行 Nginx 的 Ubuntu VM,利用 Linux 进程模拟了 CPU 飙升,在 Grafana 中可视化了 CPU 指标,并使用 SRE Agent 将飙升与最近的 `az vm run-command` 活动关联了起来。
### 业务说明
该项目有助于减少 Cloud 事故期间的手动故障排除工作。工程师无需手动检查多个仪表盘和日志,Azure SRE Agent 即可帮助识别受影响的资源、可能的根本原因以及建议的后续步骤。
## 25. 清理
停止高 CPU 进程:
```
az vm run-command invoke `
--resource-group rg-sreagent-sbx-sre `
--name vm-sre-demo `
--command-id RunShellScript `
--scripts "sudo pkill yes"
```
删除资源:
```
azd down --purge --force
```
验证删除:
```
az group exists --name rg-sreagent-sbx-sre
```
预期:
```
false
```
## 26. 最终成果
本项目成功演示了:
- Azure SRE Agent 部署
- Azure Managed Grafana 集成
- Managed Identity 和 RBAC 使用
- 真实 VM 工作负载监控
- Nginx Web 服务器部署
- CPU 事故模拟
- SRE Agent 根本原因调查
- Grafana CPU 指标可视化
- 事故修复工作流
- 生产级 SRE 文档
## 27. 仓库结构
```
azure-sre-agent-sandbox/
│
├── README.md
├── infra/
├── azure.yaml
├── screenshots/
│ ├── 01-azure-resource-group-overview.png
│ ├── 04-vm-sre-demo-overview.png
│ ├── 05-nginx-webserver-working.png
│ ├── 06-sre-agent-vm-discovery.png
│ ├── 07-sre-agent-cpu-spike-analysis.png
│ ├── 08-sre-agent-root-cause-analysis.png
│ ├── 10-sre-agent-remediation-summary.png
│ └── 12-grafana-vm-cpu-metric.png
```
## 28. 重要提示
此仓库仅用于学习和作品集目的。请勿让资源处于不必要的运行状态。完成实验后,请务必清理 Azure 资源。
标签:AIOps, AI合规, Azure, Grafana, Nginx, SRE, 偏差过滤, 故障排查, 运维监控