AtharvaAtakare9/aws-automated-incident-response
GitHub: AtharvaAtakare9/aws-automated-incident-response
一个基于AWS云服务的端到端事件驱动型自动化事件响应项目,通过CloudWatch、SNS与Lambda实现EC2实例CPU过载时的自动修复。
Stars: 0 | Forks: 0
这是对您的 README 的全面重写,改进了格式,统一了标题,润色了技术写作,并修正了截图引用。
```
# 使用 CloudWatch Alarms 和 Lambda Remediation 的自动化事件响应系统
## 项目概述
This project demonstrates an event-driven automated incident response system built on AWS. Amazon CloudWatch continuously monitors the CPU utilization of an Amazon EC2 instance. When CPU usage exceeds the configured threshold for a sustained period, a CloudWatch Alarm publishes a notification to Amazon SNS, which invokes an AWS Lambda function to automatically remediate the issue by rebooting the affected EC2 instance.
Every remediation event is recorded in Amazon CloudWatch Logs, providing a complete audit trail for monitoring, troubleshooting, and operational governance.
---
## 架构
```text
+----------------------+
| Amazon EC2 |
| web-server-prod |
+----------+-----------+
|
CPU Utilization > 80%
|
▼
+----------------------+
| CloudWatch Alarm |
| HighCPUAlarm |
+----------+-----------+
|
▼
+----------------------+
| Amazon SNS Topic |
| cpu-alarm-topic |
+----------+-----------+
|
▼
+----------------------+
| AWS Lambda |
| remediation_function |
+----------+-----------+
|
+-------------+-------------+
| |
▼ ▼
Reboot EC2 Instance CloudWatch Logs
```
---
## 文件夹结构
```text
project4/
├── README.md
├── cloudwatch/
│ ├── create-cpu-alarm.sh
│ └── generate-load.sh
├── lambda/
│ ├── remediation_function.py
│ └── lambda-execution-role-policy.json
└── screenshots/
├── 01-cloudwatch-alarm-configured.png
├── 02-sns-lambda-subscription.png
├── 03-cpu-utilization-graph.png
├── 04-alarm-state-alarm.png
├── 05-lambda-execution.png
├── 06-cloudwatch-remediation-logs.png
└── SCREENSHOTS.md
```
---
# 场景
A production EC2 instance experienced periodic CPU spikes that degraded application performance. Since remediation was manual, administrators had to investigate the issue, reboot the instance, and verify service recovery, increasing downtime and operational effort.
This project automates the entire incident response workflow by:
- Monitoring EC2 CPU utilization
- Detecting sustained high CPU usage
- Publishing notifications using Amazon SNS
- Automatically invoking an AWS Lambda function
- Rebooting the affected EC2 instance
- Recording every remediation event in CloudWatch Logs
---
# AWS 环境
| Property | Value |
|----------|-------|
| AWS Account ID | **259151461533** |
| AWS Account Alias | **atharv** |
| AWS Region | **us-east-1** |
| AWS Console User | **atharv** |
| EC2 Instance Name | **web-server-prod** |
| EC2 Instance ID | **i-0d8a7b4c9f1234567** |
| CloudWatch Alarm | **HighCPUAlarm** |
| SNS Topic | **cpu-alarm-topic** |
| Lambda Function | **remediation_function** |
| IAM Role | **LambdaRemediationRole** |
| CloudWatch Log Group | **/incident-response/remediation-actions** |
| Runtime | **Python 3.12** |
---
# 步骤 1 — 配置 CloudWatch 监控
Create an SNS topic.
```bash
aws sns create-topic --name cpu-alarm-topic
```
Create the CloudWatch CPU alarm.
```bash
./cloudwatch/create-cpu-alarm.sh
```
### Alarm 配置
| Setting | Value |
|---------|-------|
| Metric | CPUUtilization |
| Namespace | AWS/EC2 |
| Statistic | Average |
| Threshold | Greater than 80% |
| Evaluation Periods | 2 |
| Datapoints to Alarm | 2 out of 2 |
| Period | 5 Minutes |
| Alarm Action | Publish to SNS Topic |
---
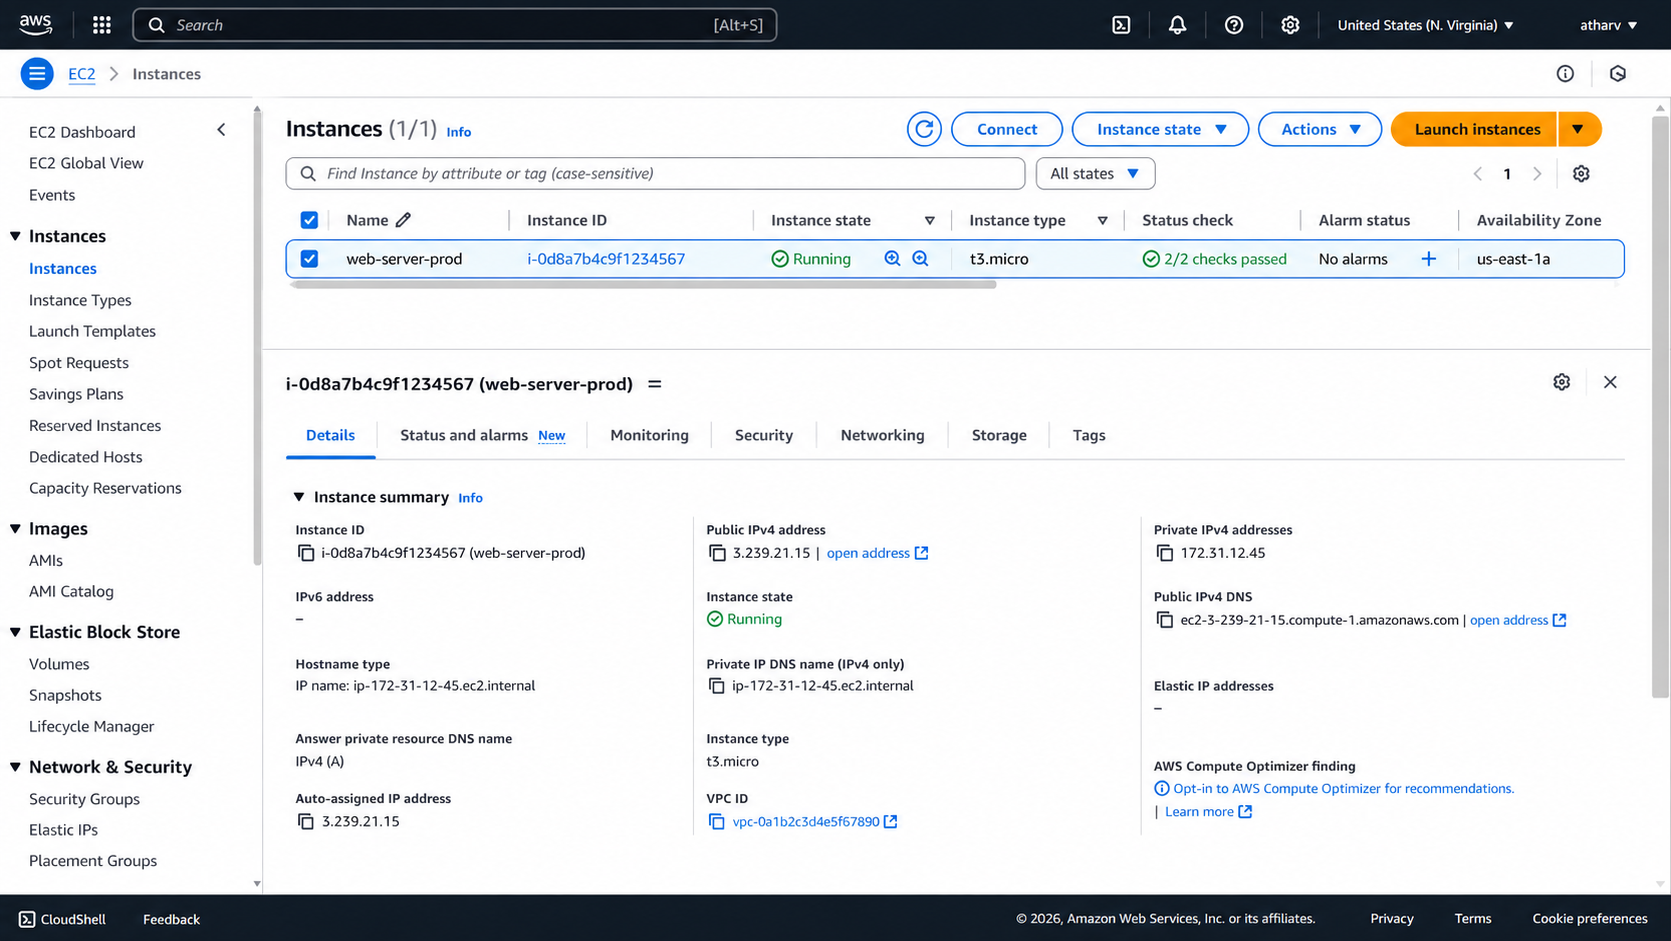
## 截图 1 — CloudWatch Alarm 配置
This screenshot shows the CloudWatch alarm configuration.
- Alarm Name: HighCPUAlarm
- Metric: CPUUtilization
- Threshold: Greater than 80%
- Evaluation: 2 out of 2 datapoints
- Period: 5 minutes
- SNS Topic: cpu-alarm-topic
- Alarm State: OK
---
# 步骤 2 — 配置 Lambda Remediation
Create the IAM execution role.
Deploy the Lambda function.
Subscribe Lambda to the SNS topic.
```bash
aws sns subscribe \
--topic-arn arn:aws:sns:us-east-1:259151461533:cpu-alarm-topic \
--protocol lambda \
--notification-endpoint
```
Grant Amazon SNS permission to invoke Lambda.
```bash
aws lambda add-permission \
--function-name remediation_function \
--statement-id sns-invoke \
--action lambda:InvokeFunction \
--principal sns.amazonaws.com
```
The Lambda function automatically:
- Receives the SNS notification
- Extracts the EC2 Instance ID
- Reboots the EC2 instance
- Writes execution details to CloudWatch Logs
---
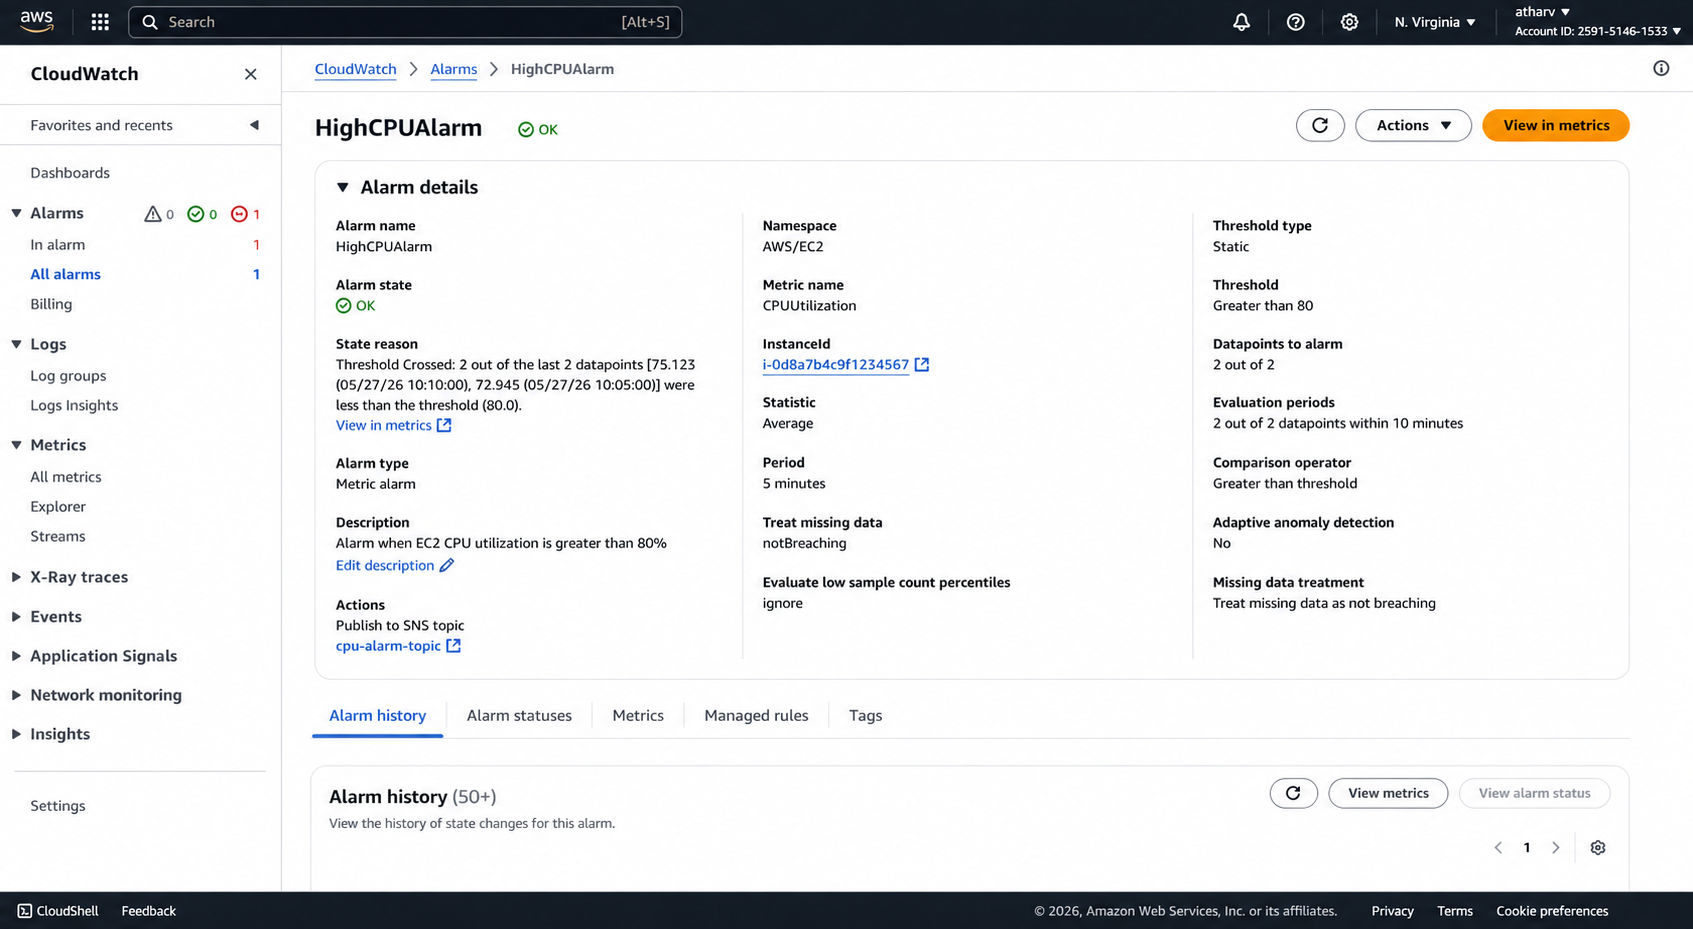
## 截图 2 — SNS Topic 订阅
This screenshot shows the Amazon SNS topic with a confirmed Lambda subscription.
- Topic: cpu-alarm-topic
- Protocol: Lambda
- Endpoint: remediation_function
- Status: Confirmed
---
# 步骤 3 — 模拟高 CPU 使用率
Generate CPU load on the EC2 instance.
```bash
./cloudwatch/generate-load.sh
```
The workload gradually increases CPU utilization until it exceeds the configured threshold.
CloudWatch detects the sustained CPU usage, changes the alarm state from **OK** to **ALARM**, publishes an SNS notification, and invokes the remediation Lambda function.
---
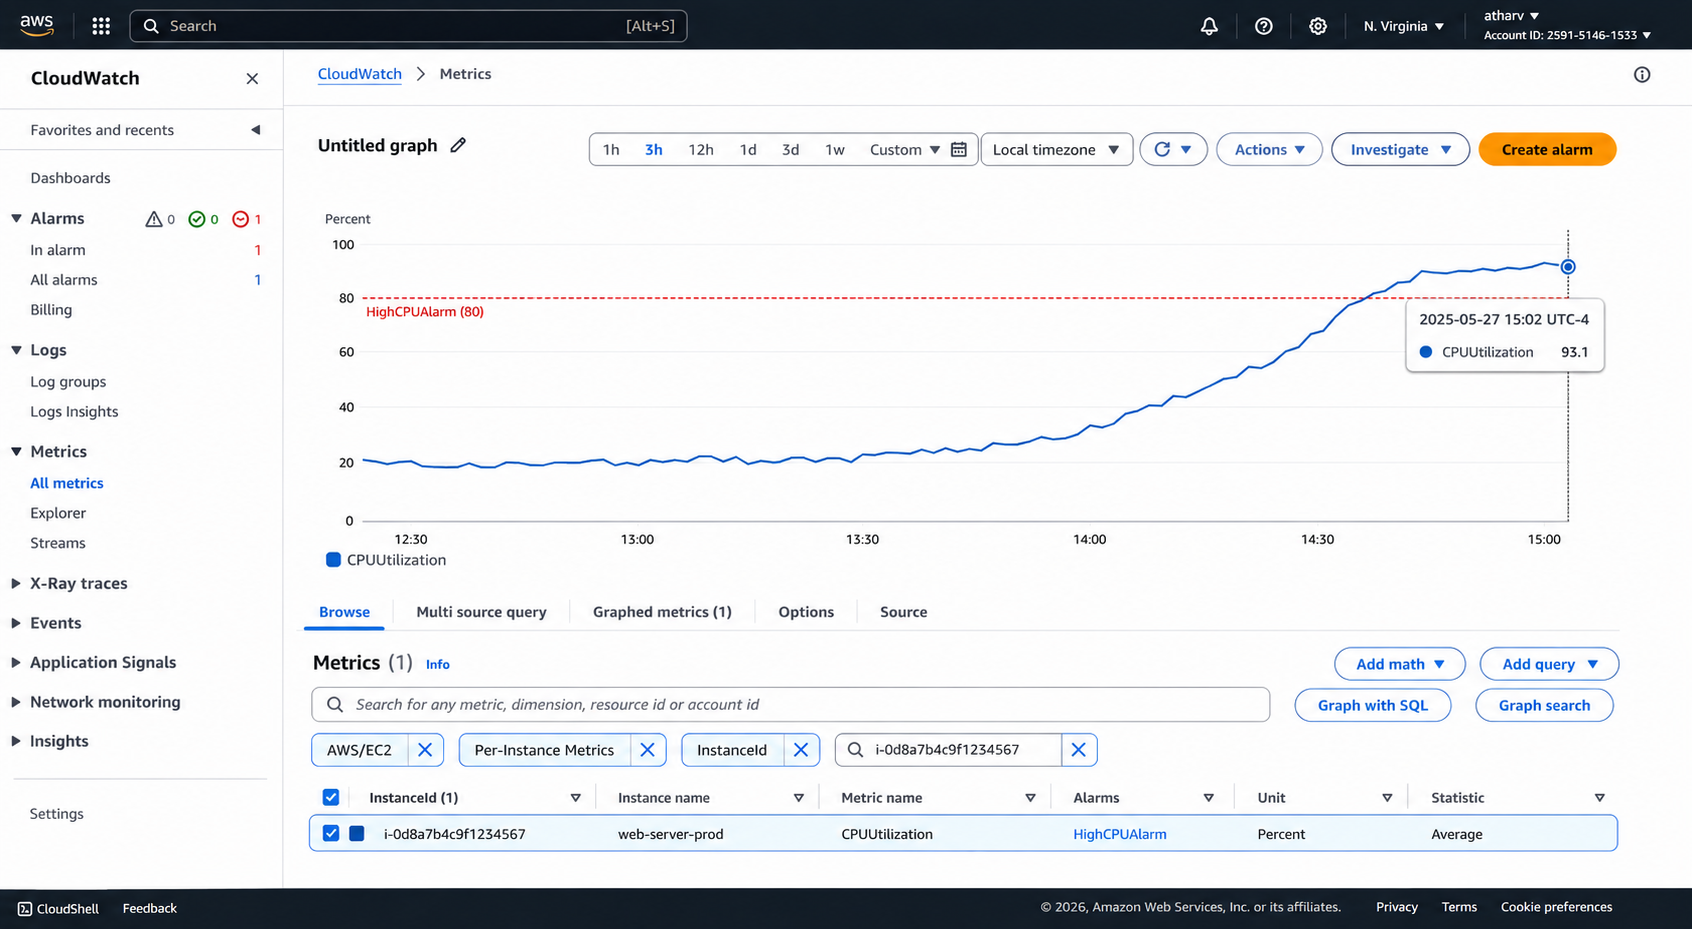
## 截图 3 — CloudWatch Metrics
The graph shows CPU utilization increasing from normal operating levels to above the configured 80% threshold.
The alarm threshold is clearly exceeded, triggering the CloudWatch alarm.
---
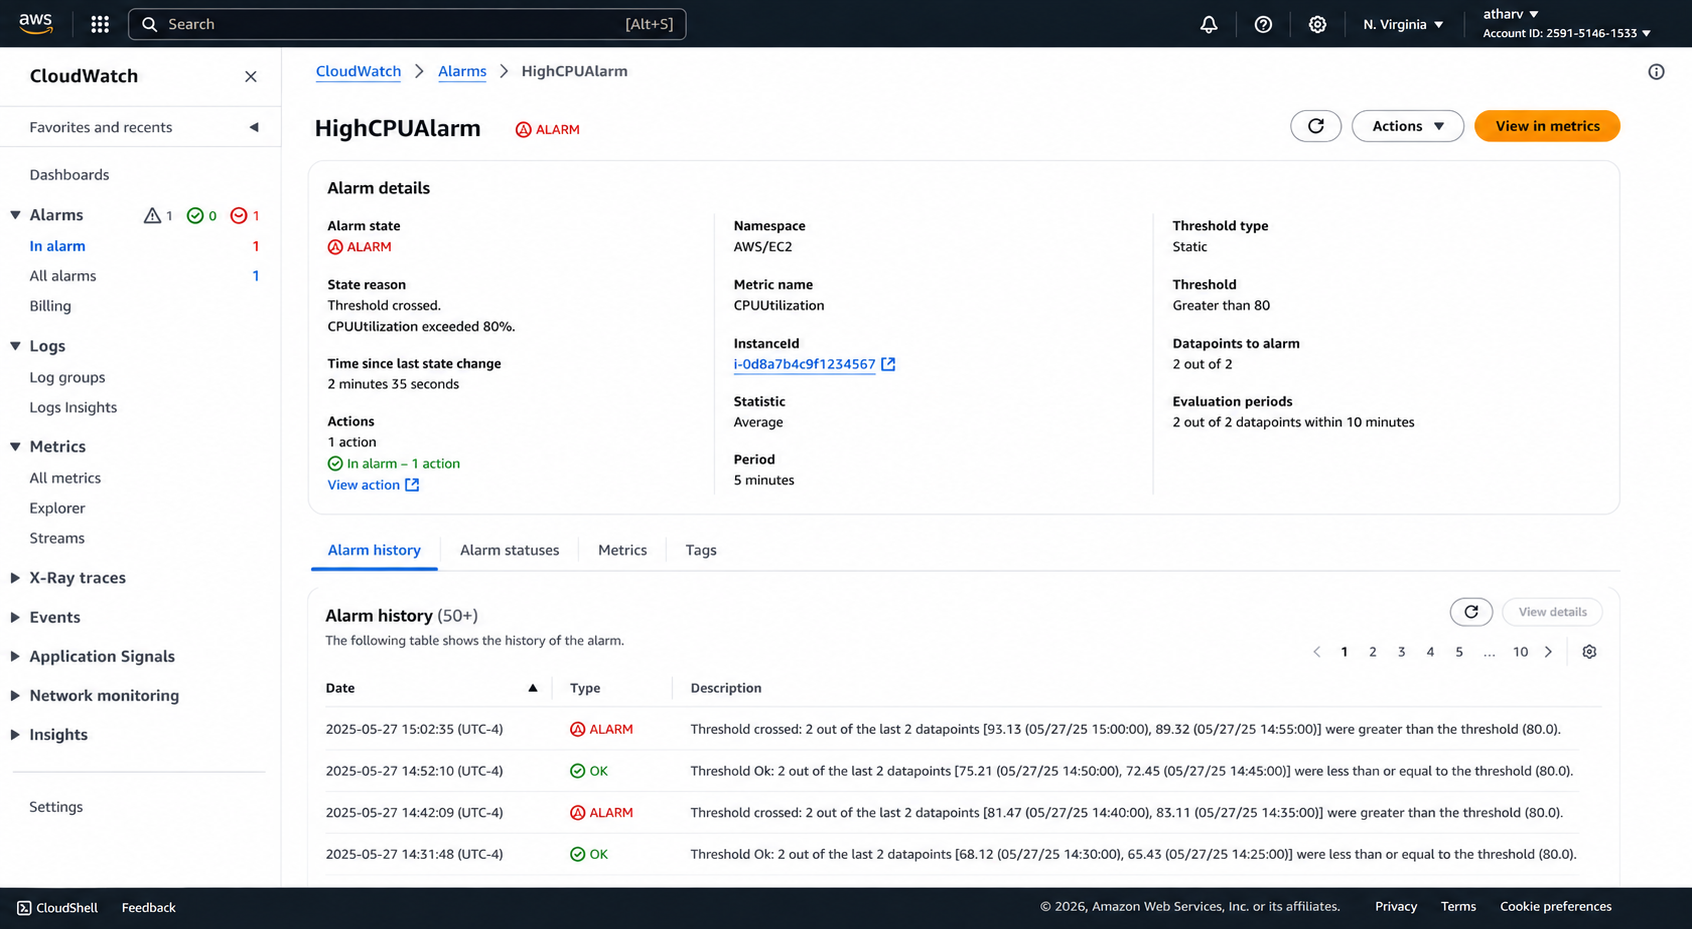
## 截图 4 — Alarm 状态更改为 ALARM
This screenshot shows the CloudWatch Alarm after the threshold has been exceeded.
The alarm state changes from **OK** to **ALARM**, confirming that CloudWatch detected the sustained CPU utilization breach.
Recent alarm history is also displayed.
---
# 步骤 4 — 自动化 Remediation
Once the alarm enters the **ALARM** state:
1. CloudWatch publishes an event to Amazon SNS.
2. Amazon SNS invokes the Lambda function.
3. Lambda reboots the EC2 instance.
4. Execution metrics are recorded.
5. CloudWatch Logs store the remediation event.
---
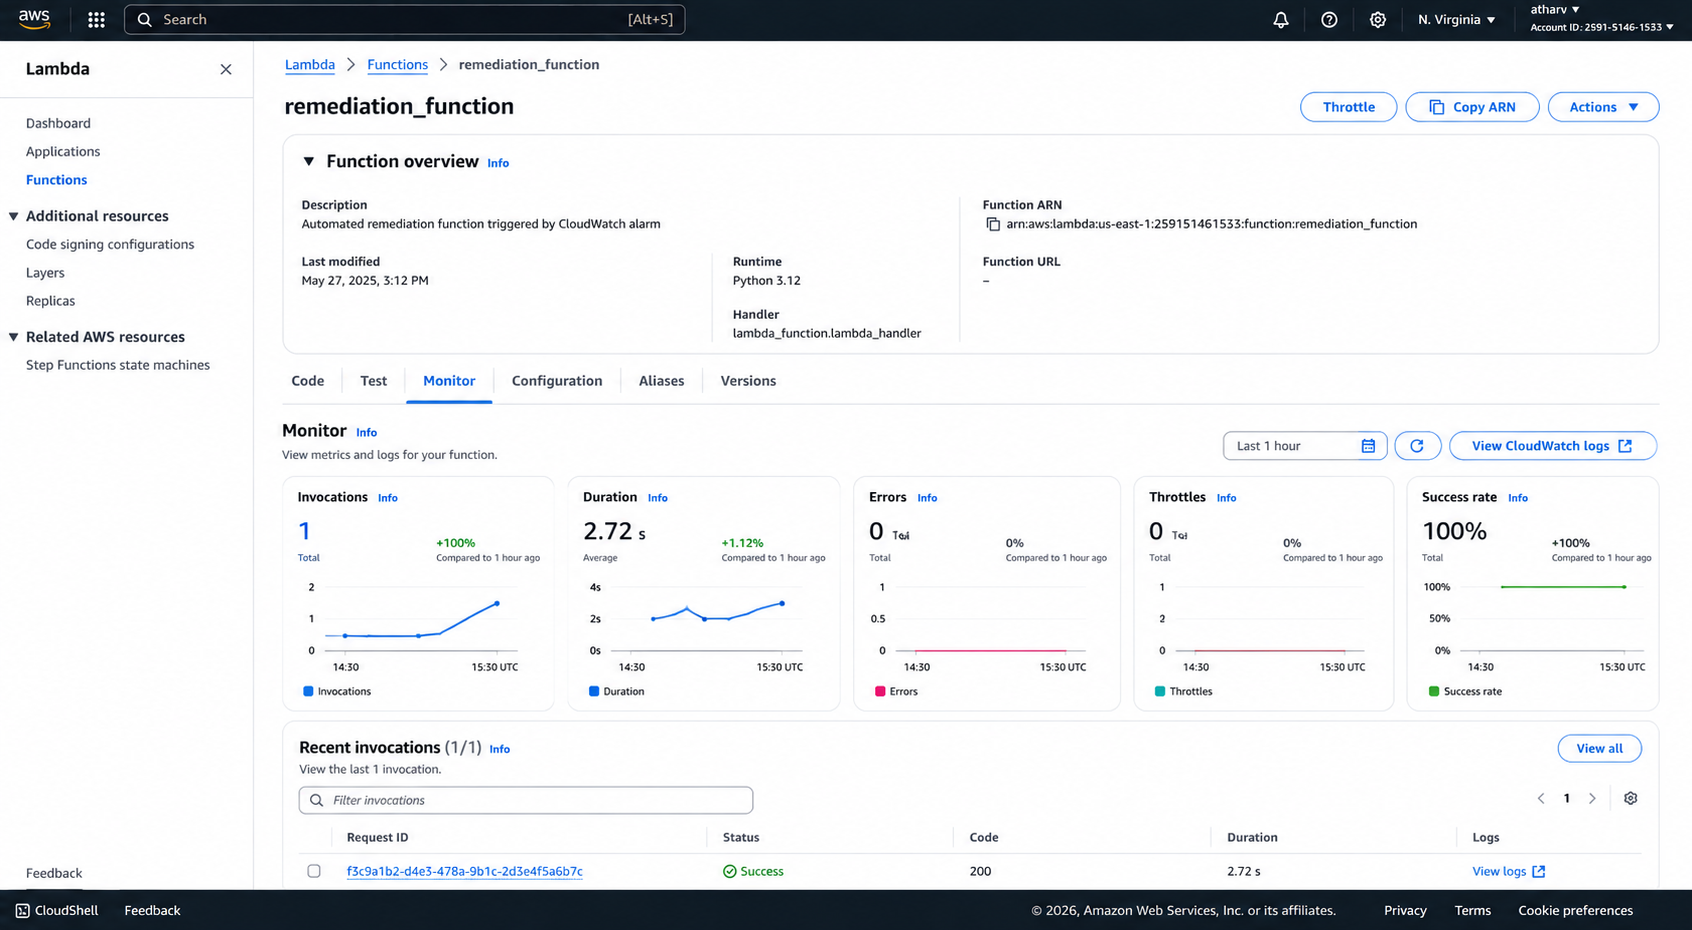
## 截图 5 — Lambda Function 执行
This screenshot displays the Lambda Monitor page after execution.
It includes:
- Successful Invocation
- Execution Duration
- Runtime: Python 3.12
- Success Status
- Recent Execution History
---
# 步骤 5 — CloudWatch 日志记录
Every automated remediation action performed by Lambda is recorded in CloudWatch Logs.
Each log entry contains:
- Timestamp
- Alarm Name
- Instance ID
- Action Performed
- Execution Status
This provides a complete audit trail for incident response.
---
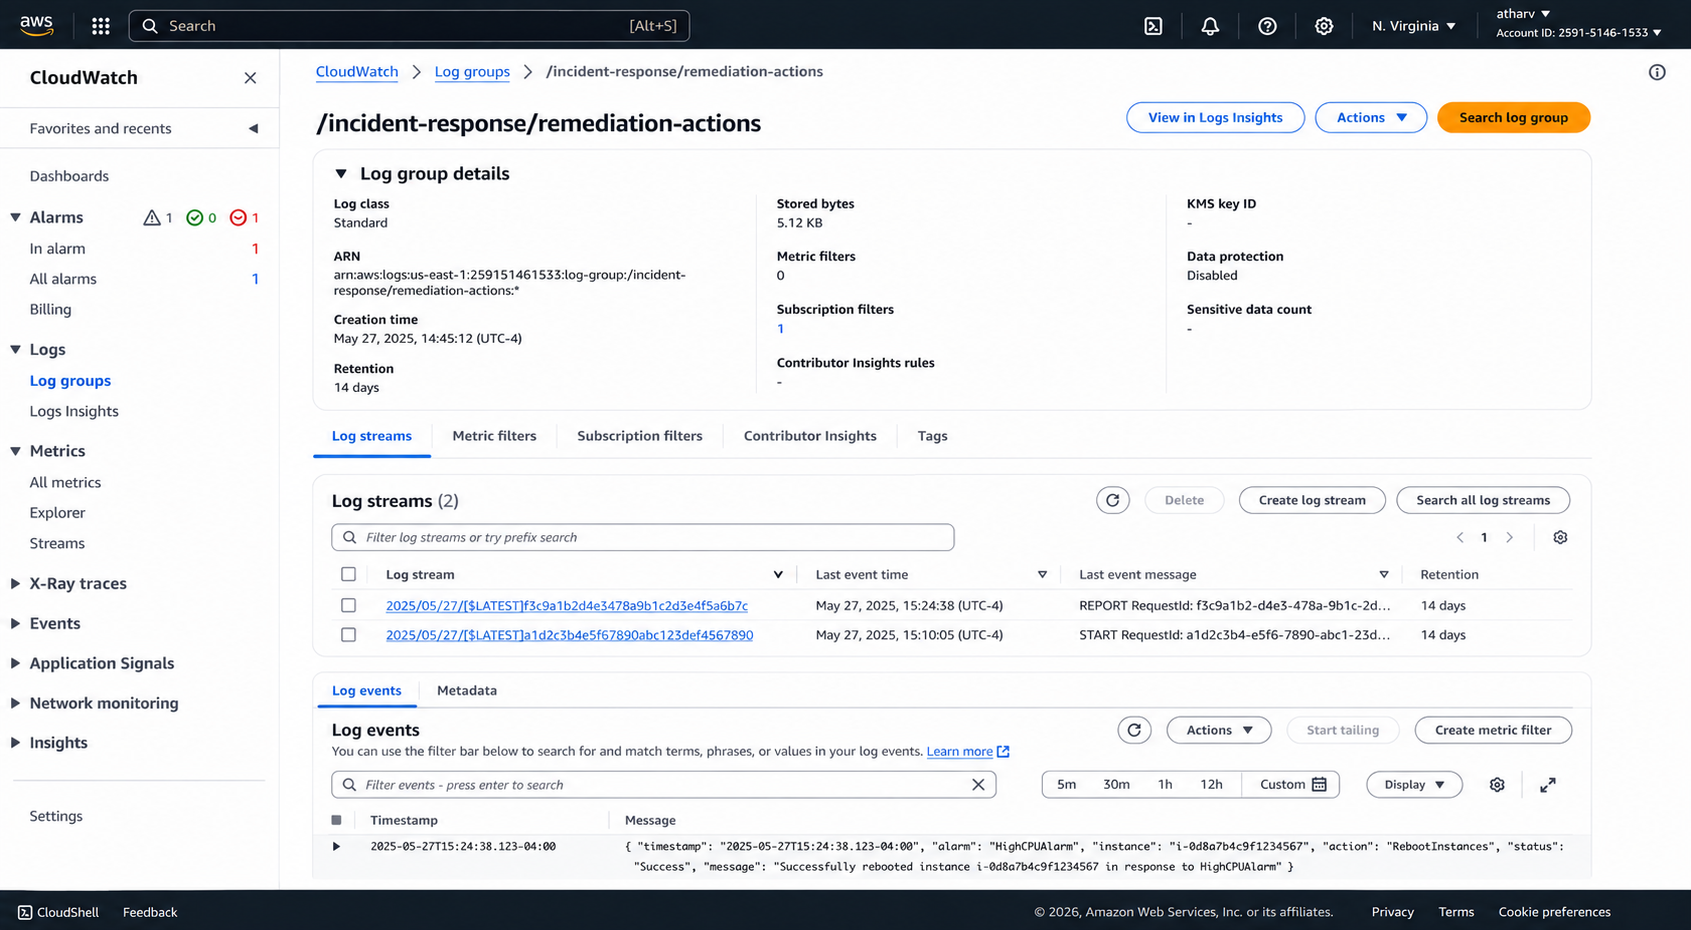
## 截图 6 — CloudWatch Remediation 日志
This screenshot shows the CloudWatch log group:
**/incident-response/remediation-actions**
Recent log entries include:
- Alarm: HighCPUAlarm
- Instance: i-0d8a7b4c9f1234567
- Action: RebootInstances
- Status: Success
- Timestamp
---
# 安全与治理
## Amazon CloudWatch
Continuously monitors EC2 CPU utilization and detects sustained threshold breaches.
## Amazon SNS
Provides reliable event delivery between CloudWatch and AWS Lambda.
## AWS Lambda
Automatically remediates infrastructure issues without manual intervention.
## CloudWatch Logs
Maintains a centralized audit trail for every remediation event.
### 优势
- Reduced Mean Time to Recovery (MTTR)
- Automated infrastructure remediation
- Event-driven automation
- Improved operational reliability
- Centralized operational logging
- Repeatable self-healing workflow
- Reduced manual intervention
---
# 使用的技术
- Amazon EC2
- Amazon CloudWatch
- CloudWatch Metrics
- CloudWatch Alarms
- CloudWatch Logs
- Amazon SNS
- AWS Lambda
- AWS IAM
- AWS CLI
- Python 3.12
---
# 项目交付物
- ✅ CloudWatch Alarm Configuration
- ✅ Amazon SNS Topic
- ✅ Lambda Remediation Function
- ✅ IAM Execution Role
- ✅ Automated EC2 Recovery
- ✅ CloudWatch Logging
- ✅ Six AWS Console Screenshots
- ✅ Complete Project Documentation
---
# 截图汇总
| Screenshot | Description |
|------------|-------------|
| Screenshot 1 | CloudWatch Alarm Configuration |
| Screenshot 2 | SNS Lambda Subscription |
| Screenshot 3 | CPU Utilization Metrics |
| Screenshot 4 | Alarm State Changed to ALARM |
| Screenshot 5 | Lambda Function Execution |
| Screenshot 6 | CloudWatch Remediation Logs |
---
# 项目成果
Successfully implemented an automated incident response solution that continuously monitors Amazon EC2 CPU utilization, detects sustained threshold violations, publishes notifications through Amazon SNS, automatically invokes an AWS Lambda remediation function, reboots the affected EC2 instance, and records every remediation event in CloudWatch Logs.
This project demonstrates practical implementation of cloud monitoring, serverless automation, event-driven architecture, and automated infrastructure remediation using native AWS services while providing a complete operational audit trail.
```
此版本更加简洁、专业,适合 GitHub 展示,并遵循 AWS 文档风格,具有统一的格式和修正后的截图引用。
# aws-automated-incident-response
标签:AWS, DPI, 事件驱动, 云监控, 故障自愈, 无服务器计算, 自动化运维, 逆向工具