aaronjoshvaa/tse-home-lab
GitHub: aaronjoshvaa/tse-home-lab
面向 L1/L2 支持工程师的监控实验室项目,结合 Prometheus + Grafana 监控栈与多场景模拟事件,完整展示告警触发、故障诊断与恢复的运维实践流程。
Stars: 0 | Forks: 0
# TSE 家庭实验室 — 监控与事件响应
## 架构
```
Ubuntu WSL2 (MSI laptop)
│
├── Nginx 1.28 ← Web server (the "application" being monitored)
│
├── Node Exporter 1.8.1 ← Collects CPU/memory/disk/network metrics → port 9100
│
├── Prometheus 2.52 ← Scrapes Node Exporter every 15s, stores time-series data → port 9090
│
└── Grafana 13.1 ← Dashboards + alerting → port 3000
```
**工作原理:**
- Node Exporter 读取操作系统级别的指标,并通过 `http://localhost:9100/metrics` 暴露它们
- Prometheus 每 15 秒抓取一次该 endpoint,并将所有内容连同时间戳一起存储
- Grafana 查询 Prometheus 并渲染实时仪表板
- 当指标越过阈值时,Grafana 触发告警
## 我所构建的内容
| 组件 | 版本 | 用途 |
|---|---|---|
| Ubuntu Server | 26.04 (WSL2) | Linux 环境 |
| Nginx | 1.28.3 | Web 服务器 — 被监控的应用程序 |
| Node Exporter | 1.8.1 | 系统指标导出器 |
| Prometheus | 2.52.0 | 指标数据库 + 抓取器 |
| Grafana | 13.1.0 | 仪表板 + 告警引擎 |
## 截图
### 1. 压力测试开始 — 全部 16 个 CPU 核心满载
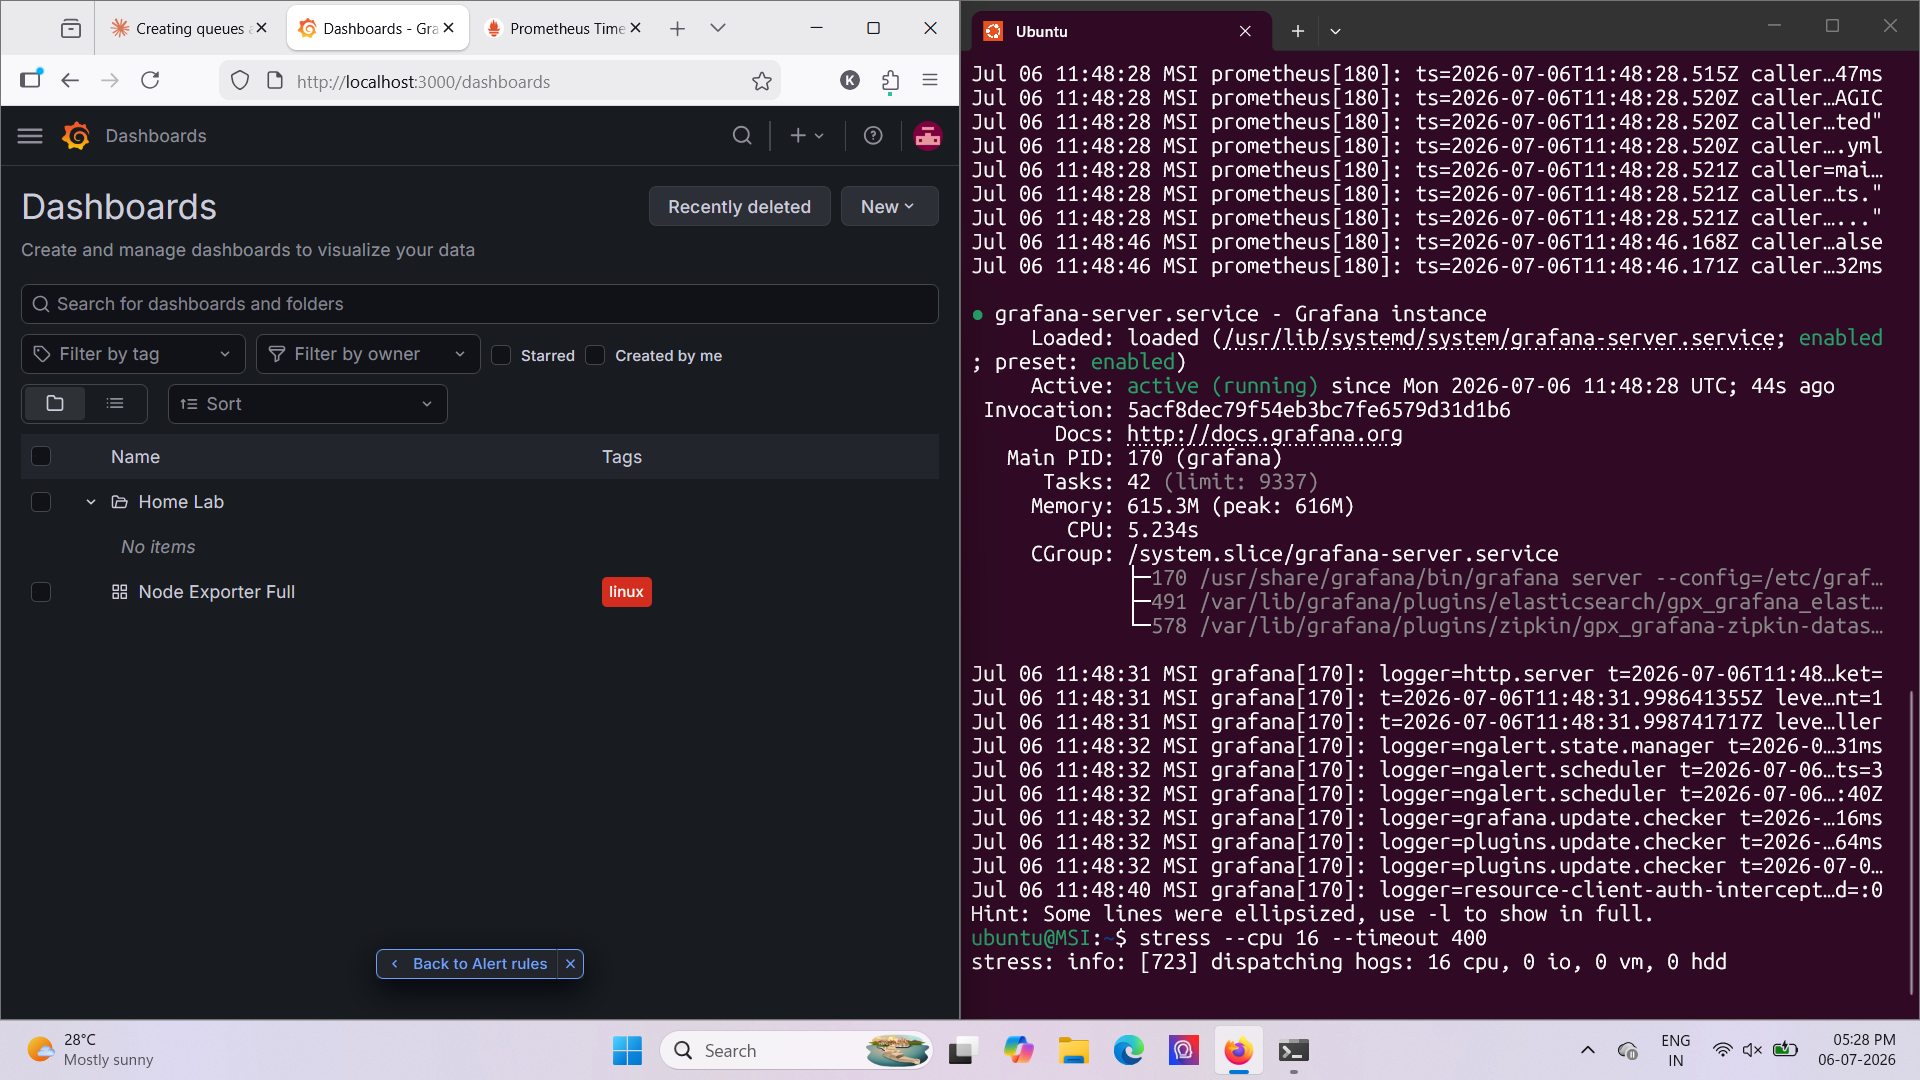
`stress --cpu 16 --timeout 400` 分发到所有 16 个核心。浏览器中可见 Grafana 仪表板,显示监控栈正在同时运行。
### 2. 告警触发 — CPU 超过 80% 阈值
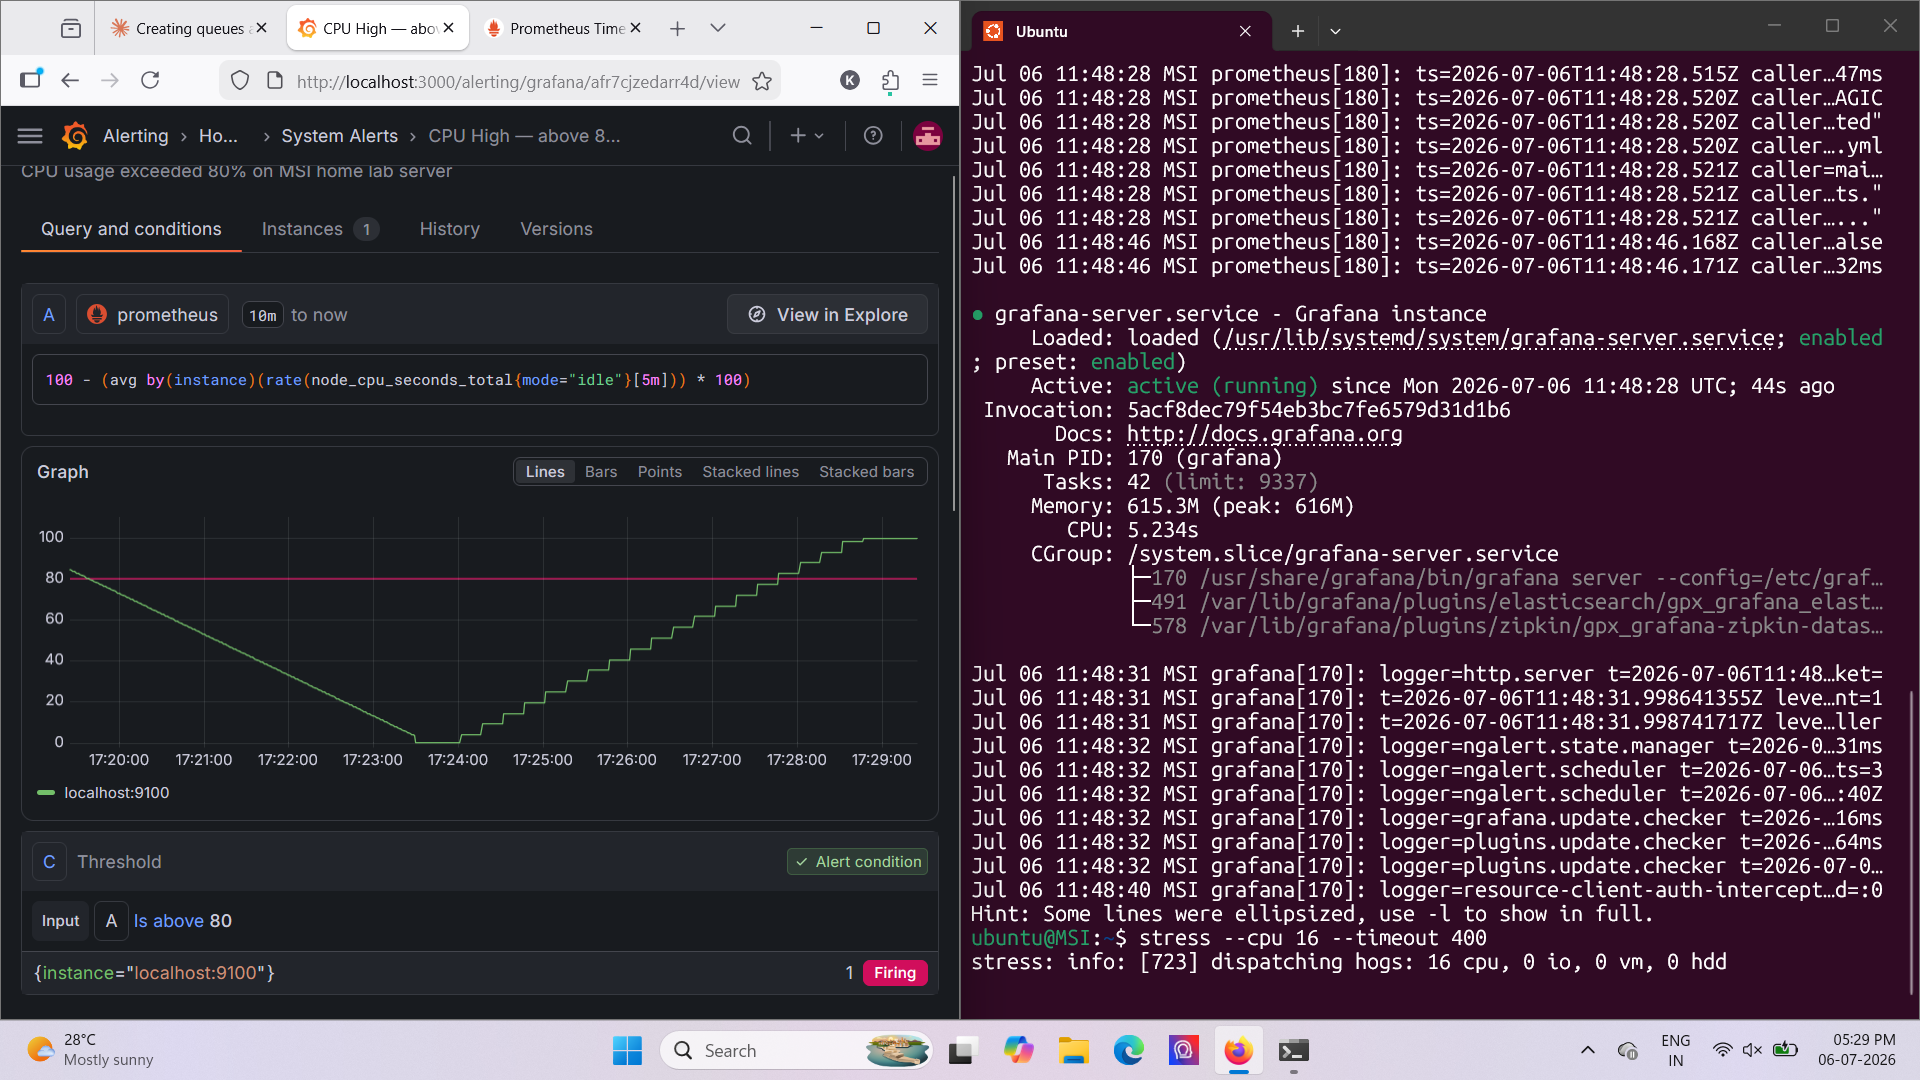
CPU 在约 5 分钟内从 0% 攀升至 95-100%。告警规则 (`CPU High — above 80%`) 从 **Normal → Pending → Firing** 进行了状态转换。80% 处可见红色阈值线。告警徽章以红色显示 **Firing**。
### 3. Prometheus Targets — 满载下 node_exporter UP
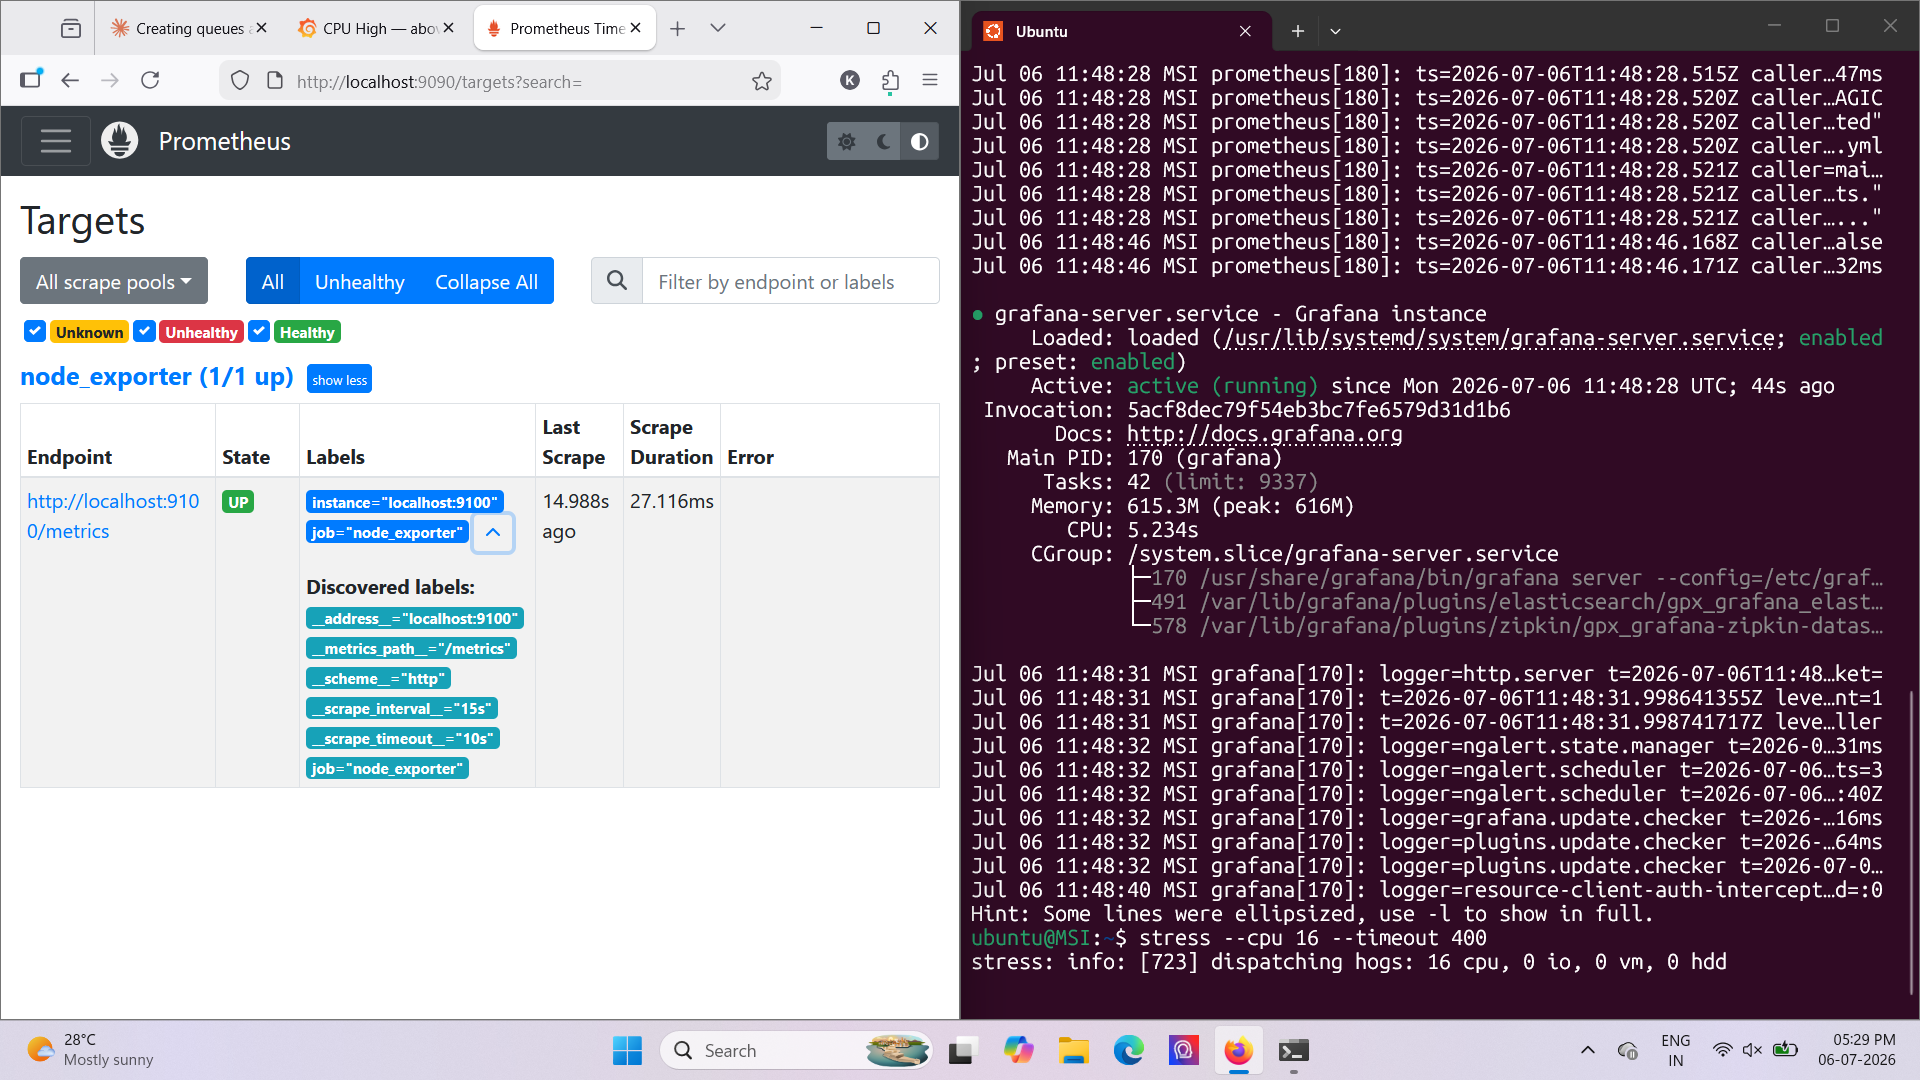
即使所有 16 个 CPU 核心都在最大负载下,Prometheus 仍继续成功抓取 Node Exporter。状态:**UP**,抓取耗时:27ms。监控栈在压力下保持稳定。
### 4. 告警已解决 — CPU 恢复为 Normal
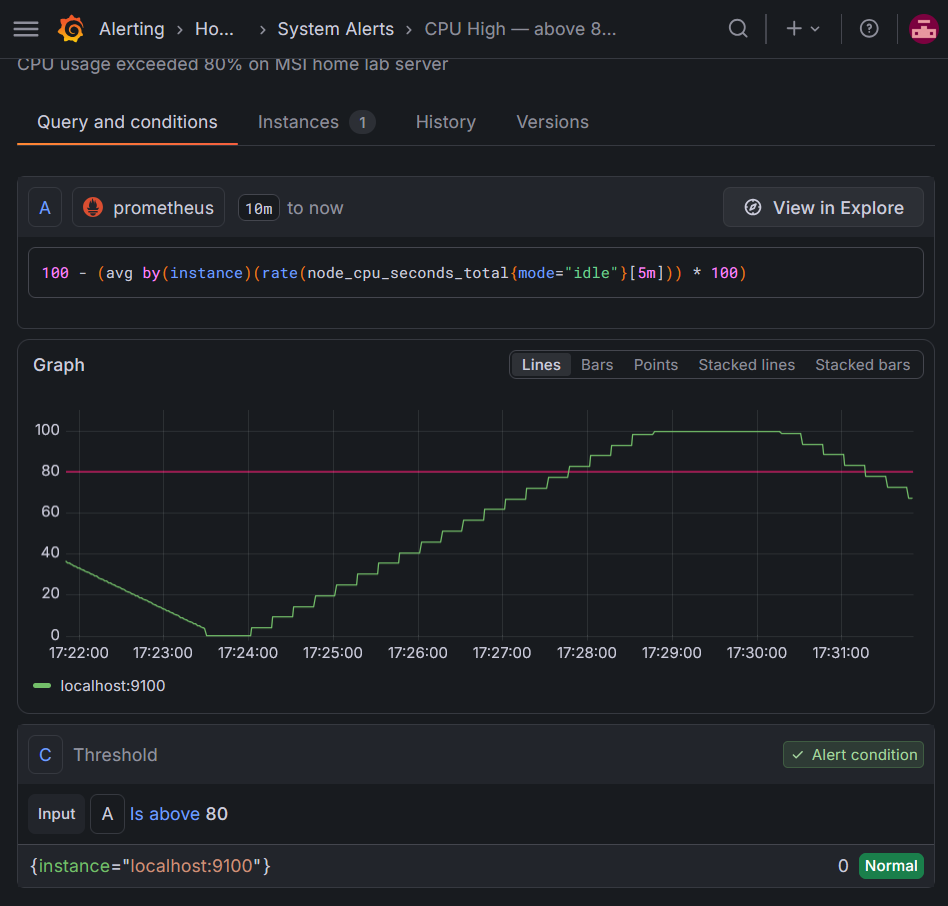
停止压力测试后,CPU 降至 80% 阈值以下。告警自动转换回 **Normal** — 无需人工干预。图表显示了完整的生命周期:基线 → 上升 → 峰值 → 恢复。
### 5. 事件 1 后 Nginx 已恢复
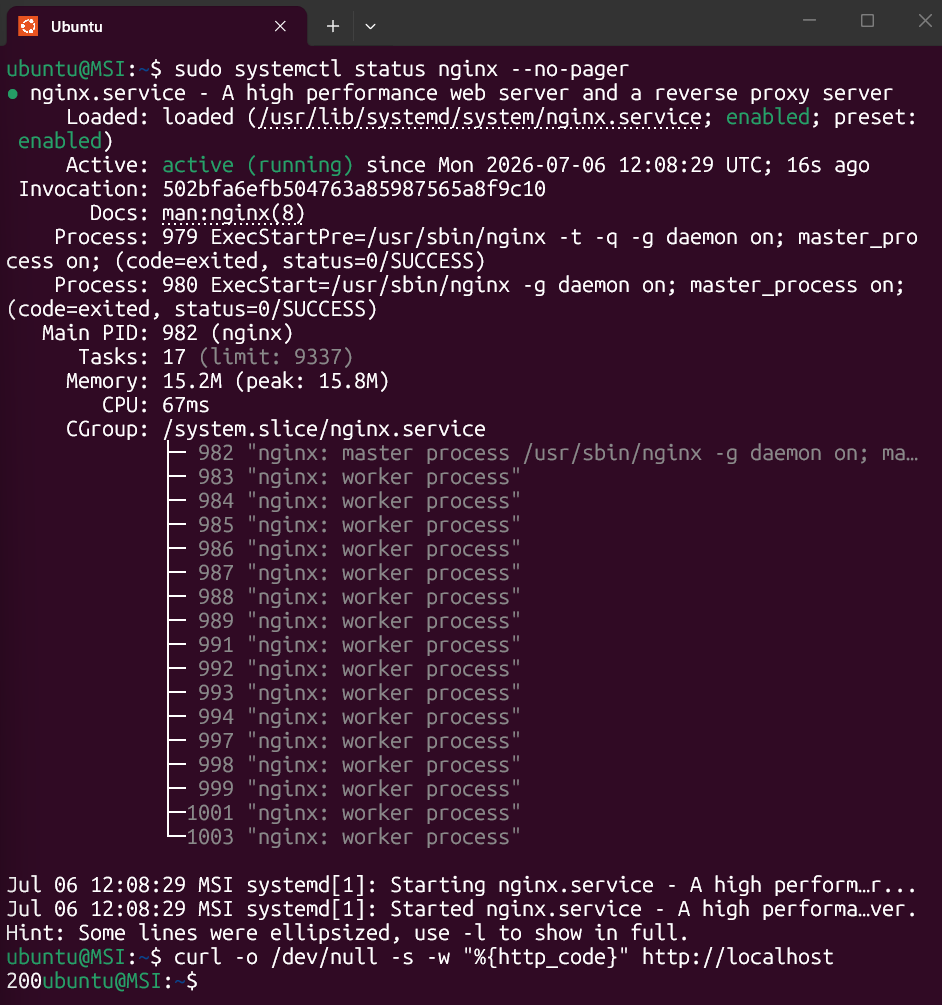
在模拟服务崩溃 (`systemctl stop nginx`) 后,通过 `systemctl status` 和 `journalctl` 进行诊断,然后使用 `systemctl start nginx` 恢复。通过 `curl` 返回 **200 OK** 进行确认。
### 6. 权限修复 — 事件 2
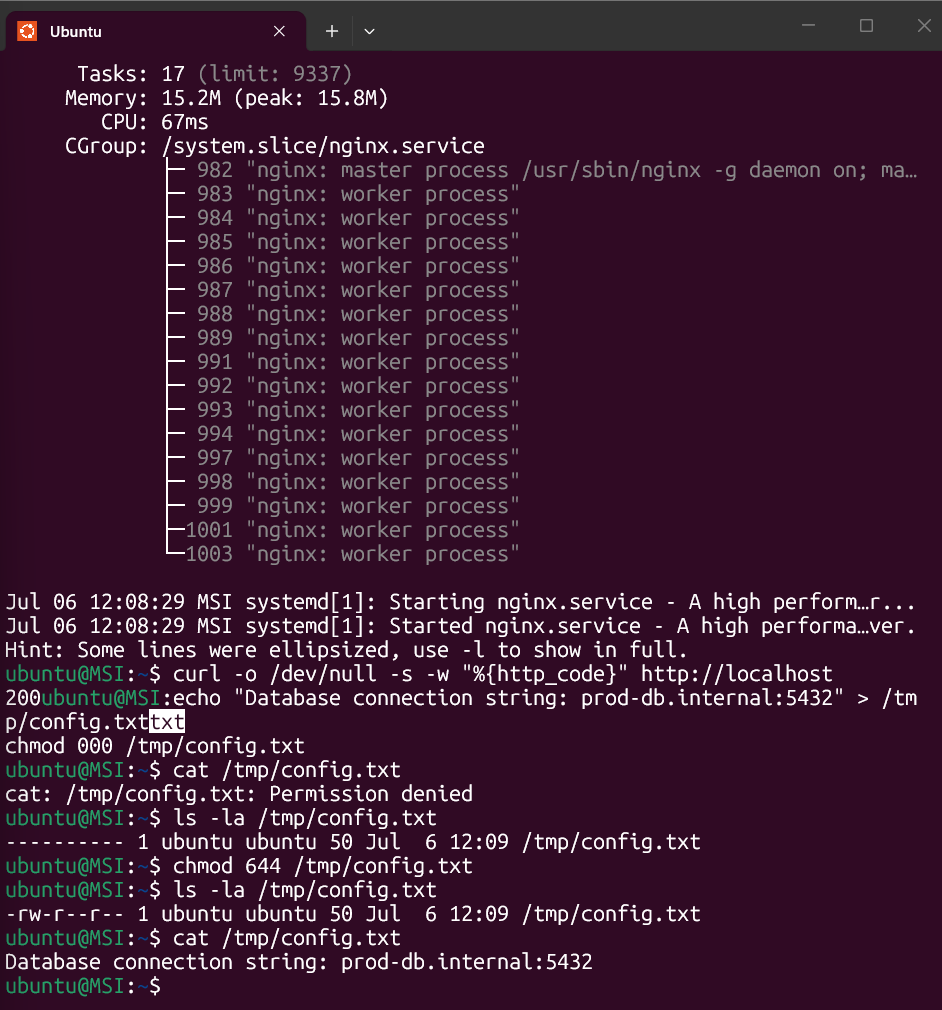
模拟了“Permission Denied”错误。通过 `ls -la` 诊断显示为 `----------` (chmod 000)。使用 `chmod 644` 修复。之前:`Permission denied`。之后:文件成功读取。
## 模拟并解决的事件
### 事件 1 — 服务宕机 (Nginx 崩溃)
**症状:** 网站未返回任何响应 (`curl` → `000`)
**诊断步骤:**
```
# 检查服务是否正在运行
sudo systemctl status nginx --no-pager
# → Active: inactive (dead)
# 检查日志以获取崩溃原因
sudo journalctl -u nginx --since "10 minutes ago" --no-pager
# → Deactivated successfully at 12:04:05 (clean stop, not a crash)
```
**解决:**
```
sudo systemctl start nginx
# 验证
curl -o /dev/null -s -w "%{http_code}" http://localhost
# → 200
```
**根本原因:** 服务停止(现实中的等价情况:OOM kill、部署脚本失败,或被其他工程师手动停止)
**RCA:** 在 `nginx_up` 指标上添加 Grafana 告警,以便在 1 分钟内捕获未来的服务停止情况
### 事件 2 — Permission Denied
**症状:** 应用程序无法读取配置文件 — `Permission denied`
**诊断步骤:**
```
cat /tmp/config.txt
# → cat: /tmp/config.txt: Permission denied
ls -la /tmp/config.txt
# → ---------- 1 ubuntu ubuntu 50 Jul 6 12:09 /tmp/config.txt
# All dashes = chmod 000 = 任何人都无权限
```
**解决:**
```
chmod 644 /tmp/config.txt
# 验证
ls -la /tmp/config.txt
# → -rw-r--r-- (owner read/write, others read)
cat /tmp/config.txt
# → Database connection string: prod-db.internal:5432 ✓
```
**根本原因:** 部署脚本覆盖了文件权限 — 在不保留权限位的自动部署后很常见
### 事件 3 — 磁盘空间
**症状:** 服务器运行缓慢,应用程序无法写入日志
**诊断步骤:**
```
# 检查整体磁盘使用情况
df -h
# → D:\ at 98% — nearly full
# 查找占用空间的内容
sudo du -sh /tmp/*
# → 500M /tmp/bigfile ← identified the large file
```
**解决:**
```
rm /tmp/bigfile
# 验证空间已恢复
df -h /
# → Use% dropped back to 1%
```
**根本原因:** 大型临时文件未清理。现实中的等价情况:失控的日志文件、未压缩的备份,或遗留在 `/tmp` 中的失败部署产物
## 使用的关键命令
### 服务管理
```
sudo systemctl status nginx --no-pager # check service health
sudo systemctl start nginx # start stopped service
sudo systemctl stop nginx # stop service (simulate crash)
sudo systemctl enable nginx # auto-start on boot
sudo journalctl -u nginx --no-pager # view service logs
```
### 日志分析
```
sudo tail -f /var/log/nginx/access.log # live log watching
grep -i "error" /var/log/nginx/error.log # search for errors
grep -A 5 "error" app.log # 5 lines after each error
grep -i "error" app.log | wc -l # count errors
```
### 磁盘与权限
```
df -h # disk usage overview
du -sh /var/log/* # folder sizes
ls -la /path/to/file # check permissions
chmod 644 file # fix permissions
```
### 监控验证
```
curl http://localhost:9100/metrics # verify Node Exporter
curl http://localhost:9090 # verify Prometheus
curl -o /dev/null -s -w "%{http_code}" http://localhost # HTTP status check
```
### 压力测试
```
sudo apt install stress -y
stress --cpu 16 --timeout 400 # max out all 16 cores for 400s
```
## 告警规则 — CPU High
**查询:**
```
100 - (avg by(instance)(rate(node_cpu_seconds_total{mode="idle"}[5m])) * 100)
```
**条件:** IS ABOVE 80
**Pending 周期:** 5 分钟(防止因短暂峰值产生误报)
**观察到的结果:** Normal → Pending → Firing (在约 95% CPU 时) → Normal (在停止压力测试后)
## Prometheus 配置
```
global:
scrape_interval: 15s
scrape_configs:
- job_name: 'node_exporter'
static_configs:
- targets: ['localhost:9100']
```
## 展示的技能
`Linux CLI` · `SSH` · `systemctl` · `journalctl` · `chmod` · `Nginx` · `Prometheus` · `Grafana` · `PromQL` · `Node Exporter` · `Log analysis` · `Incident response` · `Alert configuration` · `WSL2`
## 面试回答
标签:BurpSuite集成, Grafana, Nginx, 告警系统, 实验环境, 自定义请求头, 运维监控