Kruthikarya/Cloud-Native-Observability-Incident-Response-Platform-
GitHub: Kruthikarya/Cloud-Native-Observability-Incident-Response-Platform-
基于 Spring Boot 微服务架构的云原生可观测性平台,为 DevOps 和 SRE 团队提供基础设施监控、告警管理与事件响应的一体化解决方案。
Stars: 1 | Forks: 0
# 云原生可观测性与事件响应平台
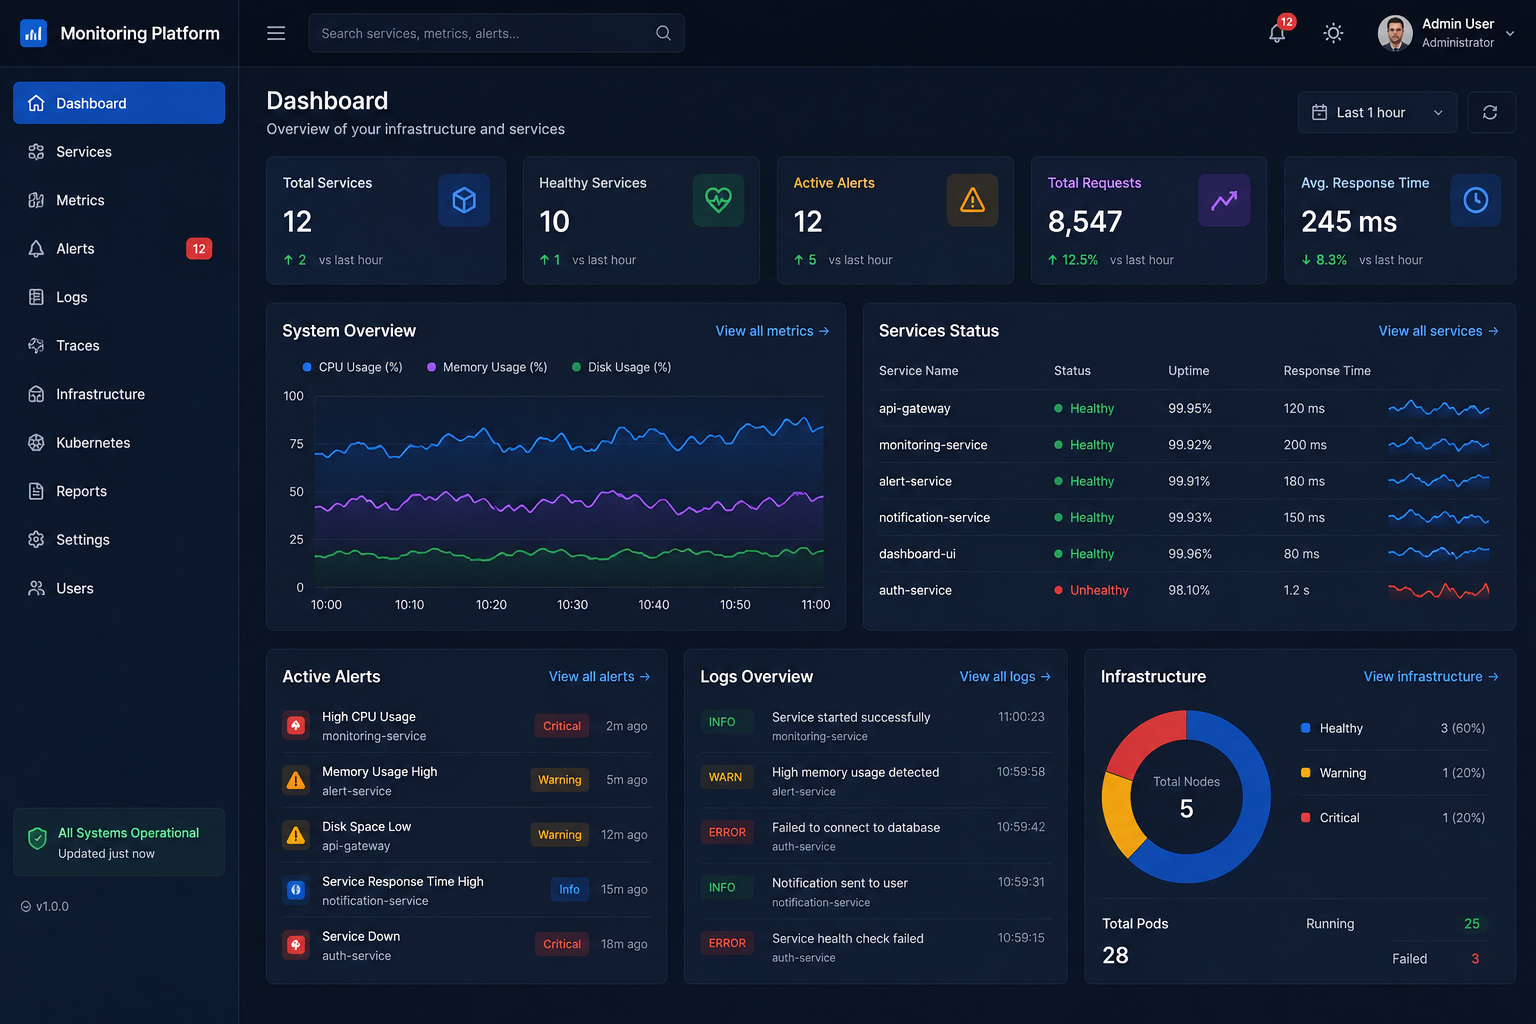
面向生产的 Spring Boot 微服务平台,适用于 DevOps、SRE、监控、事件响应、Kubernetes 可见性、CI/CD 就绪、分布式追踪、集中式日志记录和运维仪表板。
该项目模拟了 Datadog、Grafana Cloud、New Relic 和 Dynatrace 等企业级监控产品,同时保持代码库易于进行本地开发。
 ## 架构
```
flowchart LR
UI[dashboard-ui] --> GW[api-gateway]
GW --> AUTH[auth-service]
GW --> MON[monitoring-service]
GW --> ALERT[alert-service]
GW --> NOTIFY[notification-service]
ALERT --> NOTIFY
AUTH --> PG[(PostgreSQL)]
MON --> PG
ALERT --> PG
NOTIFY --> PG
MON --> PROM[Prometheus]
PROM --> GRAF[Grafana]
GW --> ZIP[Zipkin]
AUTH --> ZIP
MON --> ZIP
ALERT --> ZIP
NOTIFY --> ZIP
GW --> ELK[Elasticsearch + Logstash + Kibana]
REG[Eureka Service Registry] --- GW
CFG[Config Server] --- GW
```
## 服务
| 组件 | 端口 | 用途 |
| --- | ---: | --- |
| `service-registry` | 8761 | Eureka 服务发现 |
| `config-server` | 8888 | 集中式 Spring Cloud Config |
| `api-gateway` | 8080 | 路由、CORS、重试、熔断器、关联 ID |
| `auth-service` | 8081 | JWT 登录与 RBAC |
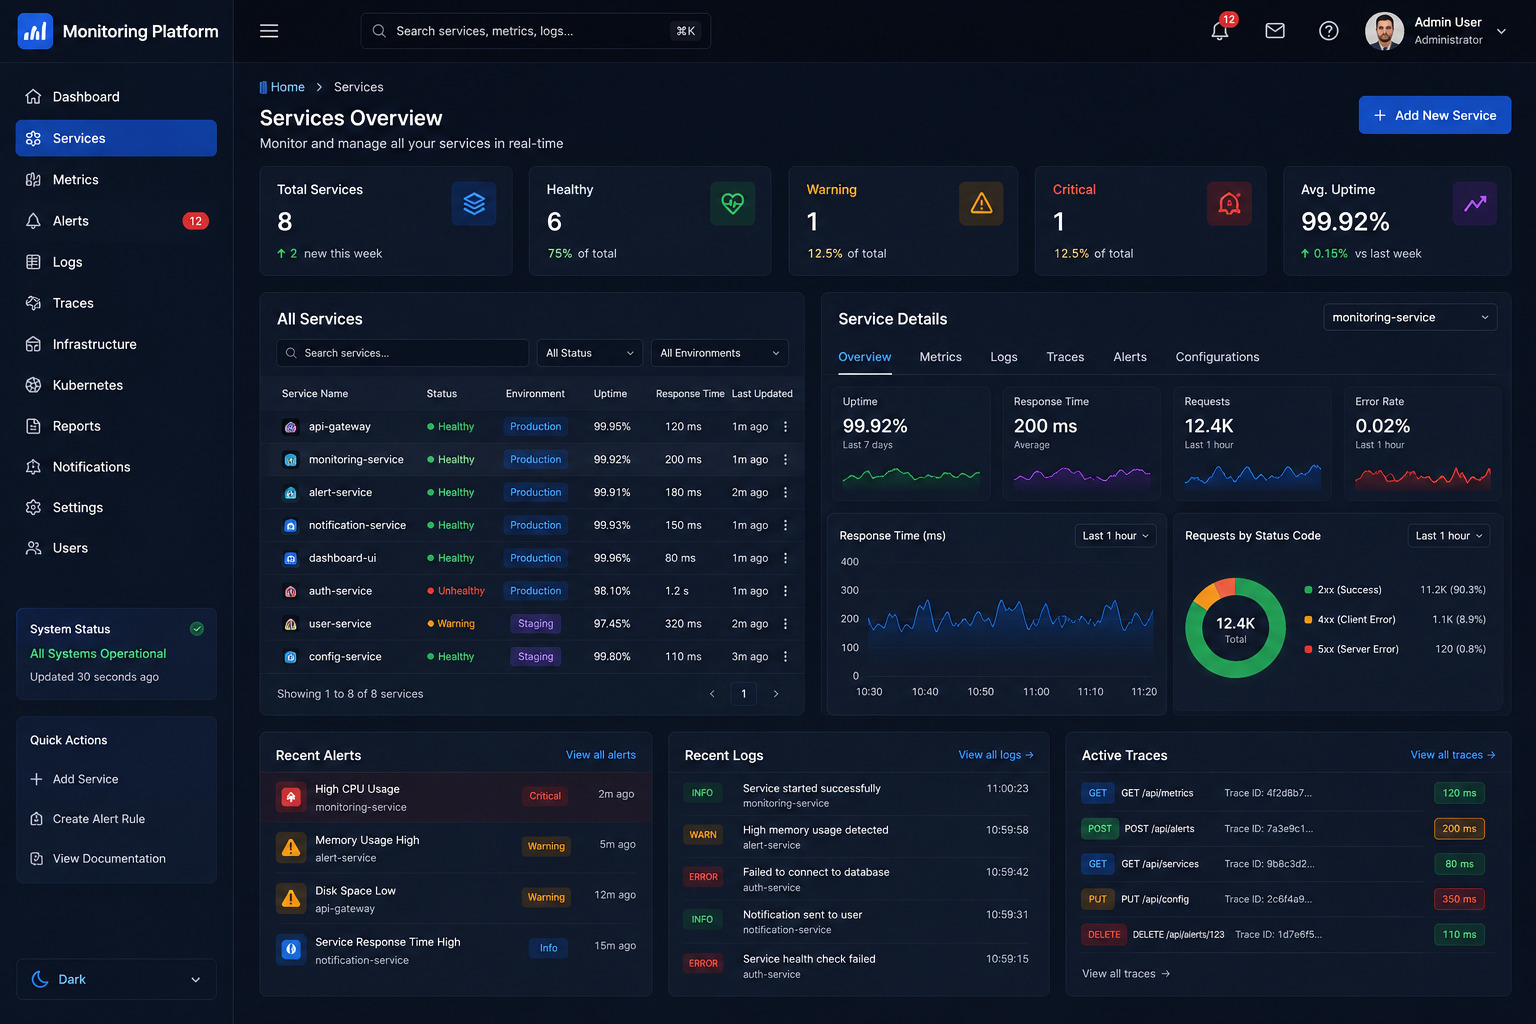
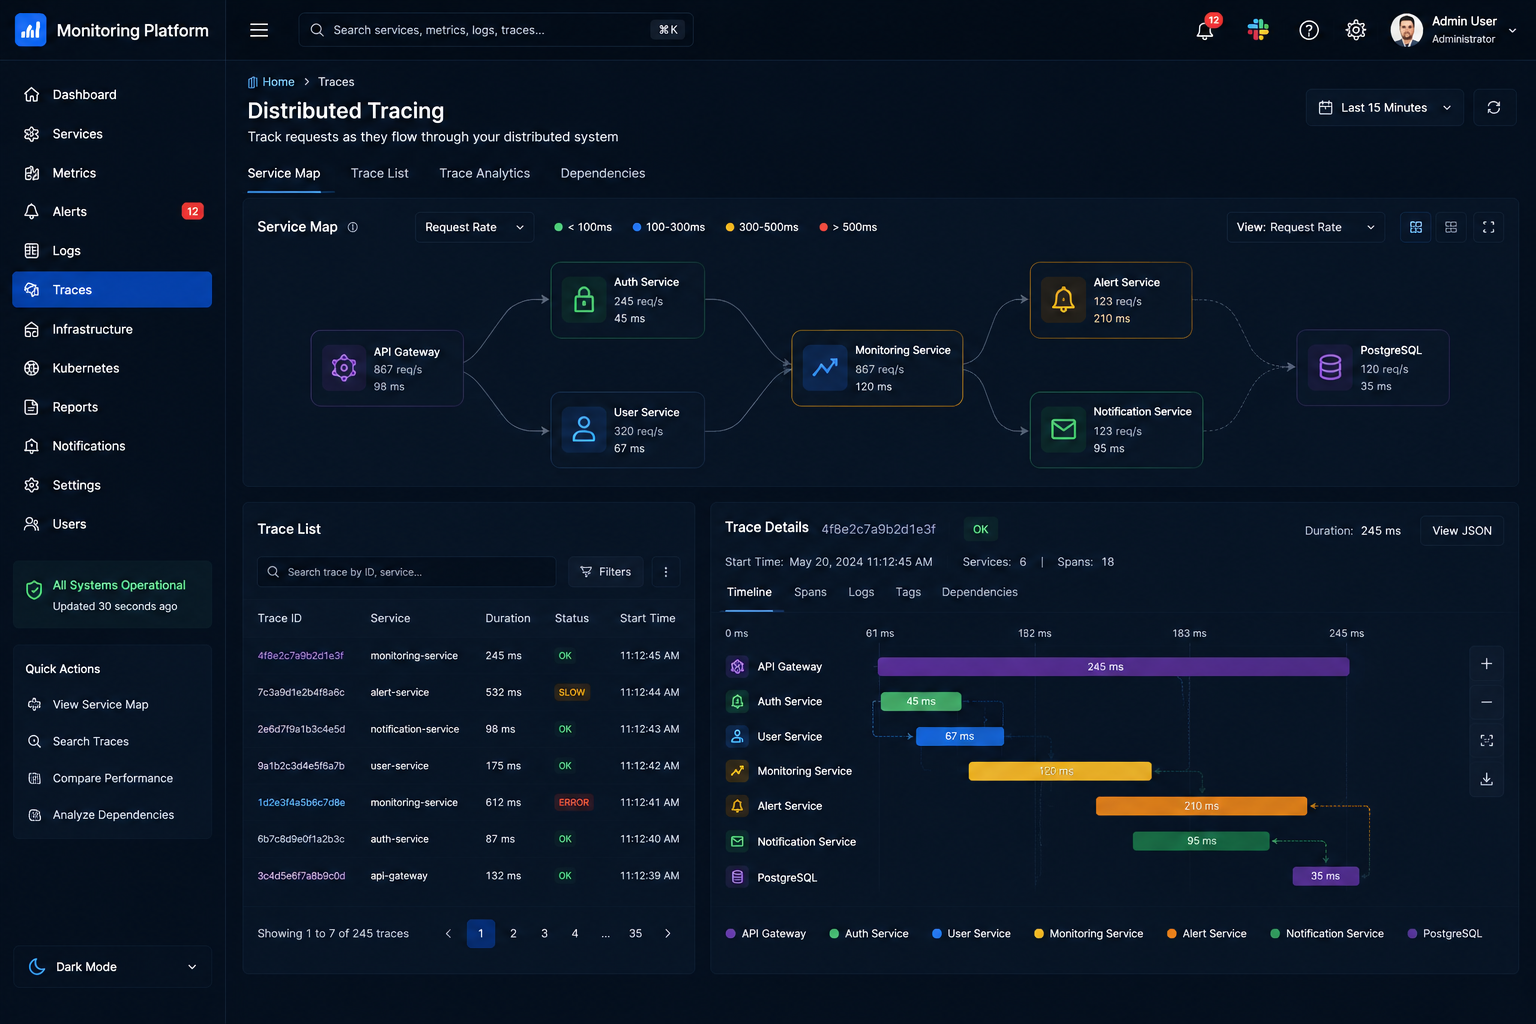
| `monitoring-service` | 8082 | 基础设施、Kubernetes、追踪、报告 |
| `alert-service` | 8083 | 告警规则、告警、事件、时间线 |
| `notification-service` | 8084 | Slack/电子邮件/Discord/短信模拟发送历史 |
| `dashboard-ui` | 3000 | React SRE 仪表板 |
## 已实现的功能
- 包含 Eureka、Config Server、API Gateway、OpenAPI、Actuator、Prometheus 指标和 Zipkin 追踪的 Spring Boot 微服务。
- 使用 PostgreSQL 持久化,为身份验证、监控、告警和通知提供独立的数据库。
- 具有 `ADMIN`、`DEVOPS_ENGINEER`、`SRE_ENGINEER` 和 `VIEWER` 角色的 JWT 身份验证。
- 用于 CPU、内存、磁盘、网络、正常运行时间、可用性和 CSV 报告的基础设施监控 API。
- 用于集群概览、Pod、部署、命名空间、重启、HPA、副本和 CrashLoopBackOff 检测的 Kubernetes 监控 API。
- 具备阈值规则、告警状态、自动创建事件、事件分配、根因记录和解决功能的告警管理。
- 包含 Slack、电子邮件、Discord 和模拟短信持久化通道历史记录的通知服务。
- 围绕告警到通知分发机制的 Resilience4j 熔断器。
- Dockerfiles、Docker Compose、Kubernetes 清单、Helm 启动 chart、Prometheus 配置、Grafana 仪表板配置、ELK pipeline 配置以及 GitHub Actions CI/CD。
- 与所提供的监控平台参考风格相匹配的深色响应式 React 仪表板。
## 快速开始
如果需要覆盖默认配置,请复制示例环境文件:
```
cp .env.example .env
```
构建 Spring 服务:
```
mvn clean package
```
启动完整的本地技术栈:
```
docker compose up --build
```
仅在前端开发期间运行仪表板:
```
powershell -NoProfile -ExecutionPolicy Bypass -File .\scripts\start-dashboard-dev.ps1
```
该辅助脚本默认在 http://127.0.0.1:3002 上启动 Vite。它特意通过 PowerShell 调用 `npm`,而不是通过 `cmd start` 启动 `npm.cmd`,从而避免了诸如 `C:\Program Files\nodejs\npm.cmd` 等路径周围的引号问题。
访问入口:
| 应用 | URL |
| --- | --- |
| 仪表板 UI | http://localhost:3000 |
| API Gateway | http://localhost:8080 |
| Eureka | http://localhost:8761 |
| Prometheus | http://localhost:9090 |
| Grafana | http://localhost:3001 |
| Zipkin | http://localhost:9411 |
| Kibana | http://localhost:5601 |
演示用户:
| 角色 | 邮箱 | 密码 |
| --- | --- | --- |
| Admin | `admin@ops.local` | `admin123` |
| DevOps | `devops@ops.local` | `devops123` |
| SRE | `sre@ops.local` | `sre123` |
| Viewer | `viewer@ops.local` | `viewer123` |
## API 示例
```
curl -X POST http://localhost:8080/api/auth/login \
-H "Content-Type: application/json" \
-d '{"email":"admin@ops.local","password":"admin123"}'
```
```
curl http://localhost:8080/api/monitoring/infra/summary
curl http://localhost:8080/api/monitoring/kubernetes/pods
curl http://localhost:8080/api/monitoring/traces/dependencies
curl http://localhost:8080/api/alerts
curl http://localhost:8080/api/incidents
curl http://localhost:8080/api/notifications
```
导入 [postman/observability-platform.postman_collection.json](postman/observability-platform.postman_collection.json) 以获取现成的 API 集合。
## Kubernetes
应用清单:
```
kubectl apply -f k8s/
kubectl -n observability get pods
```
或者安装启动 Helm chart:
```
helm install observability ./helm/observability-platform -n observability --create-namespace
```
Kubernetes 资产包括命名空间、ConfigMaps、Secrets、PostgreSQL、核心服务、Prometheus、Grafana、Zipkin、Elasticsearch、Kibana、kube-state-metrics、HPA、就绪探针、存活探针和 Ingress。
## CI/CD
位于 [.github/workflows/ci-cd.yml](.github/workflows/ci-cd.yml) 的工作流会运行测试、打包 JAR、构建 Docker 镜像、推送到 Docker Hub、部署到 Kubernetes、检查上线健康状况,并在失败时回滚关键部署。
所需的 GitHub Secrets:
- `DOCKERHUB_USERNAME`
- `DOCKERHUB_TOKEN`
- `KUBE_CONFIG`(Base64 编码的 kubeconfig)
## 开发说明
- 生成的监控数据是合成的,因此即使没有实际的生产集群,该平台也能发挥作用。
- Prometheus 还会在 Docker Compose 中抓取 Node Exporter 和 cAdvisor。
- Grafana 会自动加载内置的平台概览仪表板。
- 标准 API 错误使用 `timestamp`、`status`、`error`、`message` 和 `path`。
- 本地必须安装 Maven 才能运行 Java 构建;此工作区目前有可用的 Java 和 Node,但在初始搭建时 PATH 中没有 Maven。
## 架构
```
flowchart LR
UI[dashboard-ui] --> GW[api-gateway]
GW --> AUTH[auth-service]
GW --> MON[monitoring-service]
GW --> ALERT[alert-service]
GW --> NOTIFY[notification-service]
ALERT --> NOTIFY
AUTH --> PG[(PostgreSQL)]
MON --> PG
ALERT --> PG
NOTIFY --> PG
MON --> PROM[Prometheus]
PROM --> GRAF[Grafana]
GW --> ZIP[Zipkin]
AUTH --> ZIP
MON --> ZIP
ALERT --> ZIP
NOTIFY --> ZIP
GW --> ELK[Elasticsearch + Logstash + Kibana]
REG[Eureka Service Registry] --- GW
CFG[Config Server] --- GW
```
## 服务
| 组件 | 端口 | 用途 |
| --- | ---: | --- |
| `service-registry` | 8761 | Eureka 服务发现 |
| `config-server` | 8888 | 集中式 Spring Cloud Config |
| `api-gateway` | 8080 | 路由、CORS、重试、熔断器、关联 ID |
| `auth-service` | 8081 | JWT 登录与 RBAC |
| `monitoring-service` | 8082 | 基础设施、Kubernetes、追踪、报告 |
| `alert-service` | 8083 | 告警规则、告警、事件、时间线 |
| `notification-service` | 8084 | Slack/电子邮件/Discord/短信模拟发送历史 |
| `dashboard-ui` | 3000 | React SRE 仪表板 |
## 已实现的功能
- 包含 Eureka、Config Server、API Gateway、OpenAPI、Actuator、Prometheus 指标和 Zipkin 追踪的 Spring Boot 微服务。
- 使用 PostgreSQL 持久化,为身份验证、监控、告警和通知提供独立的数据库。
- 具有 `ADMIN`、`DEVOPS_ENGINEER`、`SRE_ENGINEER` 和 `VIEWER` 角色的 JWT 身份验证。
- 用于 CPU、内存、磁盘、网络、正常运行时间、可用性和 CSV 报告的基础设施监控 API。
- 用于集群概览、Pod、部署、命名空间、重启、HPA、副本和 CrashLoopBackOff 检测的 Kubernetes 监控 API。
- 具备阈值规则、告警状态、自动创建事件、事件分配、根因记录和解决功能的告警管理。
- 包含 Slack、电子邮件、Discord 和模拟短信持久化通道历史记录的通知服务。
- 围绕告警到通知分发机制的 Resilience4j 熔断器。
- Dockerfiles、Docker Compose、Kubernetes 清单、Helm 启动 chart、Prometheus 配置、Grafana 仪表板配置、ELK pipeline 配置以及 GitHub Actions CI/CD。
- 与所提供的监控平台参考风格相匹配的深色响应式 React 仪表板。
## 快速开始
如果需要覆盖默认配置,请复制示例环境文件:
```
cp .env.example .env
```
构建 Spring 服务:
```
mvn clean package
```
启动完整的本地技术栈:
```
docker compose up --build
```
仅在前端开发期间运行仪表板:
```
powershell -NoProfile -ExecutionPolicy Bypass -File .\scripts\start-dashboard-dev.ps1
```
该辅助脚本默认在 http://127.0.0.1:3002 上启动 Vite。它特意通过 PowerShell 调用 `npm`,而不是通过 `cmd start` 启动 `npm.cmd`,从而避免了诸如 `C:\Program Files\nodejs\npm.cmd` 等路径周围的引号问题。
访问入口:
| 应用 | URL |
| --- | --- |
| 仪表板 UI | http://localhost:3000 |
| API Gateway | http://localhost:8080 |
| Eureka | http://localhost:8761 |
| Prometheus | http://localhost:9090 |
| Grafana | http://localhost:3001 |
| Zipkin | http://localhost:9411 |
| Kibana | http://localhost:5601 |
演示用户:
| 角色 | 邮箱 | 密码 |
| --- | --- | --- |
| Admin | `admin@ops.local` | `admin123` |
| DevOps | `devops@ops.local` | `devops123` |
| SRE | `sre@ops.local` | `sre123` |
| Viewer | `viewer@ops.local` | `viewer123` |
## API 示例
```
curl -X POST http://localhost:8080/api/auth/login \
-H "Content-Type: application/json" \
-d '{"email":"admin@ops.local","password":"admin123"}'
```
```
curl http://localhost:8080/api/monitoring/infra/summary
curl http://localhost:8080/api/monitoring/kubernetes/pods
curl http://localhost:8080/api/monitoring/traces/dependencies
curl http://localhost:8080/api/alerts
curl http://localhost:8080/api/incidents
curl http://localhost:8080/api/notifications
```
导入 [postman/observability-platform.postman_collection.json](postman/observability-platform.postman_collection.json) 以获取现成的 API 集合。
## Kubernetes
应用清单:
```
kubectl apply -f k8s/
kubectl -n observability get pods
```
或者安装启动 Helm chart:
```
helm install observability ./helm/observability-platform -n observability --create-namespace
```
Kubernetes 资产包括命名空间、ConfigMaps、Secrets、PostgreSQL、核心服务、Prometheus、Grafana、Zipkin、Elasticsearch、Kibana、kube-state-metrics、HPA、就绪探针、存活探针和 Ingress。
## CI/CD
位于 [.github/workflows/ci-cd.yml](.github/workflows/ci-cd.yml) 的工作流会运行测试、打包 JAR、构建 Docker 镜像、推送到 Docker Hub、部署到 Kubernetes、检查上线健康状况,并在失败时回滚关键部署。
所需的 GitHub Secrets:
- `DOCKERHUB_USERNAME`
- `DOCKERHUB_TOKEN`
- `KUBE_CONFIG`(Base64 编码的 kubeconfig)
## 开发说明
- 生成的监控数据是合成的,因此即使没有实际的生产集群,该平台也能发挥作用。
- Prometheus 还会在 Docker Compose 中抓取 Node Exporter 和 cAdvisor。
- Grafana 会自动加载内置的平台概览仪表板。
- 标准 API 错误使用 `timestamp`、`status`、`error`、`message` 和 `path`。
- 本地必须安装 Maven 才能运行 Java 构建;此工作区目前有可用的 Java 和 Node,但在初始搭建时 PATH 中没有 Maven。标签:API集成, Spring Boot, 内容过滤, 可观测性, 域名枚举, 子域名突变, 测试用例, 自定义请求头, 请求拦截, 越狱测试, 运维监控