Ishan101-hub/traffic-flow-data-analysis
GitHub: Ishan101-hub/traffic-flow-data-analysis
一个基于 Python 标准库的交通调查数据分析工具,从 CSV 文件计算 16 项统计指标并通过 Tkinter 直方图可视化两个交叉口的车流分布。
Stars: 0 | Forks: 0
# 交通流量数据分析
一个 Python 控制台和 GUI 应用程序,用于分析来自两个道路交叉口的真实交通调查数据,计算每个数据集的 16 项统计结果,并渲染一个交互式 Tkinter 直方图,比较每个交叉口每小时的车辆频率。可以在一次会话中加载和分析多个 CSV 数据集。
本项目为*软件开发 1 (COSC006C)* —— 威斯敏斯特大学 / 信息科技学院 (Informatics Institute of Technology) 软件工程 4 级的课程作业。
## 目录
- [概述](#overview)
- [功能](#features)
- [技术栈](#tech-stack)
- [项目结构](#project-structure)
- [CSV 数据格式](#csv-data-format)
- [如何运行](#how-to-run)
- [计算结果](#computed-outcomes)
- [直方图 GUI](#histogram-gui)
- [模块说明](#module-breakdown)
- [示例输出](#sample-output)
## 概述
该程序读取名为 `traffic_dataDD MM YYYY.csv`(例如 `traffic_data15062024.csv`)格式的交通调查 CSV 文件。用户通过经过验证的控制台提示输入日期,系统将加载匹配的文件,计算并显示 16 项统计结果,将结果追加到 `results.txt` 中,并打开一个 Tkinter 直方图窗口,并排显示两个交叉口每小时的车辆数。
## 功能
- **经过验证的日期输入** —— 日(DD)、月(MM)、年(YYYY) 分别进行范围检查、类型检查和日历有效性验证(例如,拒绝输入 2 月 31 日)
- 每个数据集 **16 项计算出的交通结果**(完整列表见下文)
- **结果保存**至 `results.txt`(使用追加模式)—— 多次运行的结果会累积在一个文件中
- **Tkinter 直方图** —— 两个交叉口每小时并排显示柱状图,按比例缩放,带有颜色图例和标题中的日期
- **多数据集支持** —— 每个文件分析后出现 Y/N 提示;选择 Y 会清除之前的数据和 `results.txt`,然后循环请求输入新日期
- **FileNotFoundError 处理** —— 如果文件不存在,会重新提示用户输入新日期
- **模块化架构** —— Tasks A/B/C 在一个文件中,被另一个文件中的 Tasks D/E 导入
## 技术栈
| 层级 | 技术 |
|-------|-----------|
| **语言** | Python 3 |
| **GUI 框架** | Tkinter (`tk.Canvas`, `tk.Tk`) |
| **数据解析** | `csv.DictReader` |
| **日期处理** | `datetime`, `date`, `strptime` |
| **文件 I/O** | 内置 `open()`,支持读取/写入/追加模式 |
| **标准库** | `csv`, `datetime`, `tkinter` |
| **IDE** | 任何 Python IDE / 终端 |
| **版本控制** | Git, GitHub |
不需要第三方包 —— 仅在 Python 3 标准库上即可运行。
## 项目结构
```
TRAFFIC-FLOW-DATA-ANALYSIS/
│
├── w2120028_ABC.py # Tasks A, B, C — validation, data processing, file output
├── w2120028_DE.py # Tasks D, E — Tkinter histogram, multi-file processor
│
├── traffic_data15062024.csv # Survey data — 15 June 2024
├── traffic_data16062024.csv # Survey data — 16 June 2024
├── traffic_data21062024.csv # Survey data — 21 June 2024
│
├── results.txt # Auto-generated output — excluded from version control
├── .gitignore
└── README.md
```
## CSV 数据格式
每个 CSV 文件在交叉口记录的每辆车对应一行:
| 列名 | 类型 | 示例 |
|--------|------|---------|
| `JunctionName` | String | `Elm Avenue/Rabbit Road` |
| `Date` | String | `15/06/2024` |
| `timeOfDay` | Time | `08:34:12` |
| `travel_Direction_in` | String | `N` |
| `travel_Direction_out` | String | `N` |
| `Weather_Conditions` | String | `Heavy Rain` |
| `JunctionSpeedLimit` | Integer | `30` |
| `VehicleSpeed` | Integer | `34` |
| `VehicleType` | String | `Truck` |
| `elctricHybrid` | Boolean | `True` |
记录了两个交叉口:**Elm Avenue/Rabbit Road** 和 **Hanley Highway/Westway**。
## 如何运行
**环境要求:** Python 3.8+(无需外部包)
```
# 1. Clone the repository
git clone https://github.com//traffic-flow-data-analysis.git
cd traffic-flow-data-analysis
# 2. 运行主程序(Tasks A–E,包含直方图)
python w2120028_DE.py
# OR 仅运行 Tasks A–C(控制台输出,无 GUI)
python w2120028_ABC.py
```
出现提示时:
```
Please enter the day of the survey in the format DD: 15
Please enter the month of the survey in the format MM: 06
Please enter the year of the survey in the format YYYY: 2024
```
这将加载 `traffic_data15062024.csv`,打印所有 16 项结果,保存到 `results.txt`,并打开直方图窗口。
## 计算结果
对于每个加载的 CSV 文件,程序会计算并显示以下所有内容:
| # | 结果 |
|---|---------|
| 1 | 选定的数据文件名 |
| 2 | 该日期的车辆总数 |
| 3 | 卡车总数 |
| 4 | 电动/混合动力车辆总数 |
| 5 | 两轮车辆(自行车、摩托车、滑板车)总数 |
| 6 | 从 Elm Avenue/Rabbit Road 向北驶出的公交车总数 |
| 7 | 穿过两个交叉口且未转弯(进方向 == 出方向)的车辆总数 |
| 8 | 卡车占车辆总数的百分比(四舍五入到最接近的 %) |
| 9 | 24 小时内每小时自行车的平均数量 |
| 10 | 记录的超速车辆总数 |
| 11 | 穿过 Elm Avenue/Rabbit Road 的车辆总数 |
| 12 | 穿过 Hanley Highway/Westway 的车辆总数 |
| 13 | 穿过 Elm Avenue/Rabbit Road 的车辆中滑板车所占的百分比 |
| 14 | Hanley Highway/Westway 上任意单小时内最高的车辆数 |
| 15 | Hanley Highway/Westway 上出现交通高峰的时间段 |
| 16 | 记录到降雨(大雨或小雨)的小时数 |
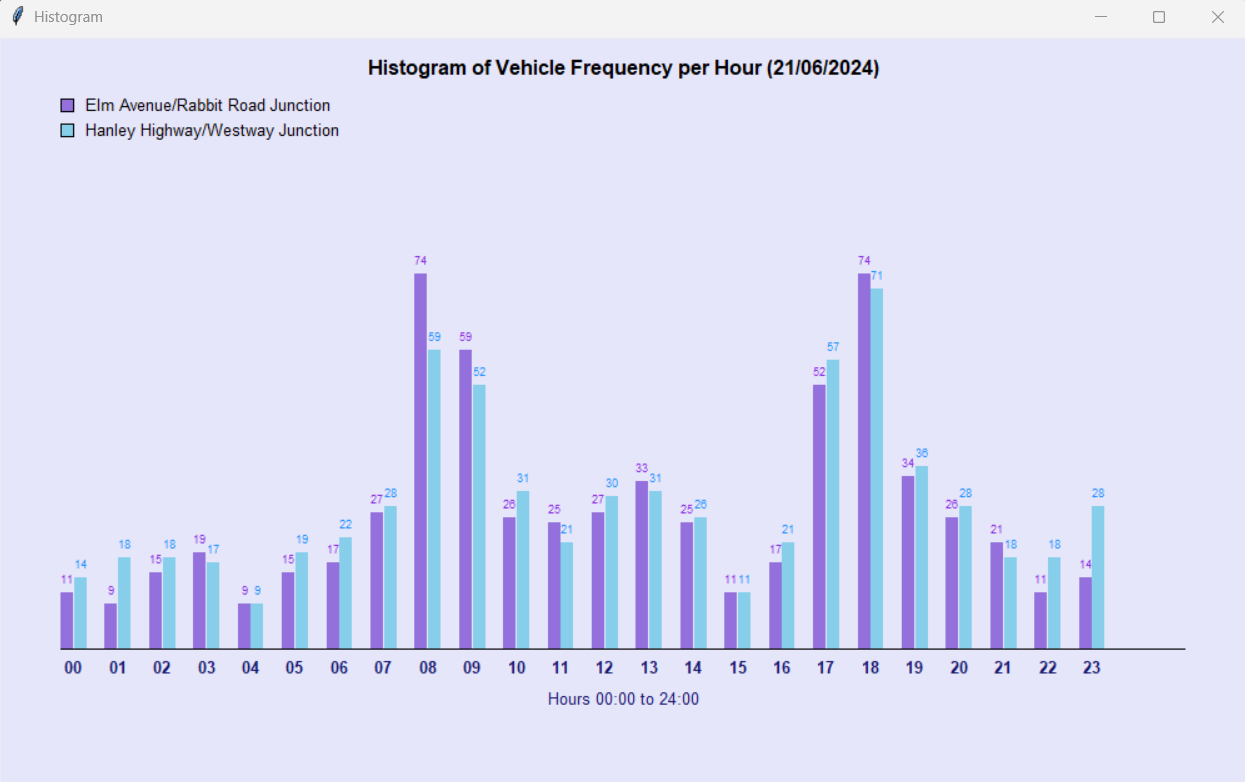
## 直方图 GUI
Tkinter 窗口(`HistogramApp`)显示:
- **标题:** `Histogram of Vehicle Frequency per Hour (DD/MM/YYYY)`
- **每小时两根柱状条**(x 轴为 00–23 小时):
- **紫色** —— Elm Avenue/Rabbit Road
- **天蓝色** —— Hanley Highway/Westway
- 每根柱状条上方显示车辆数
- 柱状条根据两个交叉口中每小时的最高计数值按比例缩放
- 左上角的 **颜色图例**
- **X 轴标签:** `Hours 00:00 to 24:00`
- 画布:1000×600px,淡紫色背景
 ## 模块说明
### `w2120028_ABC.py` — Tasks A, B, C
**Task A — 输入验证**
`validate_date_input()` —— 分别提示输入日、月、年。每个字段会循环直到有效:
- 类型检查:拒绝非整数,提示 `"Integer required!!!"`
- 范围检查:日 1–31,月 1–12,年 2000–2024
- 日历检查:`date(year, month, day)` 捕获无效组合(例如 4 月 31 日)
- `process_file_name(day, month, year)` —— 将日/月补零并返回 `traffic_dataDDMMYYYY.csv`
- `validate_continue_input()` —— 使用 `match/case` 的 Y/N 提示,去除空白字符,不区分大小写
**Task B — 处理**
`process_csv_data(file_name)` —— 使用 `csv.DictReader` 读取 CSV,遍历每一行,并使用在每次调用开始时重置的全局变量累加所有 16 个结果值。返回一个 `outcomes` 列表。
`display_outcomes(outcomes)` —— 格式化并打印所有 16 项结果;返回格式化后的字符串以供保存。
**Task C — 文件输出**
`save_results_to_file(output_text)` —— 使用 `open("results.txt", "a")` 将格式化后的输出追加到 `results.txt` 中。
### `w2120028_DE.py` — Tasks D, E
**Task D — `HistogramApp` 类**
| 方法 | 描述 |
|--------|-------------|
| `__init__` | 存储 `traffic_data` 字典和 `survey_date`,创建 `tk.Tk()` 实例 |
| `setup_window()` | 设置 1000×600 几何尺寸,创建淡紫色画布 |
| `add_legend()` | 绘制带有日期的标题、两个颜色图例框、x 轴标签 |
| `draw_histogram()` | 循环 0–23 小时,计算与 `max_value` 成比例的柱状条高度,绘制每小时的两根柱状条及其上方的数值标签和下方的小时标签 |
| `run()` | 依次调用 setup、legend、histogram,然后调用 `mainloop()` |
**Task E — `MultiCSVProcessor` 类**
| 方法 | 描述 |
|--------|-------------|
| `__init__` | 初始化两个包含 24 个零的 `hour_counts` 数组(每个交叉口一个) |
| `handle_user_interaction()` | 完整的日期验证循环(映射 Task A,为类使用而重新实现) |
| `load_csv_file(file_name)` | 读取 CSV,按交叉口填充 `hour_counts` 和 `hour_counts2`;返回 `True`/`False` |
| `process_file_name()` | 使用 f-string 补零返回格式化的文件名字符串 |
| `clear_previous_data()` | 重置小时计数数组,清空 `results.txt`,打印确认信息 |
| `process_files()` | 主循环:验证日期 → 构建文件名 → 加载 CSV → 调用 ABC 函数 → 构建 `traffic_data` 字典 → 启动 `HistogramApp` → Y/N 选择是否继续 |
## 示例输出
**控制台 (15/06/2024):**
```
Here is the requested traffic data.
*********************************
The selected data file: traffic_data15062024.csv
*********************************
The total number of vehicles for this date: 1037
The total number of trucks for this date: 109
The total number of electric vehicles for this date: 368
The total number of "two wheeled" vehicles for this date: 401
The total number of busses leaving Elm Avenue/Rabbit Road heading north: 15
The total number of vehicles passing through both junctions without turning: 363
The percentage of total vehicles recorded that are Trucks for this date: 11%
The average number Bicycles per hour for this date: 7
The total number of vehicles recorded as over the speed limit for this date: 205
The total number of vehicles recorded through Elm Avenue/Rabbit Road junction: 494
The total number of vehicles recorded through Hanley Highway/Westway junction: 543
10% of vehicles recorded through Elm Avenue/Rabbit Road that are Scooters.
The highest number of vehicles in an hour on Hanley Highway/Westway: 39
The most vehicles through Hanley Highway/Westway were recorded between: 18:00 between 19:00
The number of hours of rain for this date: 0
*********************************
```
## 模块说明
### `w2120028_ABC.py` — Tasks A, B, C
**Task A — 输入验证**
`validate_date_input()` —— 分别提示输入日、月、年。每个字段会循环直到有效:
- 类型检查:拒绝非整数,提示 `"Integer required!!!"`
- 范围检查:日 1–31,月 1–12,年 2000–2024
- 日历检查:`date(year, month, day)` 捕获无效组合(例如 4 月 31 日)
- `process_file_name(day, month, year)` —— 将日/月补零并返回 `traffic_dataDDMMYYYY.csv`
- `validate_continue_input()` —— 使用 `match/case` 的 Y/N 提示,去除空白字符,不区分大小写
**Task B — 处理**
`process_csv_data(file_name)` —— 使用 `csv.DictReader` 读取 CSV,遍历每一行,并使用在每次调用开始时重置的全局变量累加所有 16 个结果值。返回一个 `outcomes` 列表。
`display_outcomes(outcomes)` —— 格式化并打印所有 16 项结果;返回格式化后的字符串以供保存。
**Task C — 文件输出**
`save_results_to_file(output_text)` —— 使用 `open("results.txt", "a")` 将格式化后的输出追加到 `results.txt` 中。
### `w2120028_DE.py` — Tasks D, E
**Task D — `HistogramApp` 类**
| 方法 | 描述 |
|--------|-------------|
| `__init__` | 存储 `traffic_data` 字典和 `survey_date`,创建 `tk.Tk()` 实例 |
| `setup_window()` | 设置 1000×600 几何尺寸,创建淡紫色画布 |
| `add_legend()` | 绘制带有日期的标题、两个颜色图例框、x 轴标签 |
| `draw_histogram()` | 循环 0–23 小时,计算与 `max_value` 成比例的柱状条高度,绘制每小时的两根柱状条及其上方的数值标签和下方的小时标签 |
| `run()` | 依次调用 setup、legend、histogram,然后调用 `mainloop()` |
**Task E — `MultiCSVProcessor` 类**
| 方法 | 描述 |
|--------|-------------|
| `__init__` | 初始化两个包含 24 个零的 `hour_counts` 数组(每个交叉口一个) |
| `handle_user_interaction()` | 完整的日期验证循环(映射 Task A,为类使用而重新实现) |
| `load_csv_file(file_name)` | 读取 CSV,按交叉口填充 `hour_counts` 和 `hour_counts2`;返回 `True`/`False` |
| `process_file_name()` | 使用 f-string 补零返回格式化的文件名字符串 |
| `clear_previous_data()` | 重置小时计数数组,清空 `results.txt`,打印确认信息 |
| `process_files()` | 主循环:验证日期 → 构建文件名 → 加载 CSV → 调用 ABC 函数 → 构建 `traffic_data` 字典 → 启动 `HistogramApp` → Y/N 选择是否继续 |
## 示例输出
**控制台 (15/06/2024):**
```
Here is the requested traffic data.
*********************************
The selected data file: traffic_data15062024.csv
*********************************
The total number of vehicles for this date: 1037
The total number of trucks for this date: 109
The total number of electric vehicles for this date: 368
The total number of "two wheeled" vehicles for this date: 401
The total number of busses leaving Elm Avenue/Rabbit Road heading north: 15
The total number of vehicles passing through both junctions without turning: 363
The percentage of total vehicles recorded that are Trucks for this date: 11%
The average number Bicycles per hour for this date: 7
The total number of vehicles recorded as over the speed limit for this date: 205
The total number of vehicles recorded through Elm Avenue/Rabbit Road junction: 494
The total number of vehicles recorded through Hanley Highway/Westway junction: 543
10% of vehicles recorded through Elm Avenue/Rabbit Road that are Scooters.
The highest number of vehicles in an hour on Hanley Highway/Westway: 39
The most vehicles through Hanley Highway/Westway were recorded between: 18:00 between 19:00
The number of hours of rain for this date: 0
*********************************
```
标签:Python, Tkinter, 交通流量分析, 代码示例, 数据分析, 无后门, 桌面应用