evansnyanney/Principal-Geodesic-Based-3D-Point-Cloud-Clustering-Analysis

GitHub: evansnyanney/Principal-Geodesic-Based-3D-Point-Cloud-Clustering-Analysis

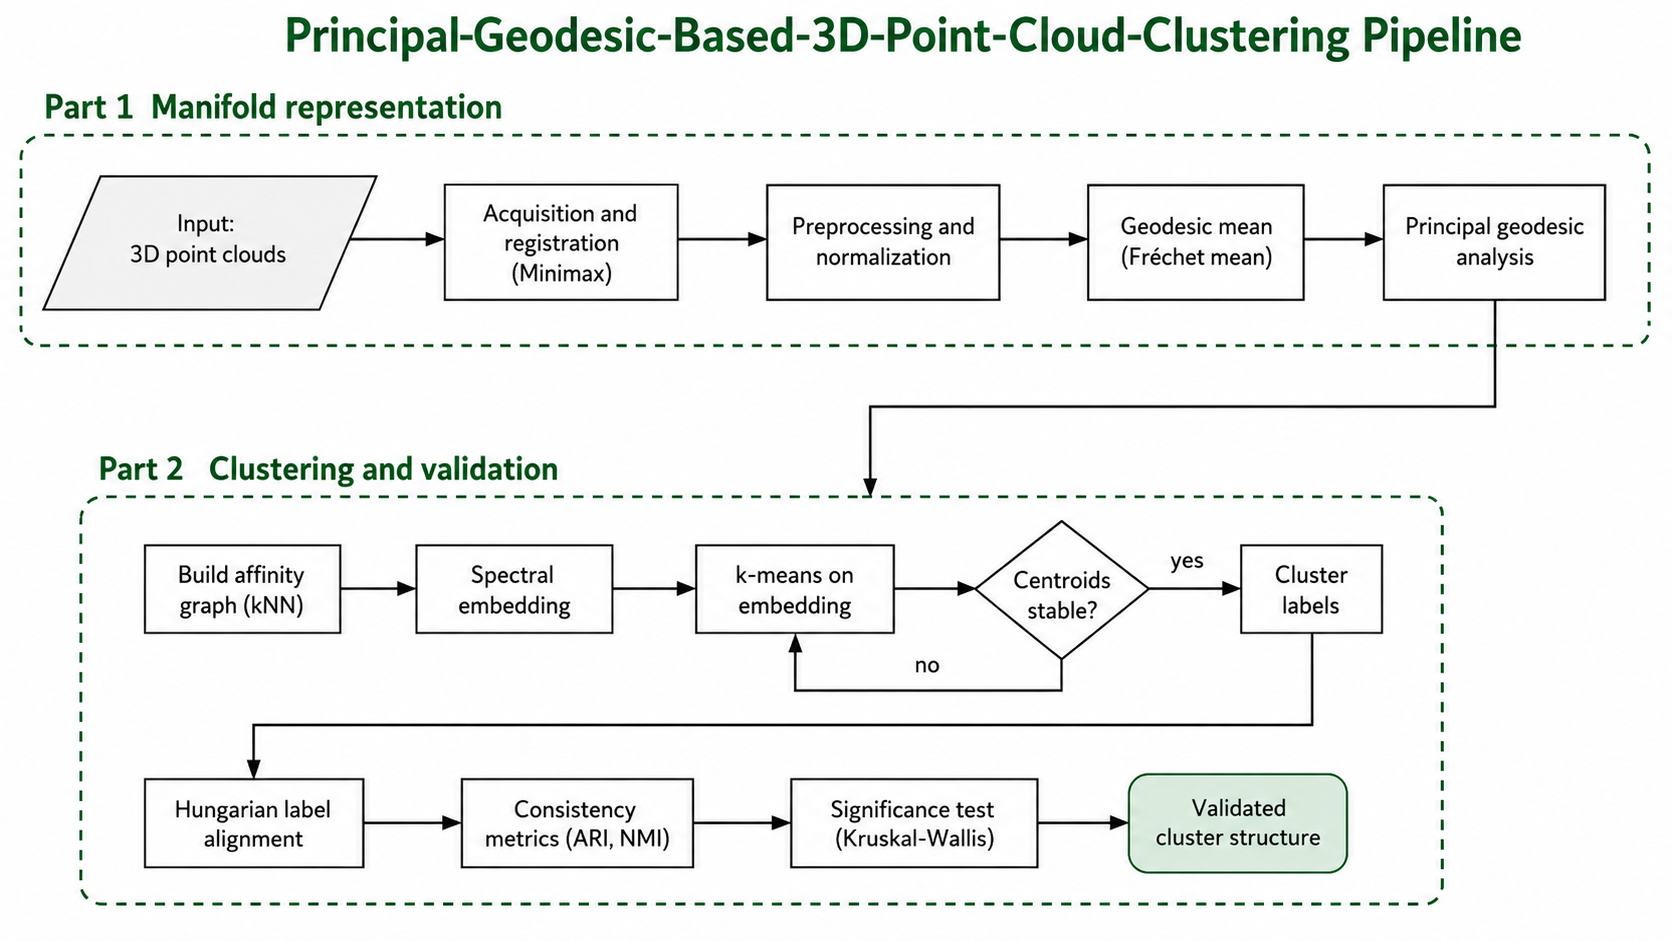
基于局部主测地线分析和谱聚类的 3D 点云无监督学习 pipeline,用于检测和验证制造零件之间的结构几何变化。

Stars: 0 | Forks: 0

# 使用无监督学习揭示嵌入在 3D 点云中的工艺与设计之间的关系 [![Paper DOI](https://img.shields.io/badge/Paper_DOI-10.1016%2Fj.mfglet.2025.06.169-blue.svg)](https://doi.org/10.1016/j.mfglet.2025.06.169) [![Software DOI](https://zenodo.org/badge/DOI/10.5281/zenodo.20690053.svg)](https://doi.org/10.5281/zenodo.20690053) [![License: MIT](https://img.shields.io/badge/License-MIT-blue.svg)](LICENSE) ![Python 版本](https://img.shields.io/badge/python-3.9%2B-blue) ## Pipeline 架构

PGA Pipeline Architecture

本仓库包含了由 Evans Nyanney 和 Zhaohui Geng 撰写的论文**“使用无监督学习揭示嵌入在 3D 点云中的工艺与设计之间的关系”**的代码。 它实现了一个用于 3D 点云分析的强大且端到端的无监督学习 pipeline。该项目使用局部主测地线分析(PGA)和谱聚类来检测和验证制造零件之间结构几何的变化。 该 pipeline 包括数据摄取、点云归一化、谱聚类、欧几得距离和 Fréchet 均值的计算、逐点方差关联以及全面的 3D 数据可视化。 ## 目录 - [安装说明](#installation) - [数据可用性](#data-availability) - [仓库结构](#repository-structure) - [方法论总结](#methodological-summary) - [典型工作流程](#typical-workflow) - [指标与报告](#metrics-and-reporting) - [引用](#citation) - [许可证](#license) ## 安装说明 ``` # 克隆 repository git clone https://github.com/evansnyanney/Principal-Geodesic-Based-3D-Point-Cloud-Clustering-Analysis.git cd Principal-Geodesic-Based-3D-Point-Cloud-Clustering-Analysis # 安装 dependencies pip install -r requirements.txt ``` ## 数据可用性 本仓库处理 3D 点云坐标扫描及相应的逐点方差数据。 要在本地重现结果,请将您的原始数据集(例如 `Freeform Landmarks`、`Half Ball Landmarks`)和方差 CSV 文件放入 `data/` 目录中。然后按照[典型工作流程](#typical-workflow)执行聚类并生成方差分布模型。 ### 使用不同的数据集 该 pipeline 架构旨在处理通用的 3D 点云集(`X`、`Y`、`Z` 坐标)。要使其适应不同的数据集,请确保您的输入文件为 CSV 格式,并更新 `pga_pipeline/data_loader.py` 或修改 `scripts/run_analysis.py` 中的路径。 ## 仓库结构 ``` landmarks3D/ # Root repository ├── pyproject.toml # Package configuration ├── README.md ├── LICENSE ├── requirements.txt │ ├── pga_pipeline/ # Source code modules │ ├── __init__.py │ ├── _version.py # Version string │ ├── config.py # Global constants and color palettes │ ├── data_loader.py # Data ingestion and parsing │ ├── geometry.py # Geometric operations, Fréchet means, and PGA │ ├── clustering.py # Spectral clustering and consistency validation │ ├── stats.py # Kruskal-Wallis testing and variance stats │ └── visualization.py # 3D plotting and density generation │ ├── scripts/ # CLI entry points │ ├── __init__.py │ └── run_analysis.py # Entry point for the full analysis pipeline │ ├── tests/ # Test suite │ ├── __init__.py │ ├── test_clustering.py # Tests for clustering algorithms │ └── test_geometry.py # Tests for geometric computations │ ├── data/ # Datasets and pointwise variance data │ ├── Freeform Landmarks/ │ ├── Half Ball Landmarks/ │ └── *.csv │ ├── DOCS/ # Documentation and figures │ └── results/ # Generated visual artifacts and CSVs ├── average_variance_plots/ ├── cluster_visualizations/ ├── means_visualizations/ ├── pga_results/ └── variance_distributions/ ``` ## 聚类一致性

Half Ball Variance Visualization Freeform Variance Visualization

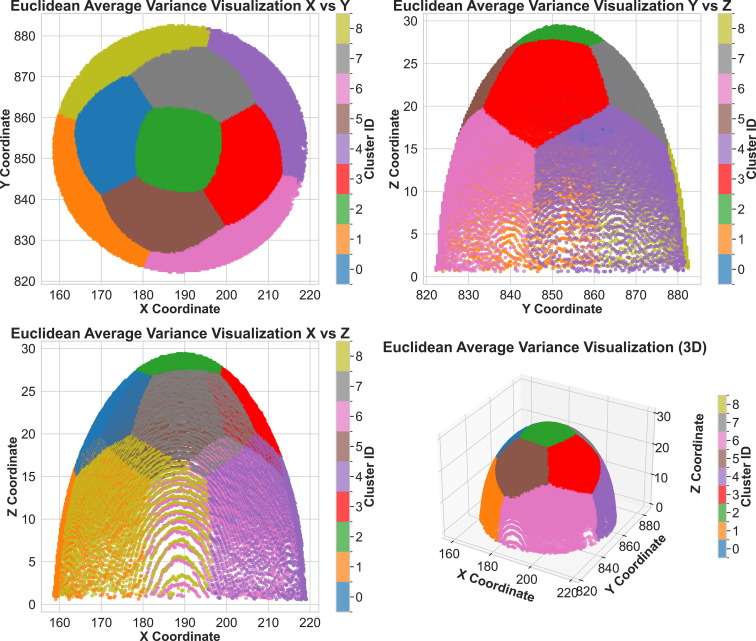
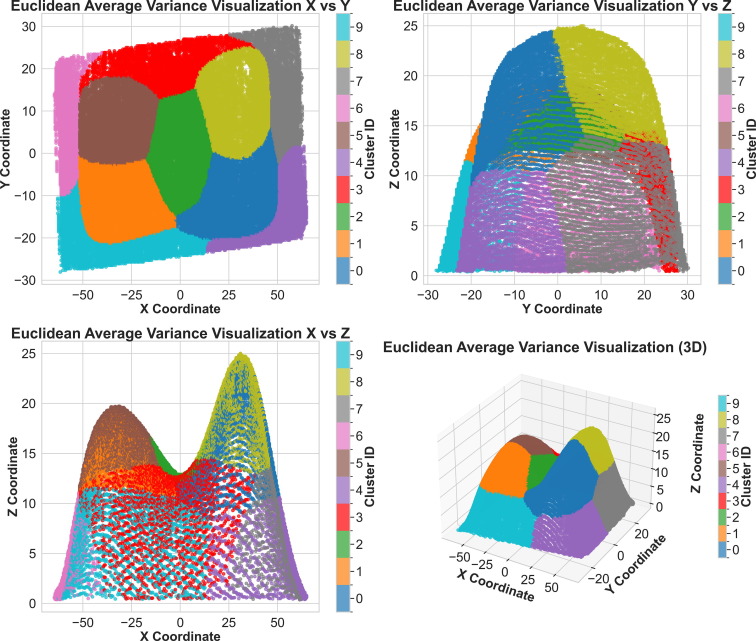
Euclidean Average Variance Visualizations for 3D point cloud scans. Left: Half Ball geometry. Right: Freeform geometry.

## 运行 Pipeline 1. **配置设置**:在 `pga_pipeline/config.py` 中调整您的超参数。 2. **执行**: python -m scripts.run_analysis 3. **检查**:检查 `results/` 文件夹中的 3D 散点图、平均方差映射、测地线向量和 CSV 报告。 ## 引用 如果本仓库对您的研究或工作有帮助,请引用该论文: **论文:** ### BibTeX ``` @article{nyanney2025unveil, title={Unveil the relationship between process and design embedded in the 3D point cloud using unsupervised learning}, author={Nyanney, Evans and Geng, Zhaohui}, journal={Manufacturing Letters}, volume={44}, pages={1498--1506}, year={2025}, publisher={Elsevier} } ``` ## 许可证 MIT License。详情请参阅 `LICENSE`。
标签:3D点云, Apex, Python, 无后门, 无监督学习, 机器学习, 聚类分析, 逆向工具