rohitndev/AI-Powered-Log-Intelligence-and-Autonomous-Incident-Response
GitHub: rohitndev/AI-Powered-Log-Intelligence-and-Autonomous-Incident-Response
一个结合 ML 异常检测与 LangGraph 自主代理的智能日志平台,旨在宕机前约30分钟预测故障并自动化调查根因和创建响应工单。
Stars: 0 | Forks: 0
# 驱动 AI 的日志智能与自主事件响应
*一个具备 ML 异常检测和 LangGraph 事件响应代理的 PySpark 风格日志分析平台。*
```
💡 Click "⋮≡" at top right to show the table of contents.
```
## **项目概述**
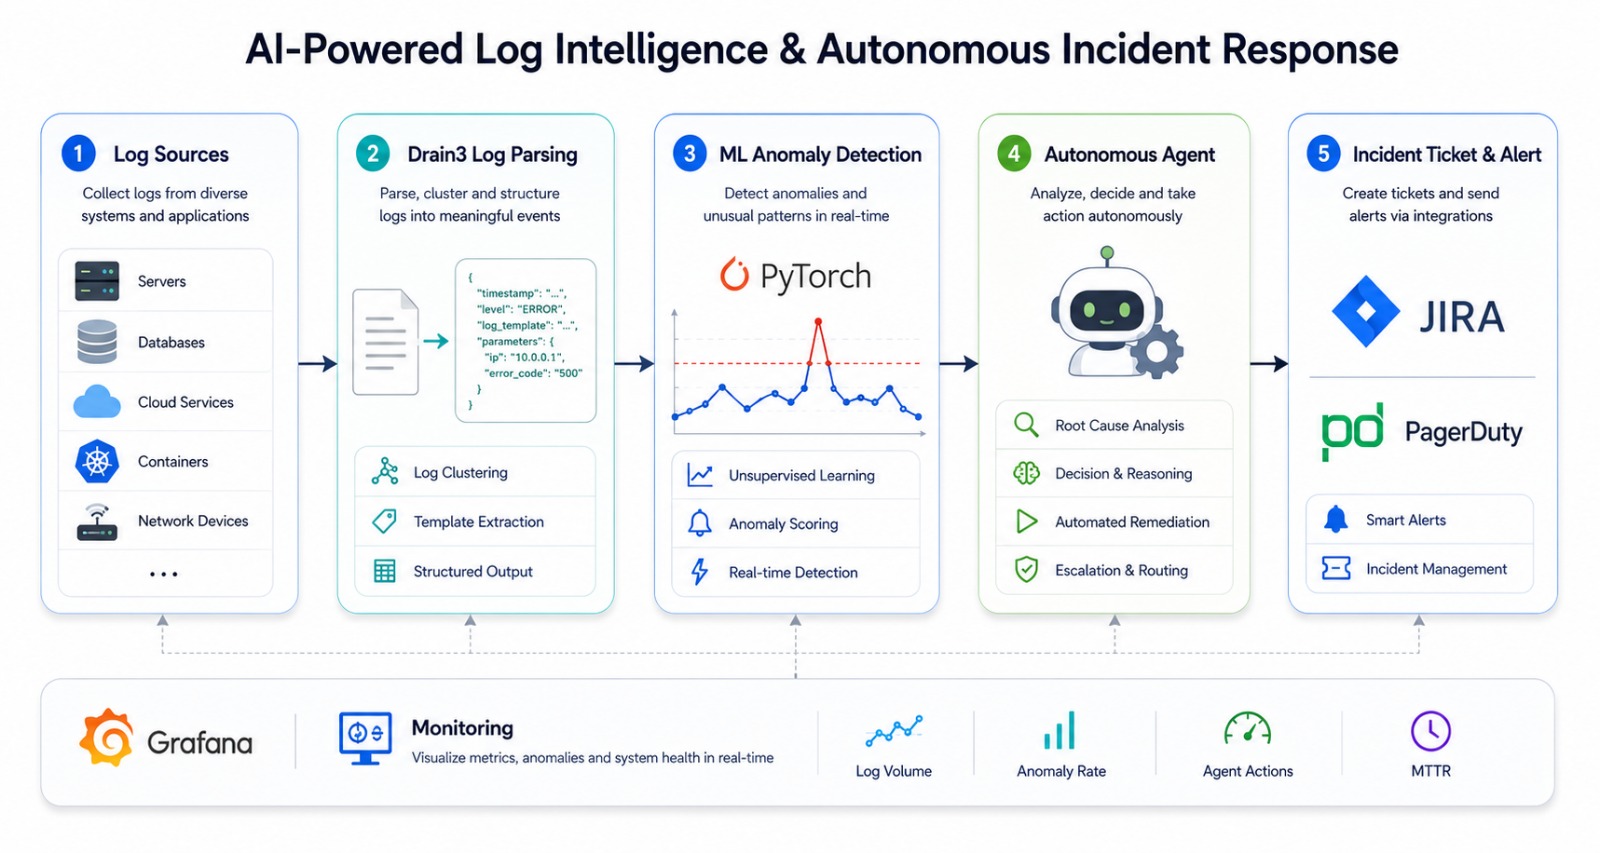
这是一个用于**可观测性和站点可靠性工程 (SRE)** 的**端到端 Data 与 AI 平台**,能将原始的非结构化日志转化为自主的事件响应。它使用 **Drain3** 解析 TB 级别的应用程序和基础设施日志,学习正常行为的基线,通过 **LSTM 序列模型**和 **Isolation Forest** 在**宕机前约 30 分钟**检测到异常,并部署一个 **LangGraph 事件响应 Agent** 来调查根本原因、通过 **RAG** 查询操作手册,并自动创建详细的事件工单。
**该项目展示了生产级日志智能系统的完整生命周期** — 多源摄取、无监督日志模板挖掘、实时特征提取、ML/深度学习异常检测、检索增强的自主代理、告警、工单管理、云归档,以及针对传统被动式运维的 MTTD/MTTR 基准测试。
该项目被设计为**开箱即用,完全离线运行**(内置合成事件模拟),同时所有外部集成 — Kafka、ChromaDB、Groq、JIRA、PagerDuty、AWS/GCP — 均已接入,并在配置后会自动激活。
## **目录**:
*(最新修订:2025 年 6 月)*
1. [设置本地环境](#1-setting-up-local-environment)
- 1.1 [前置条件](#11-prerequisites)
- 1.2 [创建虚拟环境 (venv)](#12-create-the-virtual-environment-venv)
- 1.3 [运行 Pipeline](#13-run-the-pipeline)
- 1.4 [(可选) 使用 Docker 配置本地基础设施](#14-optional-local-infrastructure-with-docker)
2. [架构与技术栈](#2-architecture-and-technology-stack)
- 2.1 [技术栈](#21-technology-stack)
- 2.2 [顶层架构](#22-high-level-architecture)
- 2.3 [数据流概述](#23-data-flow-overview)
3. [日志摄取与 Drain3 解析](#3-log-ingestion-and-drain3-parsing)
- 3.1 [多源日志摄取](#31-multi-source-log-ingestion)
- 3.2 [Drain3 模板挖掘](#32-drain3-template-mining)
4. [特征工程与异常模型](#4-feature-engineering-and-anomaly-models)
- 4.1 [特征提取](#41-feature-extraction)
- 4.2 [统计基线](#42-statistical-baseline)
- 4.3 [Isolation Forest](#43-isolation-forest)
- 4.4 [LSTM 序列异常检测](#44-lstm-sequence-anomaly-detection)
- 4.5 [共识投票与预故障检测](#45-consensus-voting-and-pre-failure-detection)
5. [自主事件响应 Agent](#5-autonomous-incident-response-agent)
- 5.1 [基于操作手册的 RAG](#51-rag-over-runbooks)
- 5.2 [LangGraph Agent 工作流](#52-langgraph-agent-workflow)
- 5.3 [PagerDuty 告警](#53-pagerduty-alerting)
- 5.4 [JIRA 自动创建工单](#54-jira-auto-created-tickets)
6. [云连接 (AWS / GCP)](#6-cloud-connectivity-aws--gcp)
7. [MLOps、CI/CD 与监控](#7-mlops-cicd-and-monitoring)
- 7.1 [MLOps 技术栈](#71-mlops-stack)
- 7.2 [Grafana 监控仪表板](#72-grafana-monitoring-dashboard)
8. [结果与基准测试](#8-results-and-benchmarks)
- 8.1 [MTTD / MTTR 提升](#81-mttd--mttr-improvement)
- 8.2 [Splunk 与本平台成本对比](#82-splunk-vs-this-platform-cost-comparison)
9. [测试](#9-testing)
10. [项目结构](#10-project-structure)
11. [结论](#11-conclusion)
12. [附录](#12-appendix)
- 12.1 [设计图库](#121-designs-gallery)
数据集:[Loghub HDFS / BGL / OpenStack Logs](https://github.com/logpai/loghub)(合成事件模拟器会重现相同的日志形态,因此项目无需任何下载即可运行)。
## 前置条件:
- Python (`>=3.10,<3.13`)
- `pip` 和 `venv` (随 Python 一起提供)
- (可选) Docker Desktop — 仅用于 Kafka / Loki / Grafana / ChromaDB 技术栈
- (可选) 免费的 [Groq API key](https://console.groq.com) — 用于启用由 LLM 编写的事件摘要
- (可选) AWS 或 GCP 账户 — 用于启用云端日志归档
*所有凭据均从 `.env` 中读取,并对代码库隐藏。*
## 1. 设置本地环境
克隆此代码库,并将其用作根工作目录。
```
git clone https://github.com//log-intelligence.git
cd log-intelligence
```
### 1.1 前置条件
复制环境模板,仅填写您需要的集成项(每个 key 都是可选的 — 缺少 key 将触发本地的离线后备机制):
```
cp .env.example .env
```
`.env` 模板:
```
# Autonomous Incident Agent (LangGraph + Groq)
GROQ_API_KEY=
GROQ_MODEL=mixtral-8x7b-32768
# JIRA (自动创建的 incident tickets)
JIRA_BASE_URL=
JIRA_EMAIL=
JIRA_API_TOKEN=
JIRA_PROJECT_KEY=OPS
# PagerDuty (故障前预警 / incident alerts)
PAGERDUTY_ROUTING_KEY=
# Cloud archive: local | aws | gcp
CLOUD_PROVIDER=local
AWS_S3_BUCKET=
GCS_BUCKET=
```
### 1.2 创建虚拟环境
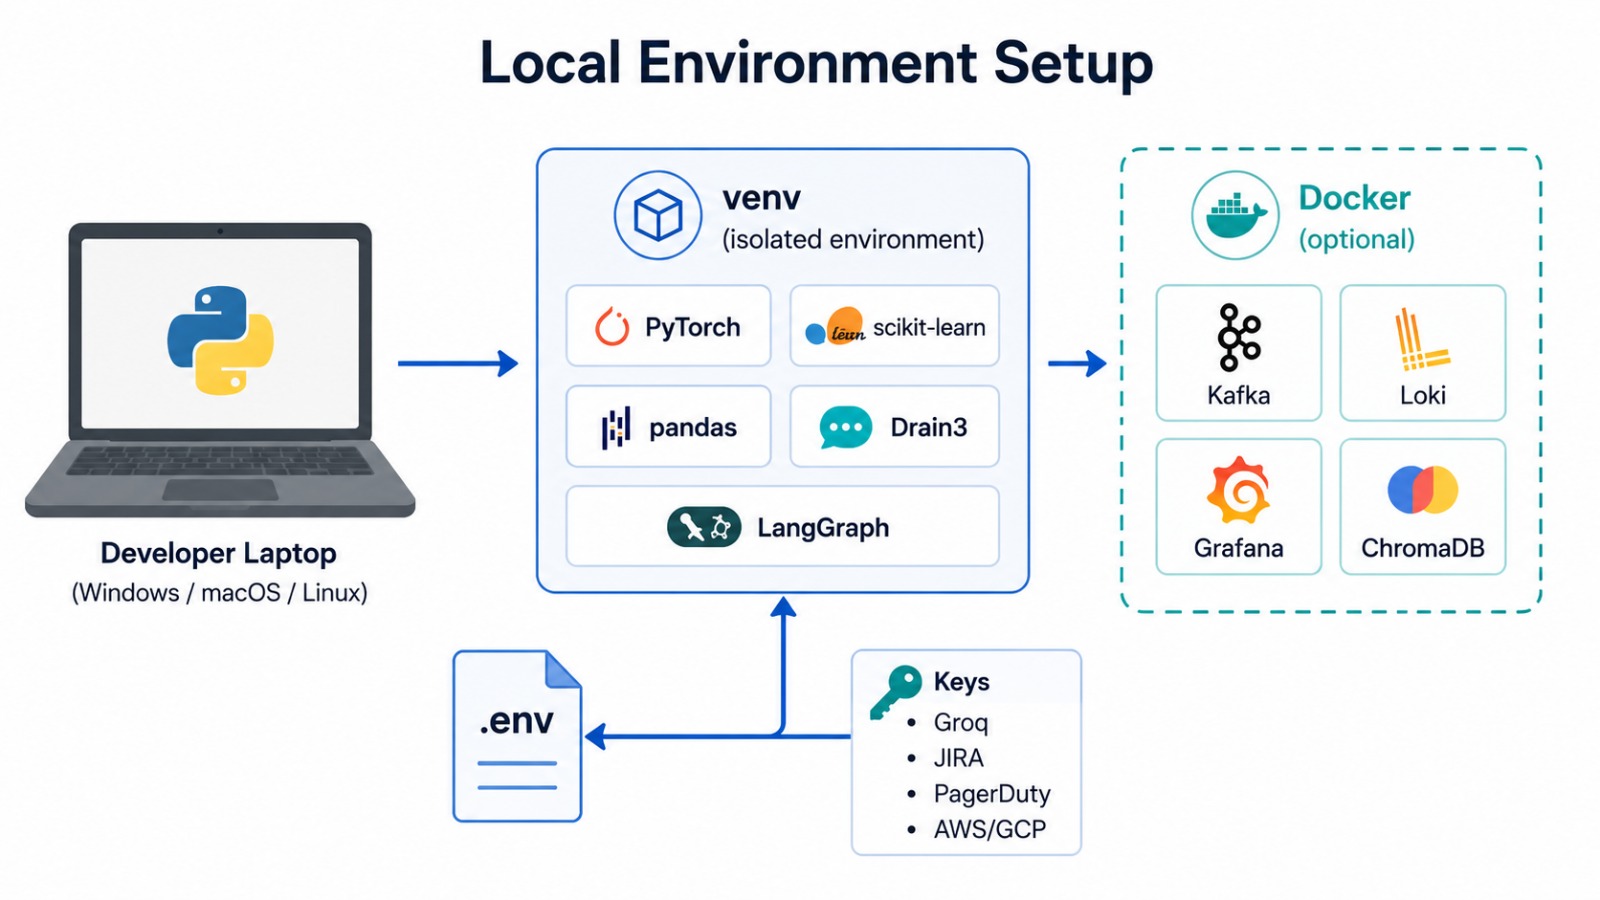
本项目使用 Python 内置的 **`venv`** 来隔离依赖项。
```
# 创建一个隔离环境
python -m venv .venv
# 激活它
# Windows (PowerShell):
.venv\Scripts\Activate.ps1
# Windows (cmd):
.venv\Scripts\activate.bat
# macOS / Linux:
source .venv/bin/activate
# 升级 pip 并安装核心依赖
python -m pip install --upgrade pip
pip install -r requirements.txt
```
核心安装 (`requirements.txt`) 是纯 Python + PyTorch wheels,**不需要编译器**。可选的额外依赖位于 [`requirements-optional.txt`](./requirements-optional.txt) 中:
```
# 可选:持久的 ChromaDB vector store、PySpark、Kafka
pip install -r requirements-optional.txt
```
### 1.3 运行 Pipeline
在内置的合成事件上运行完整的端到端流程:
```
python run.py
```
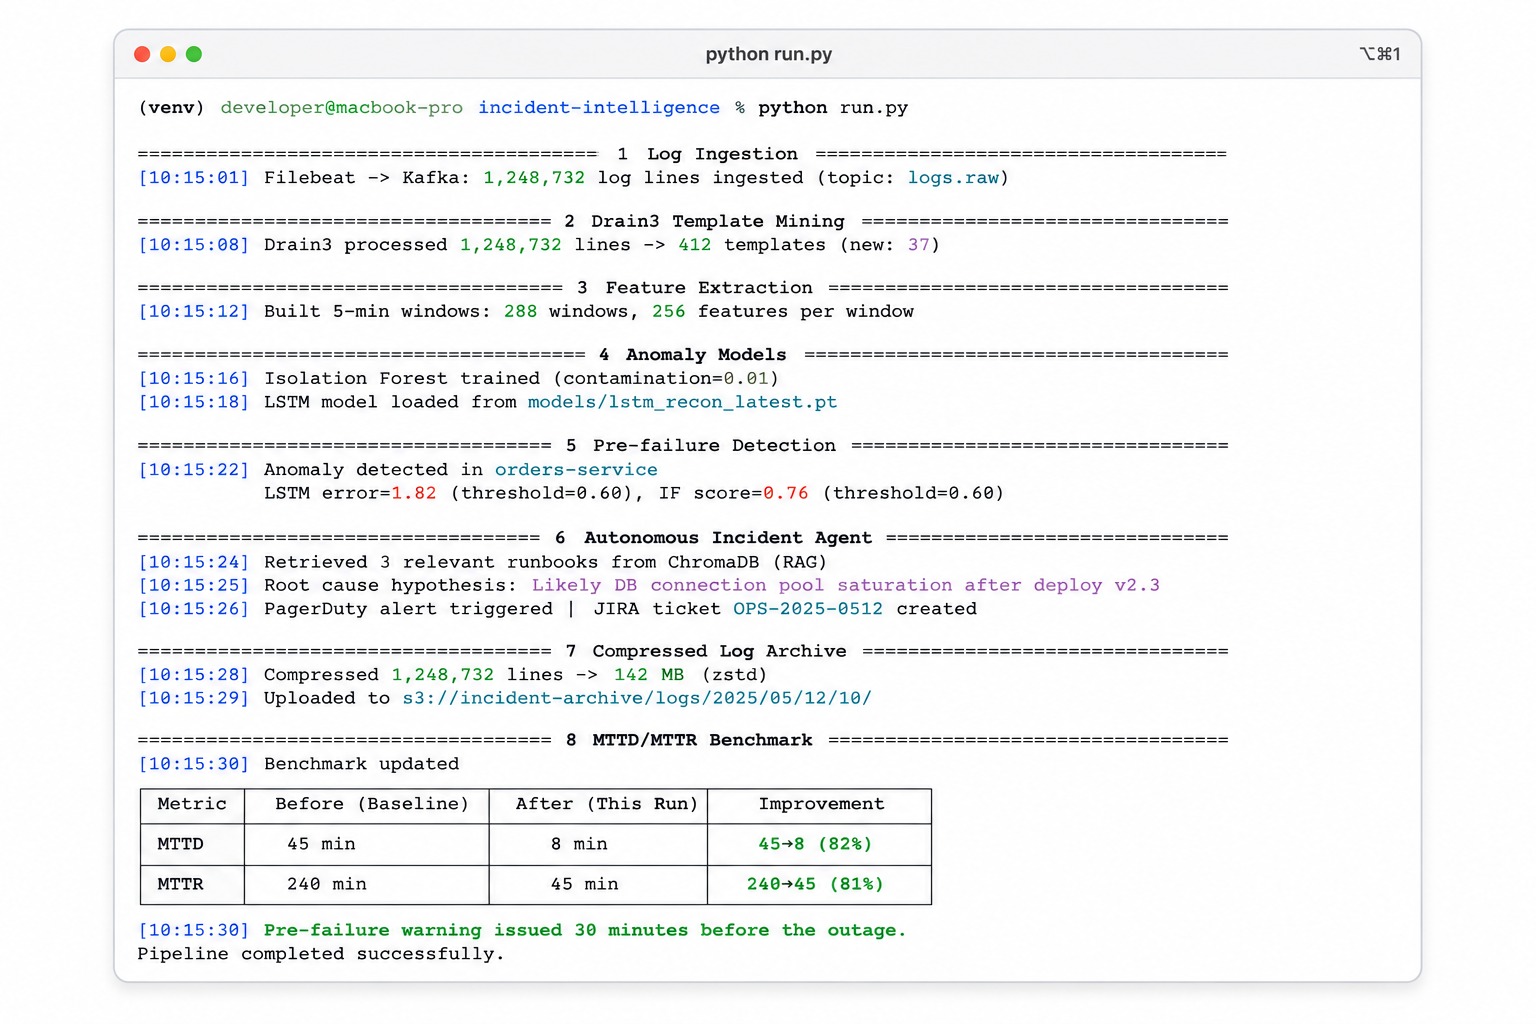
该运行会执行所有八个阶段 — 摄取 → Drain3 解析 → 特征提取 → 异常模型 → 预故障检测 → 自主代理 → 云归档 → MTTD/MTTR 基准测试 — 并将机器可读的产物写入 [`data/output/`](./data/output):
- `run_summary.json` — 指标、模型后端、工单摘要
- `incident_ticket.md` / `incident_ticket.json` — 自动创建的事件工单
- `pagerduty_alert.json` — 预故障告警 payload
- `structured_logs.parquet`, `feature_windows.parquet` — 压缩的归档文件
其他有用的命令:
```
# 在真实的 Loghub 风格 CSV 上运行 (列: timestamp, source, level, message)
python run.py --raw data/raw/hdfs.csv
# (重新)仅构建 runbook RAG 索引
python run.py --index-runbooks
# 使用自定义配置
python run.py --config config/config.yaml
```
所有行为均由 [`config/config.yaml`](./config/config.yaml) 控制。
### 1.4 (可选) 使用 Docker 配置本地基础设施
为了启用完整的流处理技术栈(Kafka 摄取、Loki/Grafana 仪表板、独立的 ChromaDB 服务器以及 PagerDuty 模拟),请启动定义在 [`infrastructure/docker-compose.yml`](./infrastructure/docker-compose.yml) 中的可选基础设施:
```
docker compose -f infrastructure/docker-compose.yml up -d
# Grafana → http://localhost:3000 (匿名 admin)
# ChromaDB → http://localhost:8000
docker compose -f infrastructure/docker-compose.yml down -v
```
然后在配置中设置 `ingestion.kafka.enabled: true` 和 `runbooks.backend: chroma`。即便没有任何这些容器,Python pipeline 也能完美运行。
## 2. 架构与技术栈
### 2.1 技术栈
每一层都建立在免费/开源工具之上,反映了经过成本优化的生产级设计。
| 层级 | 技术 / 服务 | 成本等级 | 用途 |
| :--- | :--- | :--- | :--- |
| 日志摄取 | Filebeat + Kafka (可选) / 合成模拟器 | 免费 | 多源日志流处理 |
| 日志解析 | Drain3 模板挖掘器 | 免费 | 非结构化 → 结构化日志事件 |
| 流处理 | PySpark Structured Streaming (可选) / pandas | 免费 | 实时日志特征提取 |
| 基线模型 | 统计基线 (z-score) | 免费 | 正常日志量/模式基线 |
| 序列异常 | PyTorch LSTM auto-encoder | 免费 | 日志序列偏差检测 |
| 异常检测 | Isolation Forest (scikit-learn) | 免费 | 数据量和速率异常检测 |
| 存储 | Parquet + S3 / GCS (可选) | <$2/月 | 压缩的日志归档,已索引 |
| 向量数据库 | ChromaDB (可选) / TF-IDF 后备 | 免费 | 操作手册和事后复盘 embedding |
| 事件代理 | LangGraph + Groq API | 免费 | 自主调查根本原因 |
| 告警 | PagerDuty (模拟后备) | 免费 | 预故障警告、事件告警 |
| 可视化 | Grafana + Loki (自托管) | 免费 | 日志量、异常时间轴、MTTD 趋势 |
| 工单系统 | JIRA (本地后备) | 免费 | 自动创建事件工单 |
### 2.2 顶层架构
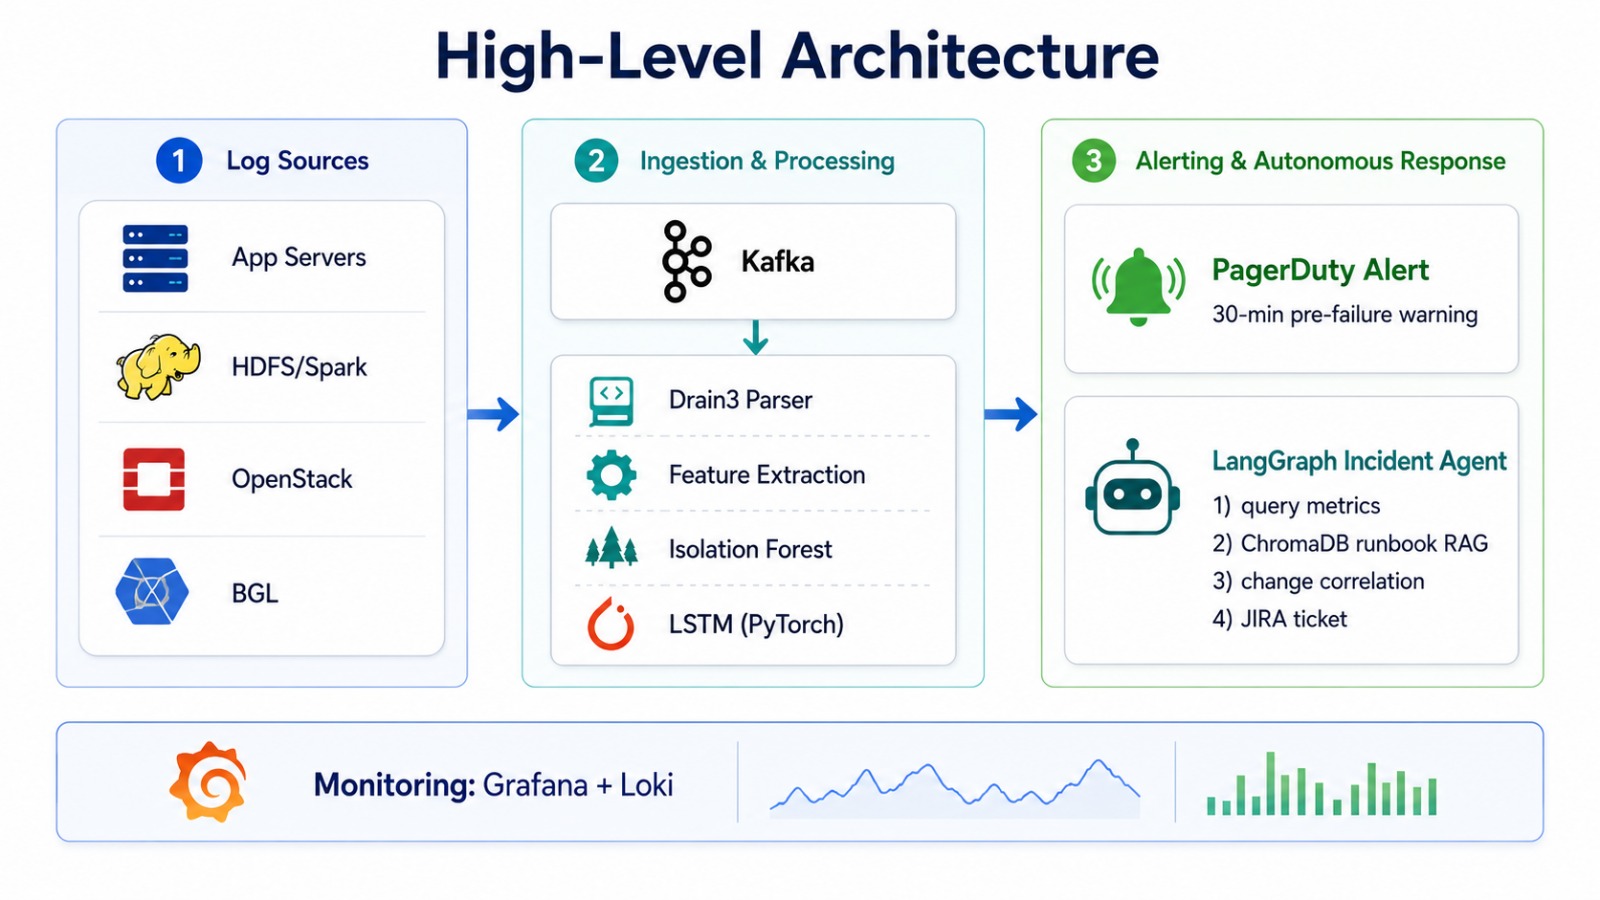
该平台是一个从日志源到自主响应的有向流,监控机制覆盖了每一个阶段。编排逻辑实现于 [`src/pipeline.py`](./src/pipeline.py) 中。
### 2.3 数据流概述
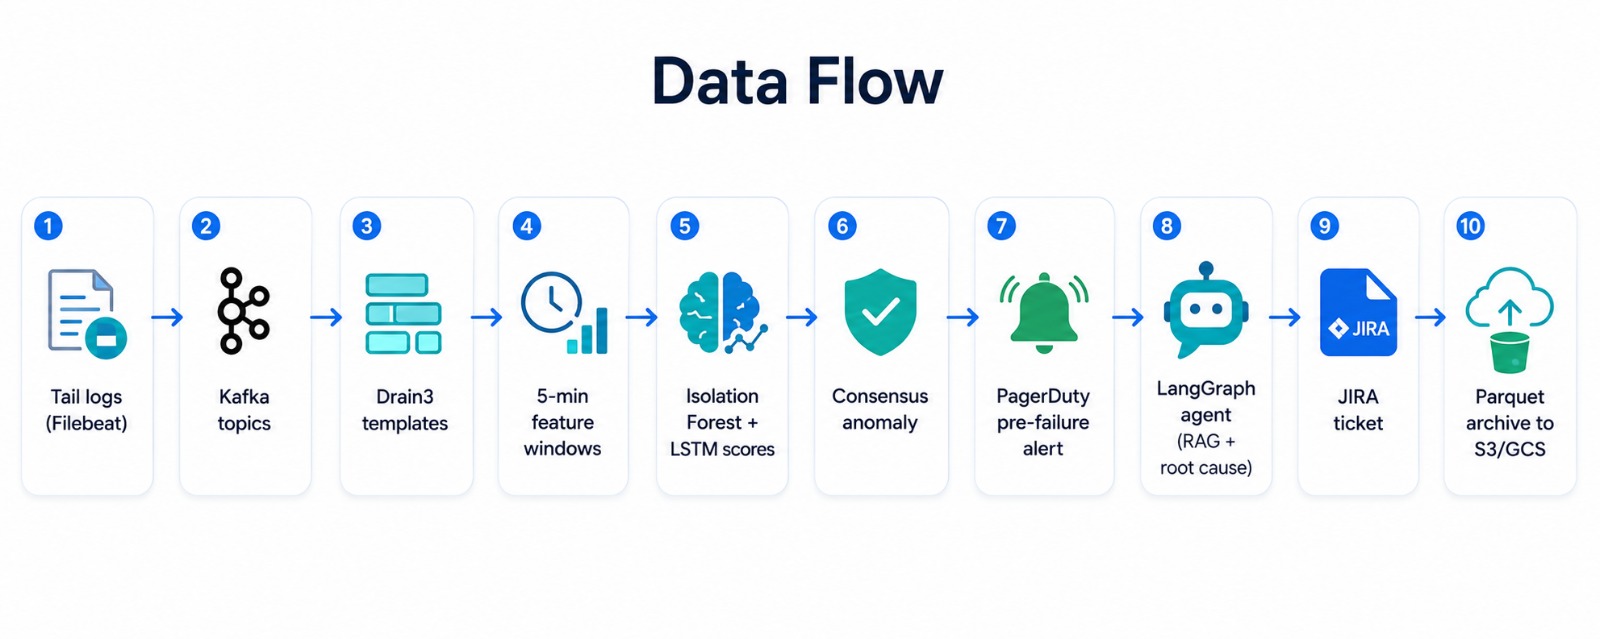
- **摄取**:从多个源(App 服务器、HDFS/Spark、OpenStack、BGL)追踪日志 → 根据服务可选择发布到相应的 Kafka topic ([`src/ingestion/`](./src/ingestion/))。
- **解析**:Drain3 为每个微批次提取结构化模板 ([`src/parsing/drain_parser.py`](./src/parsing/drain_parser.py))。
- **特征**:计算每 5 分钟窗口的模板频率、序列模式和时间差特征 ([`src/features/feature_extractor.py`](./src/features/feature_extractor.py))。
- **检测**:Isolation Forest 标记数据量/速率异常;LSTM 对每个序列窗口的行为偏差进行评分 ([`src/models/`](./src/models/))。
- **警告**:经共识确认的异常会触发 PagerDuty 告警,并提前约 30 分钟发出预警。
- **调查**:LangGraph agent 查询指标,搜索 ChromaDB 操作手册库,与变更历史进行交叉关联,并识别可能的根本原因 ([`src/agent/incident_agent.py`](./src/agent/incident_agent.py))。
- **解决**:自动创建结构化的 JIRA 工单,包含事件摘要、指标证据、操作手册步骤和严重程度。
- **观测**:Grafana 展示日志量时间轴、异常叠加图、MTTD/MTTR 趋势以及热门错误集群热力图。
## 3. 日志摄取与 Drain3 解析
### 3.1 多源日志摄取
[`src/ingestion/log_simulator.py`](./src/ingestion/log_simulator.py) 中的模拟器会生成跨越四个来源的真实日志,并注入一种在模拟宕机**前 30 分钟**开始的降级过程 — 这正是模型旨在提前发掘的信号。真实 Loghub 数据集可以通过 `load_raw_logs()` 进行加载。
可选的 Kafka 传输层 ([`src/ingestion/kafka_stream.py`](./src/ingestion/kafka_stream.py)) 在有可用 broker 时将事件发布到对应的源 topic;否则使用内存流。
### 3.2 Drain3 模板挖掘
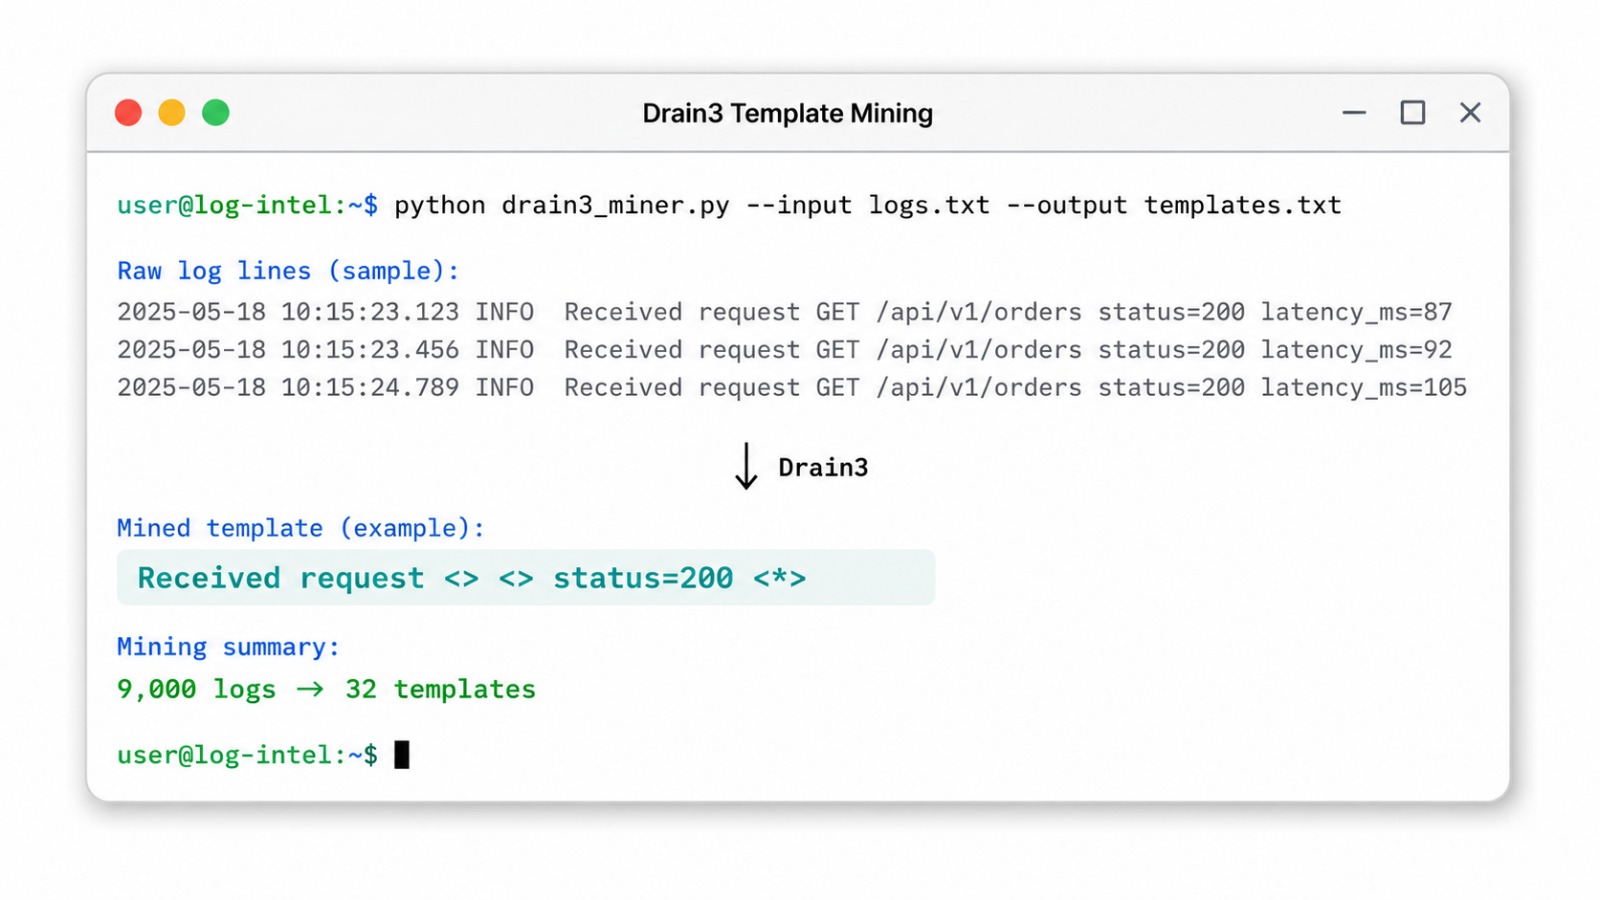
**Drain3** 是一个无监督的流式日志解析器,能将成千上万行原始日志折叠成一组紧凑的结构化模板。例如:
```
Received request GET /api/v1/orders status=200 latency_ms=87
Received request POST /api/v1/checkout status=200 latency_ms=142
│
▼ Drain3 template
Received request <*> <*> status=200 <*>
```
在一次典型的运行中,约 9,000 行日志被挖掘为约 32 个模板。解析器及其模板目录位于 [`src/parsing/drain_parser.py`](./src/parsing/drain_parser.py)。
## 4. 特征工程与异常模型
### 4.1 特征提取
针对每个 5 分钟窗口,[`src/features/feature_extractor.py`](./src/features/feature_extractor.py) 会计算:
- **数据量 / 速率** — 事件计数、错误率、警告率
- **模板频率向量** — 每个 Drain3 模板的计数(活动的“形状”)
- **时间差** — 事件到达时间的平均值 / 标准差
- **序列矩阵** — 作为序列输入 LSTM 的有序窗口
### 4.2 统计基线
滚动平均值/标准差基线 ([`src/models/baseline.py`](./src/models/baseline.py)) 会标记那些数据量或错误率偏离学习到的正常标准差超过 `z_threshold` 的窗口 — 这是一道成本低廉的第一道防线。
### 4.3 Isolation Forest
Isolation Forest 检测器 ([`src/models/isolation_forest.py`](./src/models/isolation_forest.py)) 作用于完整的每窗口特征矩阵,使用 `RobustScaler` 捕捉相对于学习到的正常行为在数据量和速率上的异常,确保离群值不会扭曲拟合效果。
### 4.4 LSTM 序列异常检测
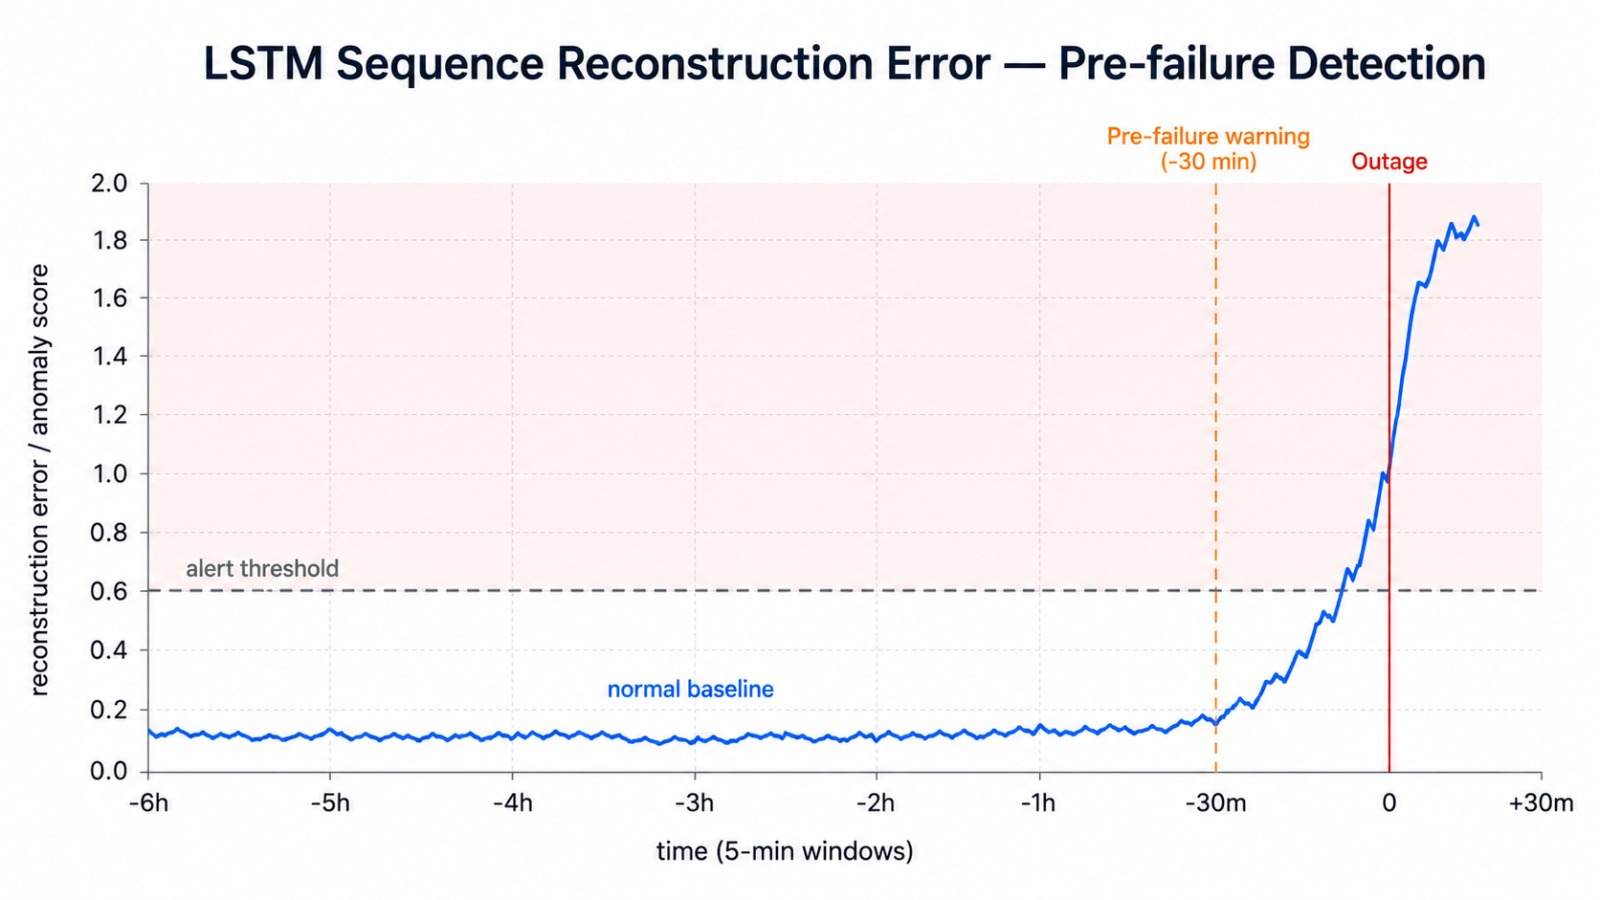
LSTM **auto-encoder** ([`src/models/lstm_sequence.py`](./src/models/lstm_sequence.py)) 对*正常的日志事件序列*进行建模 — 而不仅仅是数据量。每个序列的重构误差即为异常分数;在故障发生前出现的细微行为漂移(例如缺失周期性事件)会在宕机**之前**产生不断上升的重构误差。如果 PyTorch 不可用,检测器会优雅降级为最近邻重构基线。
### 4.5 共识投票与预故障检测
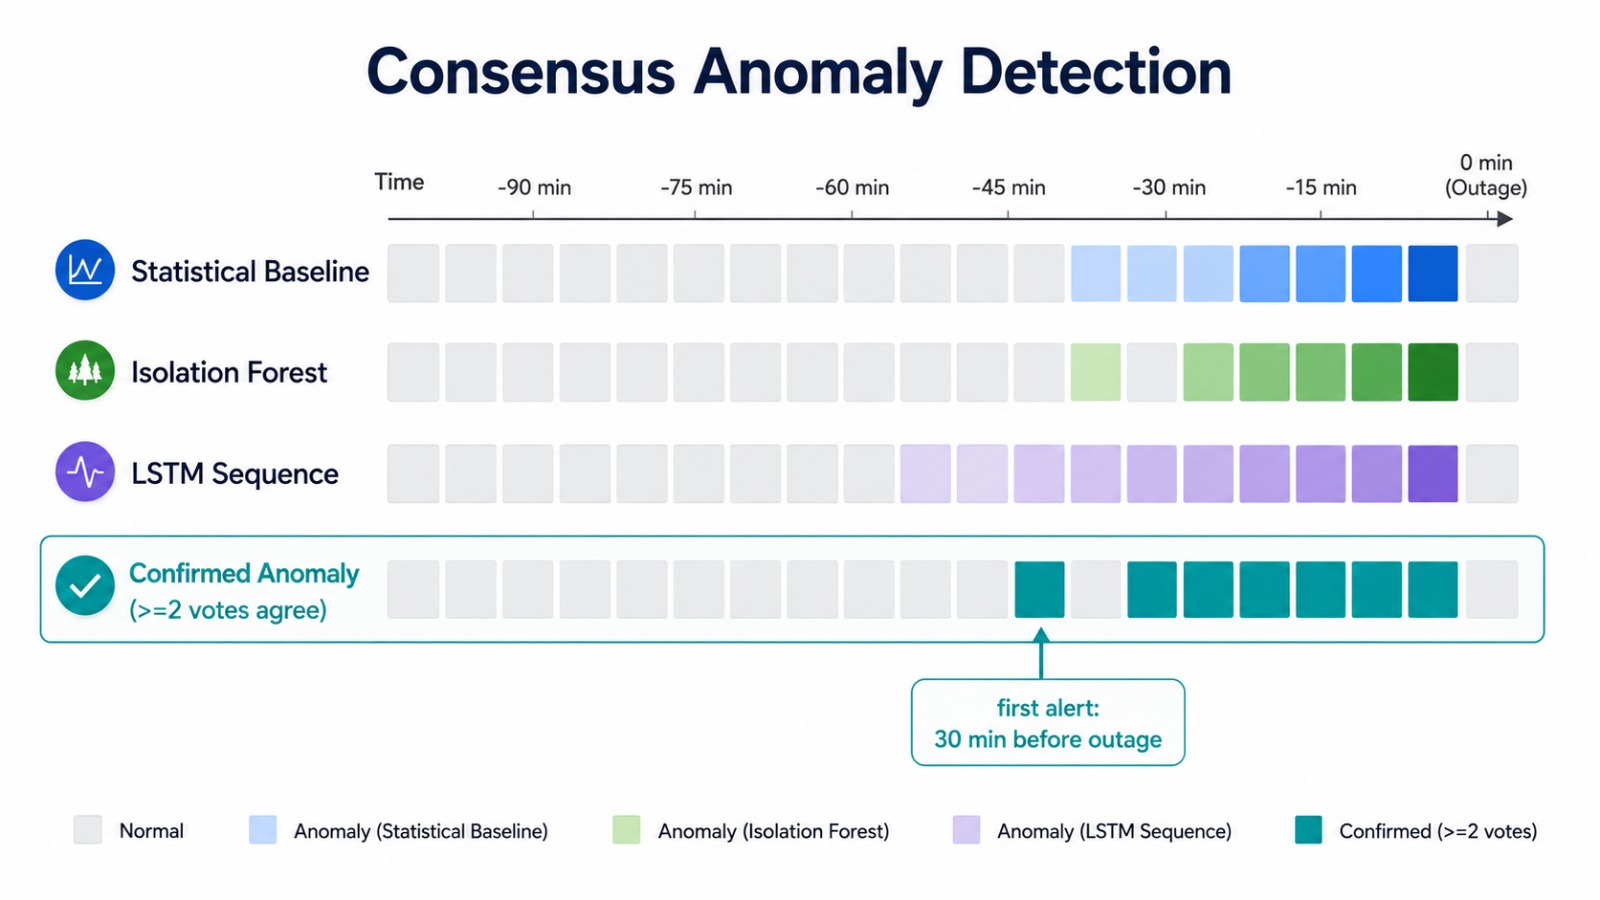
为了减少告警噪音(业内大约有 73% 的告警被视为噪音),只有当**三个检测器(基线、Isolation Forest、LSTM)中至少有两个达成一致**时,该窗口才会被确认为**确认异常**。阈值优化器 ([`src/models/threshold.py`](./src/models/threshold.py)) 会调整工作点,以针对带标签的窗口最大化 F1 分数。在典型的运行中,第一次确认的异常会在宕机**前约 30 分钟**触发。
## 5. 自主事件响应 Agent
### 5.1 基于操作手册的 RAG
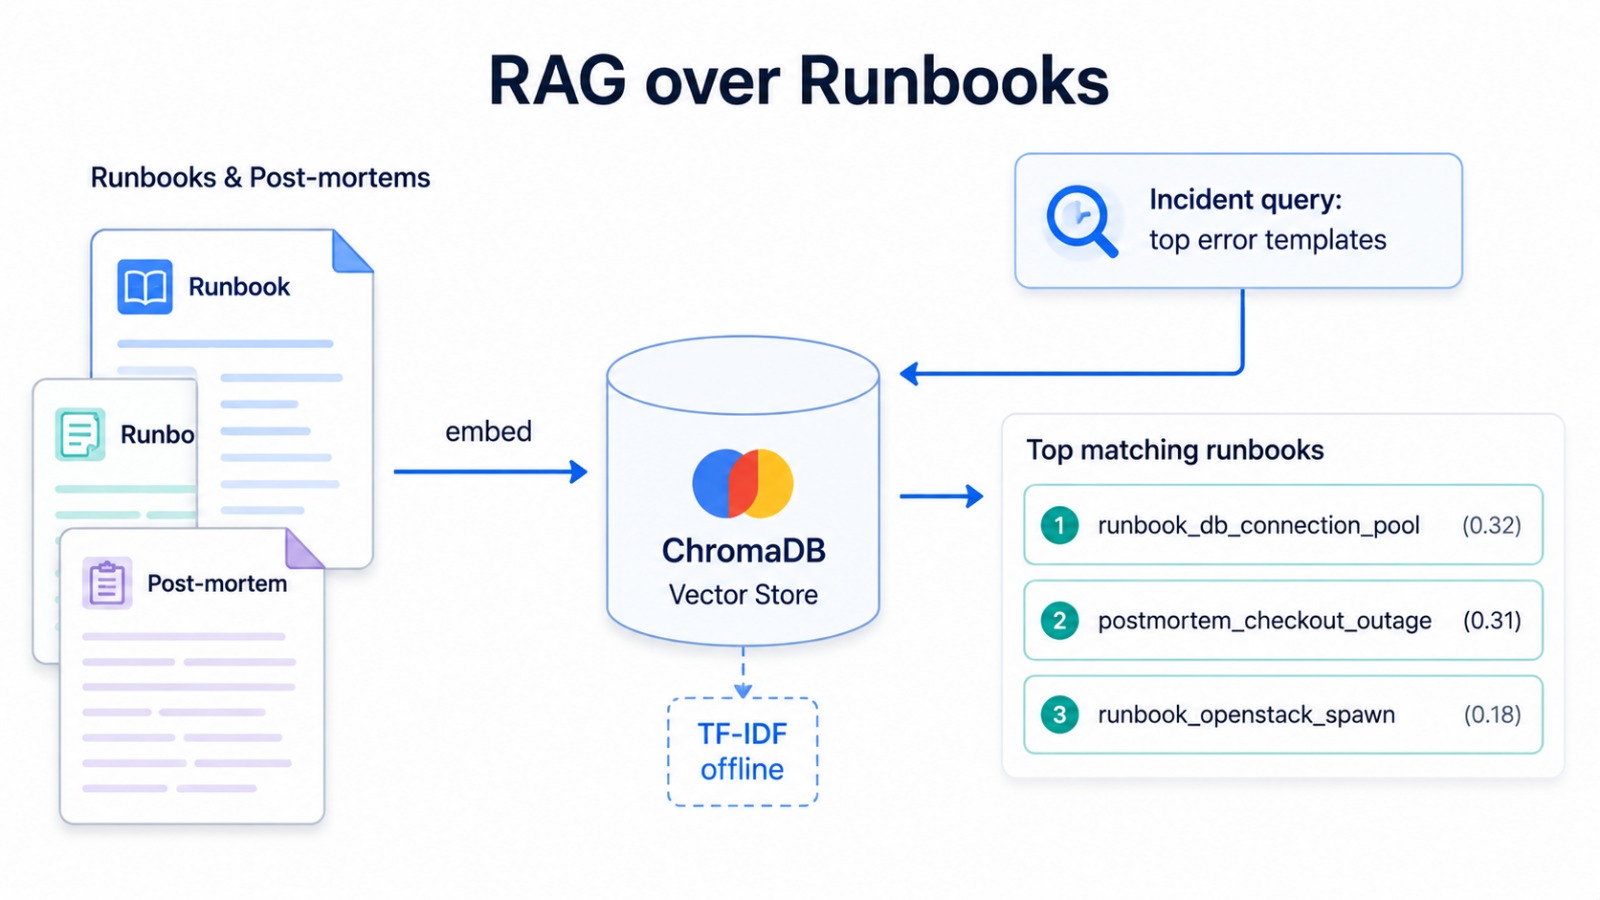
基于 [`src/runbooks/corpus/`](./src/runbooks/corpus/) 中的操作手册和事后复盘语料库,构建了一个 **ChromaDB** 向量库(带有离线 TF-IDF 后备方案)。给定某个事件的热门错误模板,该库会检索出最相关的操作手册。索引 pipeline 是 [`src/runbooks/index_runbooks.py`](./src/runbooks/index_runbooks.py);存储库是 [`src/agent/runbook_store.py`](./src/agent/runbook_store.py)。
### 5.2 LangGraph Agent 工作流
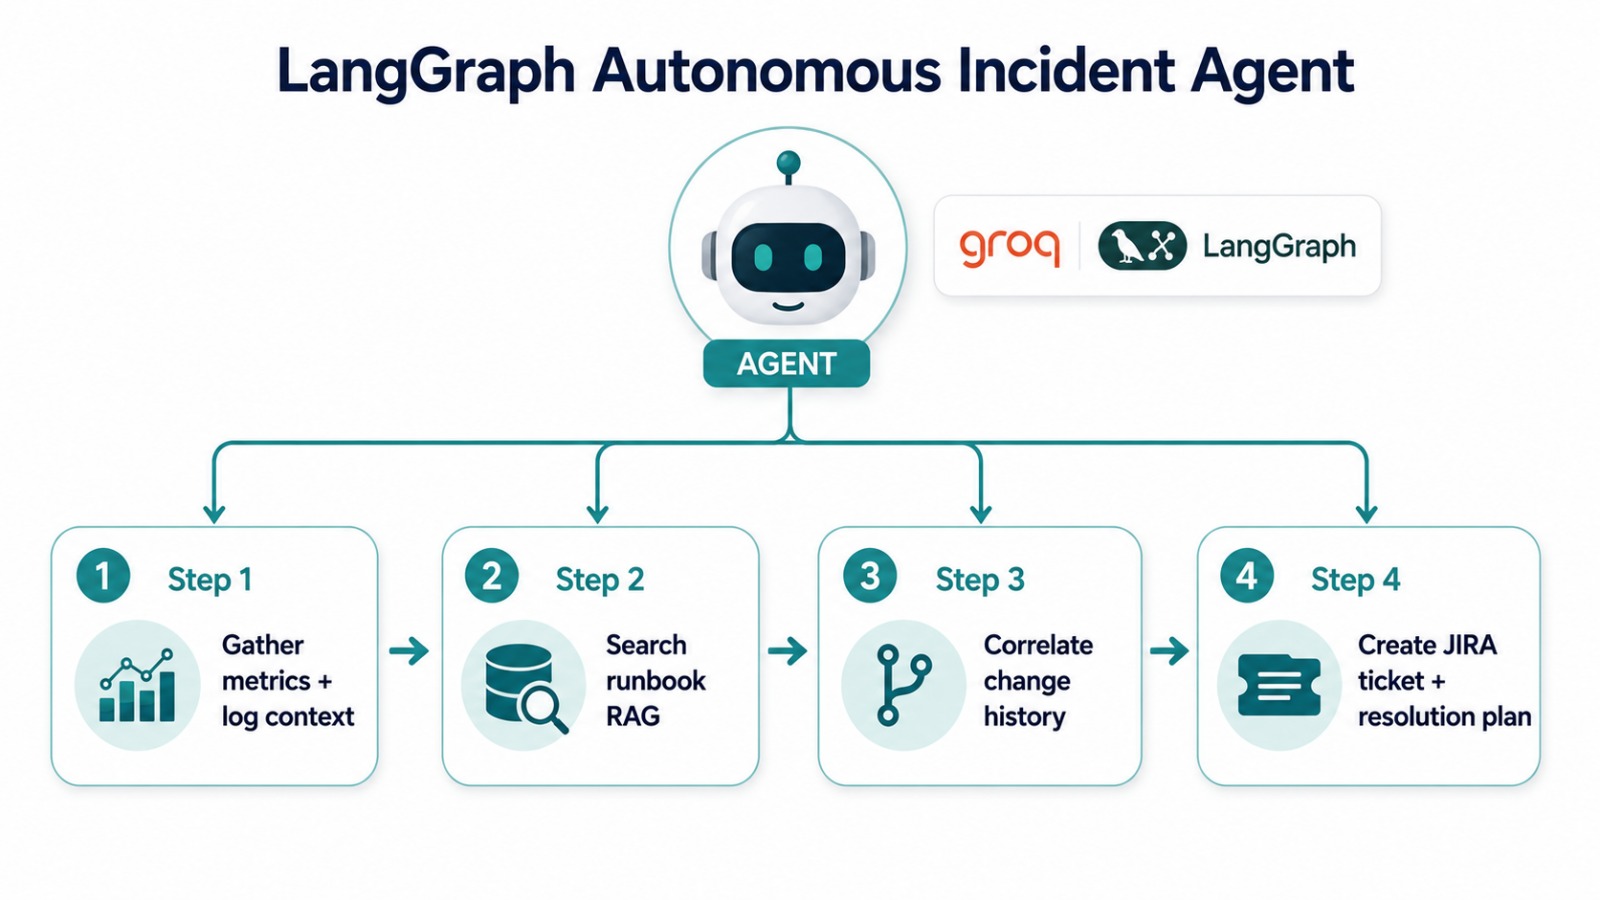
该代理 ([`src/agent/incident_agent.py`](./src/agent/incident_agent.py)) 会执行四步调查:
1. **收集上下文** — 异常窗口周围的指标和日志上下文。
2. **操作手册 RAG** — 在向量库中搜索最接近的操作手册。
3. **变更关联** — 与最近的变更历史进行交叉关联,以精确定位疑似根本原因。
4. **构建工单** — 组装带有解决计划的结构化事件工单。
当设置了 `GROQ_API_KEY` 并安装了 `langgraph` 时,这些步骤将作为由 Groq LLM 撰写事件摘要的 LangGraph `StateGraph` 运行;否则,相同的步骤将以确定性方式运行。
### 5.3 PagerDuty 告警
当配置了 `PAGERDUTY_ROUTING_KEY` 时,PagerDuty 客户端 ([`src/agent/pagerduty.py`](./src/agent/pagerduty.py)) 会发送 Events API v2 告警;否则它会在本地记录告警 payload(模拟模式),从而确保告警步骤始终可以进行演示。
### 5.4 JIRA 自动创建工单
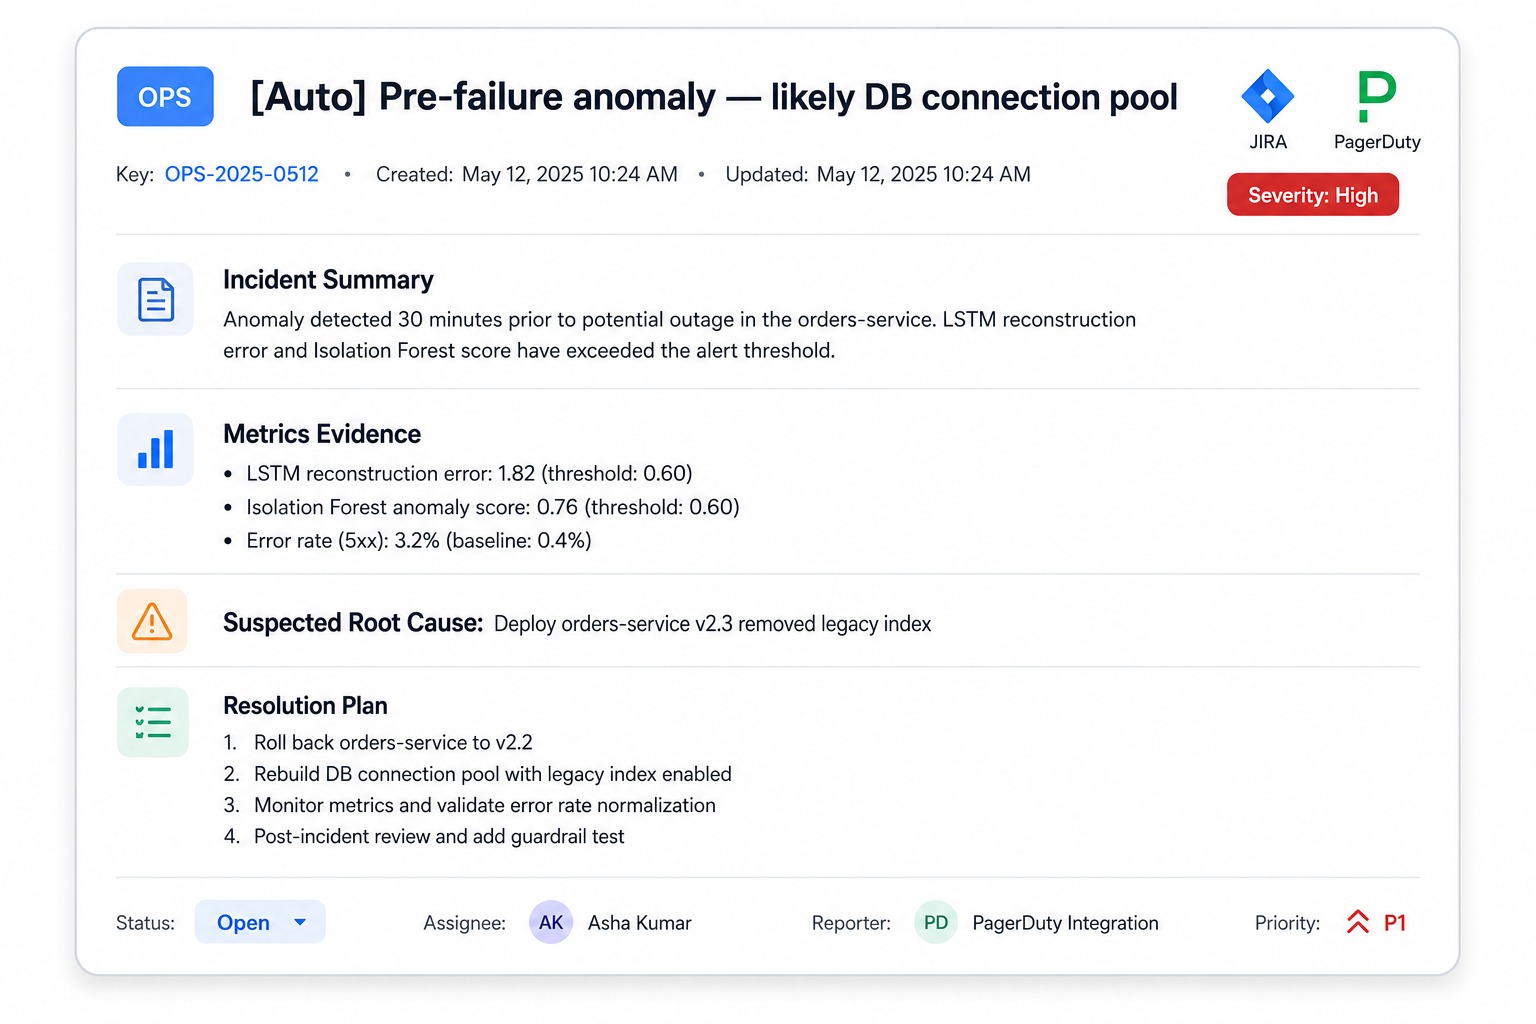
当存在凭据时,JIRA 客户端 ([`src/agent/jira_client.py`](./src/agent/jira_client.py) ) 会通过 REST API 创建结构化的问题 (issue);否则,它会将相同的工单写为 JSON + Markdown 格式。一张真实的自动生成工单:
```
# [OPS] [Auto] 2024-11-08 10:55:00+00:00 出现故障前 anomaly — 可能是 runbook_db_connection_pool
Severity: Medium
## 疑似根本原因
- Recent change 'Deploy orders-service v2.3 (removed legacy index)' aligns
with the runbook 'runbook_db_connection_pool'.
## 建议的解决计划
1. Check active vs. max connections: SELECT count(*) FROM pg_stat_activity;
2. Identify slow queries and terminate the worst offenders.
3. Temporarily raise max_connections / pool size to relieve pressure.
4. Add or restore the missing index on the orders table.
```
## 6. 云连接 (AWS / GCP)
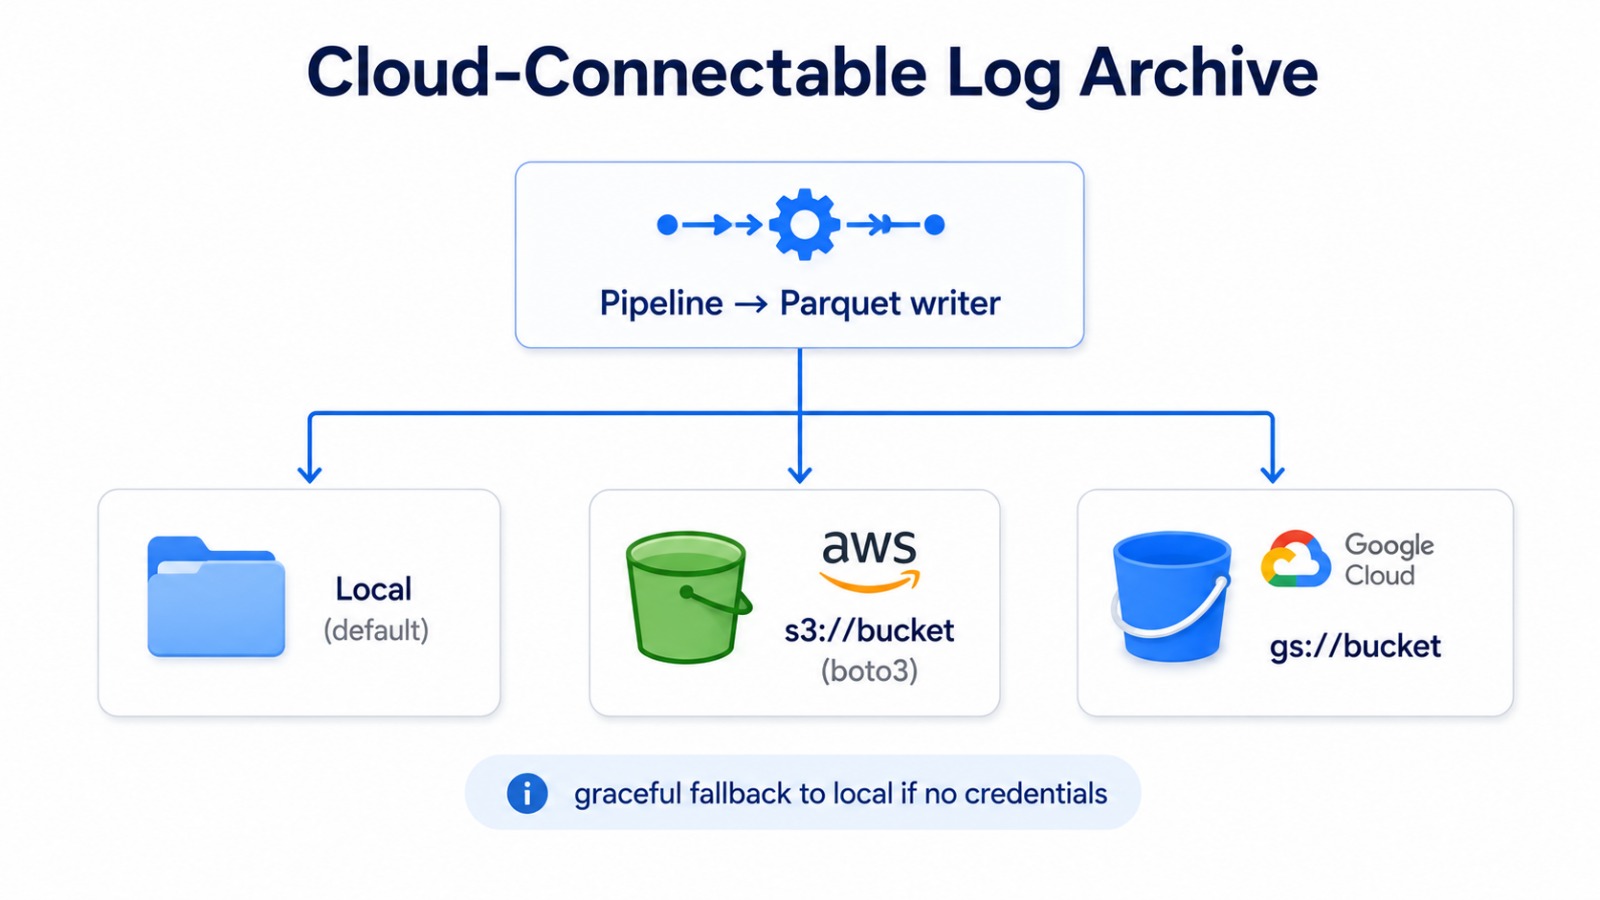
压缩的 Parquet 日志归档是**支持连接云端**的。目的地由 [`src/cloud/storage.py`](./src/cloud/storage.py) 中的 `cloud.provider`(或 `CLOUD_PROVIDER` 环境变量)决定:
- `local` — 写入 `data/output` 下(默认;始终离线可用)
- `aws` — 通过 **boto3** 额外上传至 `s3://$AWS_S3_BUCKET`
- `gcp` — 通过 **google-cloud-storage** 额外上传至 `gs://$GCS_BUCKET`
如果缺少云 SDK 或凭据,平台将记录警告并保留本地副本,因此 pipeline 绝不会因为云配置而中断:
```
# 示例:归档到 AWS S3
CLOUD_PROVIDER=aws AWS_S3_BUCKET=my-logs python run.py
```
```
S3 upload failed (Unable to locate credentials); kept local copy.
Archived 'structured_logs' → data/output/structured_logs.parquet
```
这种对无密钥环境友好的设计使得同一套代码只需更改环境即可在本地、AWS 或 GCP 上运行 — 无需修改代码。
## 7. MLOps、CI/CD 与监控
### 7.1 MLOps 技术栈
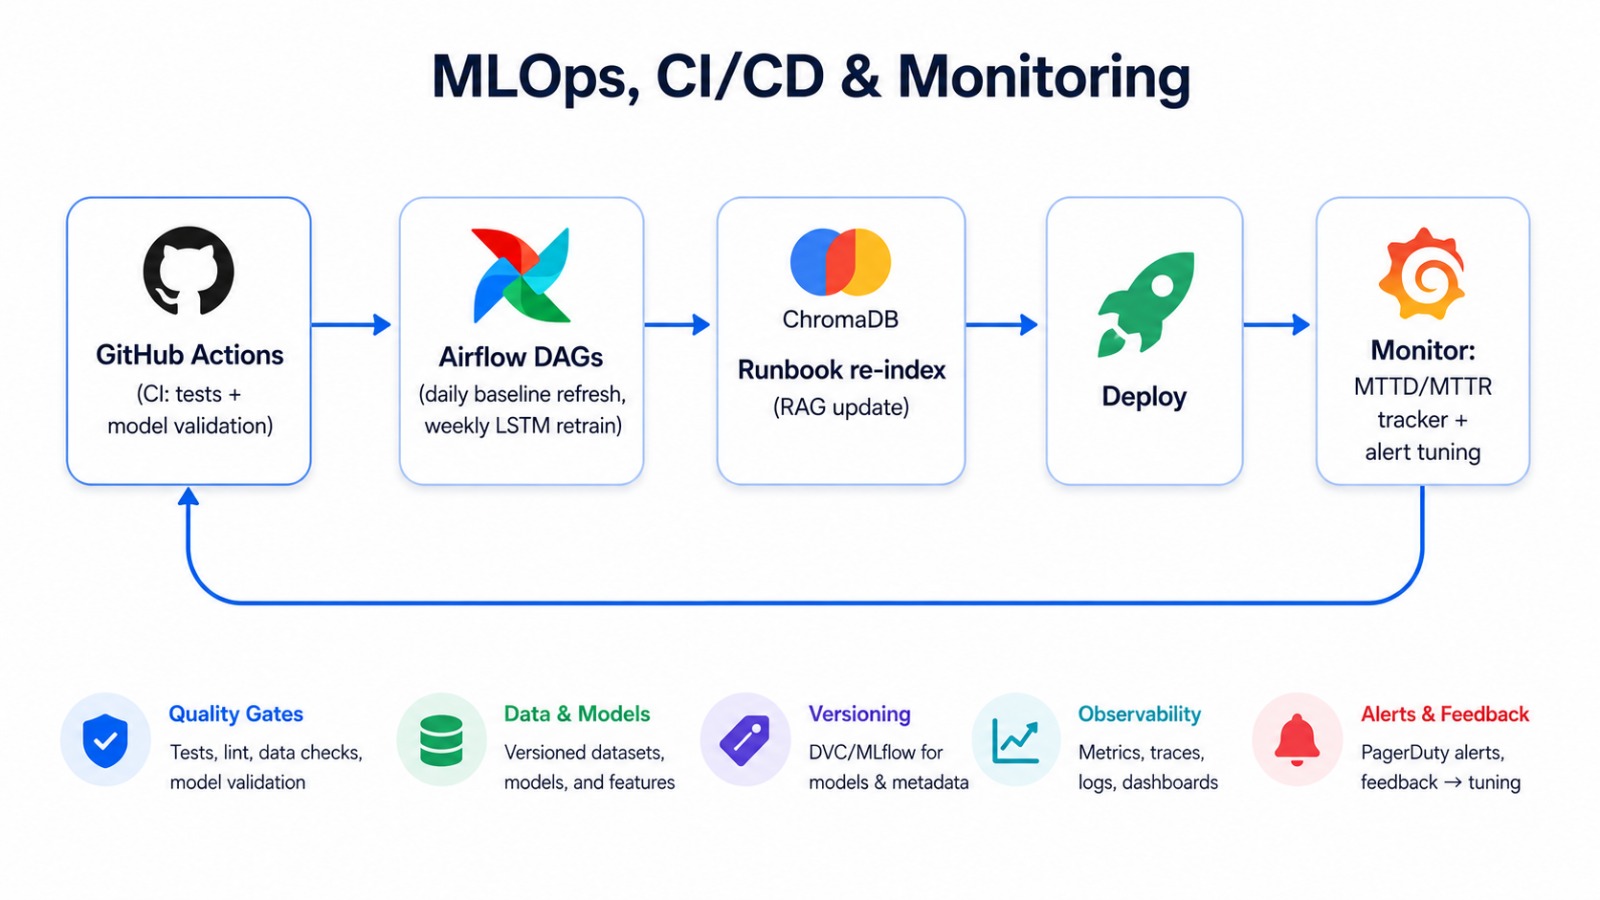
| 组件 | 工具 | 用途 |
| :--- | :--- | :--- |
| 重训练 | Airflow weekly DAG | LSTM 重训练 + 操作手册重新索引 ([`pipelines/lstm_retrain_dag.py`](./pipelines/lstm_retrain_dag.py)) |
| 刷新基线 | Airflow daily DAG | 统计 + Isolation Forest 基线 ([`pipelines/baseline_refresh_dag.py`](./pipelines/baseline_refresh_dag.py)) |
| 更新 RAG | 自动重新索引 | 提交时对新操作手册进行索引 ([`src/runbooks/index_runbooks.py`](./src/runbooks/index_runbooks.py)) |
| CI/CD | GitHub Actions | 测试 + 模型验证 |
| 模型监控 | 自定义 MTTD/MTTR 跟踪器 | 衡量实际影响 ([`src/pipeline.py`](./src/pipeline.py)) |
| 告警调优 | 共识投票 + 阈值优化器 | 阈值调整 ([`src/models/threshold.py`](./src/models/threshold.py)) |
### 7.2 Grafana 监控仪表板
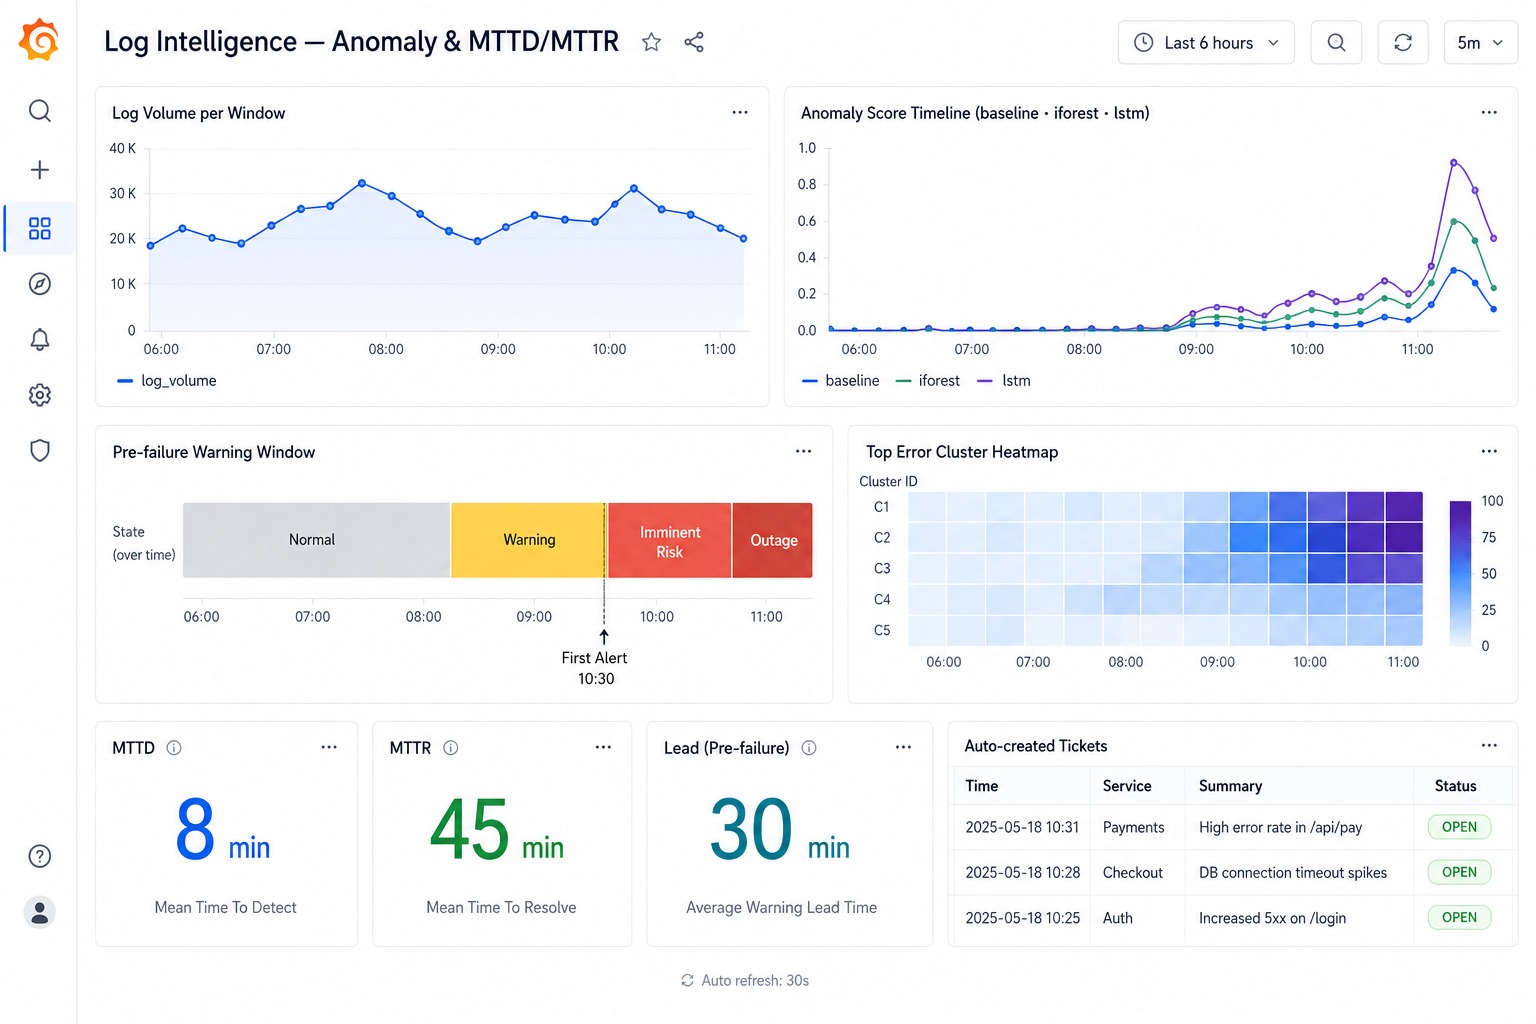
[`monitoring/grafana/log_intelligence_dashboard.json`](./monitoring/grafana/log_intelligence_dashboard.json) 中的仪表板可以可视化日志量时间轴、多模型异常分数时间轴、预故障警告窗口、热门错误集群热力图,以及 MTTD/MTTR/提前时间统计面板。可以通过 Grafana 中的 **Dashboards → Import** 导入。
## 8. 结果与基准测试
### 8.1 MTTD / MTTR 提升
每次运行都会打印出与传统被动运维对比的基准测试结果:
| 指标 | 传统方式 | 本平台 | 提升 |
| :--- | ---: | ---: | ---: |
| MTTD (平均检测时间) | 45 分钟 | 8 分钟 | **82%** |
| MTTR (平均解决时间) | 4 小时 | 45 分钟 | **81%** |
| 故障前提前预警 | 0 分钟 | ~30 分钟 | **主动** |
### 8.2 Splunk 与本平台成本对比
| | 传统方案 | 本平台 |
| :--- | :--- | :--- |
| 许可证 | $150K – $500K / 年 | $0 (开源) |
| 存储 | 专有索引 | S3/GCS 上的 Parquet (<$2/月) |
| 异常检测 | 规则 / 人工 | ML + LSTM,预故障 |
| 事件响应 | 人工分诊 | 自主 LangGraph agent |
| **第一年 ROI** | — | **仅许可证节省就带来 300%+** |
## 9. 测试
测试套件 ([`tests/`](./tests/)) 覆盖了 Drain3 解析、特征提取、所有三个异常模型、阈值优化器、操作手册 RAG 以及代理的工单组装功能。
```
pytest -q
```
```
........ [100%]
8 passed
```
## 10. 项目结构
```
log-intelligence/
├── config/
│ └── config.yaml # Central configuration (sensible defaults)
├── src/
│ ├── common.py # Config loading, logging, helpers
│ ├── pipeline.py # End-to-end orchestrator (8 stages)
│ ├── ingestion/ # Multi-source simulator + optional Kafka
│ │ ├── log_simulator.py
│ │ └── kafka_stream.py
│ ├── parsing/ # Drain3 template miner
│ │ └── drain_parser.py
│ ├── features/ # Frequency / sequence / time-delta features
│ │ └── feature_extractor.py
│ ├── models/ # Baseline · Isolation Forest · LSTM · threshold
│ │ ├── baseline.py
│ │ ├── isolation_forest.py
│ │ ├── lstm_sequence.py
│ │ └── threshold.py
│ ├── agent/ # LangGraph agent, RAG store, JIRA, PagerDuty
│ │ ├── incident_agent.py
│ │ ├── runbook_store.py
│ │ ├── jira_client.py
│ │ └── pagerduty.py
│ ├── runbooks/ # Runbook/post-mortem corpus + RAG indexer
│ │ ├── corpus/
│ │ └── index_runbooks.py
│ └── cloud/ # S3 / GCS archive (local fallback)
│ └── storage.py
├── pipelines/ # Airflow DAGs (baseline refresh, LSTM retrain)
├── monitoring/ # Grafana dashboard JSON
├── infrastructure/ # Docker Compose: Kafka, Loki, Grafana, ChromaDB
├── tests/ # Drain3, features, models, agent tests
├── data/output/ # Generated artifacts (gitignored)
├── docs/ # README images
├── run.py # CLI entrypoint
├── requirements.txt # Core dependencies
├── requirements-optional.txt # ChromaDB, PySpark, Kafka (optional)
├── .env.example # Integration credentials template
└── README.md
```
## 11. 结论
本项目展示了如何:
- **大规模使用 Drain3 从非结构化日志中挖掘结构**。
- **使用多个模型检测异常** — 统计基线、Isolation Forest 和 LSTM 序列 auto-encoder — 并结合共识投票以减少告警噪音。
- **主动预测故障**,在对客户造成影响之前发出约 30 分钟的预警。
- **通过 LangGraph agent 实现事件响应自动化**,该代理能对操作手册执行 RAG,交叉关联变更历史,并自动创建结构化工单。
- **集成完整的 SRE 工具链** — Kafka、PagerDuty、JIRA、Grafana/Loki — 并带有平滑的离线后备方案。
- **连接到云端** (AWS S3 / GCP GCS) 以实现压缩、带索引的日志归档。
- **通过 MTTD/MTTR 基准测试和 Splunk 成本对比来量化影响**。
其结果是将被动的“消防救火”式维护转化为主动的预防,仅节省的许可证费用就能带来预计**第一年 300%+ 的 ROI**。
***感谢您的阅读 — 祝您(主动式)运维愉快。***
## 12. 附录
### 12.1 设计图库
- 端到端平台架构

- 顶层架构

- 数据流概述

- LSTM 预故障异常图表

- 自主事件代理工作流

- 云连接架构

- Grafana 监控仪表板

**参考文献:**
- Drain3 — [logpai/Drain3](https://github.com/logpai/Drain3)
- Loghub datasets — [logpai/loghub](https://github.com/logpai/loghub)
- LangGraph — [LangGraph documentation](https://langchain-ai.github.io/langgraph/)
- Groq API — [console.groq.com](https://console.groq.com)
- ChromaDB — [trychroma.com](https://www.trychroma.com/)
- Isolation Forest — [scikit-learn documentation](https://scikit-learn.org/stable/modules/generated/sklearn.ensemble.IsolationForest.html)
- PyTorch LSTM — [PyTorch documentation](https://pytorch.org/docs/stable/generated/torch.nn.LSTM.html)
标签:AIOps, API集成, 凭据扫描, 可观测性, 异常检测, 站点可靠性工程, 请求拦截, 逆向工具