# End-to-End Threat Intelligence and AI-Powered SOC Pipeline for Telemetry-Driven Triage and Response
~ Closing the loop from initial probe to containment and case resolution.
## What Makes This Different
Most honeypot projects stop at installing T-Pot and collecting data from the already existing Kibana dashboard. This one doesn't.. it builds a full operational cycle around the data, from passive collection all the way through to active threat containment.
Here's what this project adds on top of a standard T-Pot deployment:
- **Splunk SIEM integration over a private Tailscale mesh network:** no public Splunk port exposed and no VPN headache. The universal forwarder sends logs from the EC2 instance directly to a local Splunk instance via Tailscale IP for local log storage.
- **AI-powered log analysis via MCP (Model Context Protocol):** Claude AI is connected directly to Splunk using the Splunk MCP server. That means natural language queries against live honeypot logs, automated correlation, and threat enrichment.. all from a conversation.
- **VirusTotal enrichment on all captured malware hashes:** every payload dropped by attackers (Cowrie SFTP uploads, ADBHoney ARM binaries, Dionaea EternalBlue captures) was looked up on VirusTotal. 51 hashes total. 3 were not in VirusTotal at all.
- **OPNsense Firewall with Suricata IDS/IPS:** This sits on the local network in IPS mode with custom rules built directly from honeypot IOCs, literally.. the attacker data feeds the detection rules that protect the network.
- **An Unbound DNS sinkhole:** This blocks malicious domains identified during the observation period at the resolution layer, so no device on the network can even reach them.
- **A full structured threat intelligence report:** Not a screenshot dump. A proper TI report covering attack timelines, coordinated actor attribution, CVE analysis, MITRE ATT&CK mapping, IOCs, and recommendations.
- Splunk alerts trigger a webhook into N8N SOAR, which calls Ollama to enrich every IOC via VirusTotal and IPAPI and produce a structured SOC investigation report.
- If the AI verdict is TRUE POSITIVE, the source IP is automatically added to an OPNsense alias and firewall rules are reloaded with no human intervention for confirmed threats. In a production environment, this would require further tuning and exception handling for cloud-hosted IP ranges to minimize false positives and avoid blocking legitimate traffic.
- The enriched alert is simultaneously forwarded to DFIR-IRIS as a case and to Slack as a formatted notification, so the analyst always knows what was blocked and why.
- Analysts can then escalate alerts to full IRIS cases, extract IOCs, add investigation notes, and close cases, all within the same pipeline.
- Suricata and Yara rules built based on attacker telemetry.
- The threat intelligence feed (IP blocklist from honeypot attacker IPs) is served over HTTP from a local Python server and consumed by OPNsense as a live URL alias, so the blocklist and firewall stay in sync automatically.
This deployment will also feed data into a companion SOC automation project (separate repo) where I will build upon this project but witth a different setting and attacker mindset.
## Table of Contents
1. [Project Overview](#1-project-overview)
2. [Architecture](#2-architecture)
3. [EC2 Instance Setup](#3-ec2-instance-setup)
- 3.1 [IAM User & Instance Launch](#31-iam-user--instance-launch)
- 3.2 [Elastic IP & SSH Access](#32-elastic-ip--ssh-access)
- 3.3 [User Account](#33-user-account)
- 3.4 [Docker Installation](#34-docker-installation)
4. [T-Pot Honeypot Installation](#4-t-pot-honeypot-installation)
- 4.1 [Installation & Configuration](#41-installation--configuration)
- 4.2 [Security Group Rules](#42-security-group-rules)
- 4.3 [Verifying the Web UI](#43-verifying-the-web-ui)
- 4.4 [Opening to the Internet](#44-opening-to-the-internet)
5. [Log Decompression & Preparation](#5-log-decompression--preparation)
6. [Splunk SIEM Setup](#6-splunk-siem-setup)
- 6.1 [Installing Splunk Enterprise](#61-installing-splunk-enterprise)
- 6.2 [Creating the Honeypot Index](#62-creating-the-honeypot-index)
7. [Tailscale Network Setup](#7-tailscale-network-setup)
8. [Splunk Universal Forwarder](#8-splunk-universal-forwarder)
- 8.1 [Installation & Boot Configuration](#81-installation--boot-configuration)
- 8.2 [inputs.conf Configuration](#82-inputsconf-configuration)
- 8.3 [Troubleshooting Ingestion](#83-troubleshooting-ingestion)
9. [Claude AI + Splunk MCP Integration](#9-claude-ai--splunk-mcp-integration)
- 9.1 [Installing Claude Desktop (Linux)](#91-installing-claude-desktop-linux)
- 9.2 [Splunk MCP Server Setup](#92-splunk-mcp-server-setup)
- 9.3 [MCP Configuration File](#93-mcp-configuration-file)
10. [Splunk Queries Detection Engineering Reference](#10-splunk-queries-detection-engineering-reference)
- 10.1 [Discovery Queries](#101-discovery-queries)
- 10.2 [Attack Surface Queries](#102-attack-surface-queries)
- 10.3 [Cowrie SSH/Telnet Queries](#103-cowrie-sshtelnet-queries)
- 10.4 [Threat Intelligence Queries](#104-threat-intelligence-queries)
- 10.5 [Campaign & Attribution Queries](#105-campaign--attribution-queries)
11. [Kibana Dashboard Queries](#11-kibana-dashboard-queries)
12. [OPNsense Firewall Installation](#12-opnsense-firewall-installation)
- 12.1 [VM Setup and OS Installation](#121-vm-setup-and-os-installation)
- 12.2 [Interface Configuration and Web Access](#122-interface-configuration-and-web-access)
13. [Threat Intelligence Feed > OPNsense Alias](#13-threat-intelligence-feed--opnsense-alias)
- 13.1 [Serving the Blocklist over HTTP](#131-serving-the-blocklist-over-http)
- 13.2 [Creating the Tpot_threatintel Alias](#132-creating-the-tpot_threatintel-alias)
- 13.3 [Firewall Rules WAN and LAN](#133-firewall-rules-wan-and-lan)
- 13.4 [DNS Sinkhole for Malicious Domains](#134-dns-sinkhole-for-malicious-domains)
14. [Suricata IDS/IPS Custom Rules Deployment](#14-suricata-idsips-custom-rules-deployment)
- 14.1 [Enabling Suricata in IPS Mode](#141-enabling-suricata-in-ips-mode)
- 14.2 [Deploying Custom Rules via SFTP](#142-deploying-custom-rules-via-sftp)
- 14.3 [Routing Traffic Through OPNsense](#143-routing-traffic-through-opnsense)
15. [DFIR IRIS Ticketing System Integration](#15-dfir-iris-ticketing-system-integration)
- 15.1 [Installation via Docker Compose](#151-installation-via-docker-compose)
- 15.2 [Environment Configuration](#152-environment-configuration)
16. [N8N SOAR - Installation and Workflow Setup](#16-n8n-soar---installation-and-workflow-setup)
- 16.1 [Installing N8N via Docker Compose](#161-installing-n8n-via-docker-compose)
- 16.2 [Connecting Ollama from Windows Host](#162-connecting-ollama-from-windows-host)
- 16.3 [Building the Splunk Alert Trigger](#163-building-the-splunk-alert-trigger)
- 16.4 [AI Triage Workflow - Ollama + VirusTotal + IPAPI](#164-ai-triage-workflow---ollama--virustotal--ipapi)
- 16.5 [Auto-Block on True Positive Verdict](#165-auto-block-on-true-positive-verdict)
- 16.6 [DFIR-IRIS Case Creation and Slack Notification](#166-dfir-iris-case-creation-and-slack-notification)
17. [Threat Intelligence Report](#18-threat-intelligence-report)
18. [Key Findings Summary](#19-key-findings-summary)
19. [Repository Structure](#20-repository-structure)
## 1\. Project Overview
| Parameter | Value |
| --- | --- |
| Platform | T-Pot CE v24.x (Deutsche Telekom) |
| Deployment | AWS EC2 - `m7i-flex.large` (2 vCPU, 8 GB RAM), 128 GB storage |
| Region | us-east-1 (United States - N. Virginia) |
| OS | Ubuntu |
| Observation period | 21 days |
| Total events captured | ~3.47 million (may have some noise) |
| Unique attacker IPs | 20,727+ |
| Honeypot services | 20 active sourcetypes |
| SIEM | ELK and Splunk Enterprise (local VM, forwarded via Tailscale) |
| AI integration | Claude AI via Splunk MCP server |
| Malware hashes analysed | 51 (Cowrie + ADBHoney + Dionaea) |
| Local VM | Ubuntu |
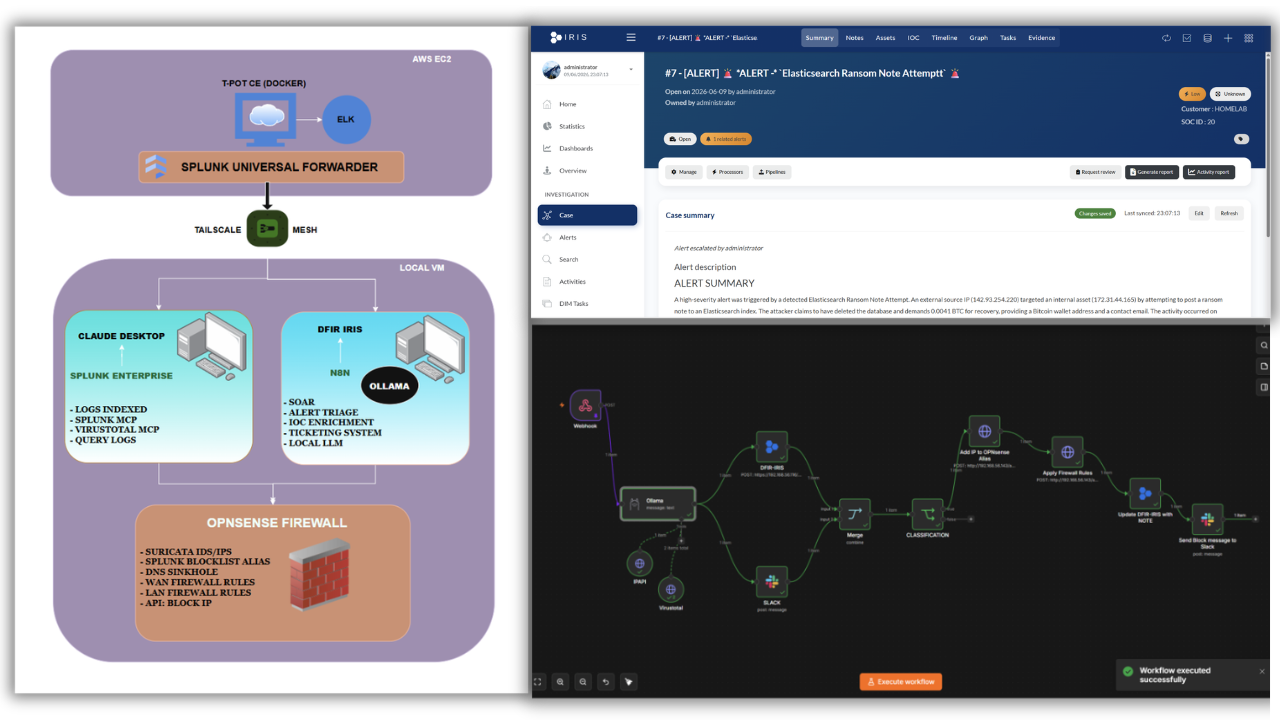
## 2. Architecture
## 3. EC2 Instance Setup
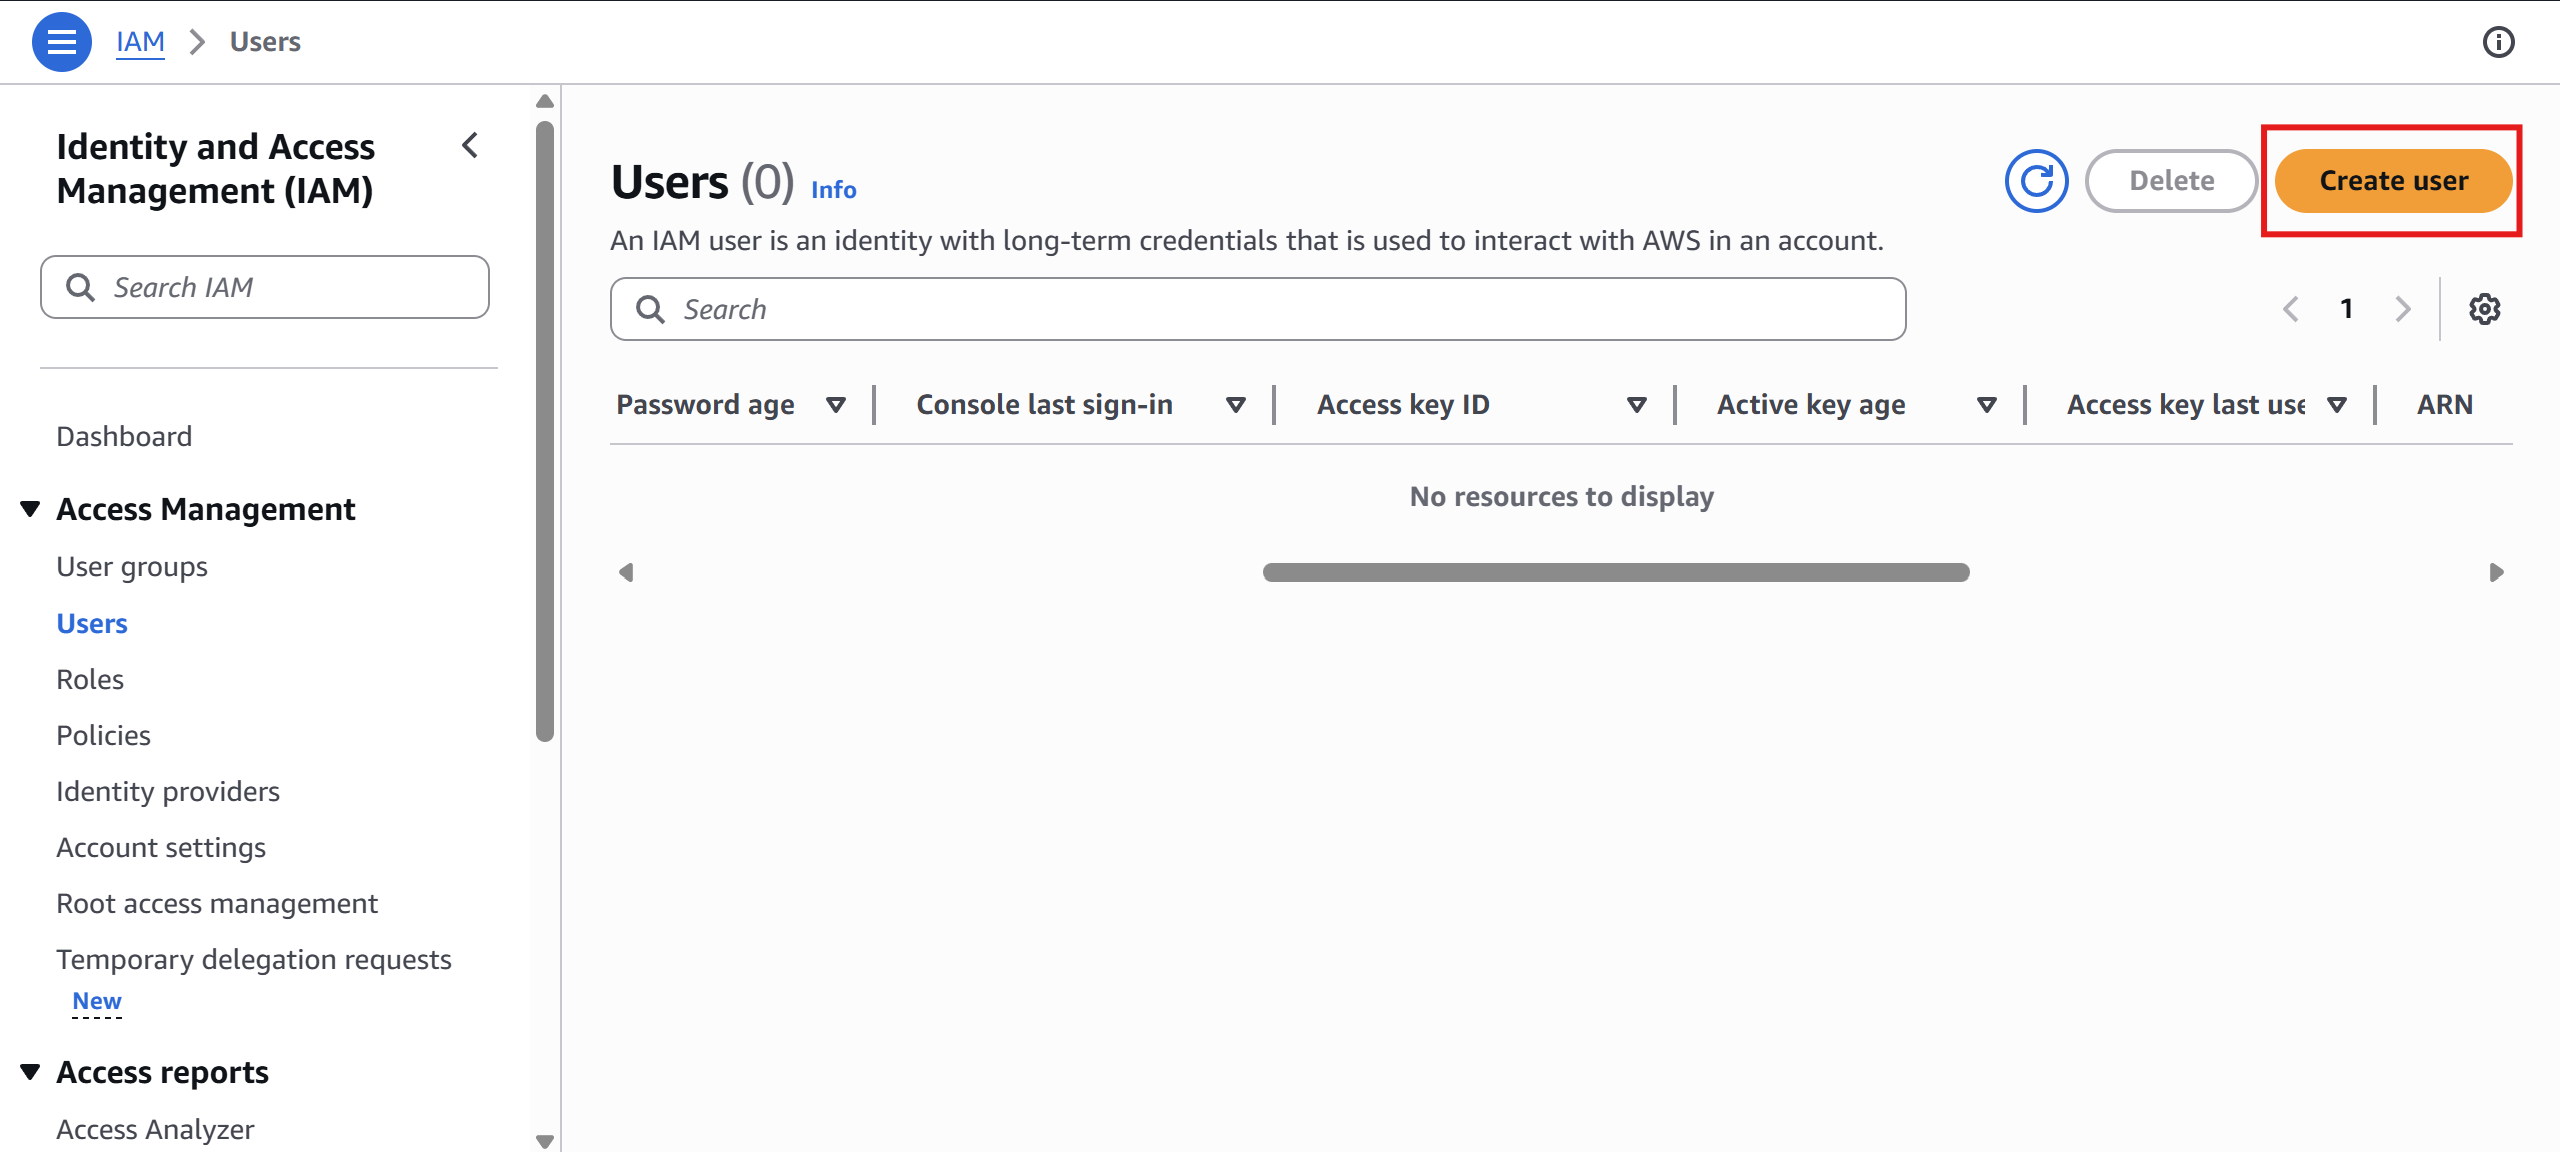
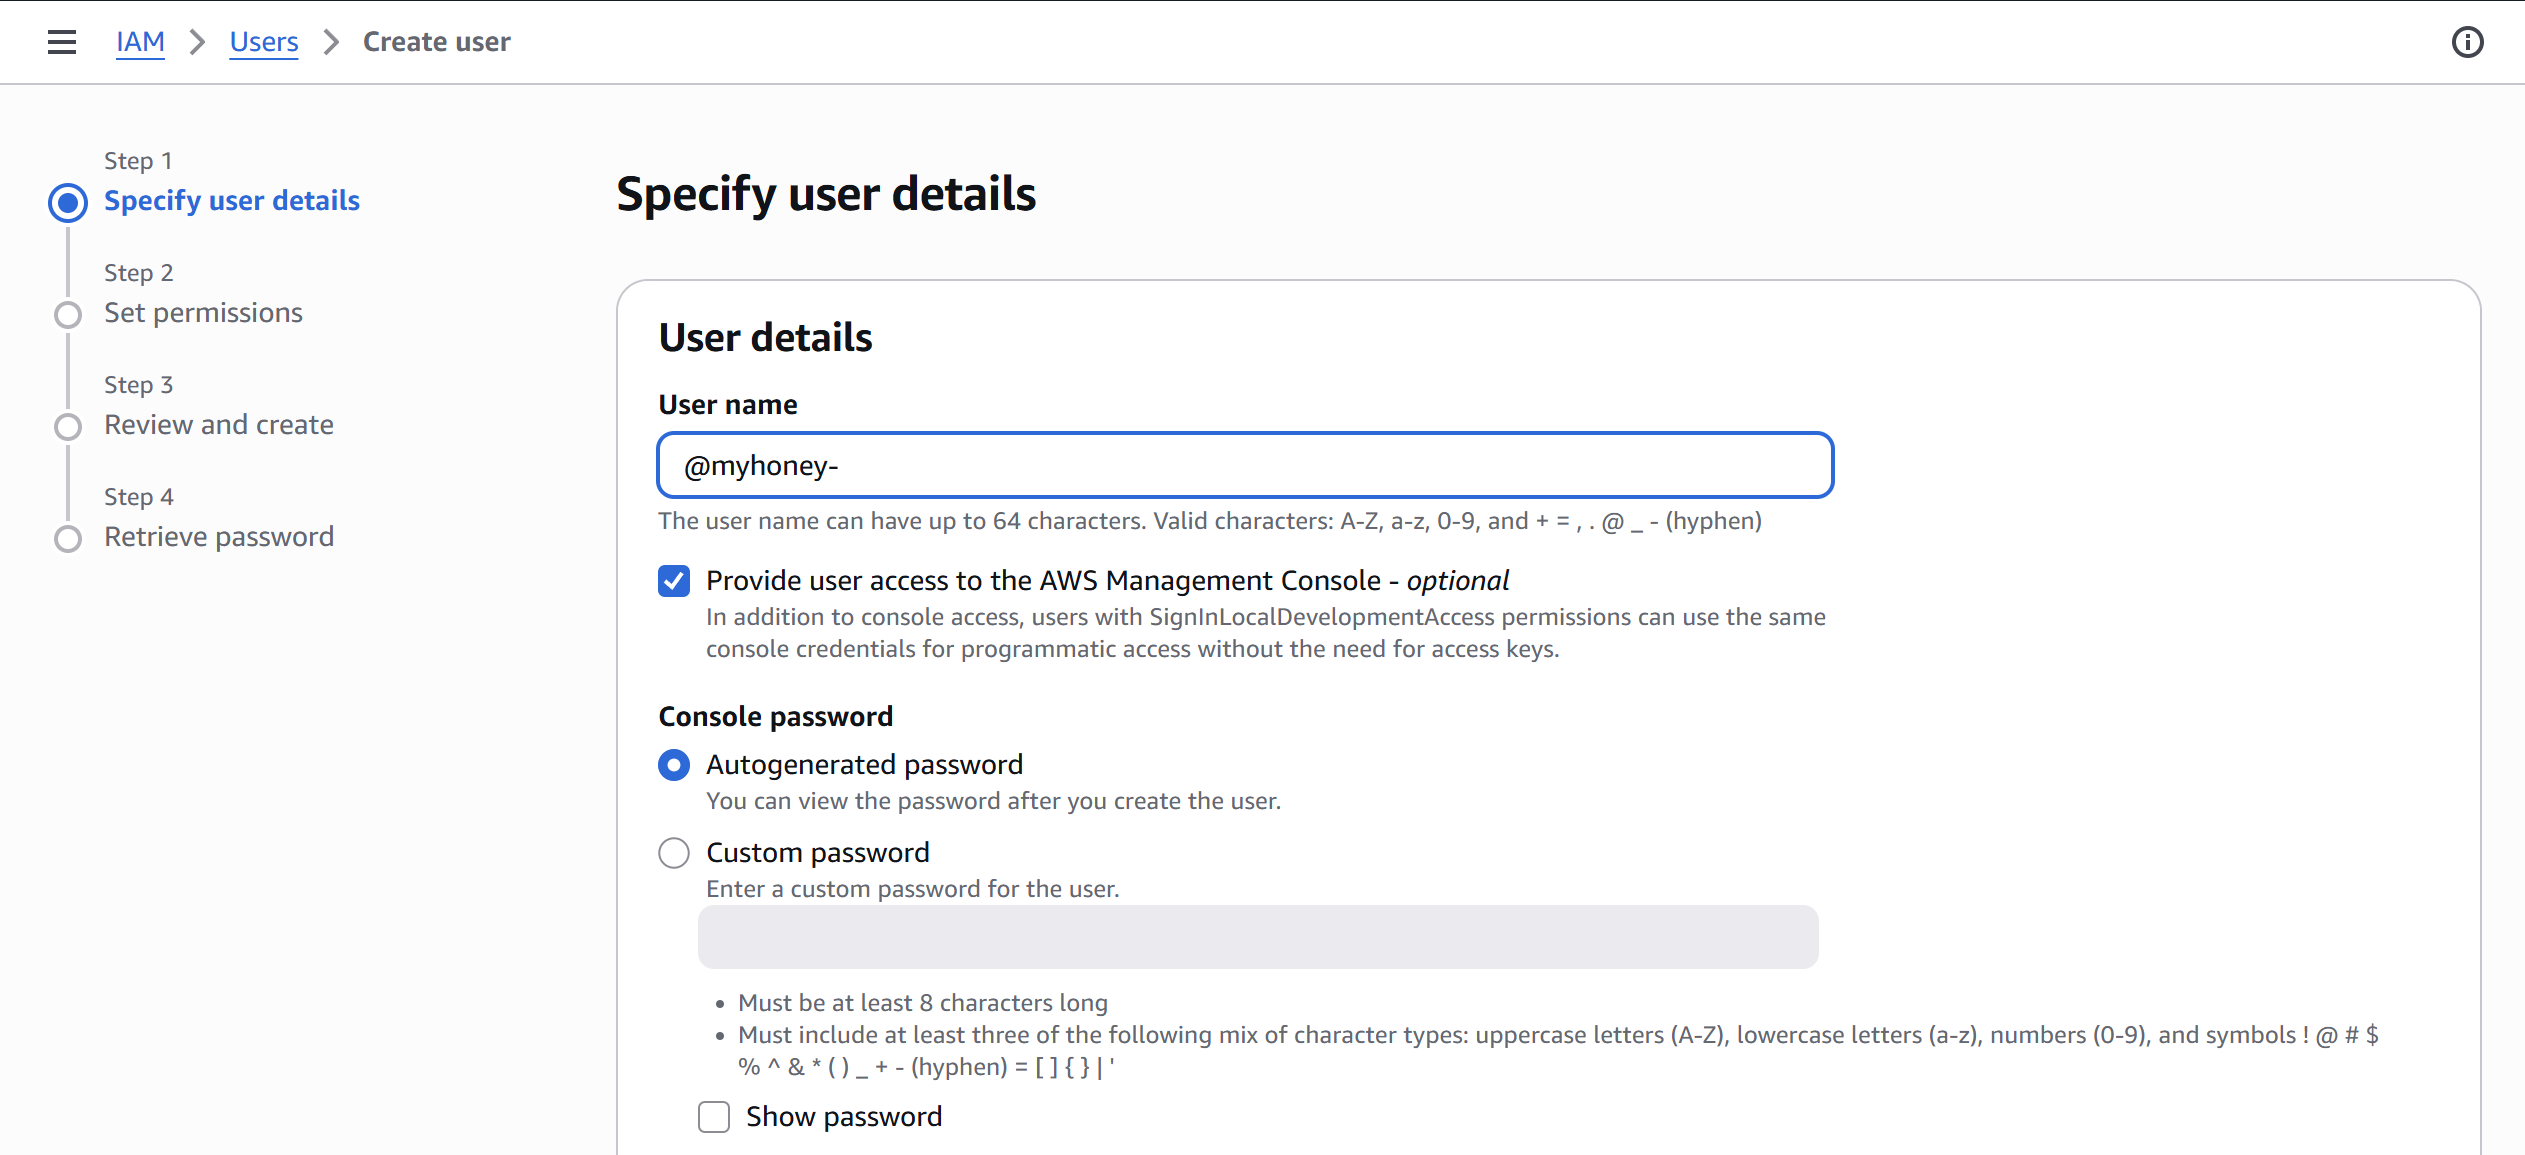
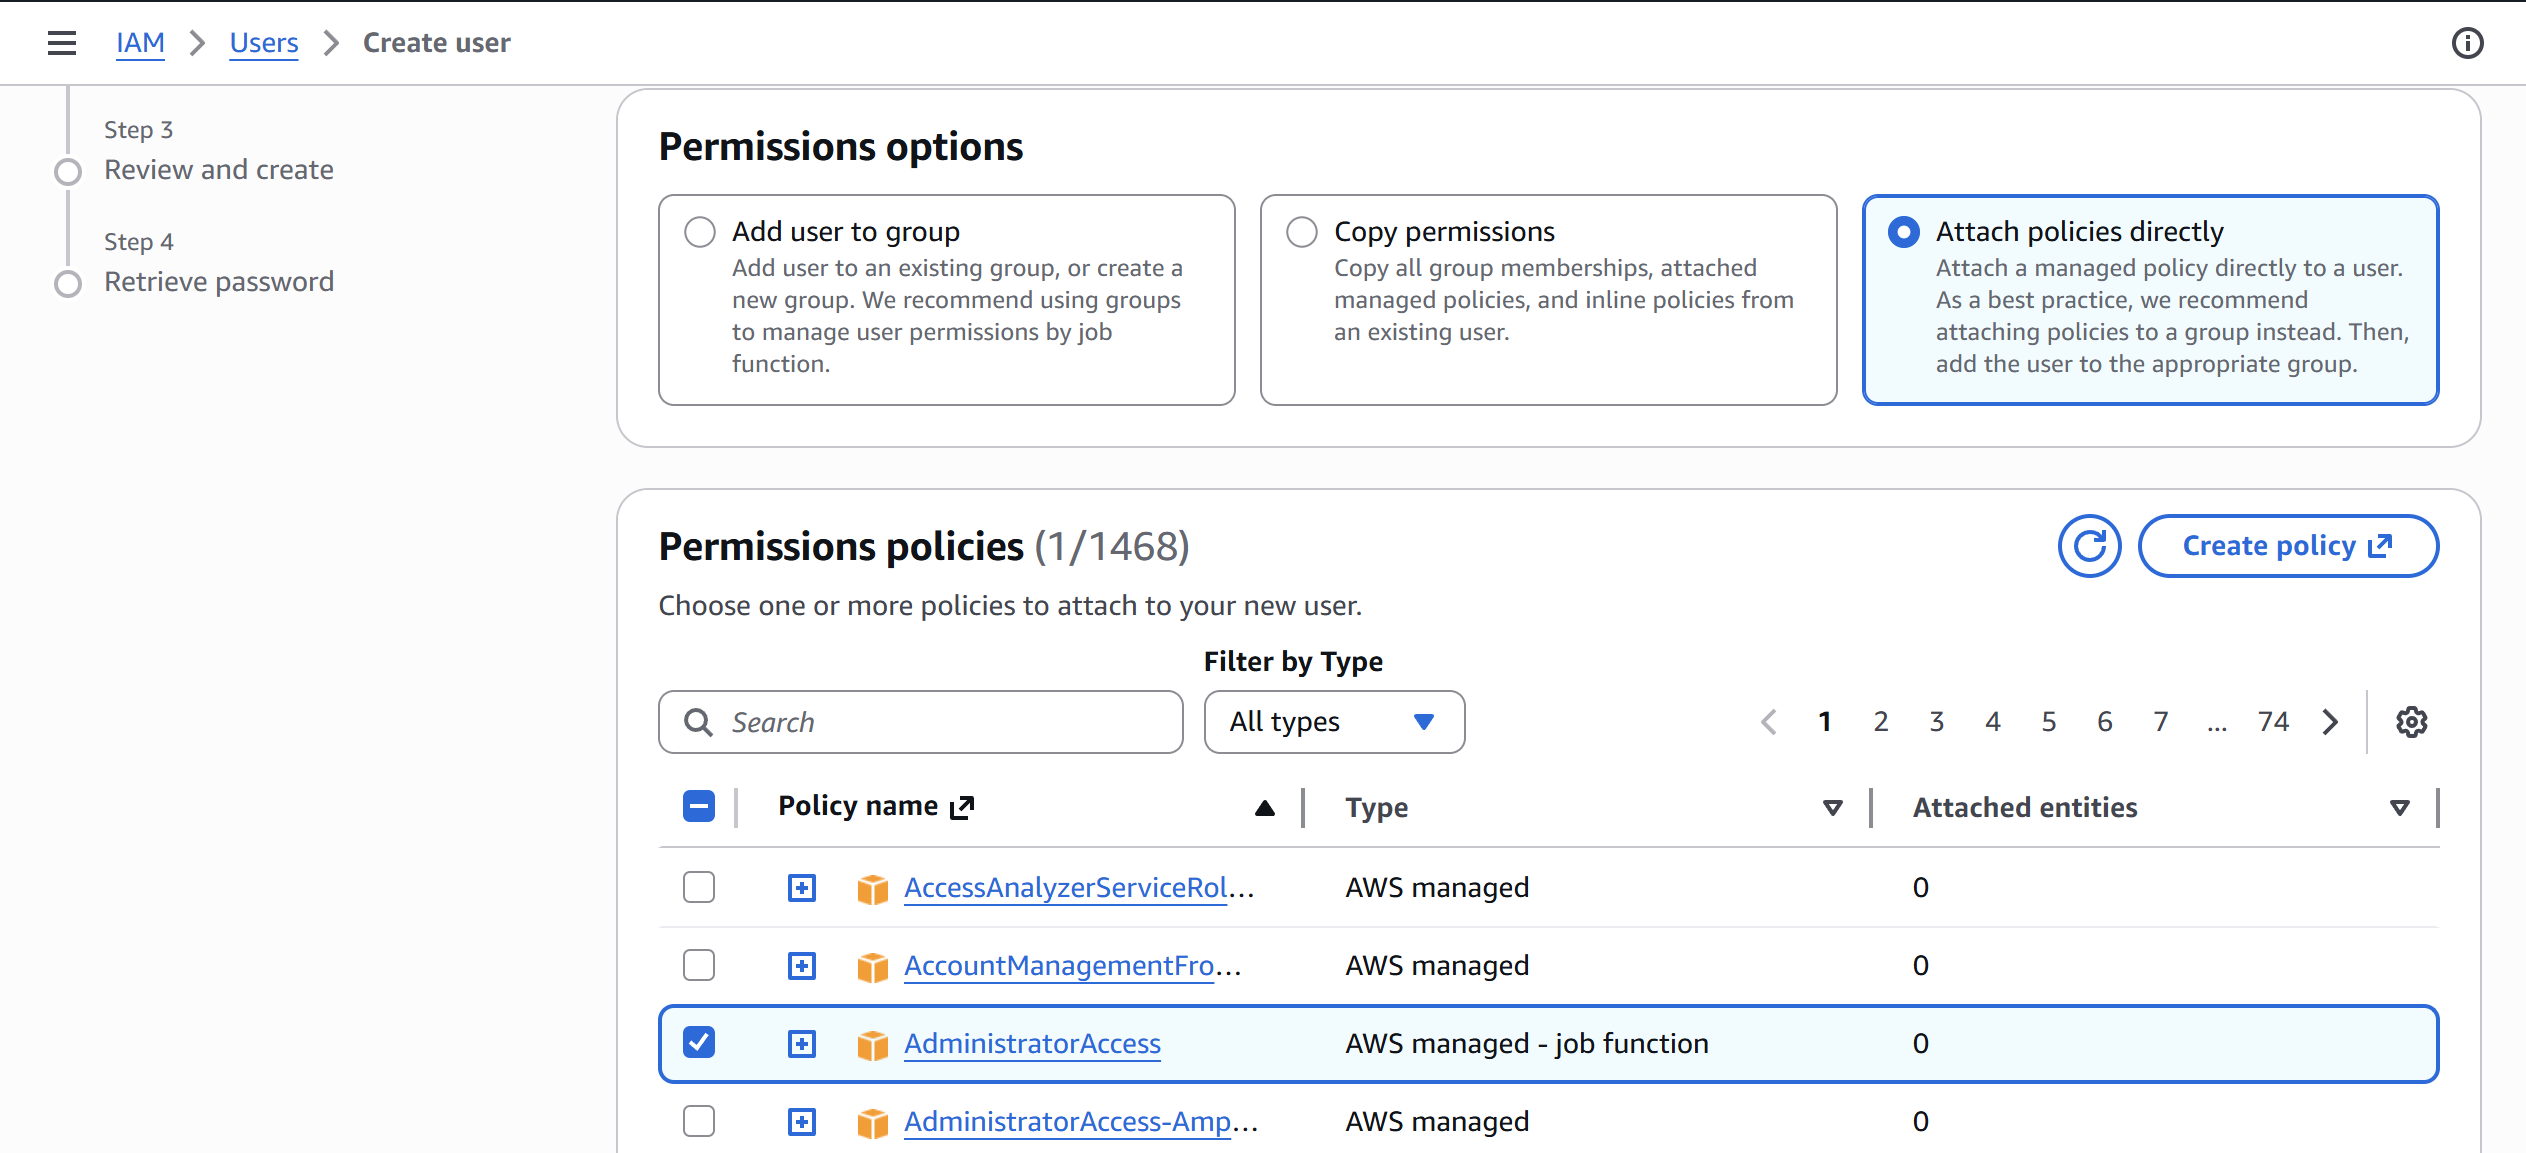
### 3.1 IAM User & Instance Launch
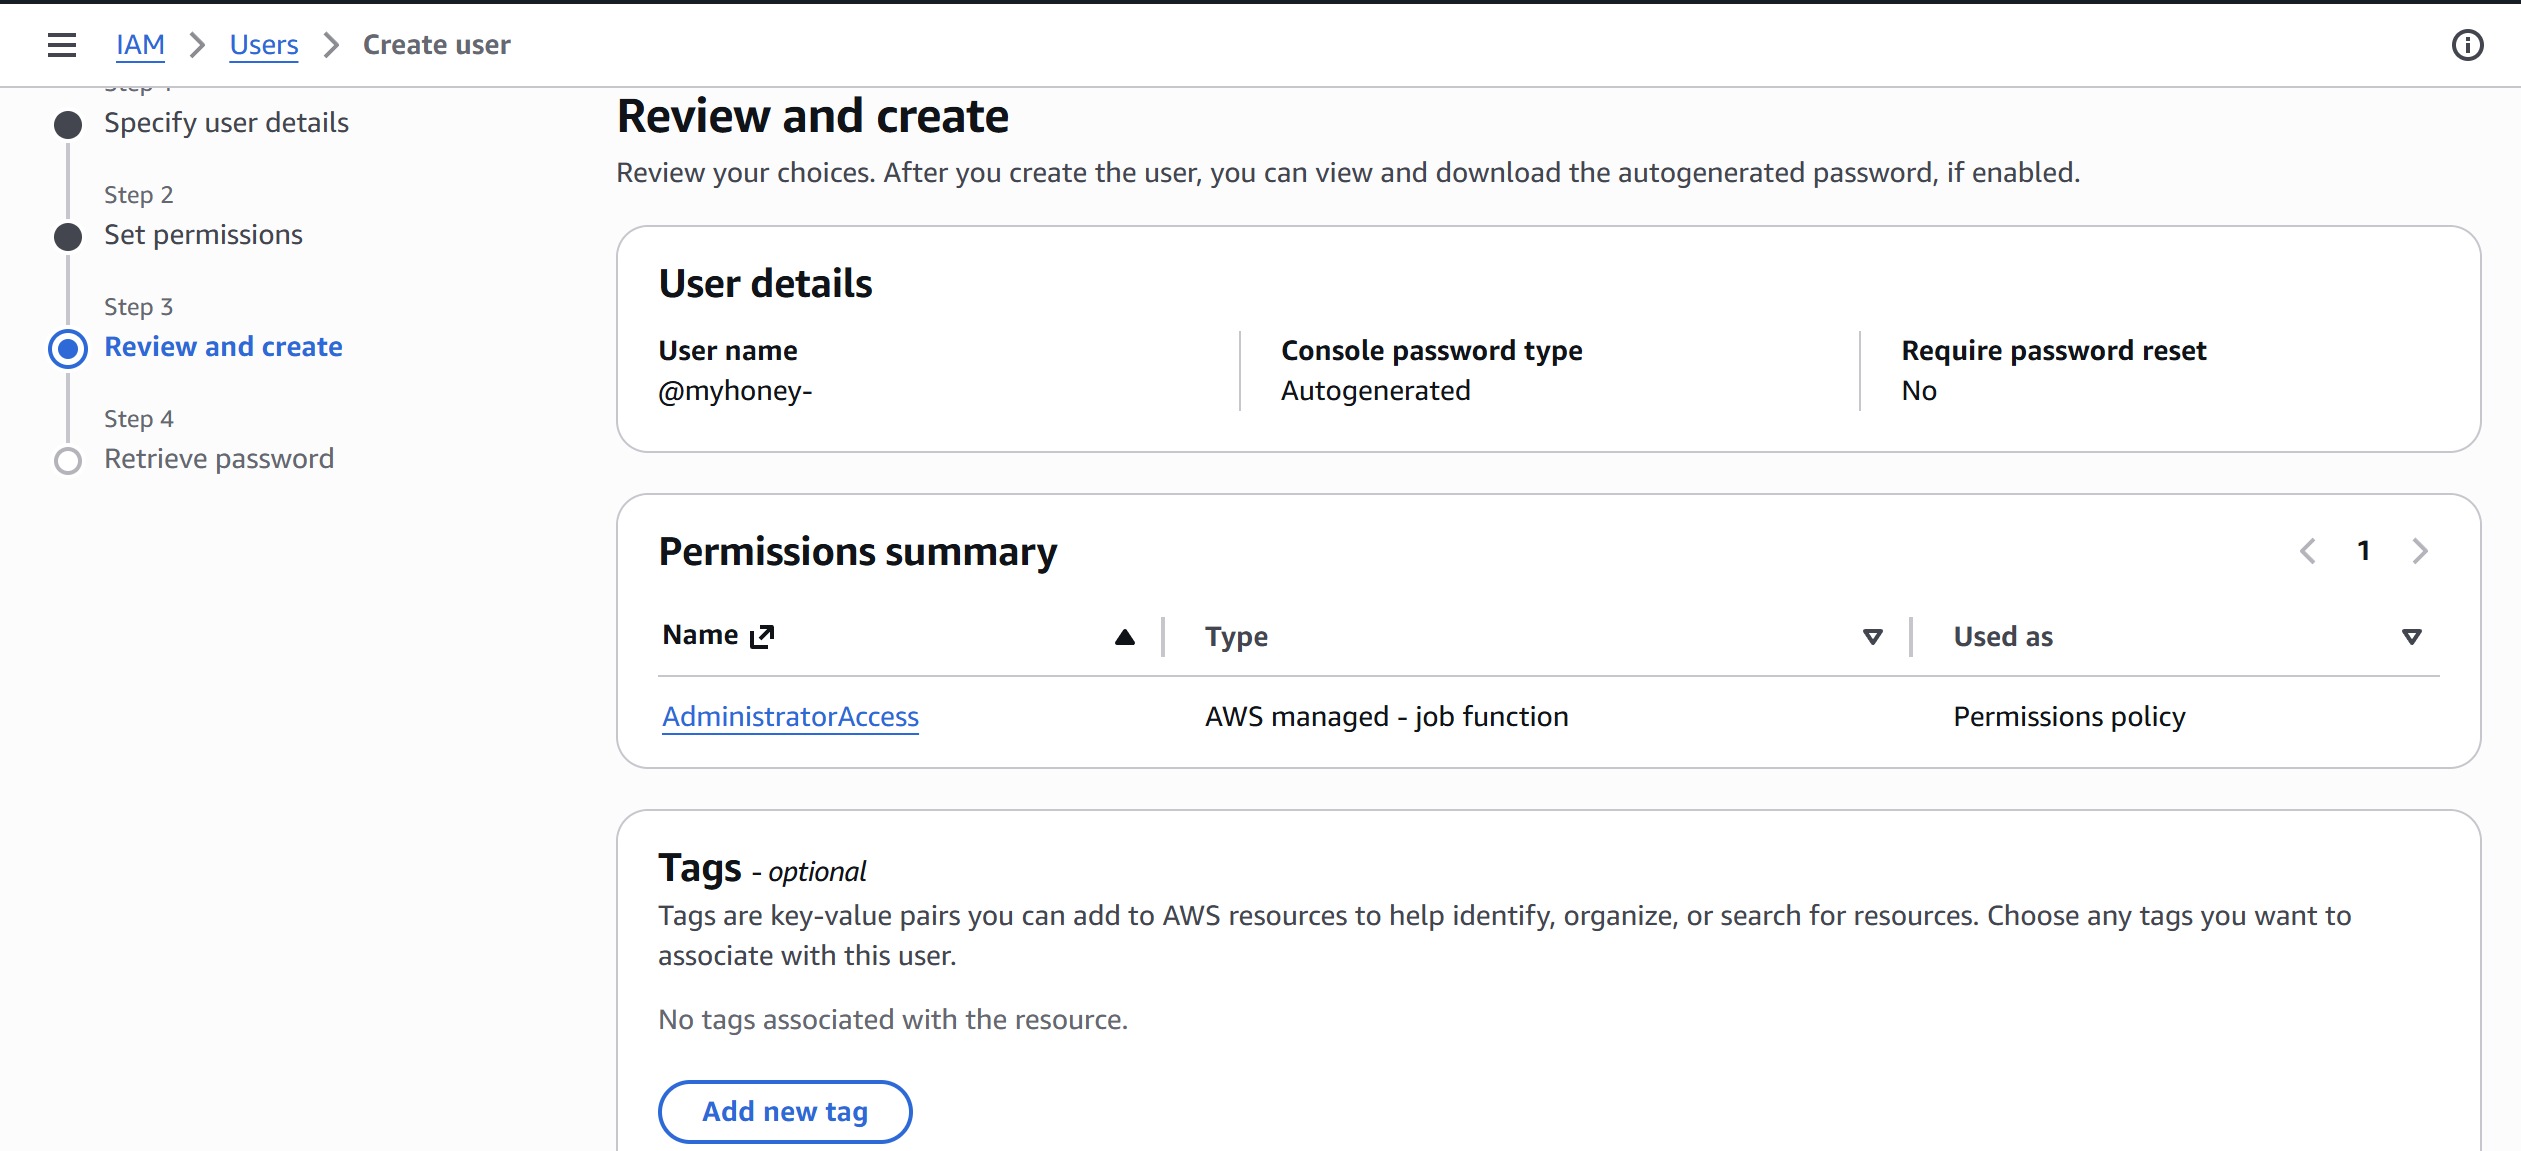
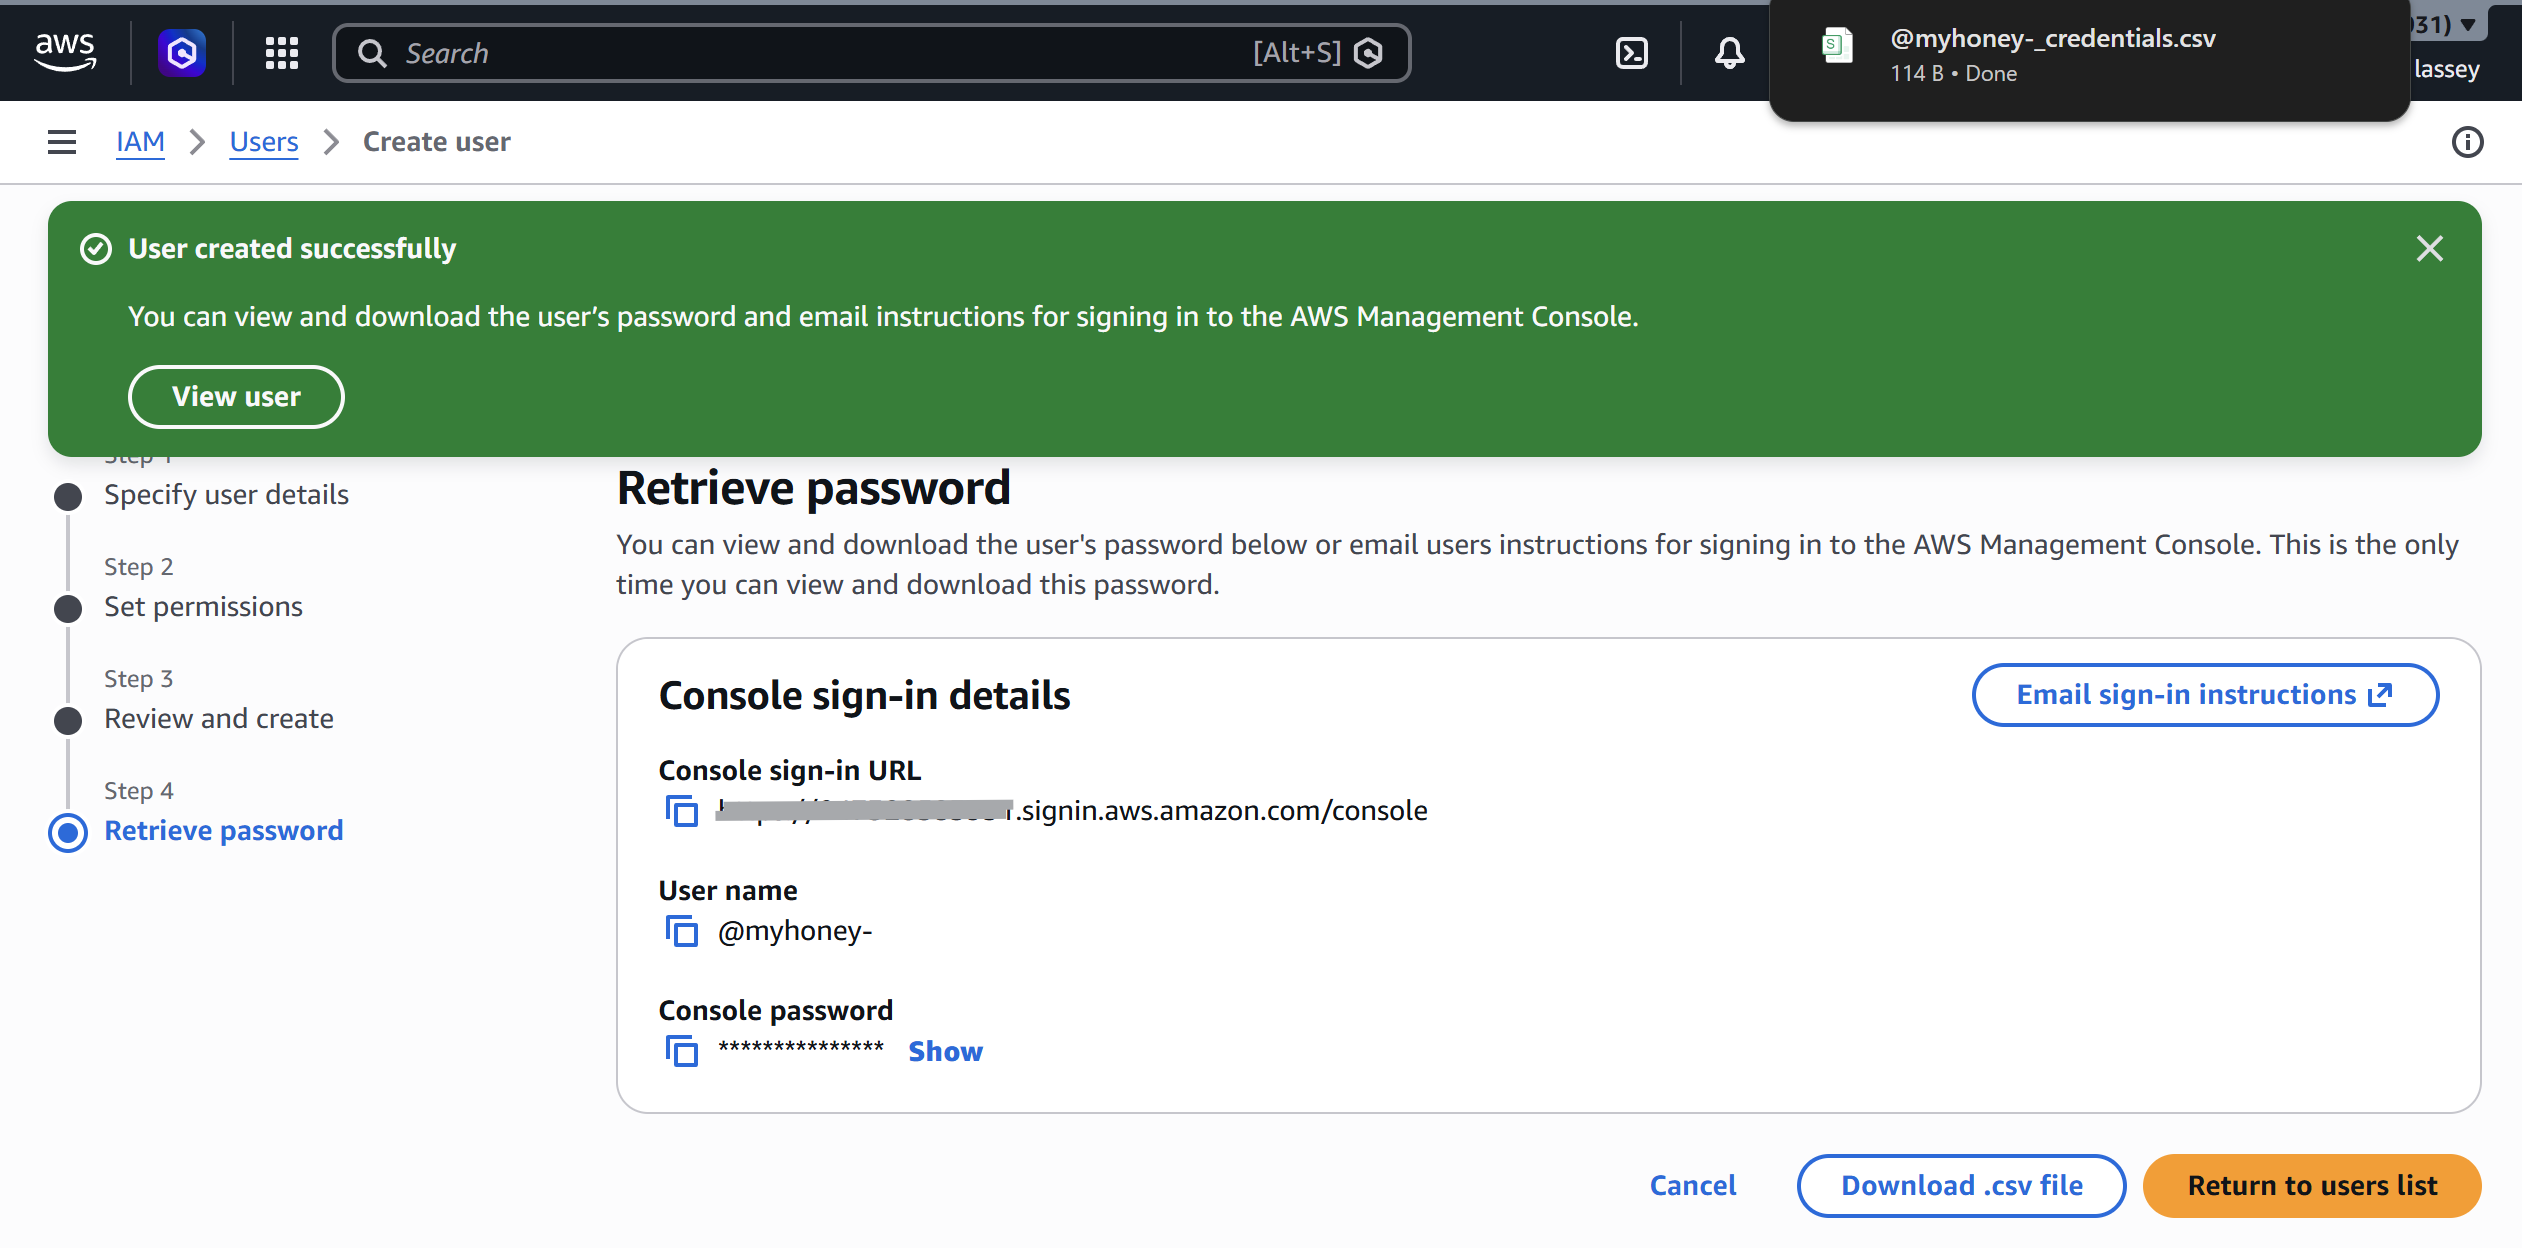
Started by creating a dedicated IAM user rather than using the root account, a standard practice and my first real AWS project principle: never use root for operational work.
For the instance itself:
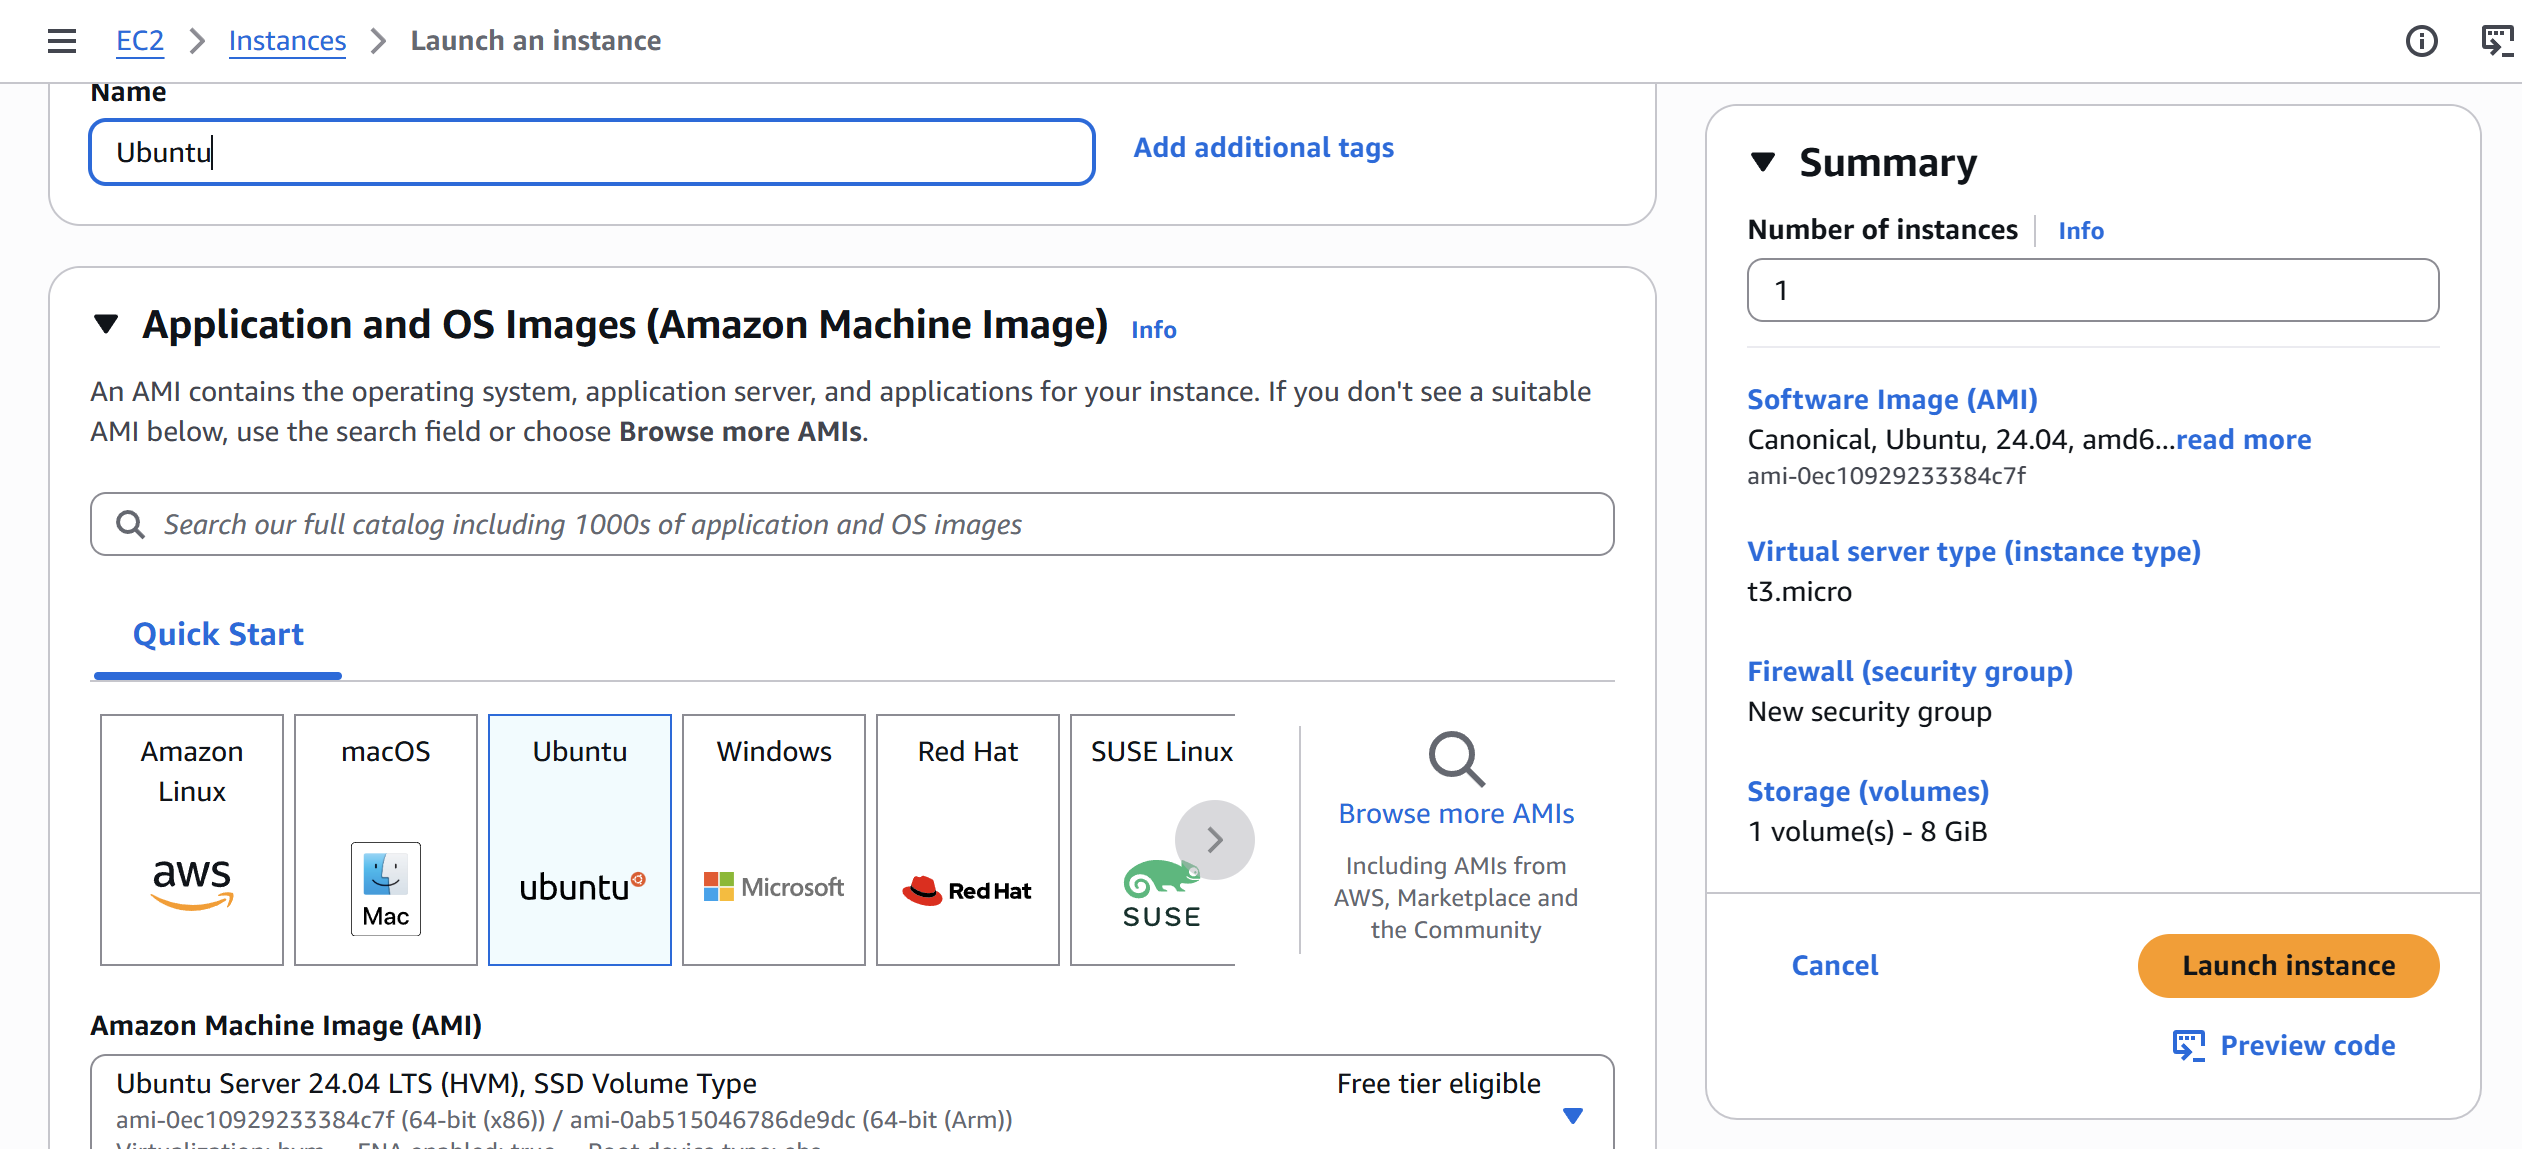
- **AMI:** Ubuntu (latest LTS)
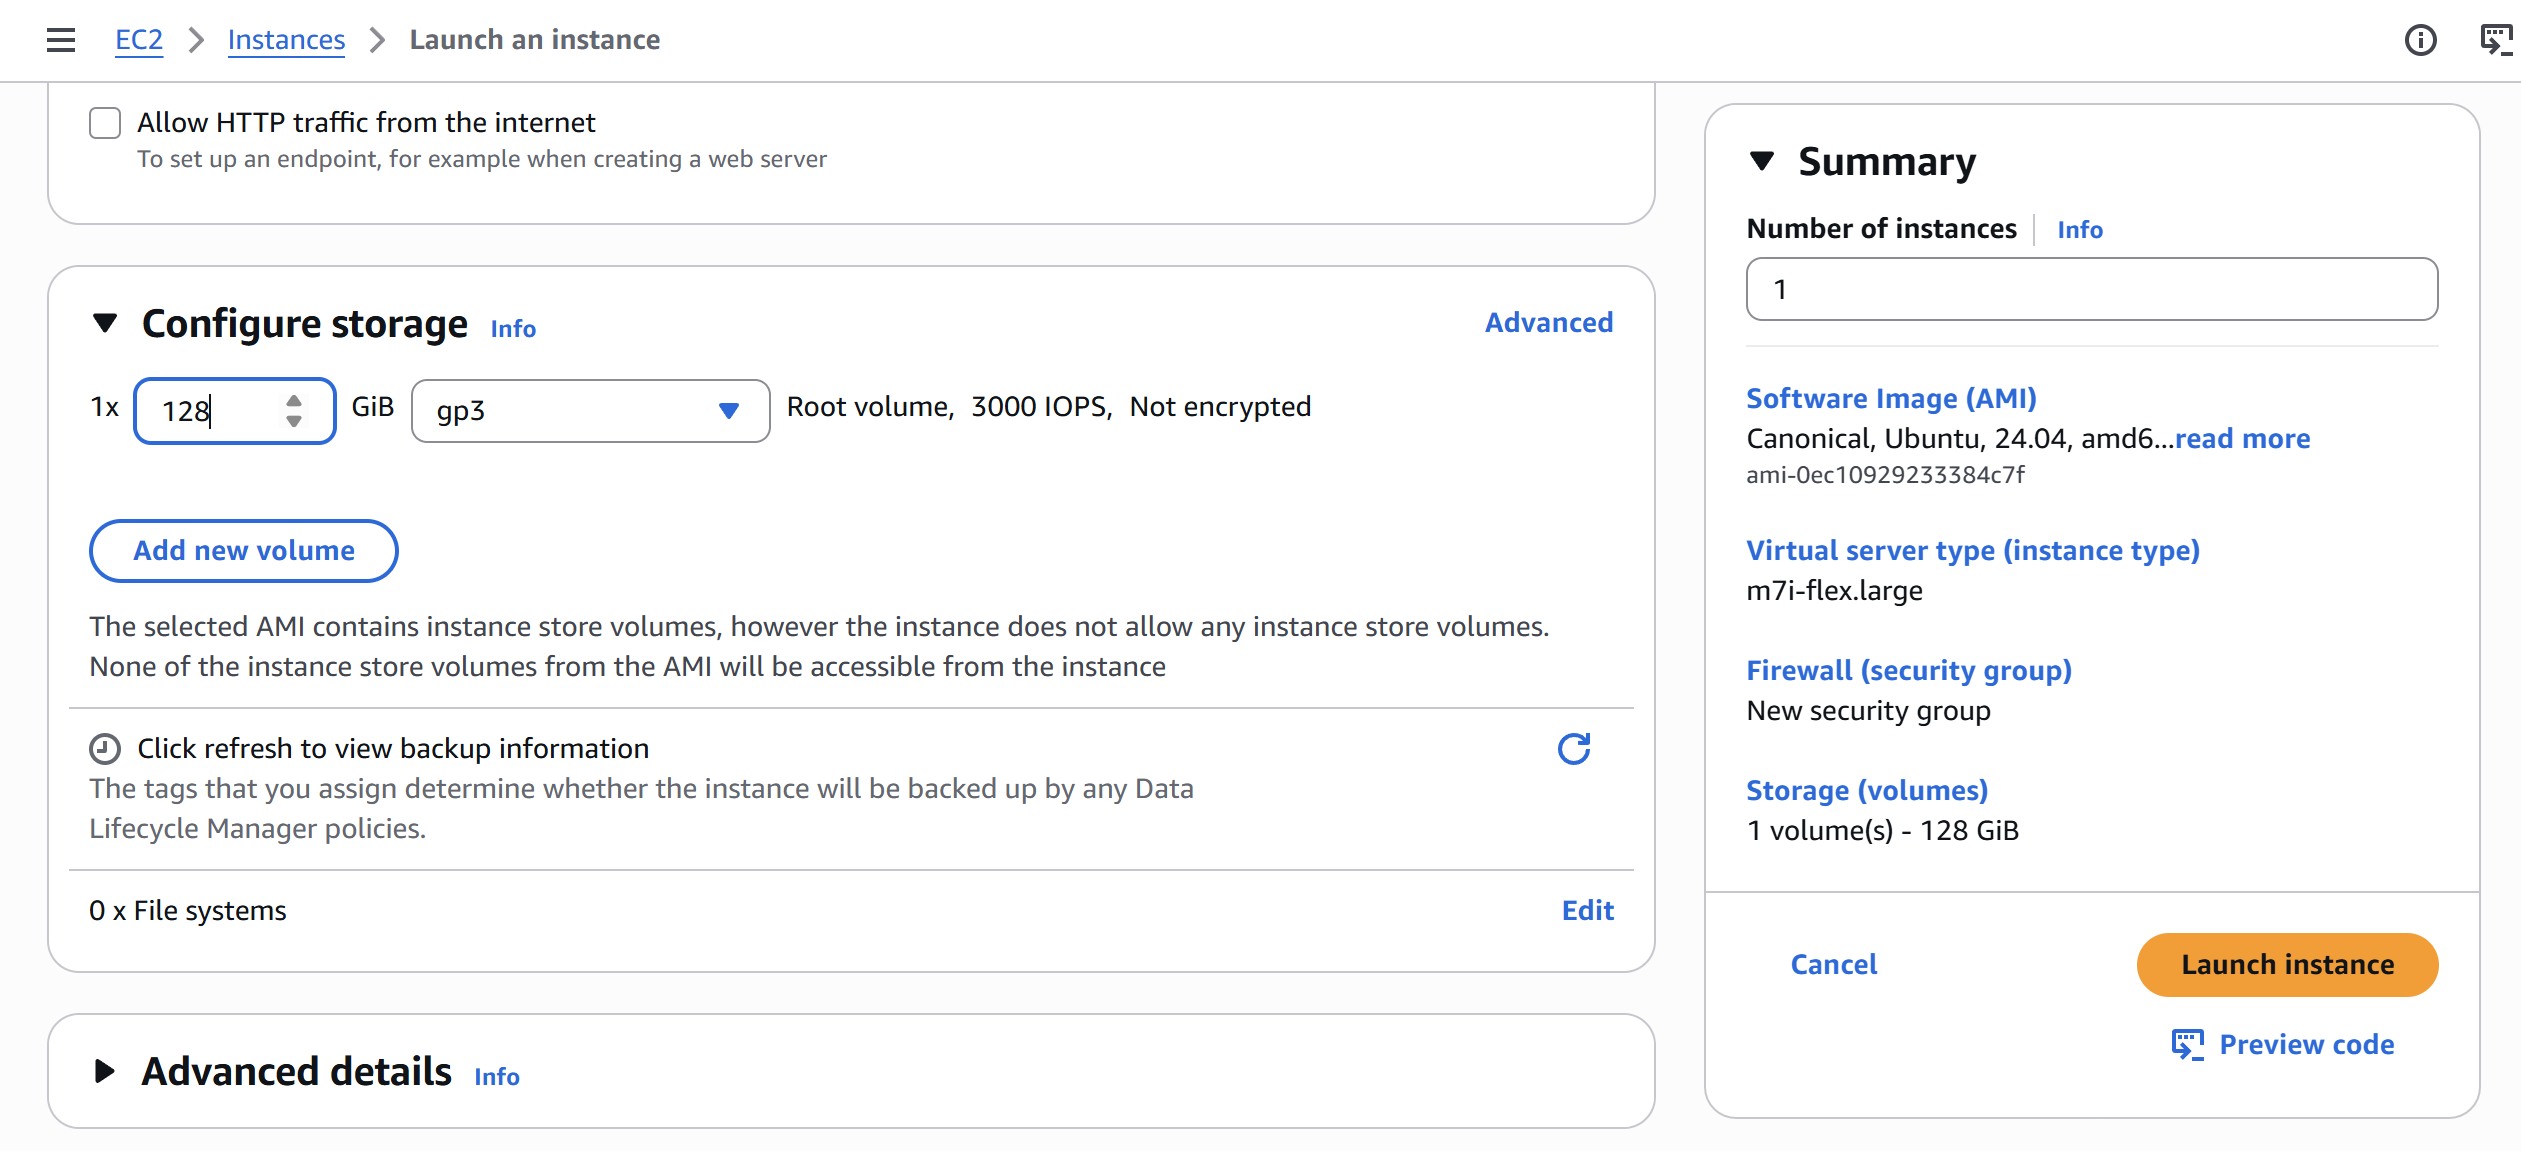
- **Instance type:** `m7i-flex.large` - 2 vCPU, 8 GB RAM. Would have preferred 16 GB honestly, but this was the highest I had free tier access to and it held up just fine.
- **Storage:** 128 GB (gp3) - T-Pot runs a full ELK stack in Docker so it eats disk fast
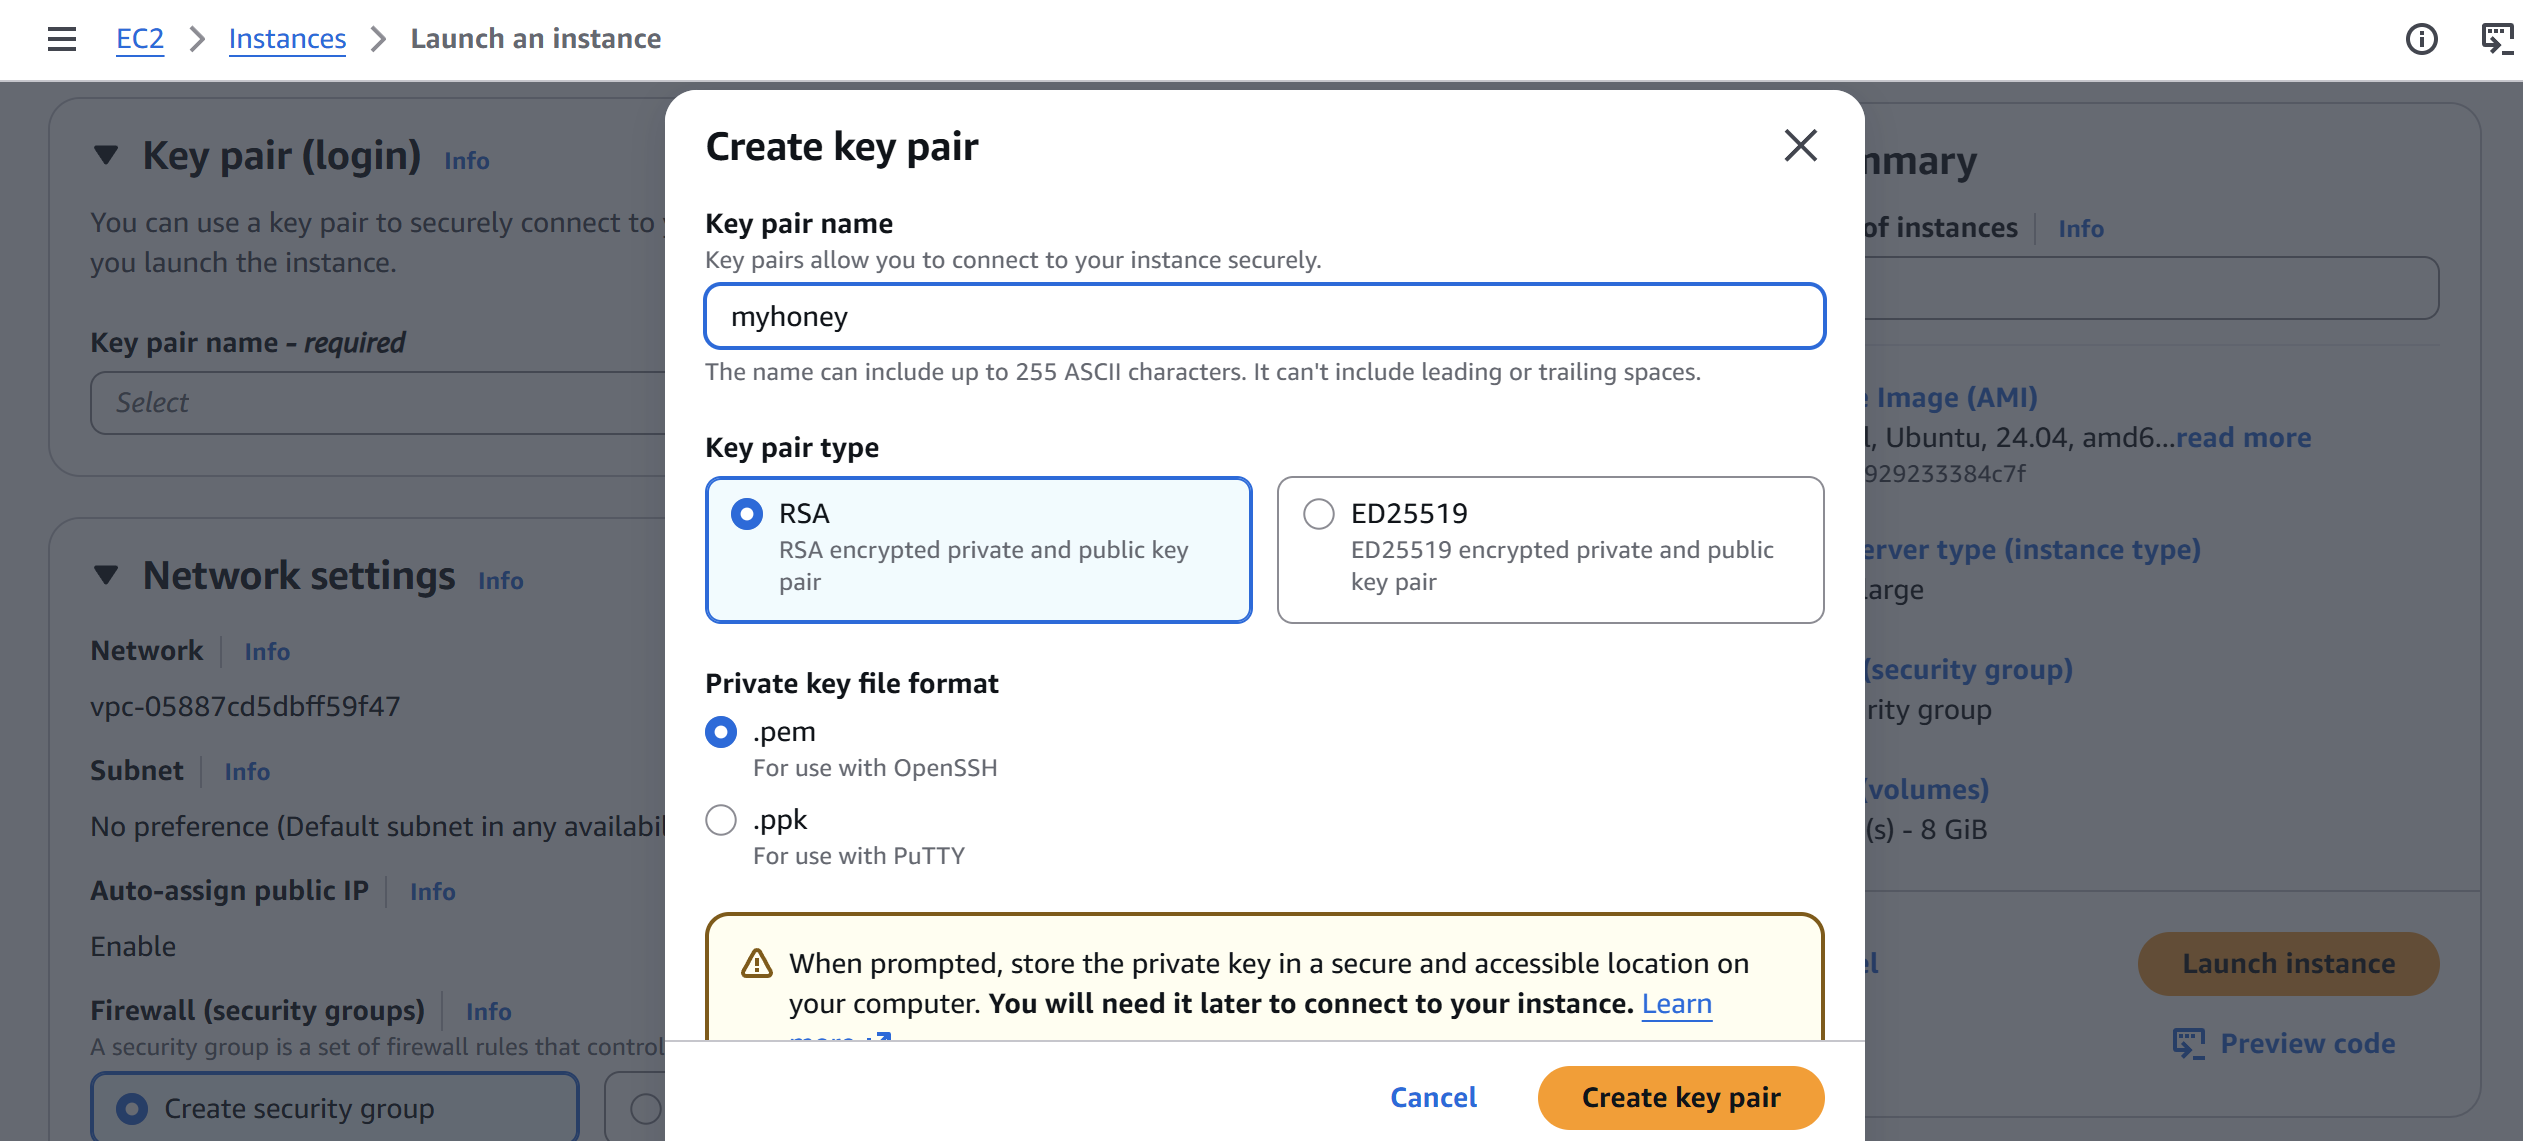
- **Key pair:** Created a new `.pem` key pair for SSH access
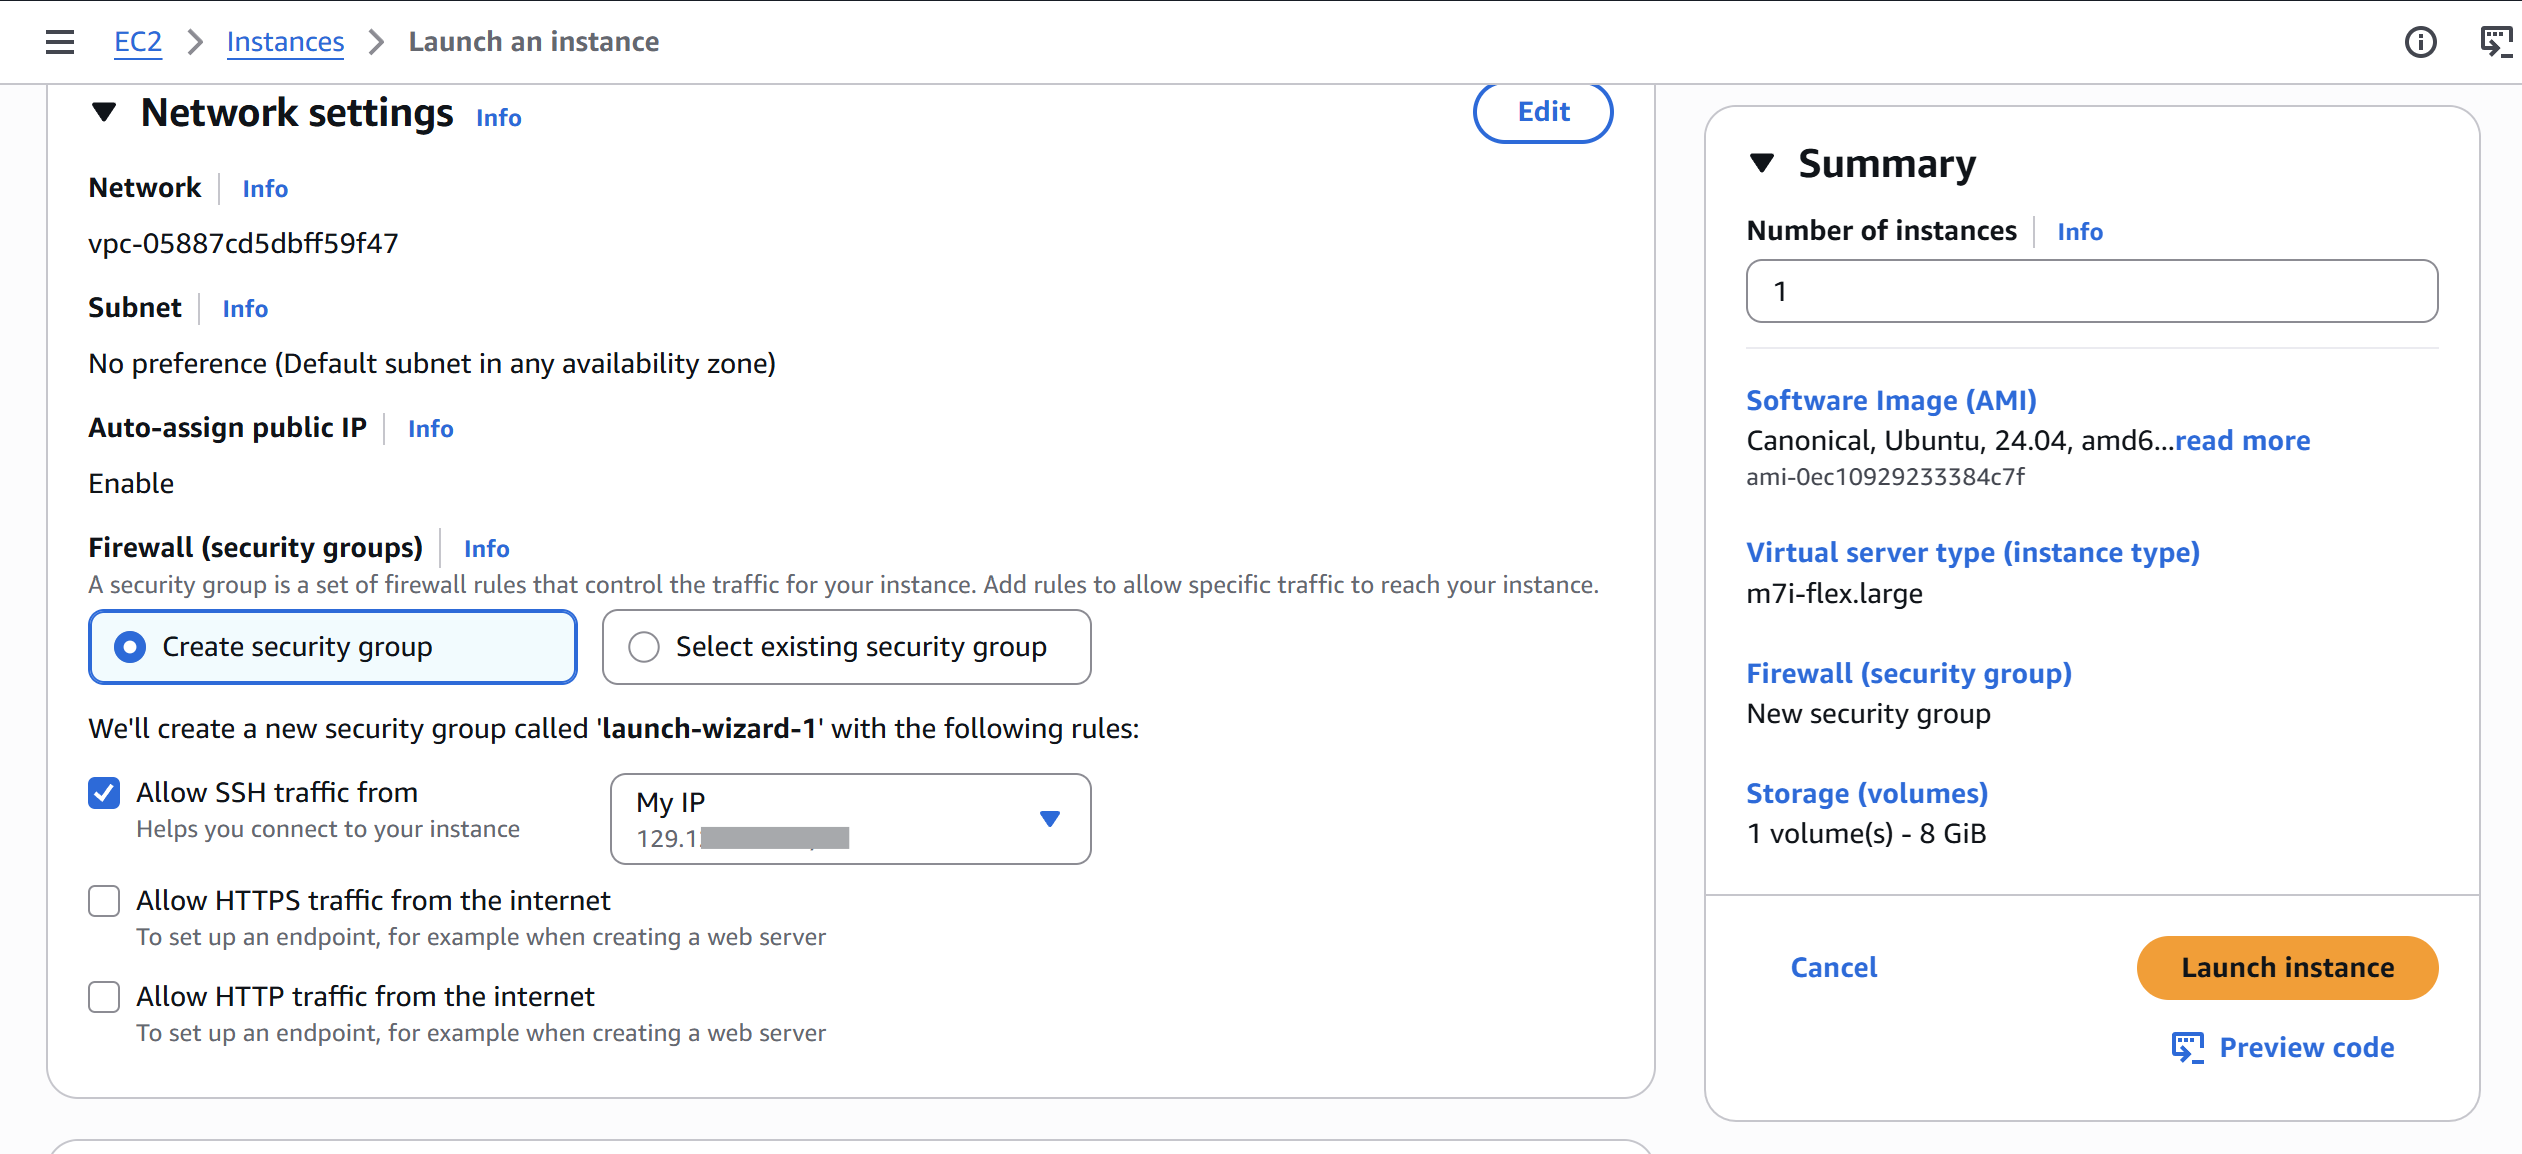
For network settings during launch, I created a new security group (`launch-wizard-1`) with a single rule allowing SSH from my IP only. The plan was to lock it down tight first and open it up for attacks only after everything was verified working.
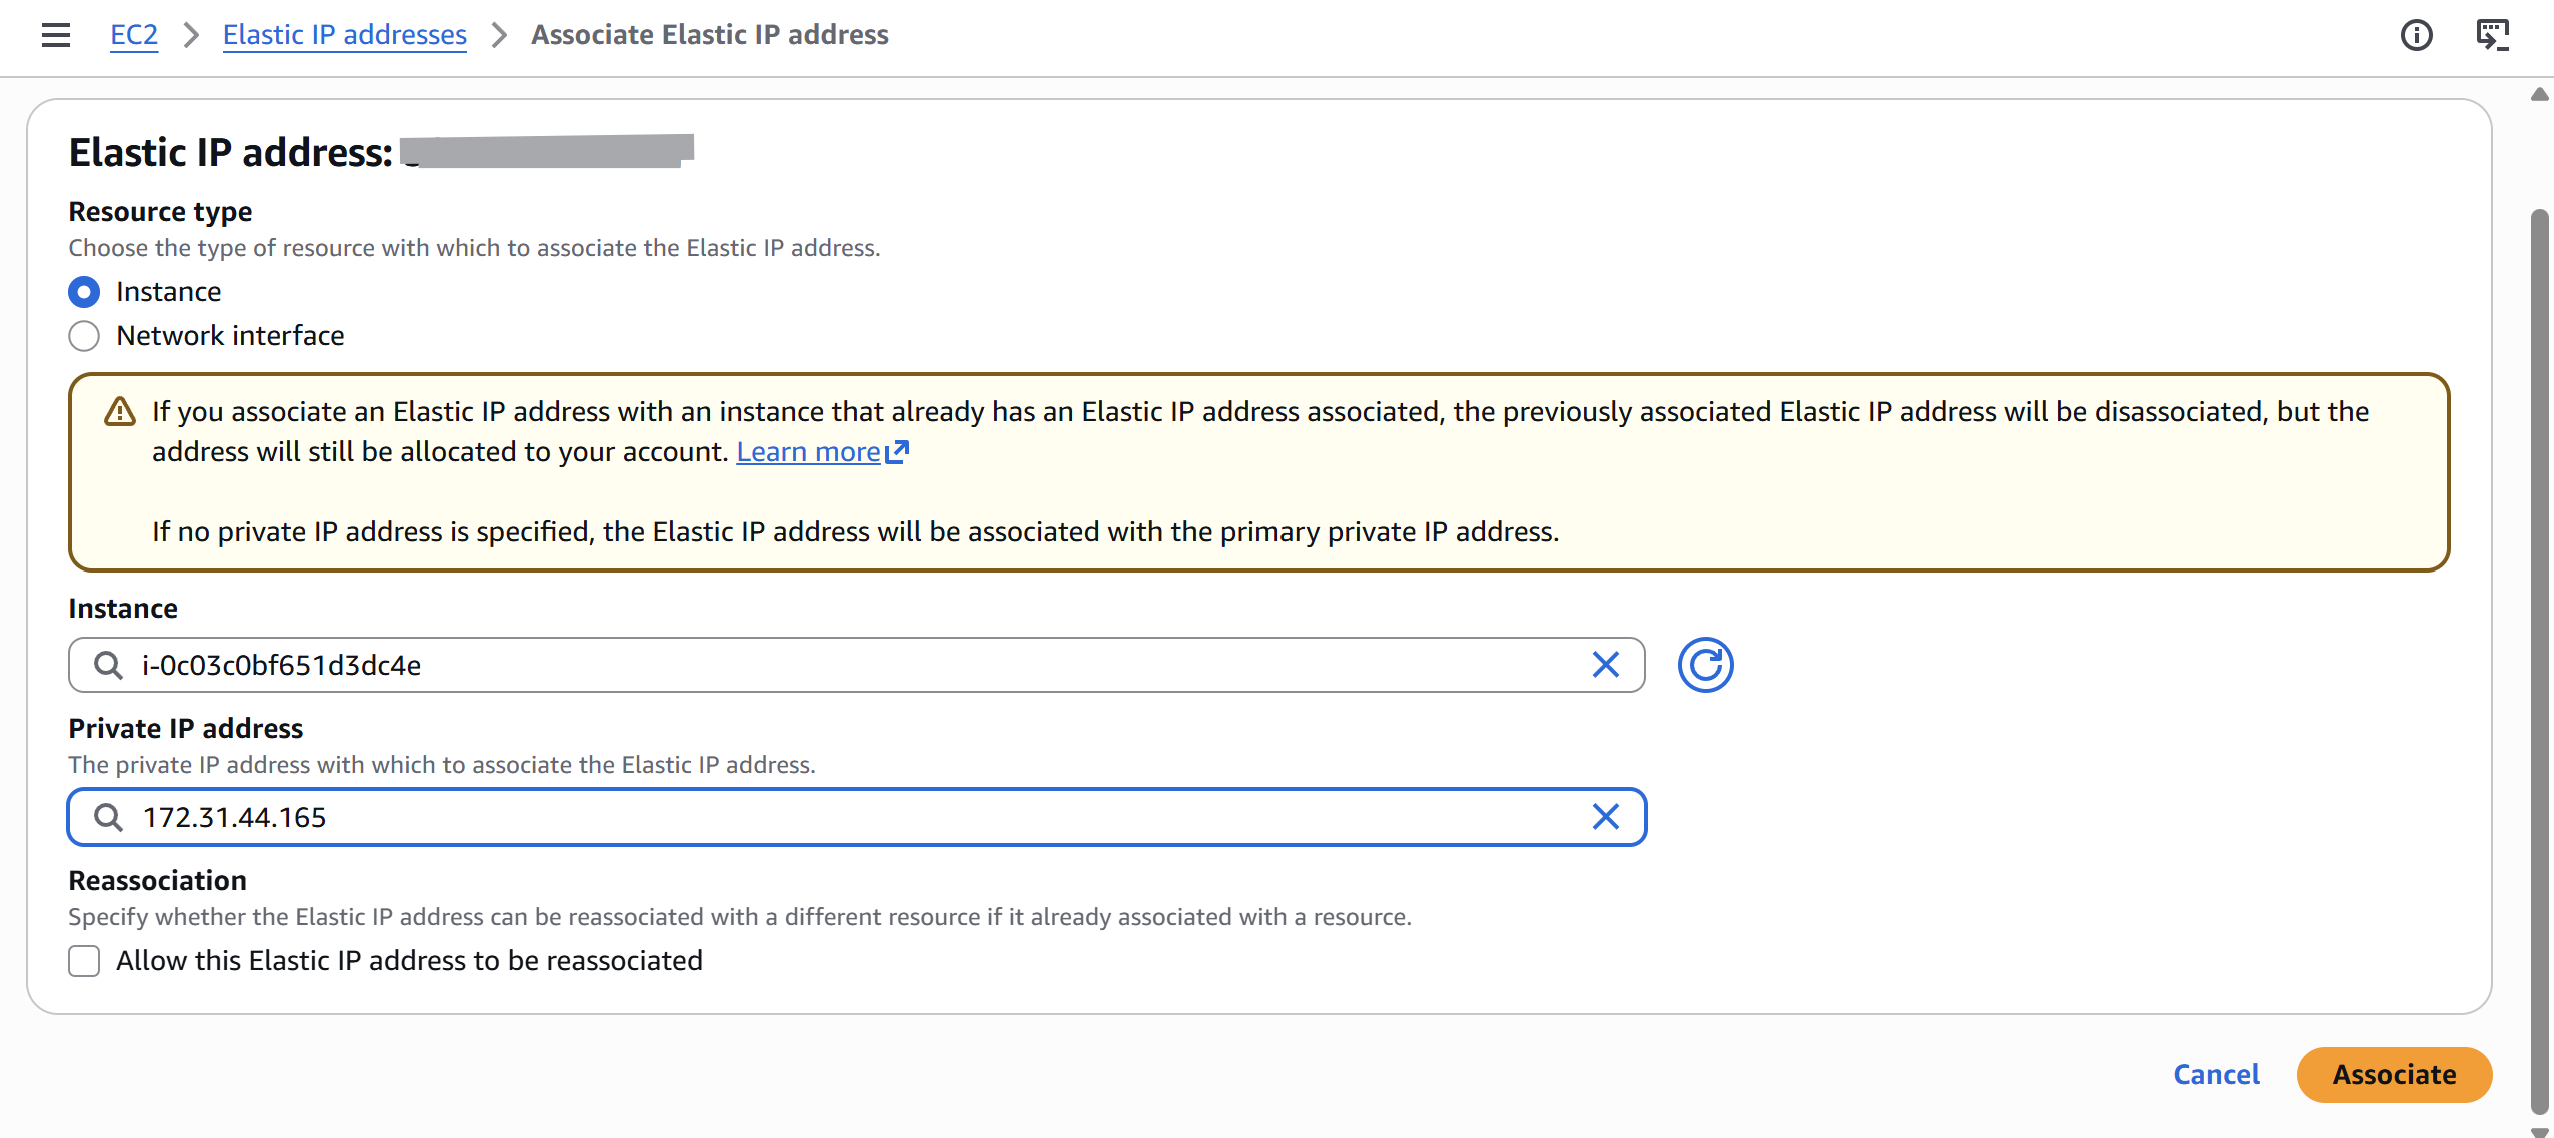
### 3.2 Elastic IP & SSH Access
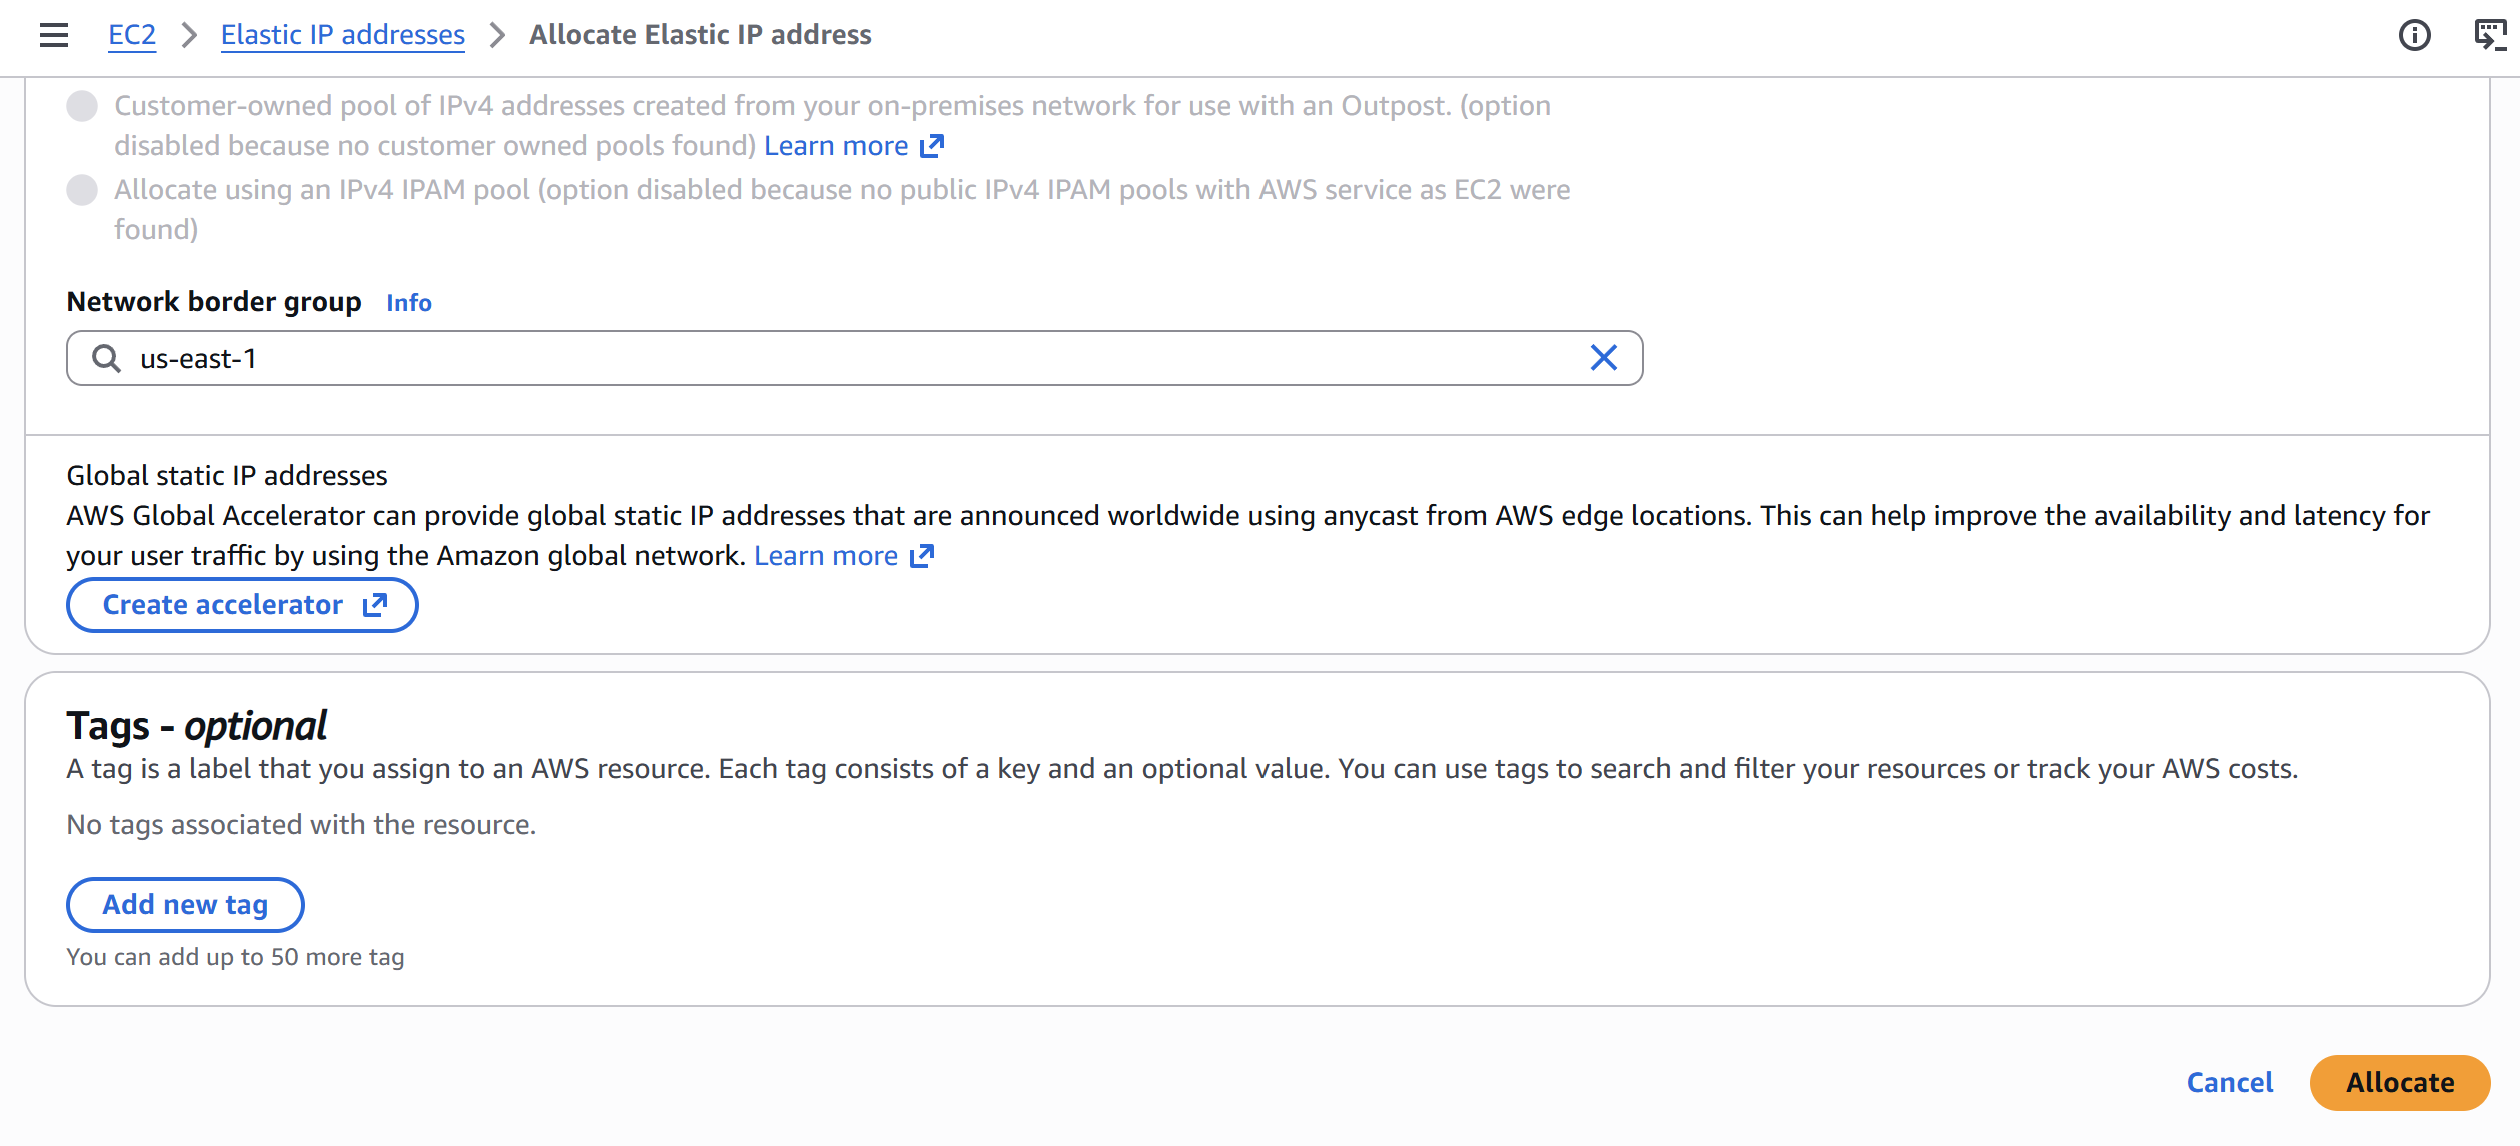
Before connecting to the instance for the first time, I allocated an Elastic IP, AWS's feature for a static public IP that doesn't change when the instance restarts. Really important for a long-running honeypot so you're not chasing a new IP every time there's a reboot.
Steps:
1. EC2 Console > Elastic IPs > Allocate Elastic IP address
2. Associate it to the running instance

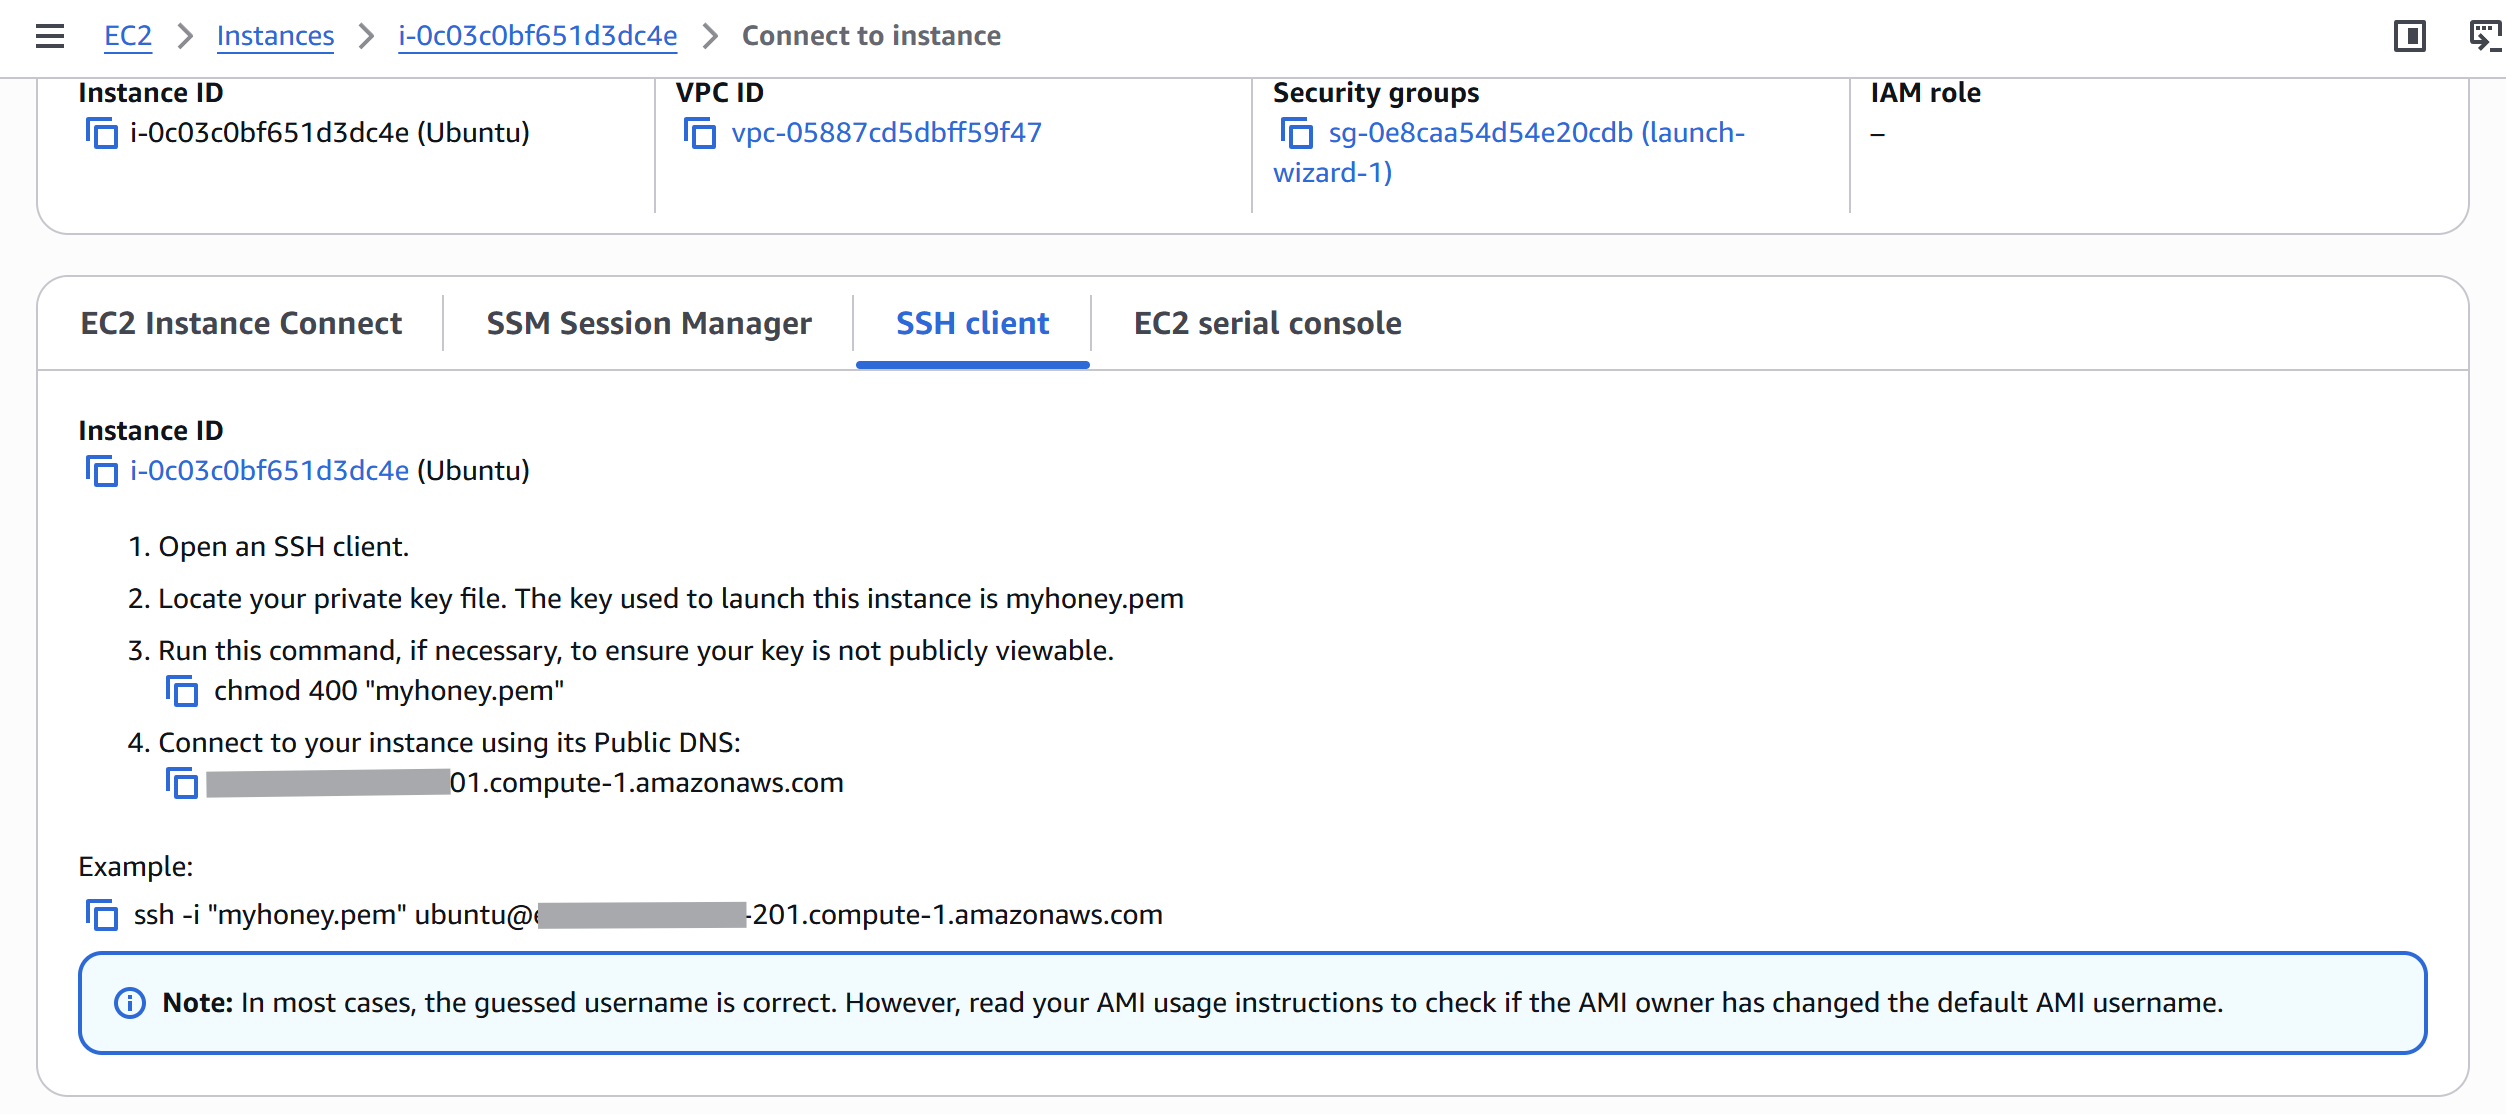
Then connected via SSH:
ssh -i "myhoney.pem" ubuntu@
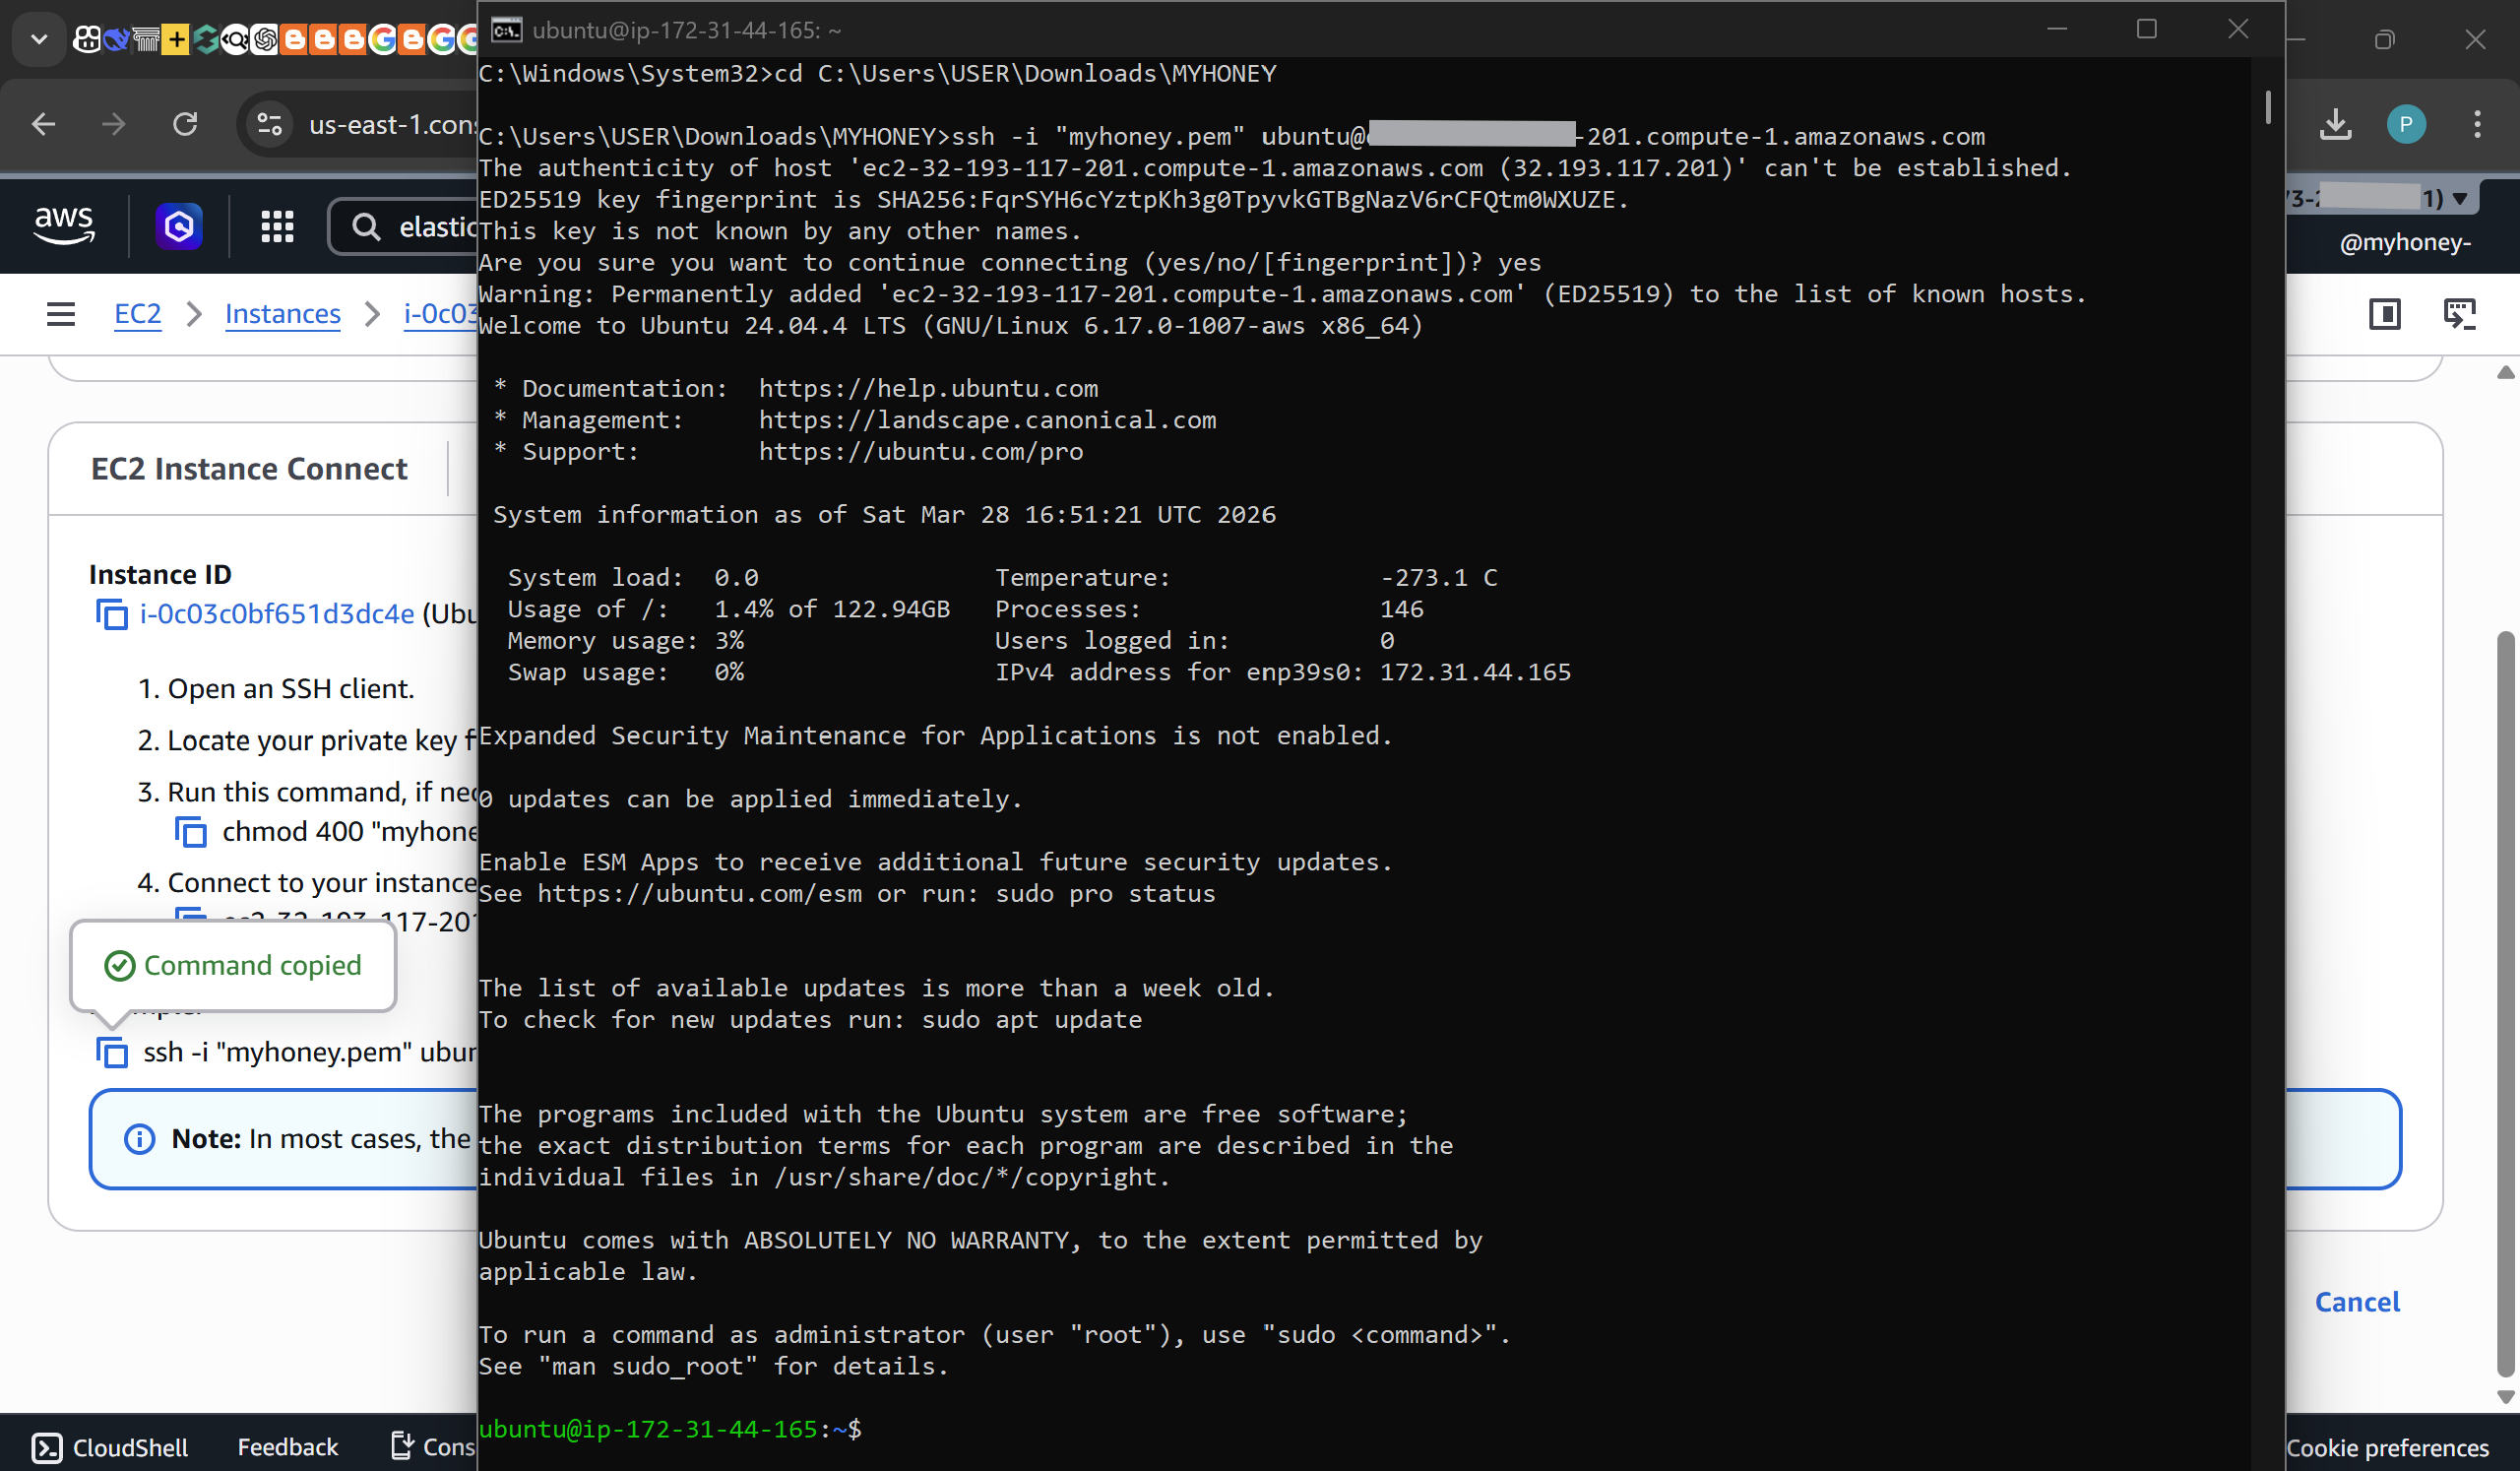
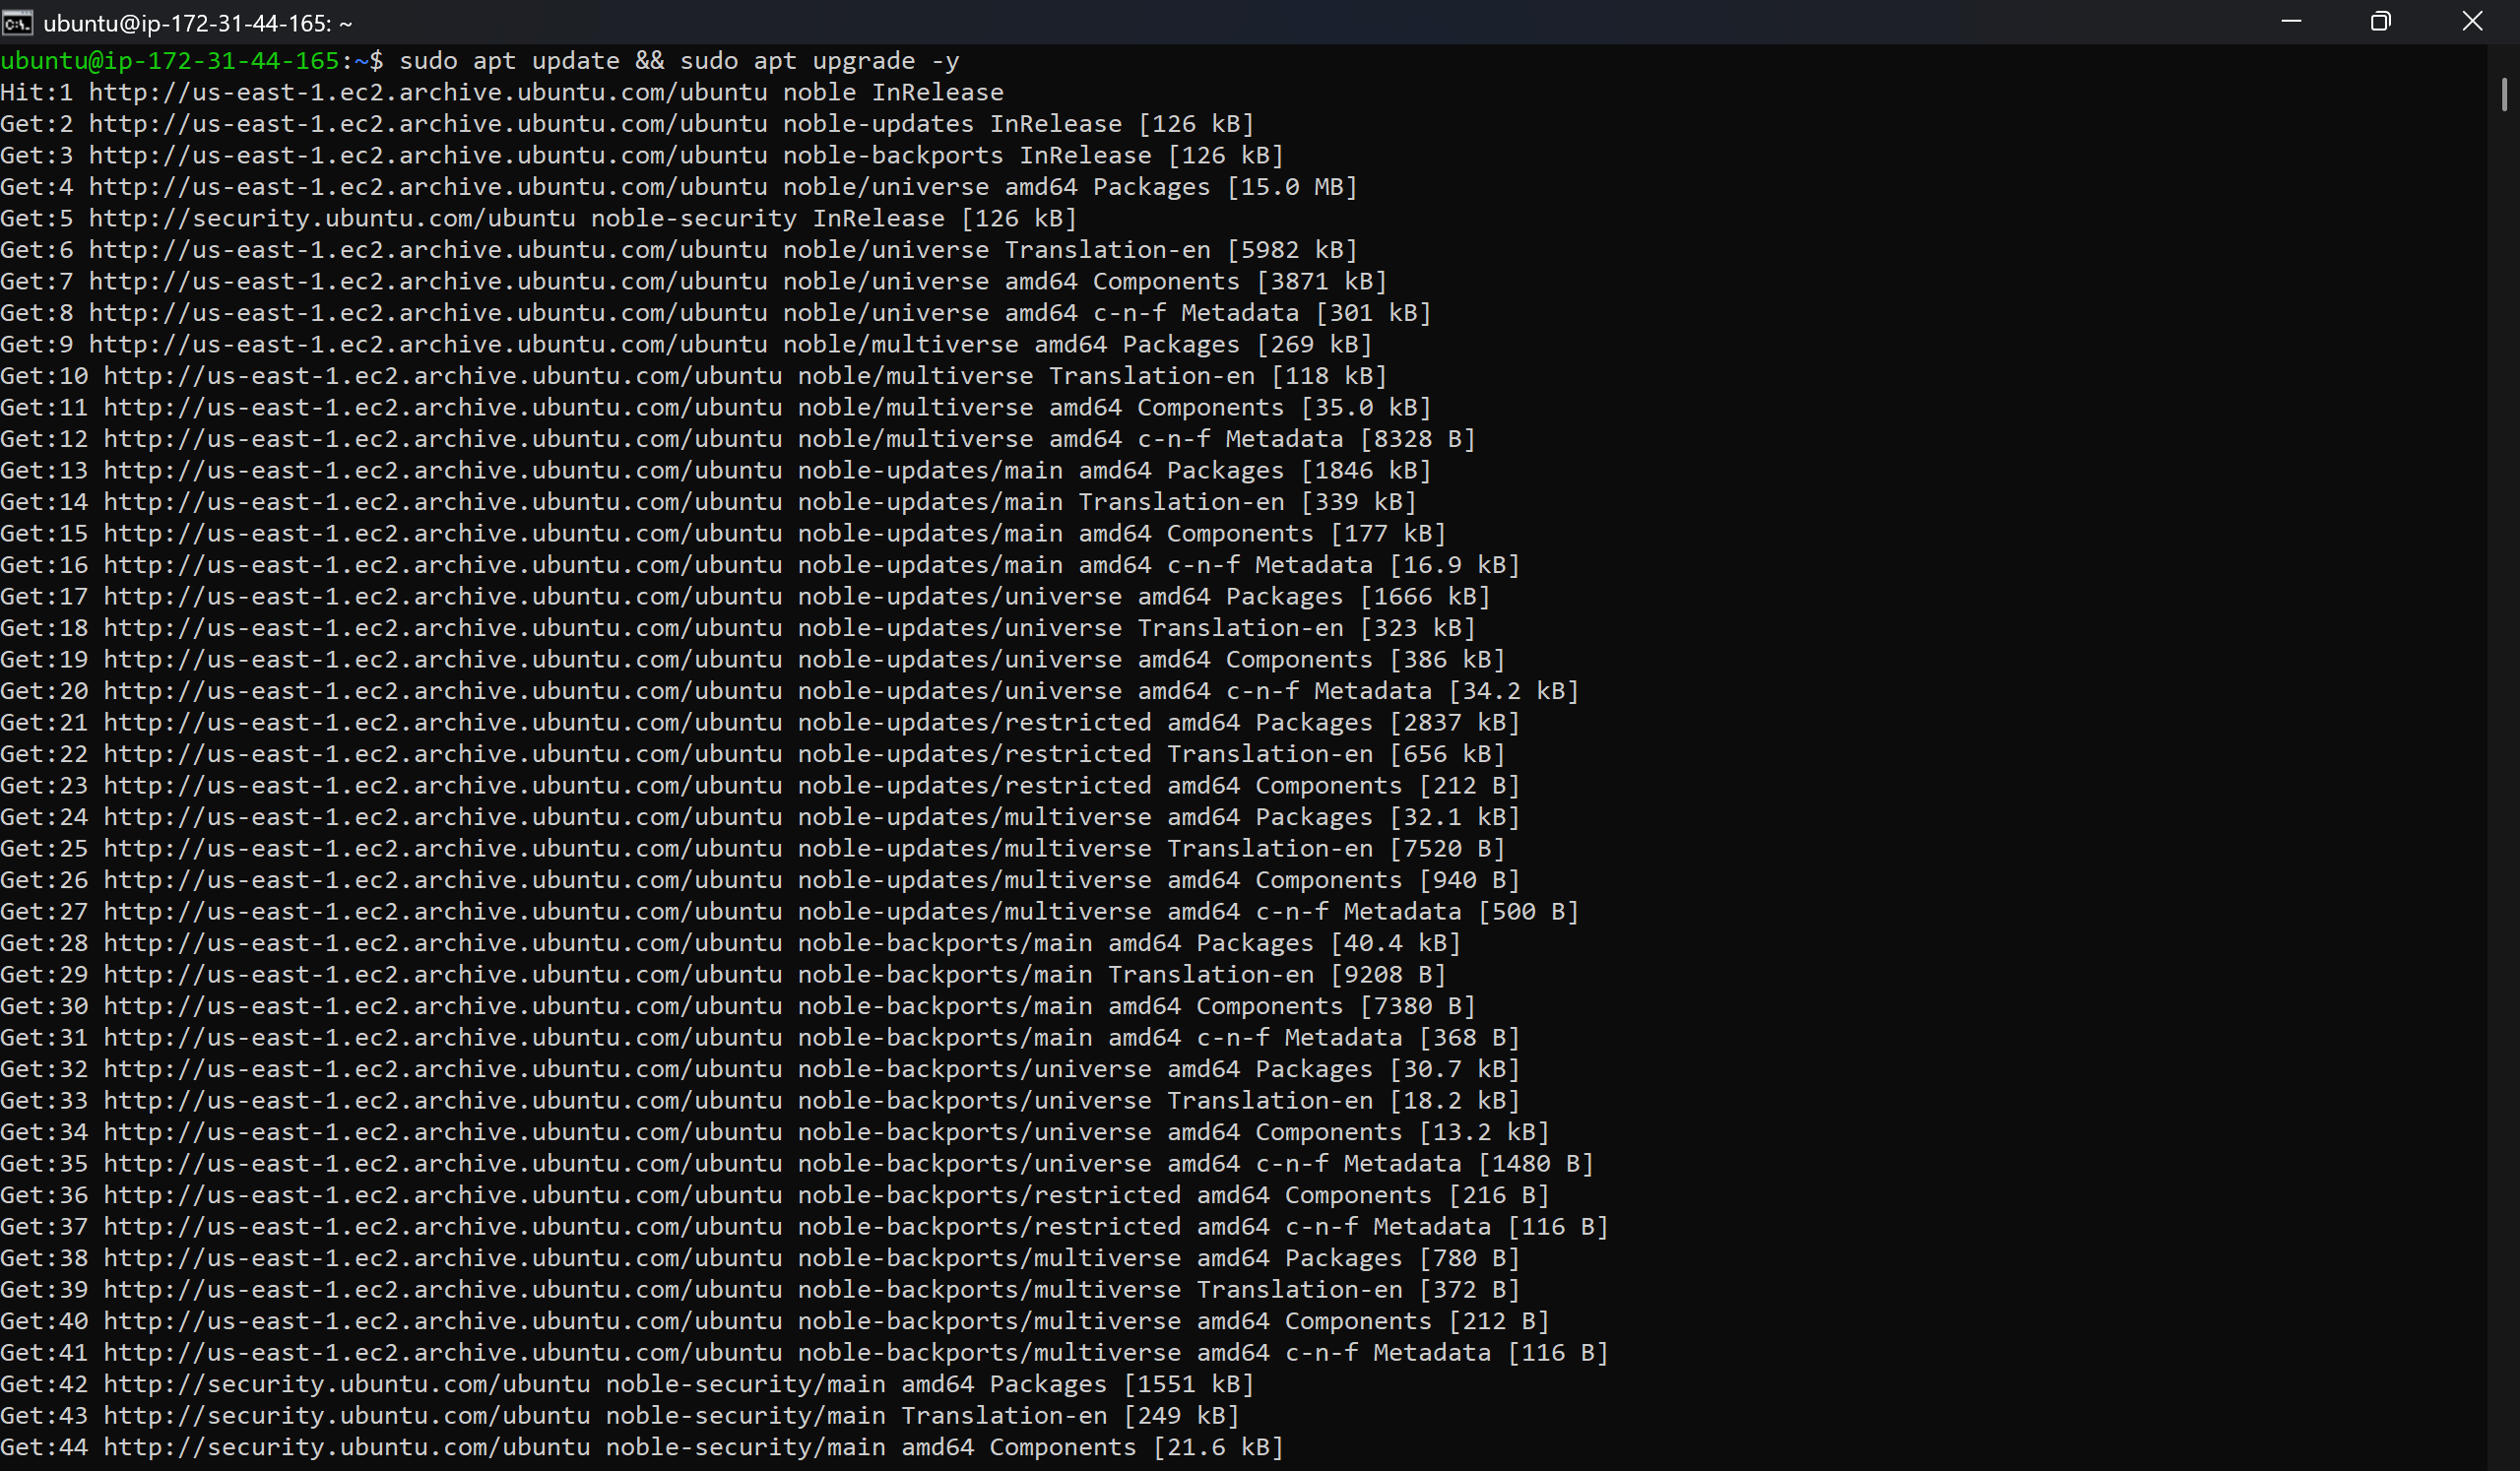
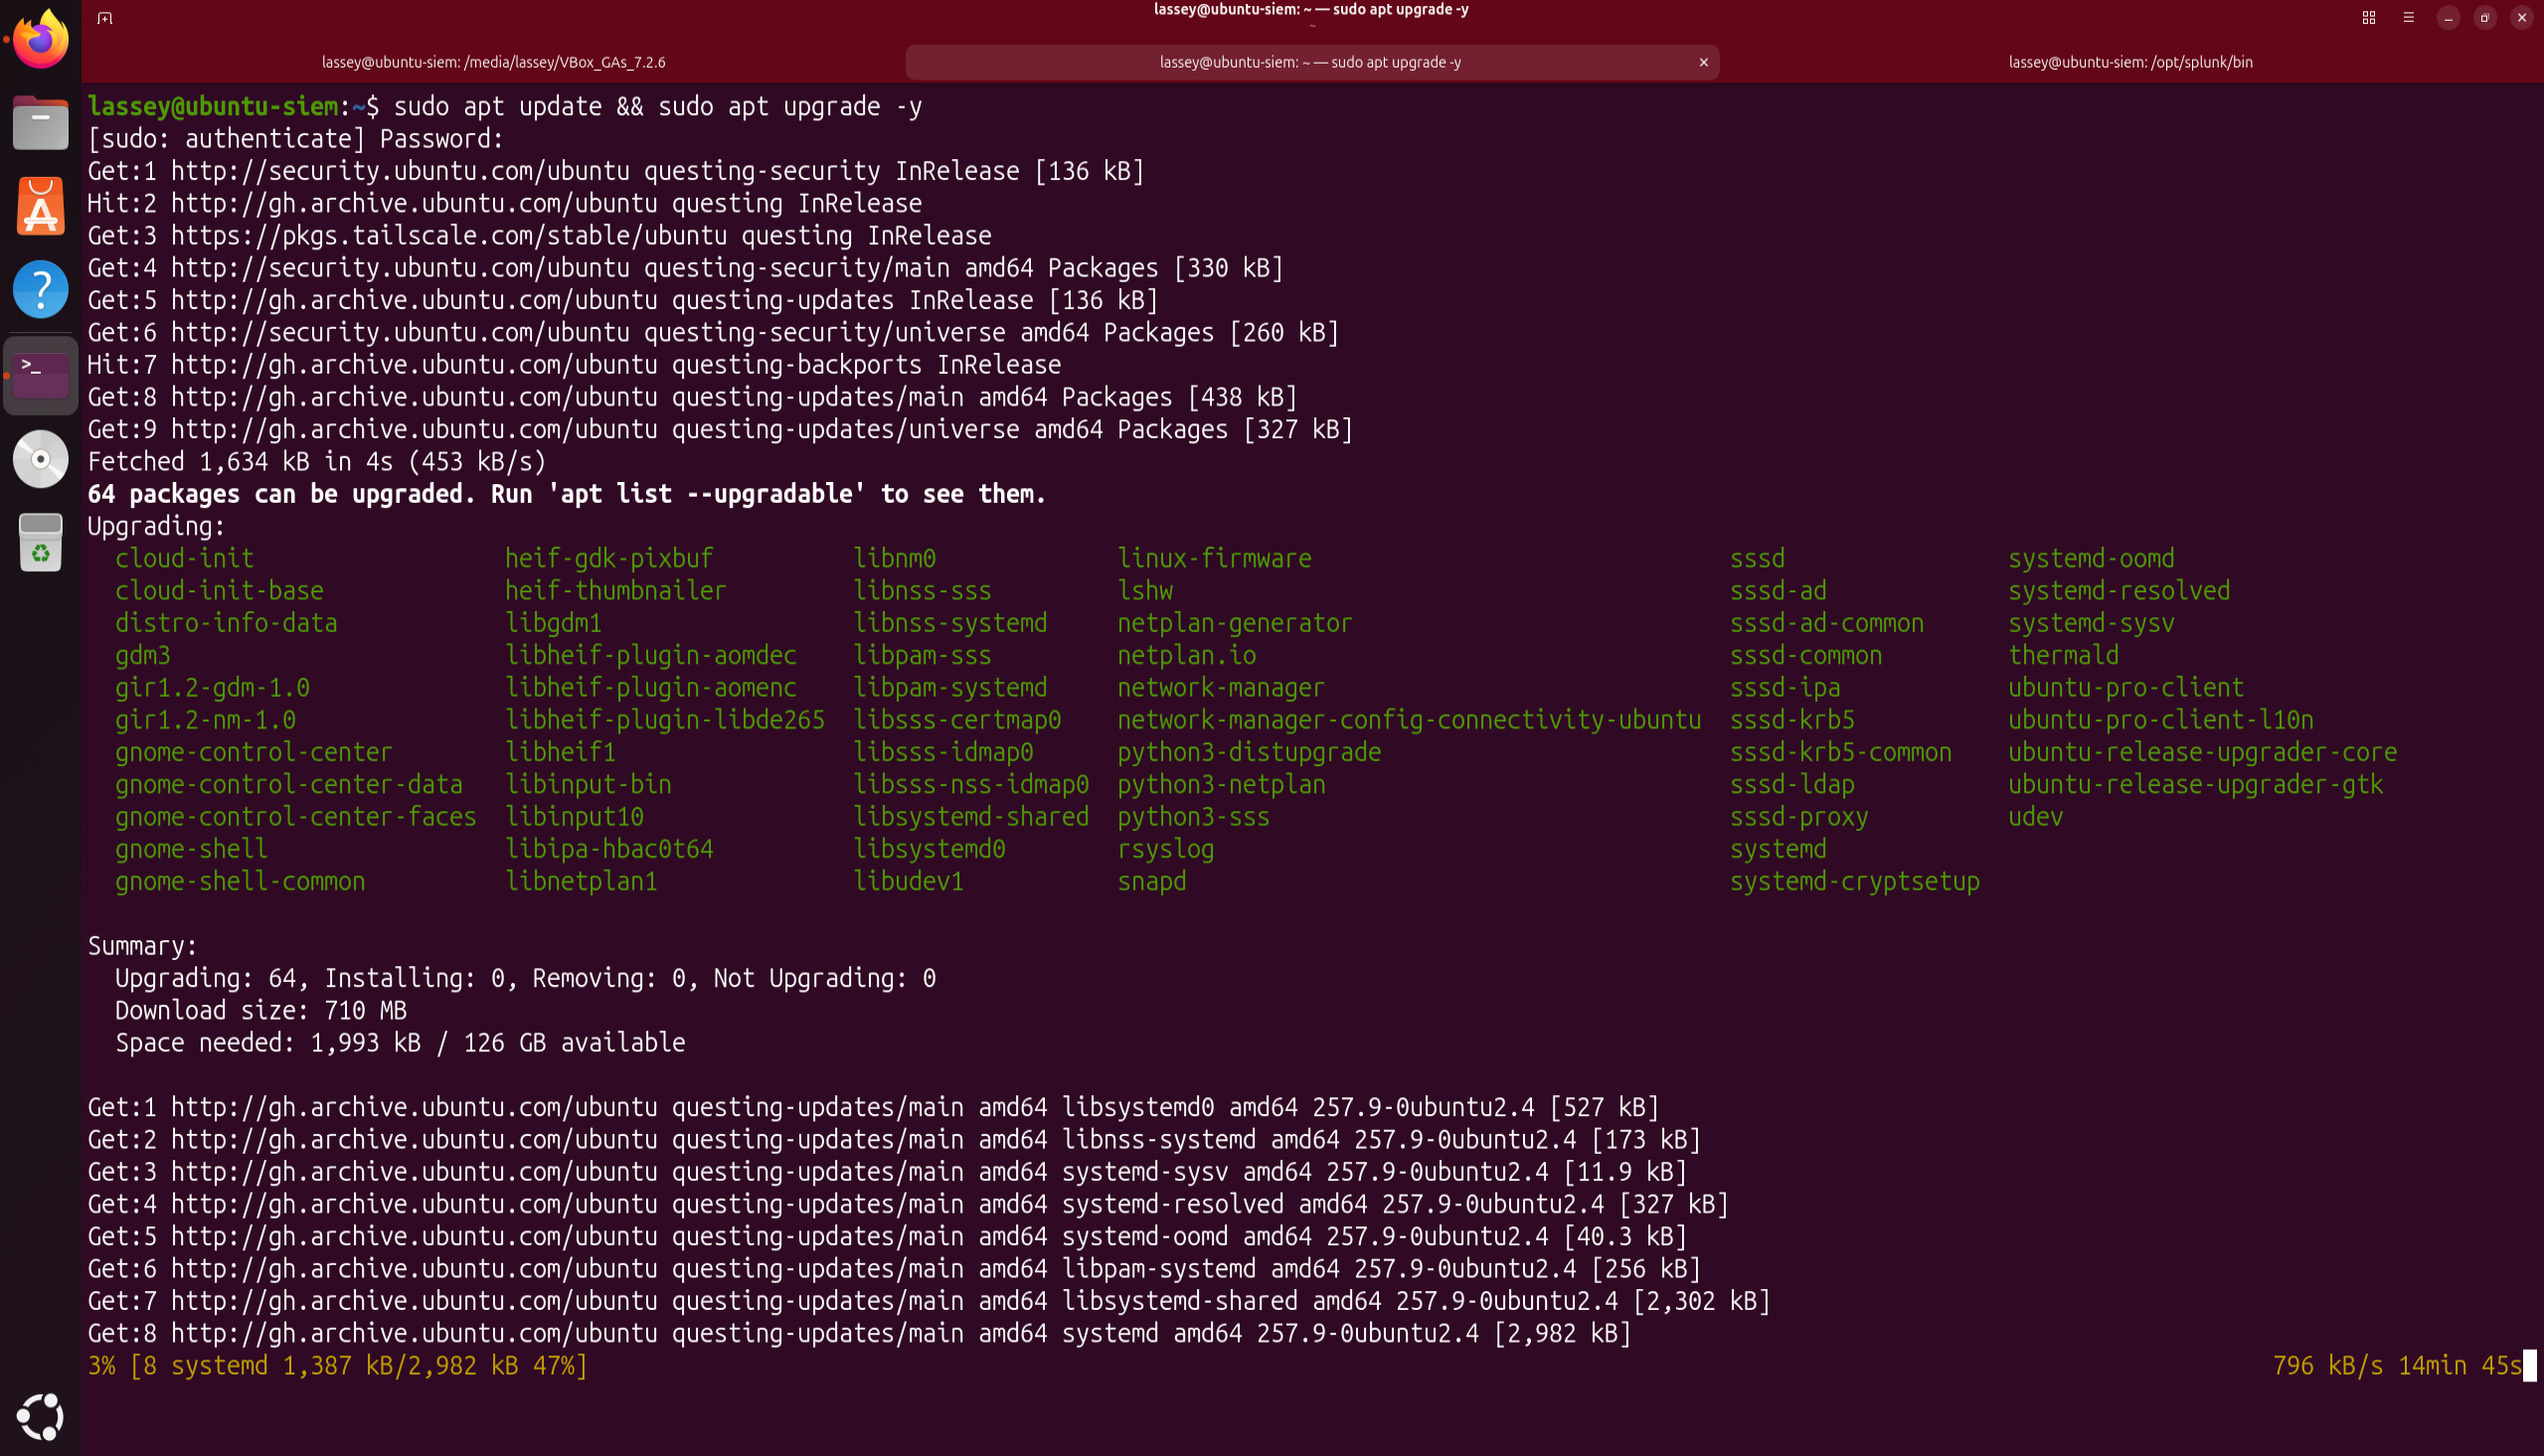
First thing after getting in:
sudo apt update && sudo apt upgrade -y
### 3.3 User Account
I created a main user `apostrophe` with sudo permissions.
sudo adduser apostrophe
sudo usermod -aG sudo apostrophe
Then logged out and back in as `apostrophe` for all subsequent work.
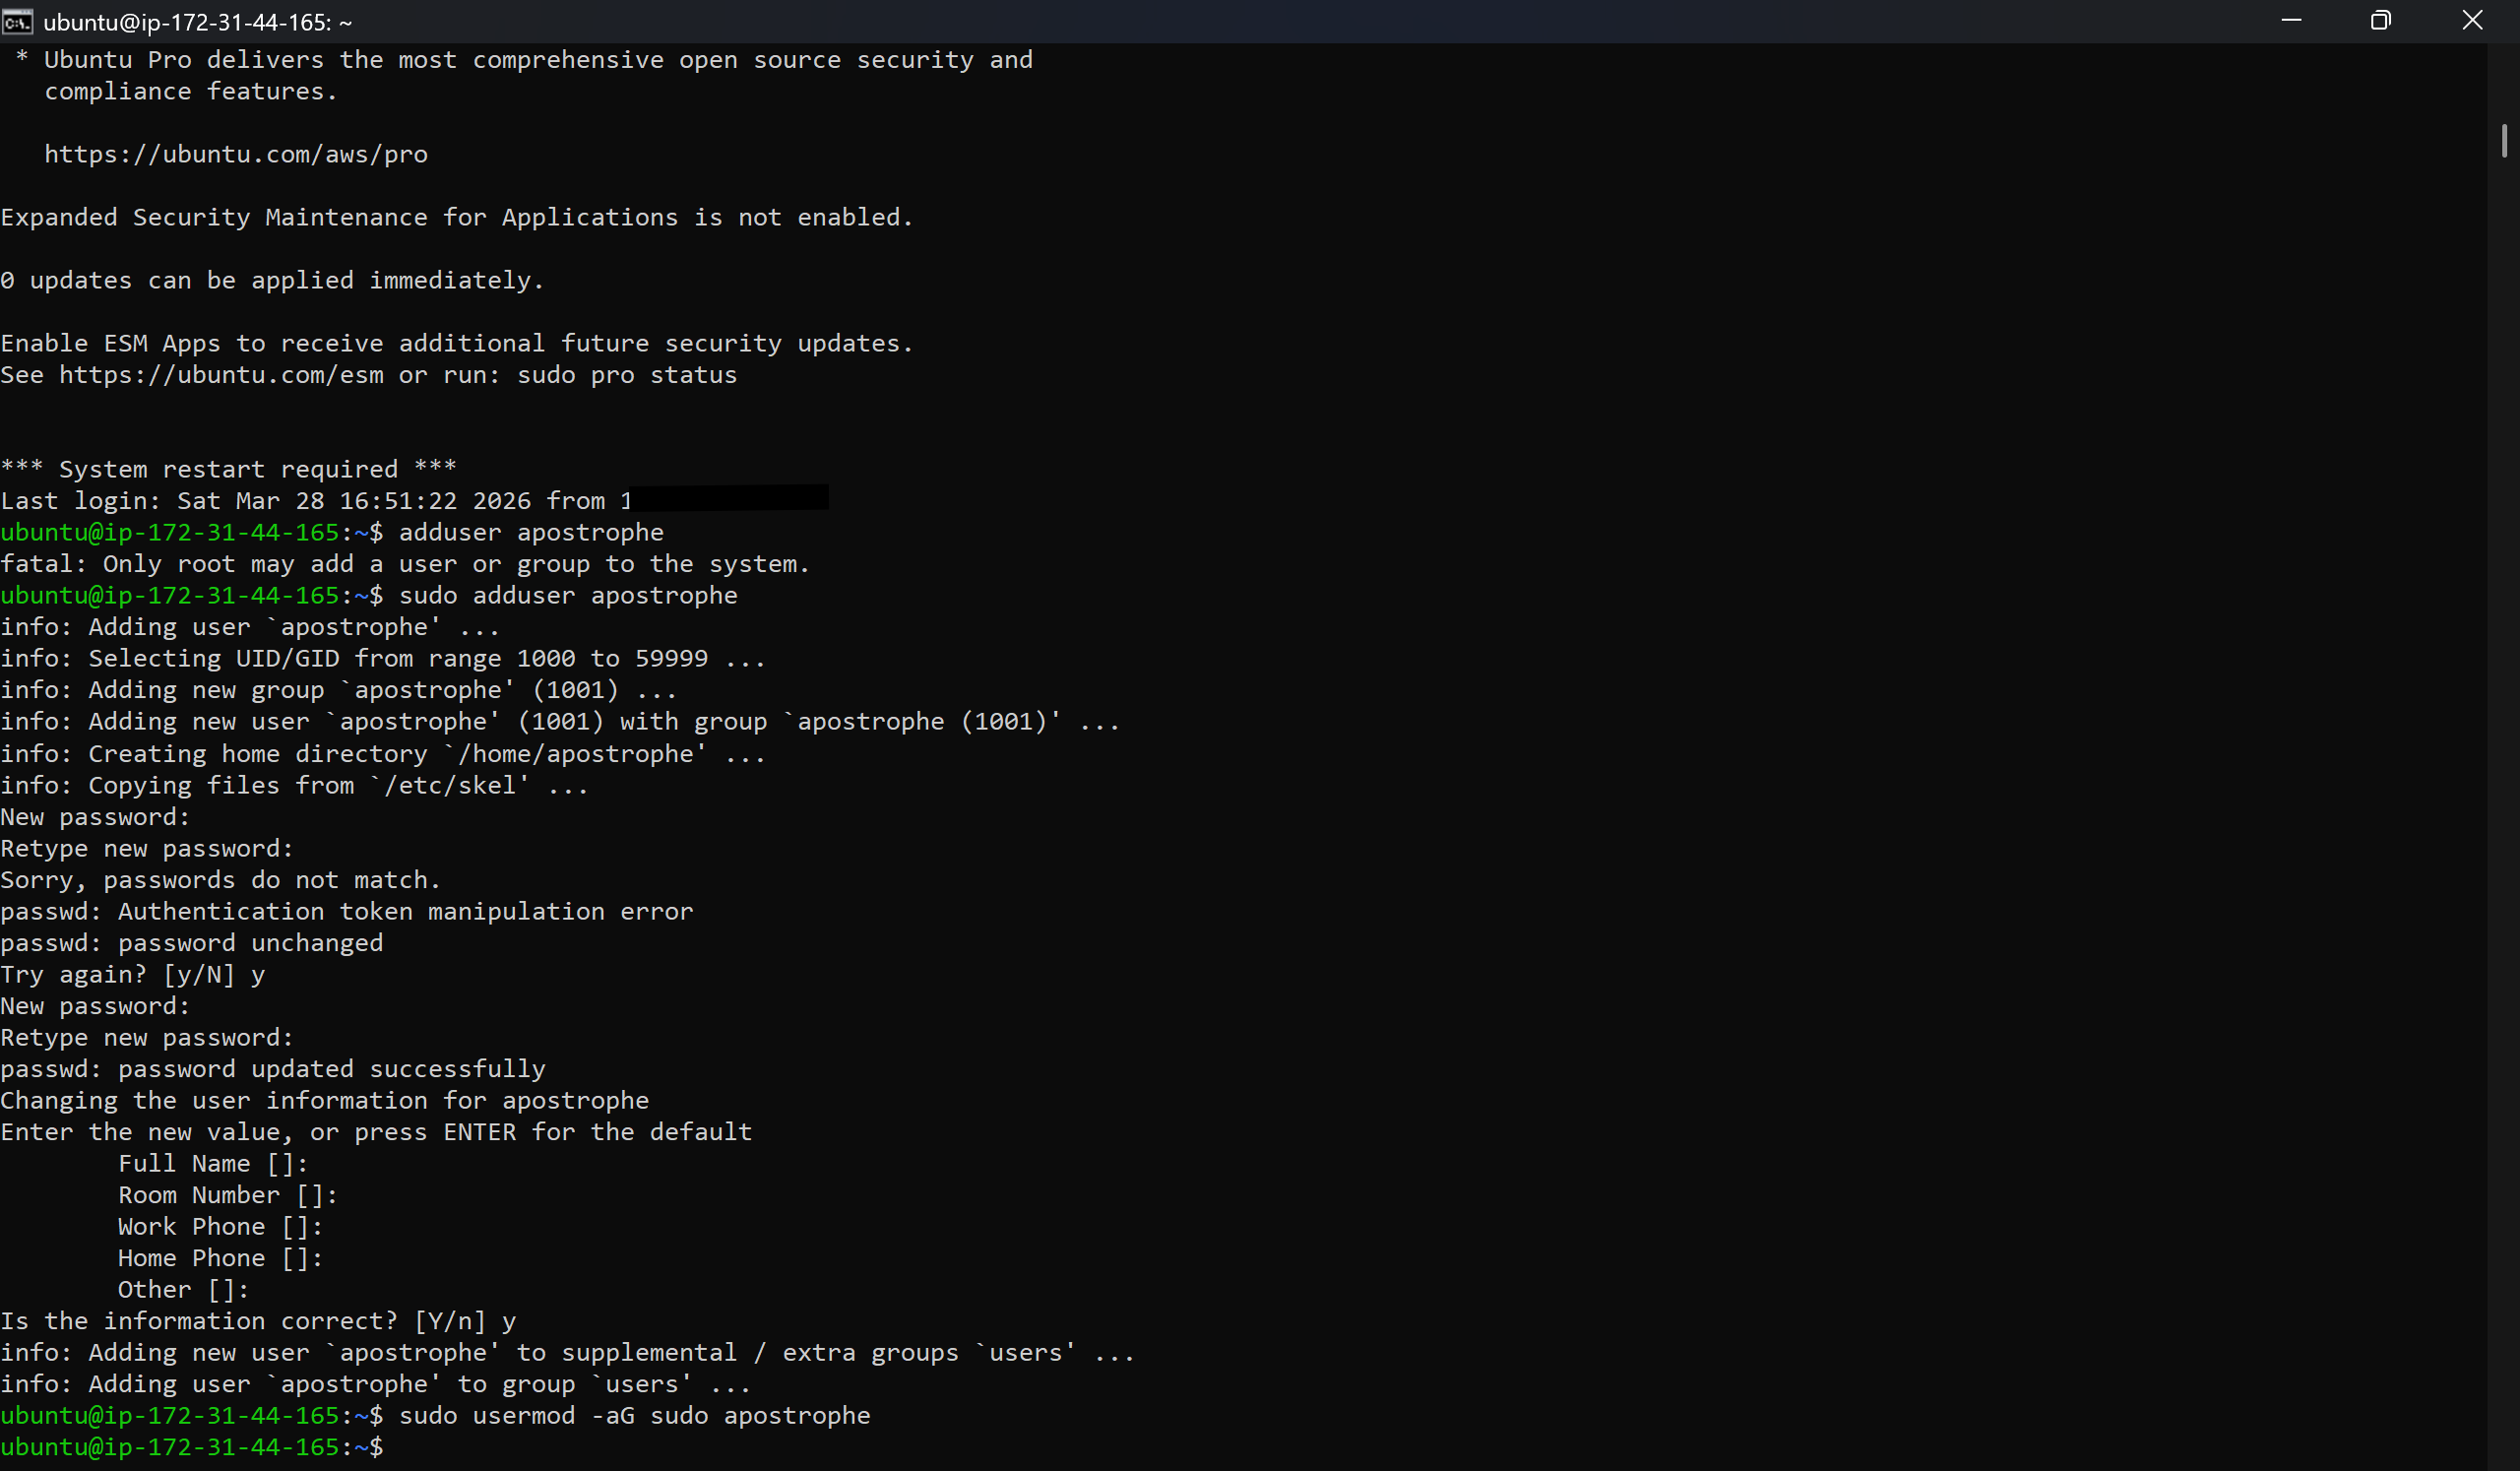
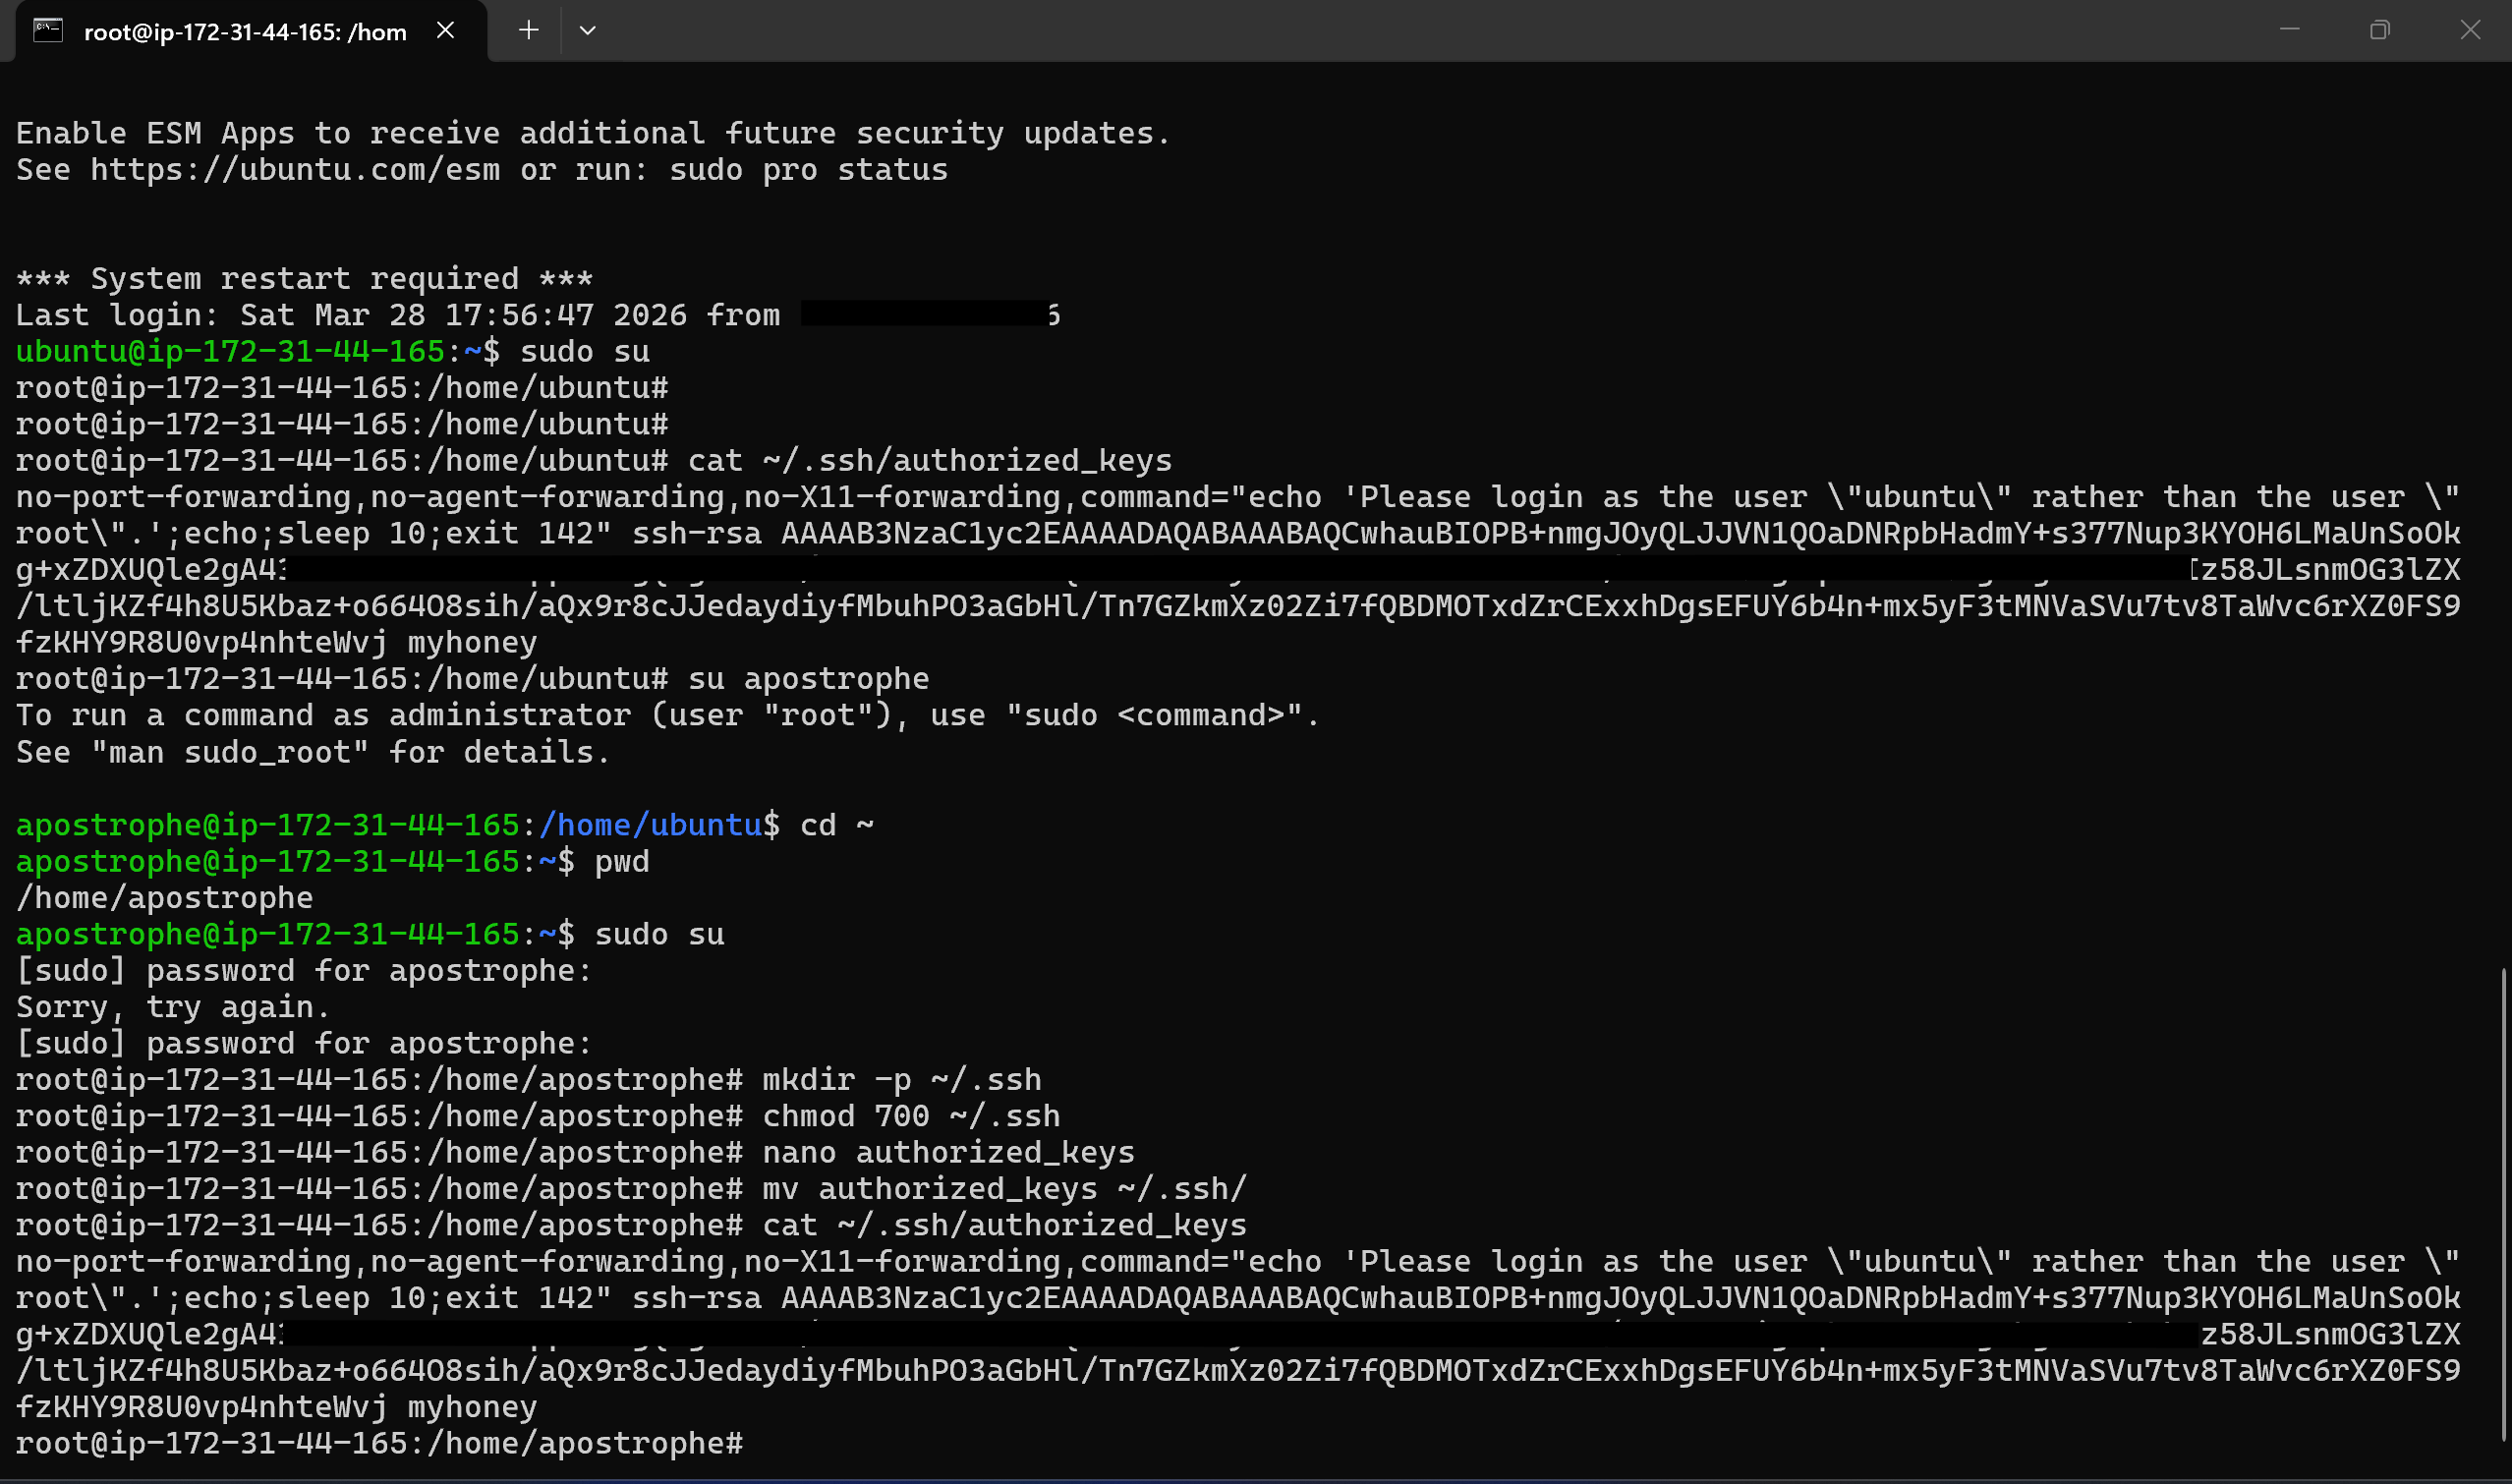
The `~/.ssh/authorized_keys` file for `apostrophe` was either missing or owned by root. The server does not have the ssh public key for the user apostrophe.
To resolve the issue, I had to add my public key to the user apostrophe. Logged in as ubuntu, I acceesed and copied the public key and logged back in as apostrophe and created the file authorized\_keys within ~/.ssh/ and pasted the public key.
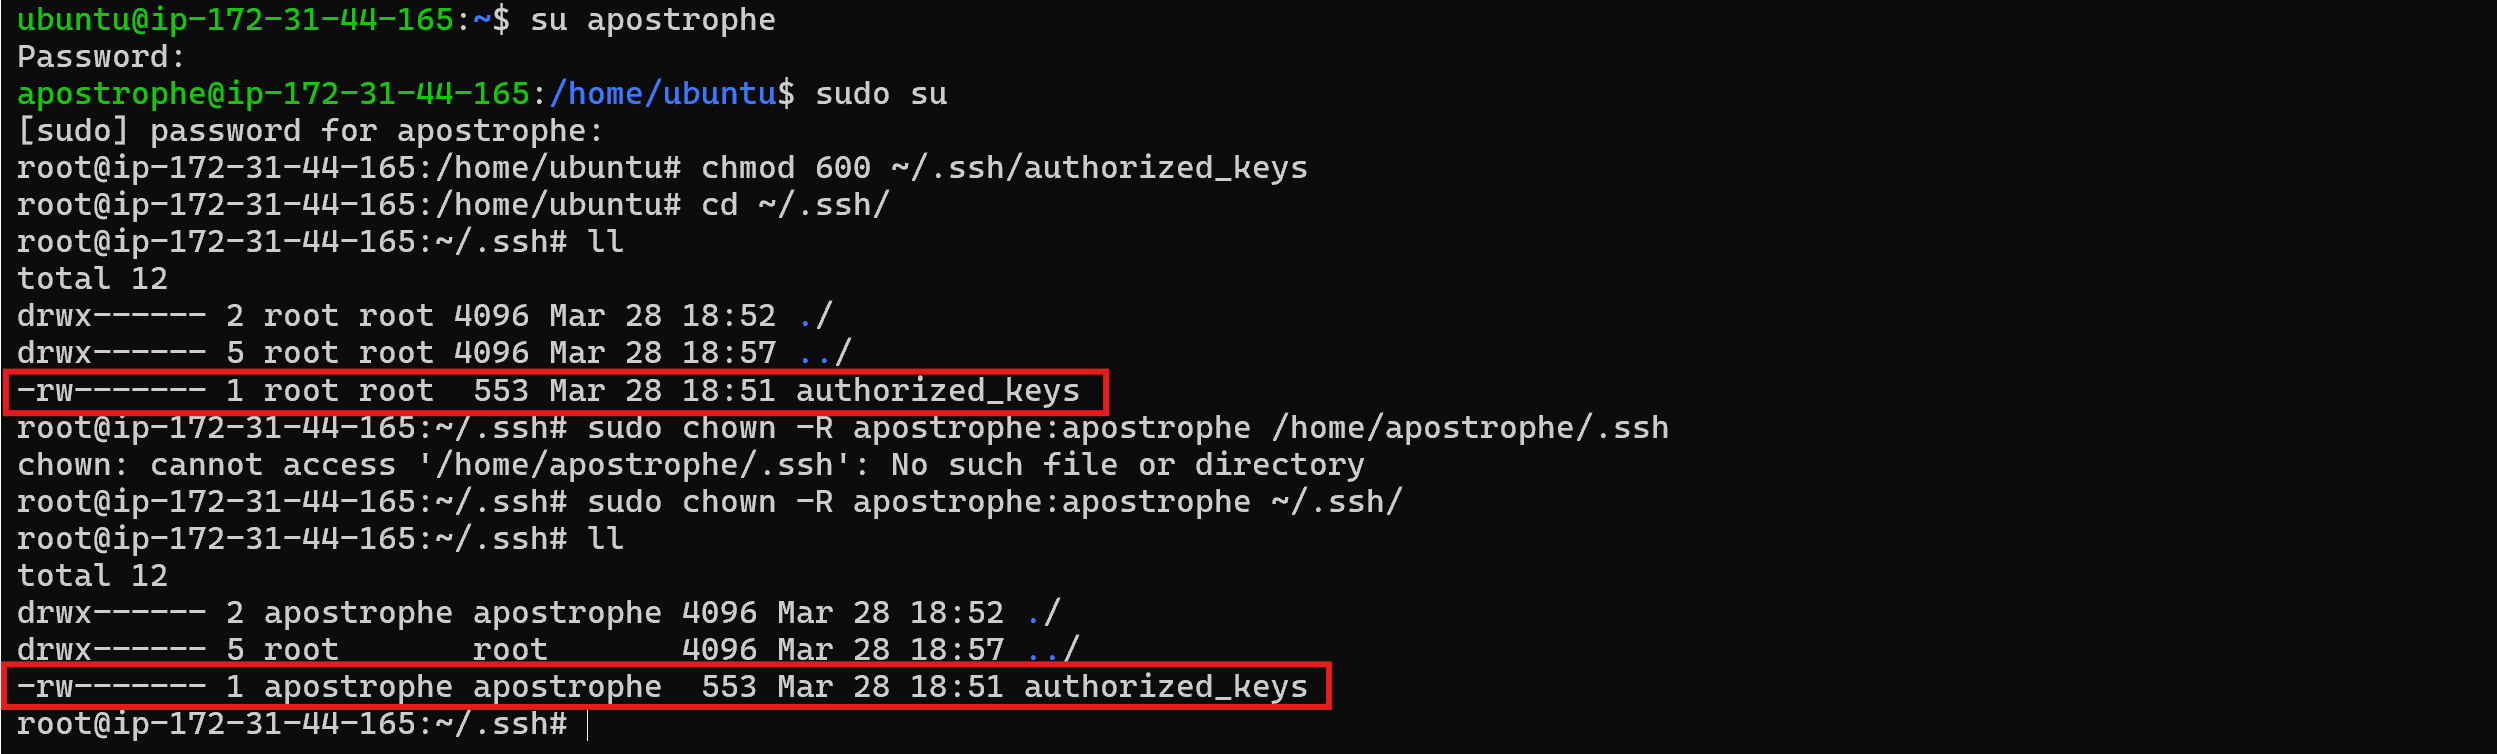
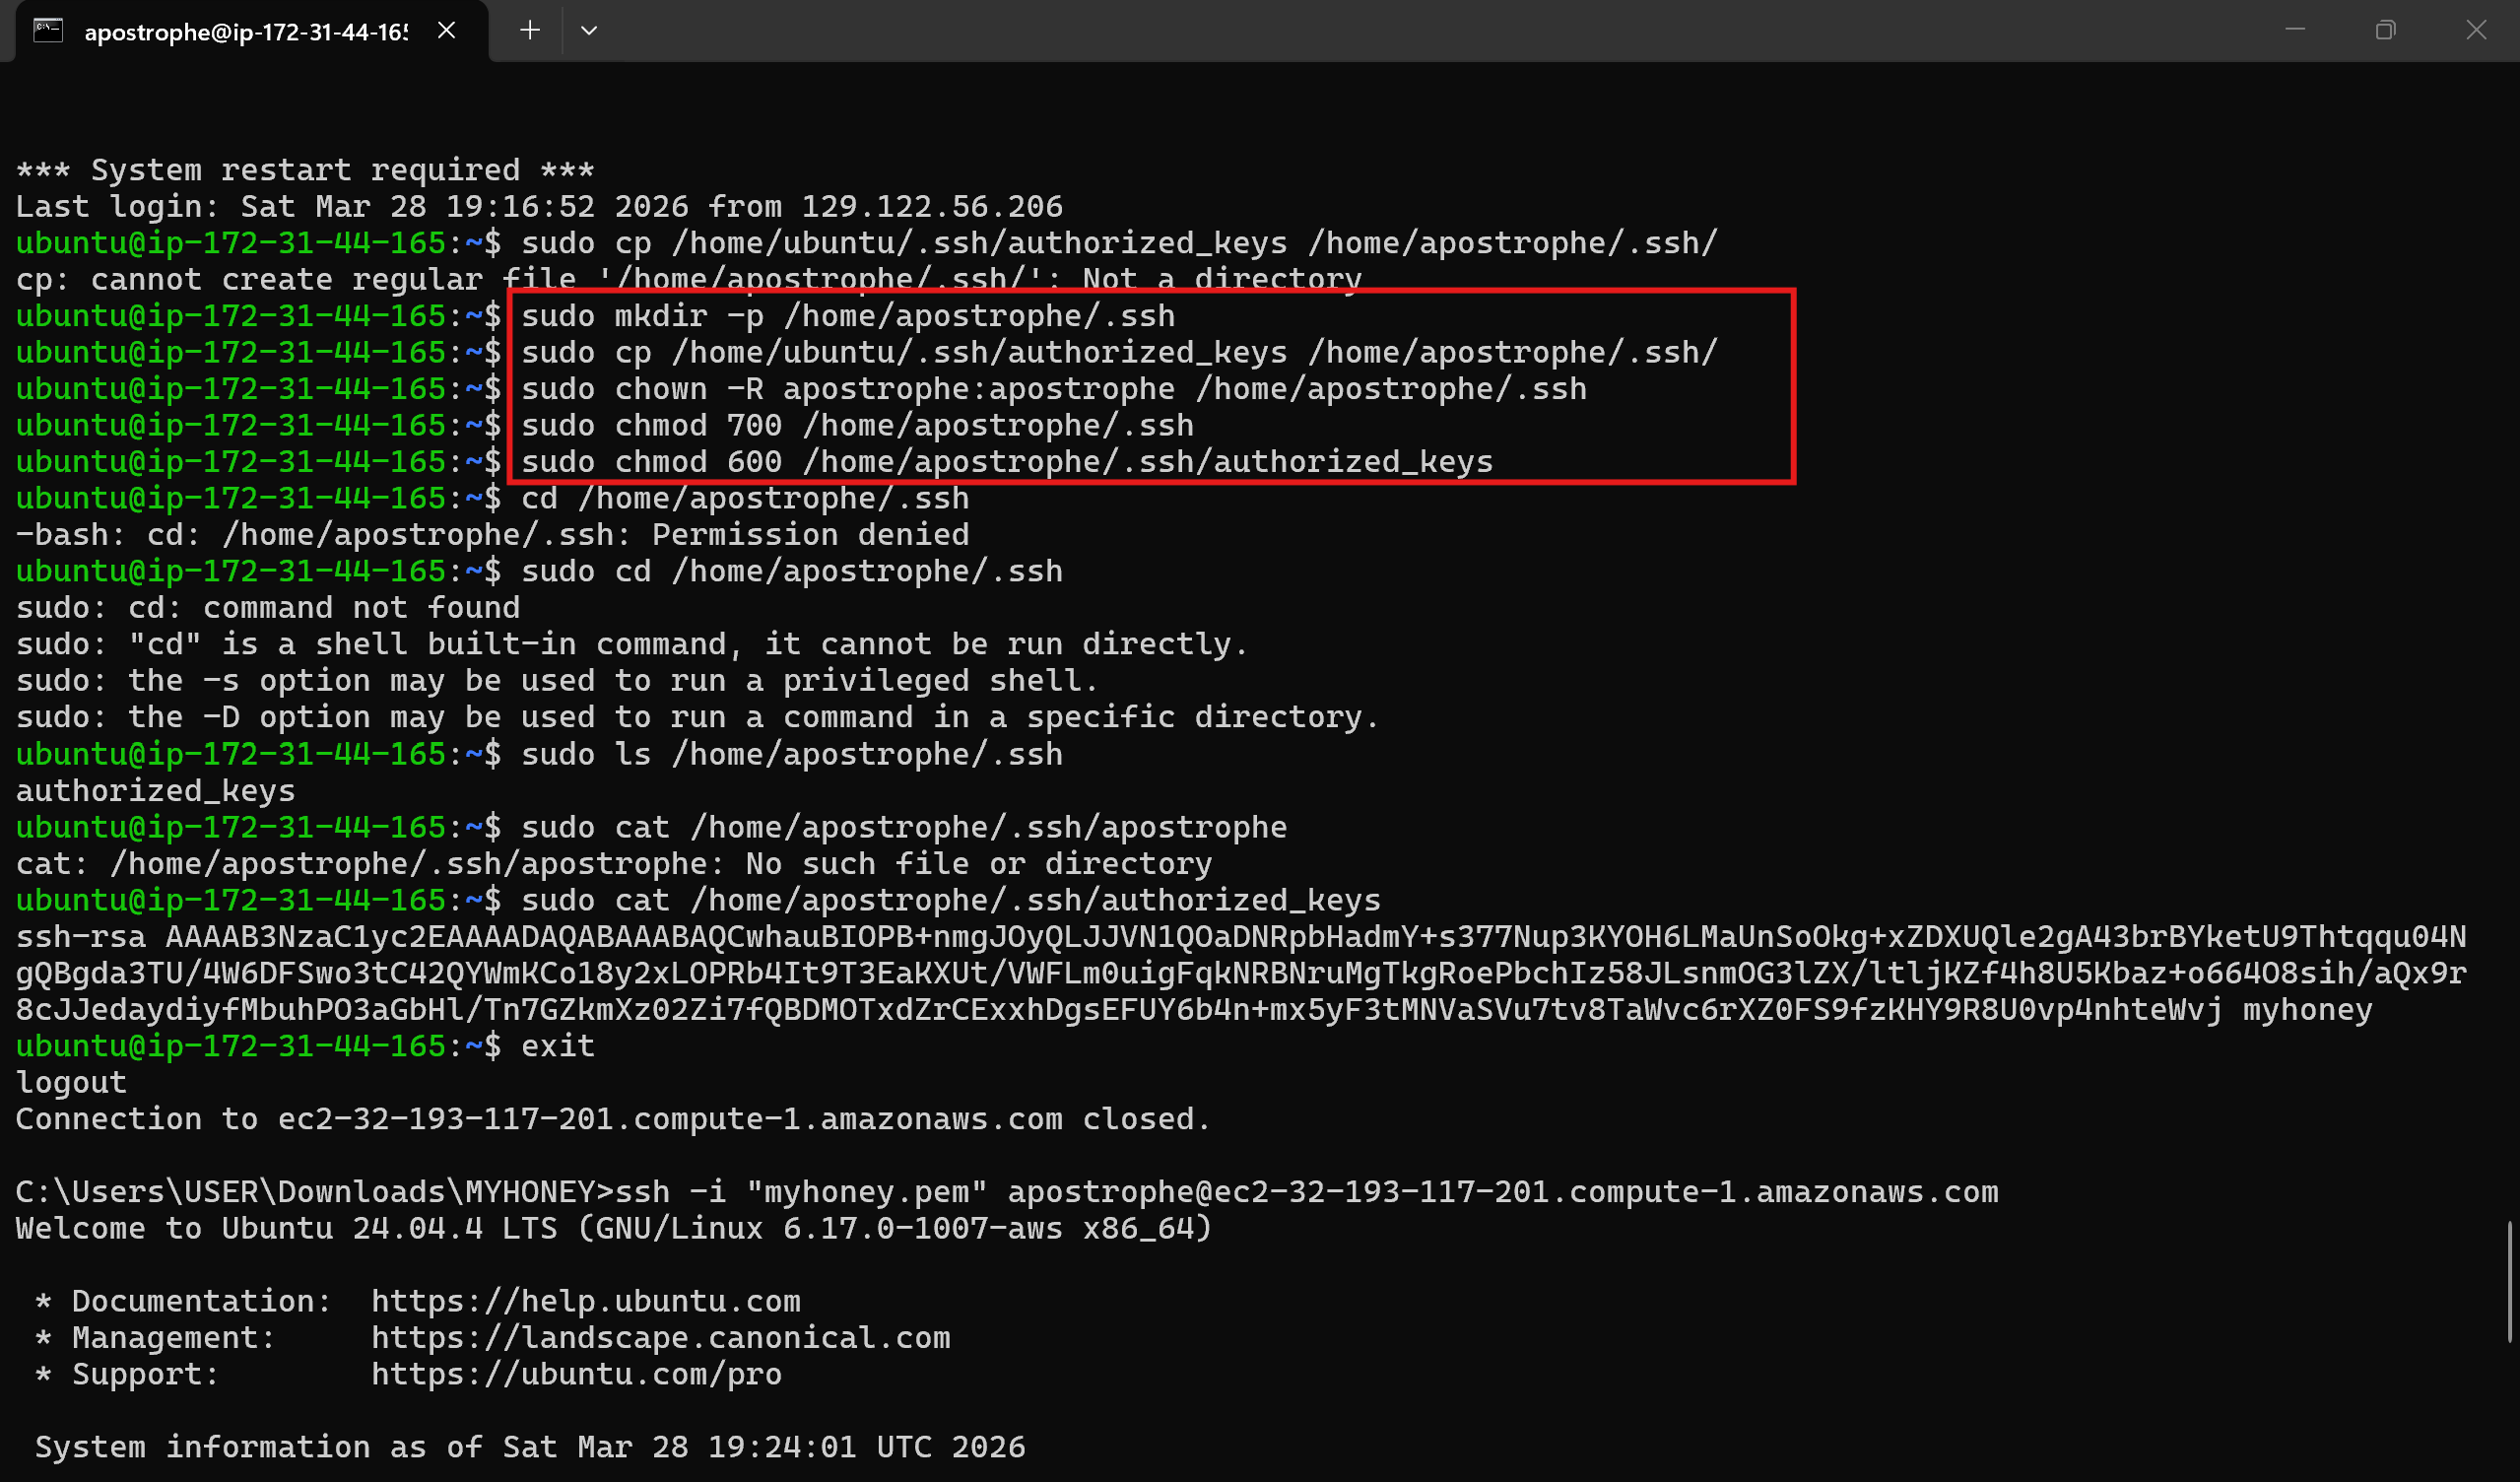
sudo mkdir -p /home/apostrophe/.ssh
sudo cp -r /home/ubuntu/.ssh /home/apostrophe/
sudo chown -R apostrophe:apostrophe /home/apostrophe/.ssh
sudo chmod 700 /home/apostrophe/.ssh
sudo chmod 600 /home/apostrophe/.ssh/authorized_keys
### 3.4 Docker Installation
T-Pot runs entirely in Docker, so that had to go on first. Downloaded the install script from the kitpro docker guide:
curl -fsSL https://wiki.kitpro.us/en/articles/docker-script -o install-docker.sh
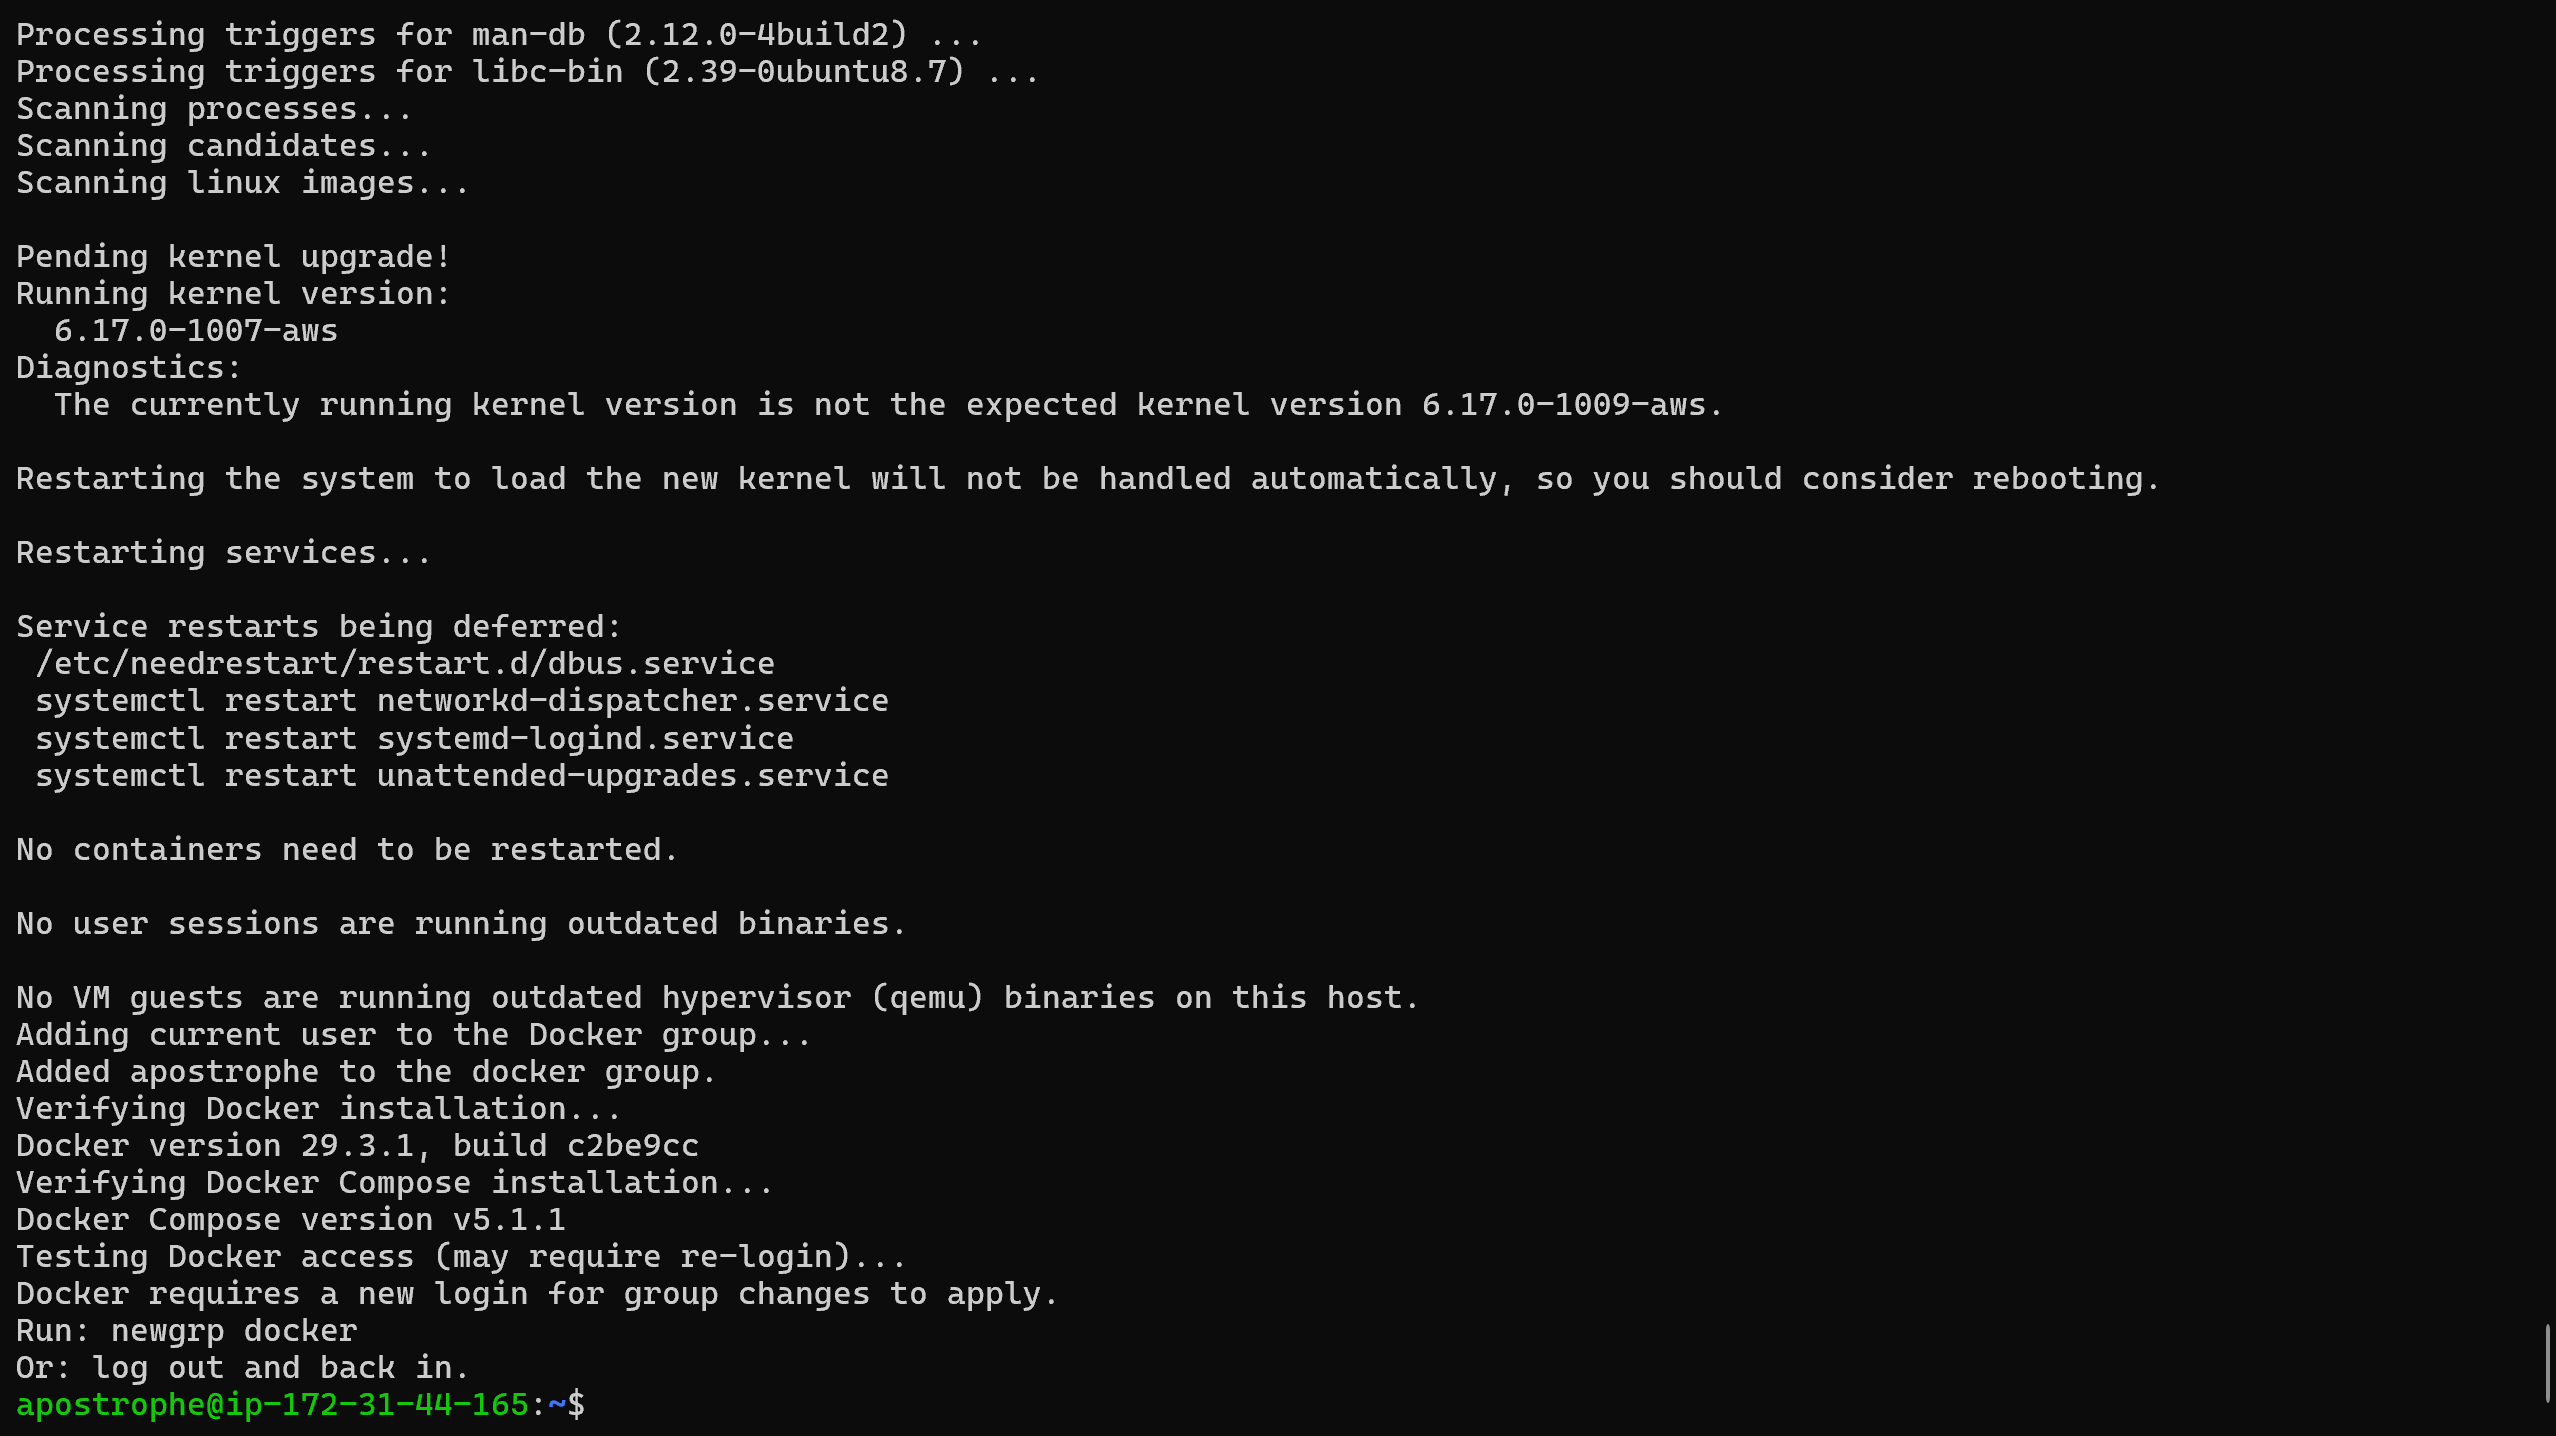
chmod +x install-docker.sh
sudo ./install-docker.sh
After install, log out and back in to pick up the docker group membership, then verify:
docker --version
docker compose version
## 4\. T-Pot Honeypot Installation
### 4.1 Installation & Configuration
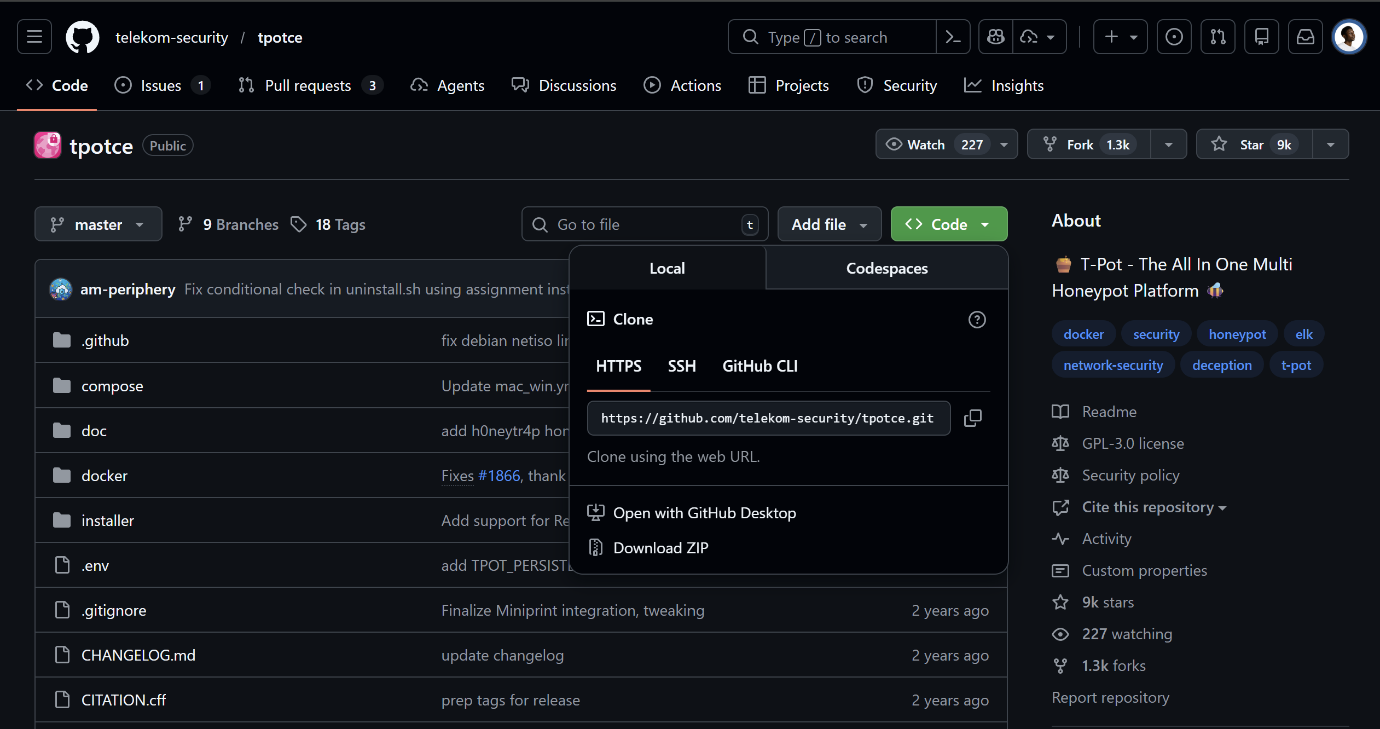
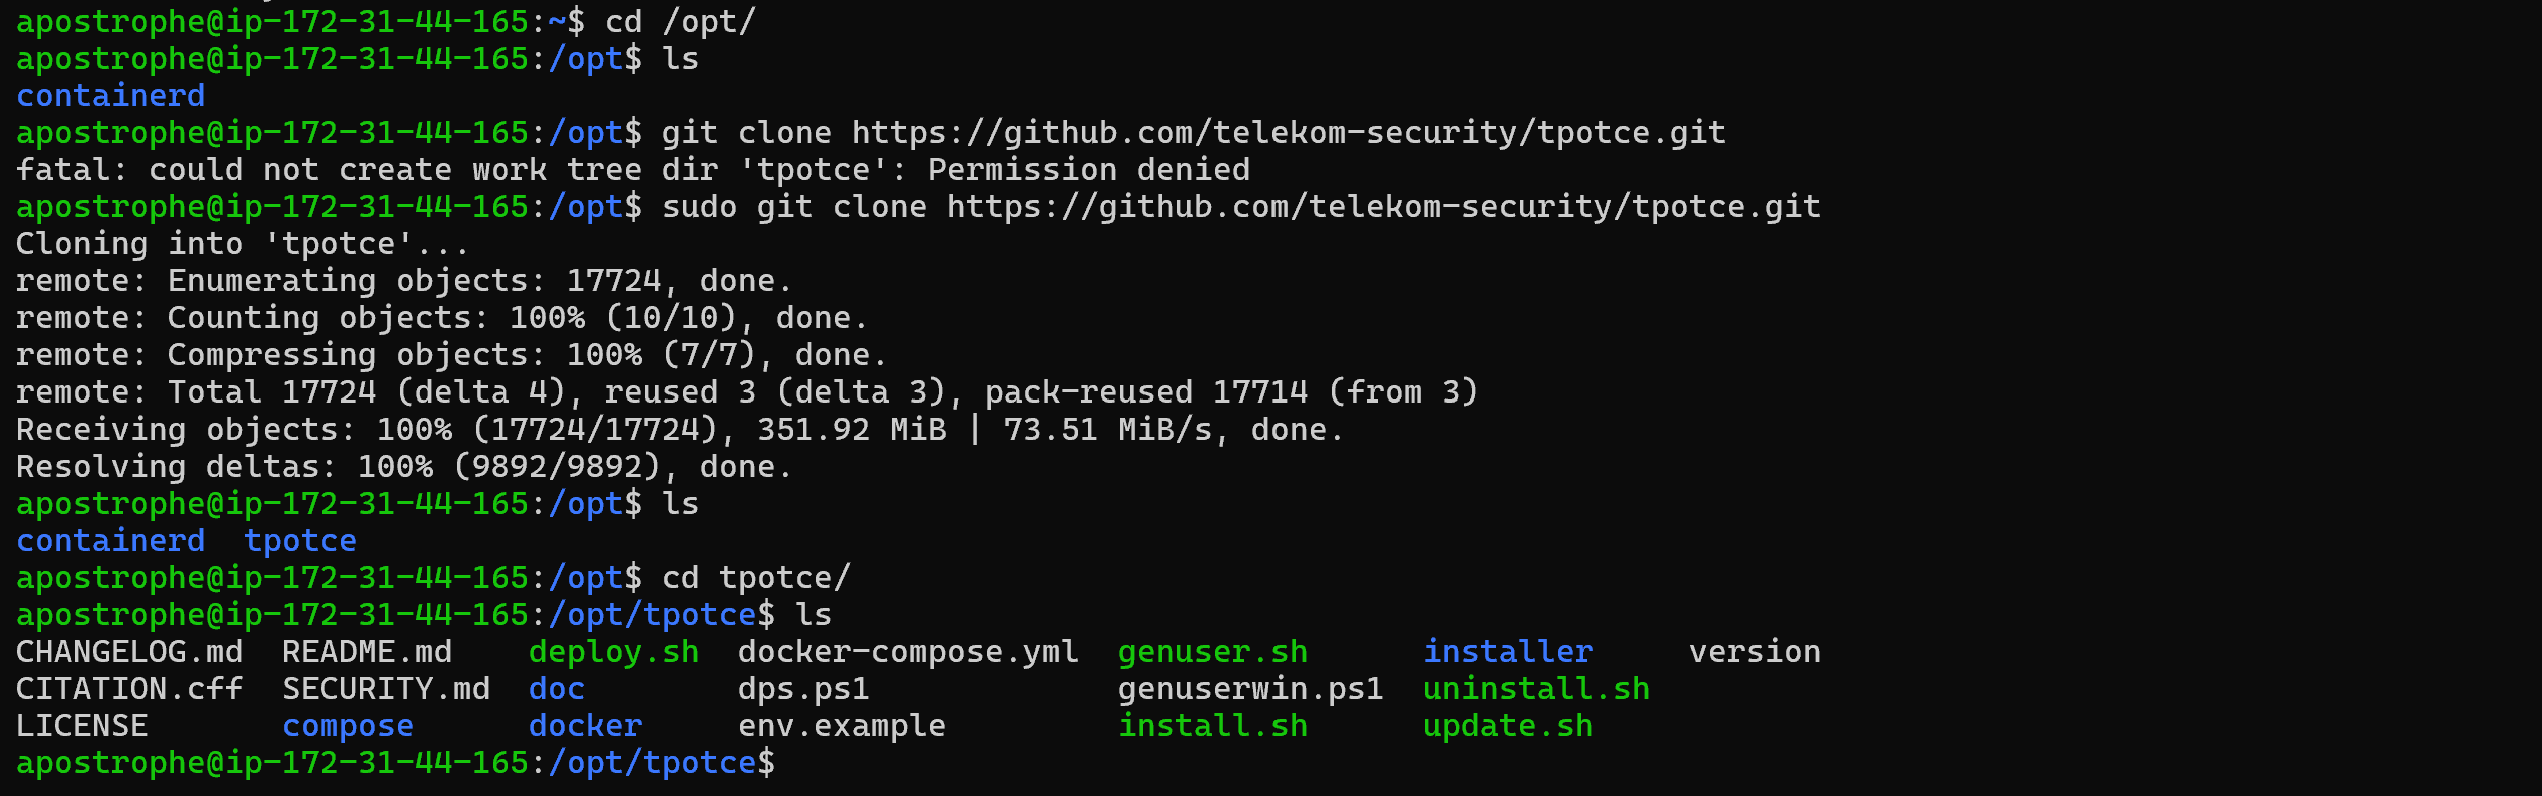
Cloned the official T-Pot CE repository from Deutsche Telekom Security into `/opt/`:
cd /opt
sudo git clone https://github.com/telekom-security/tpotce.git
cd tpotce
sudo ./install.sh
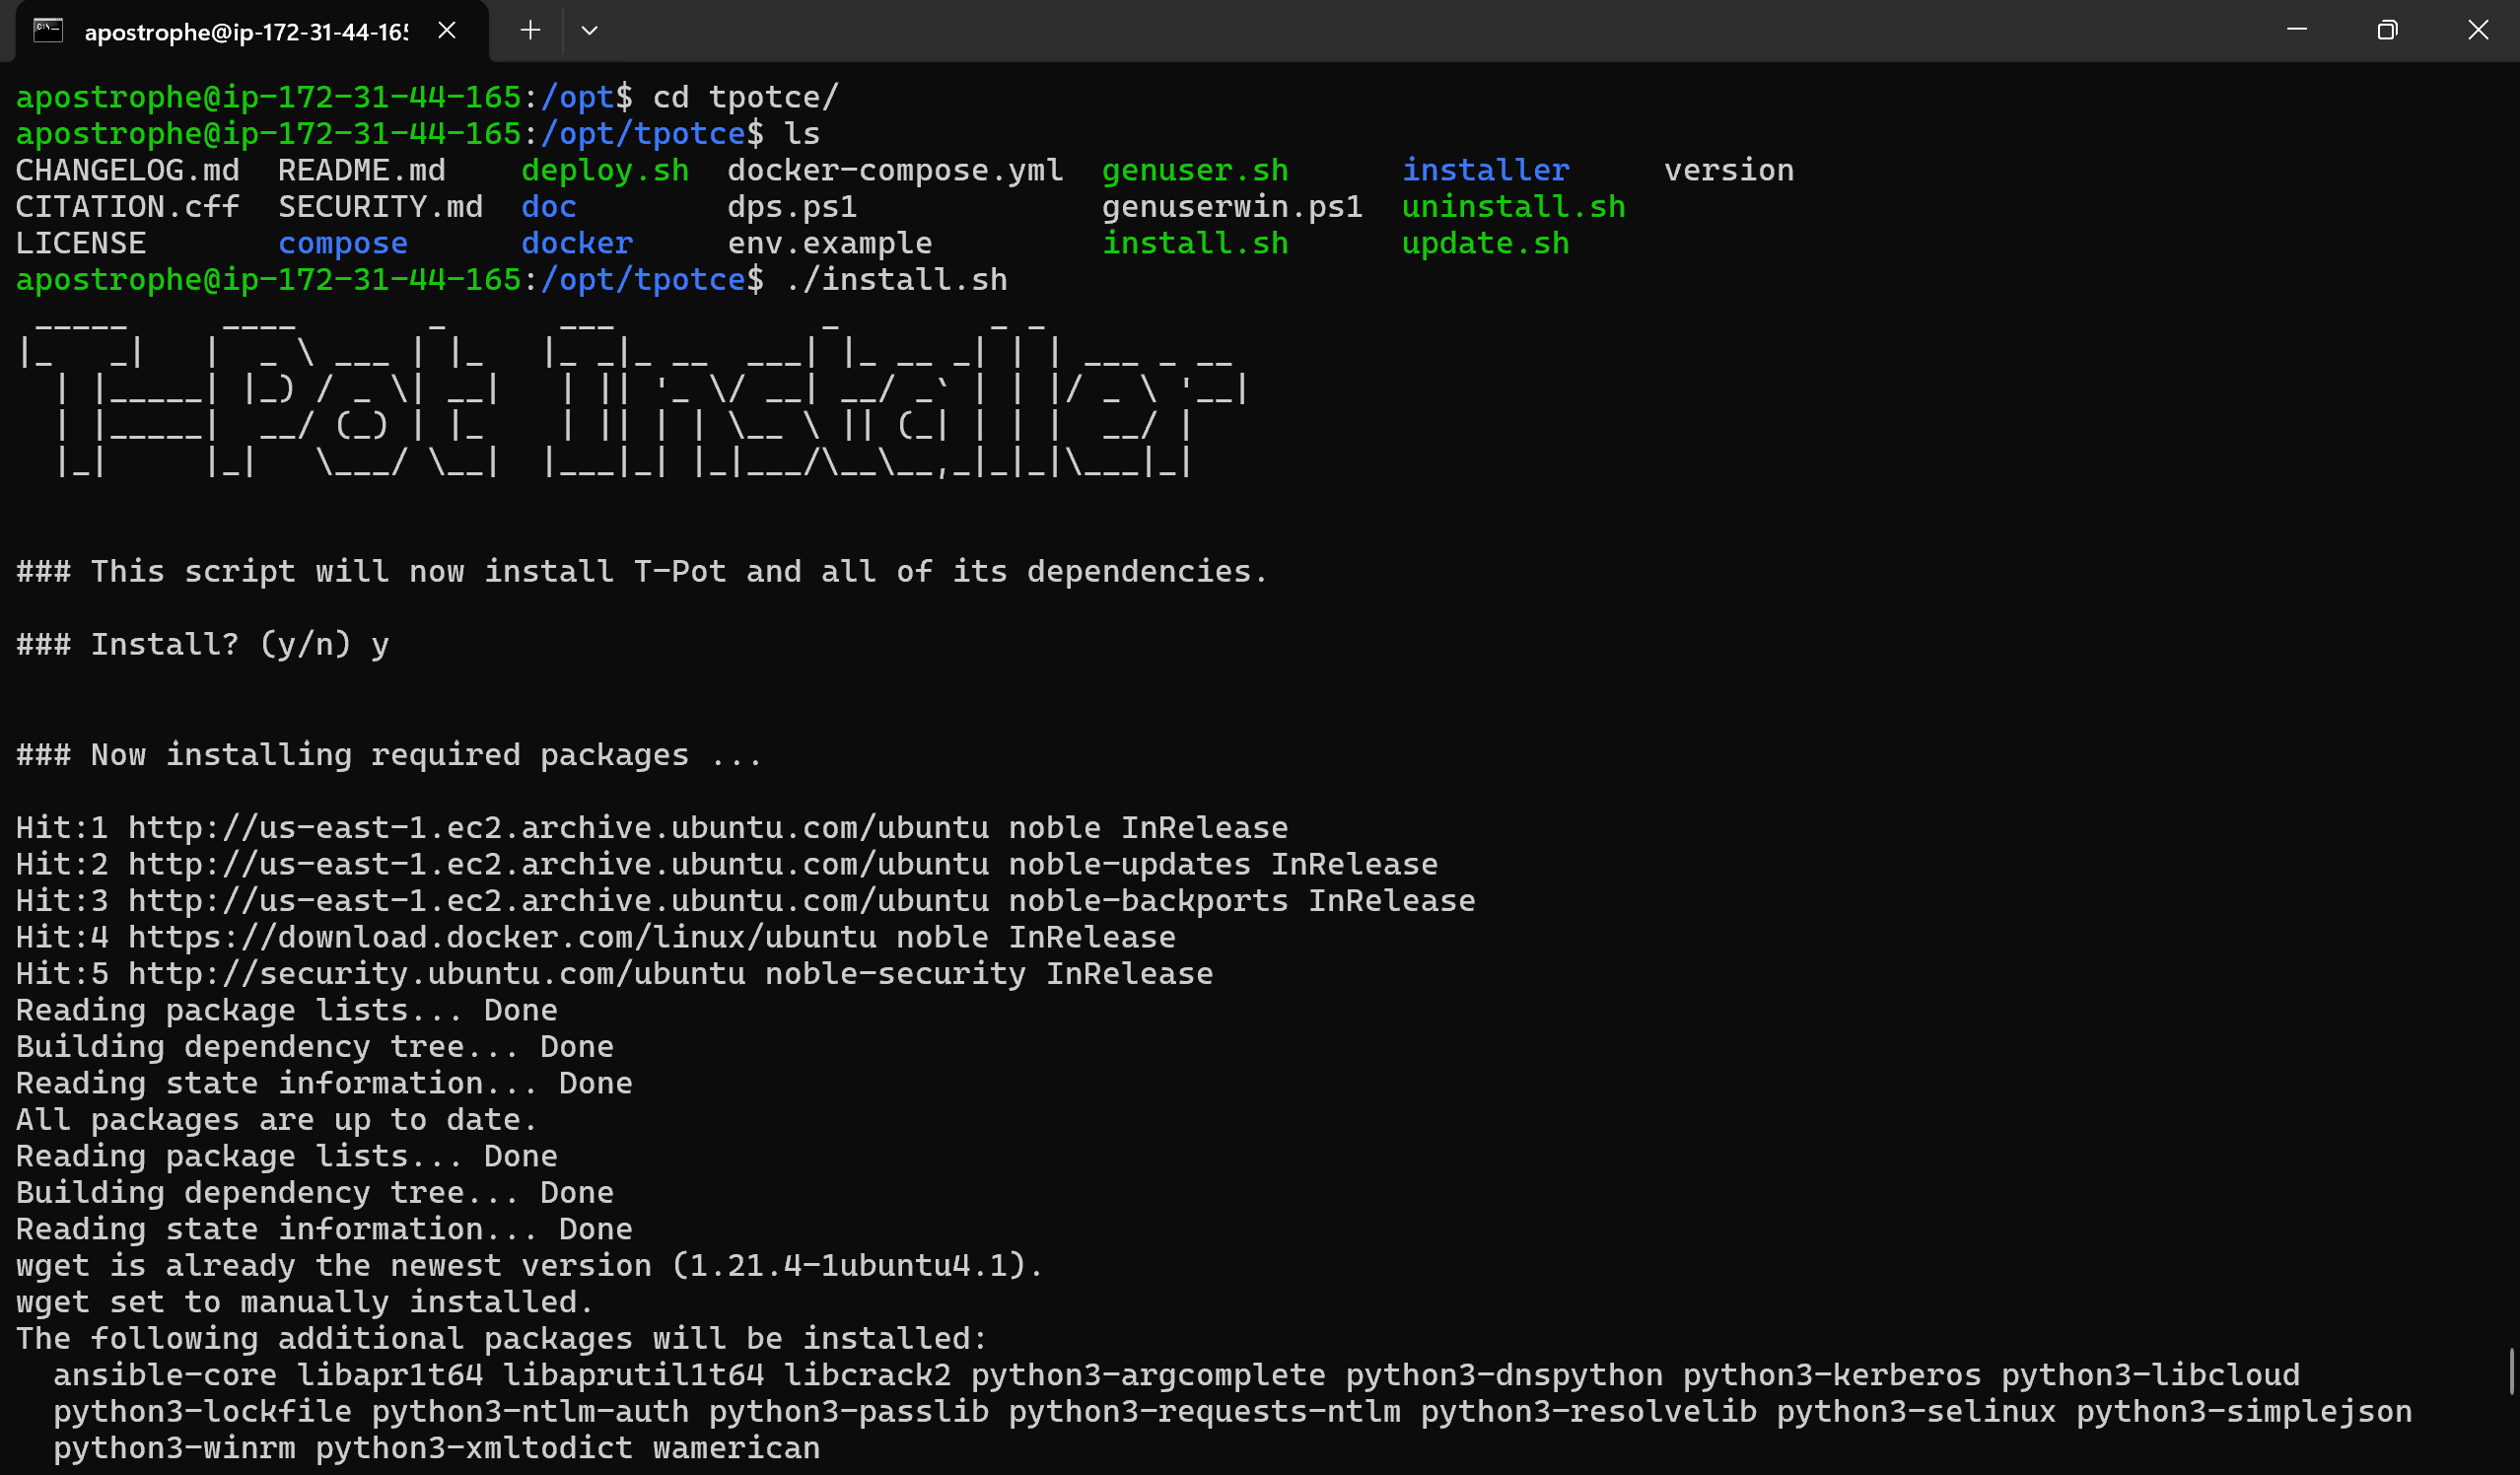
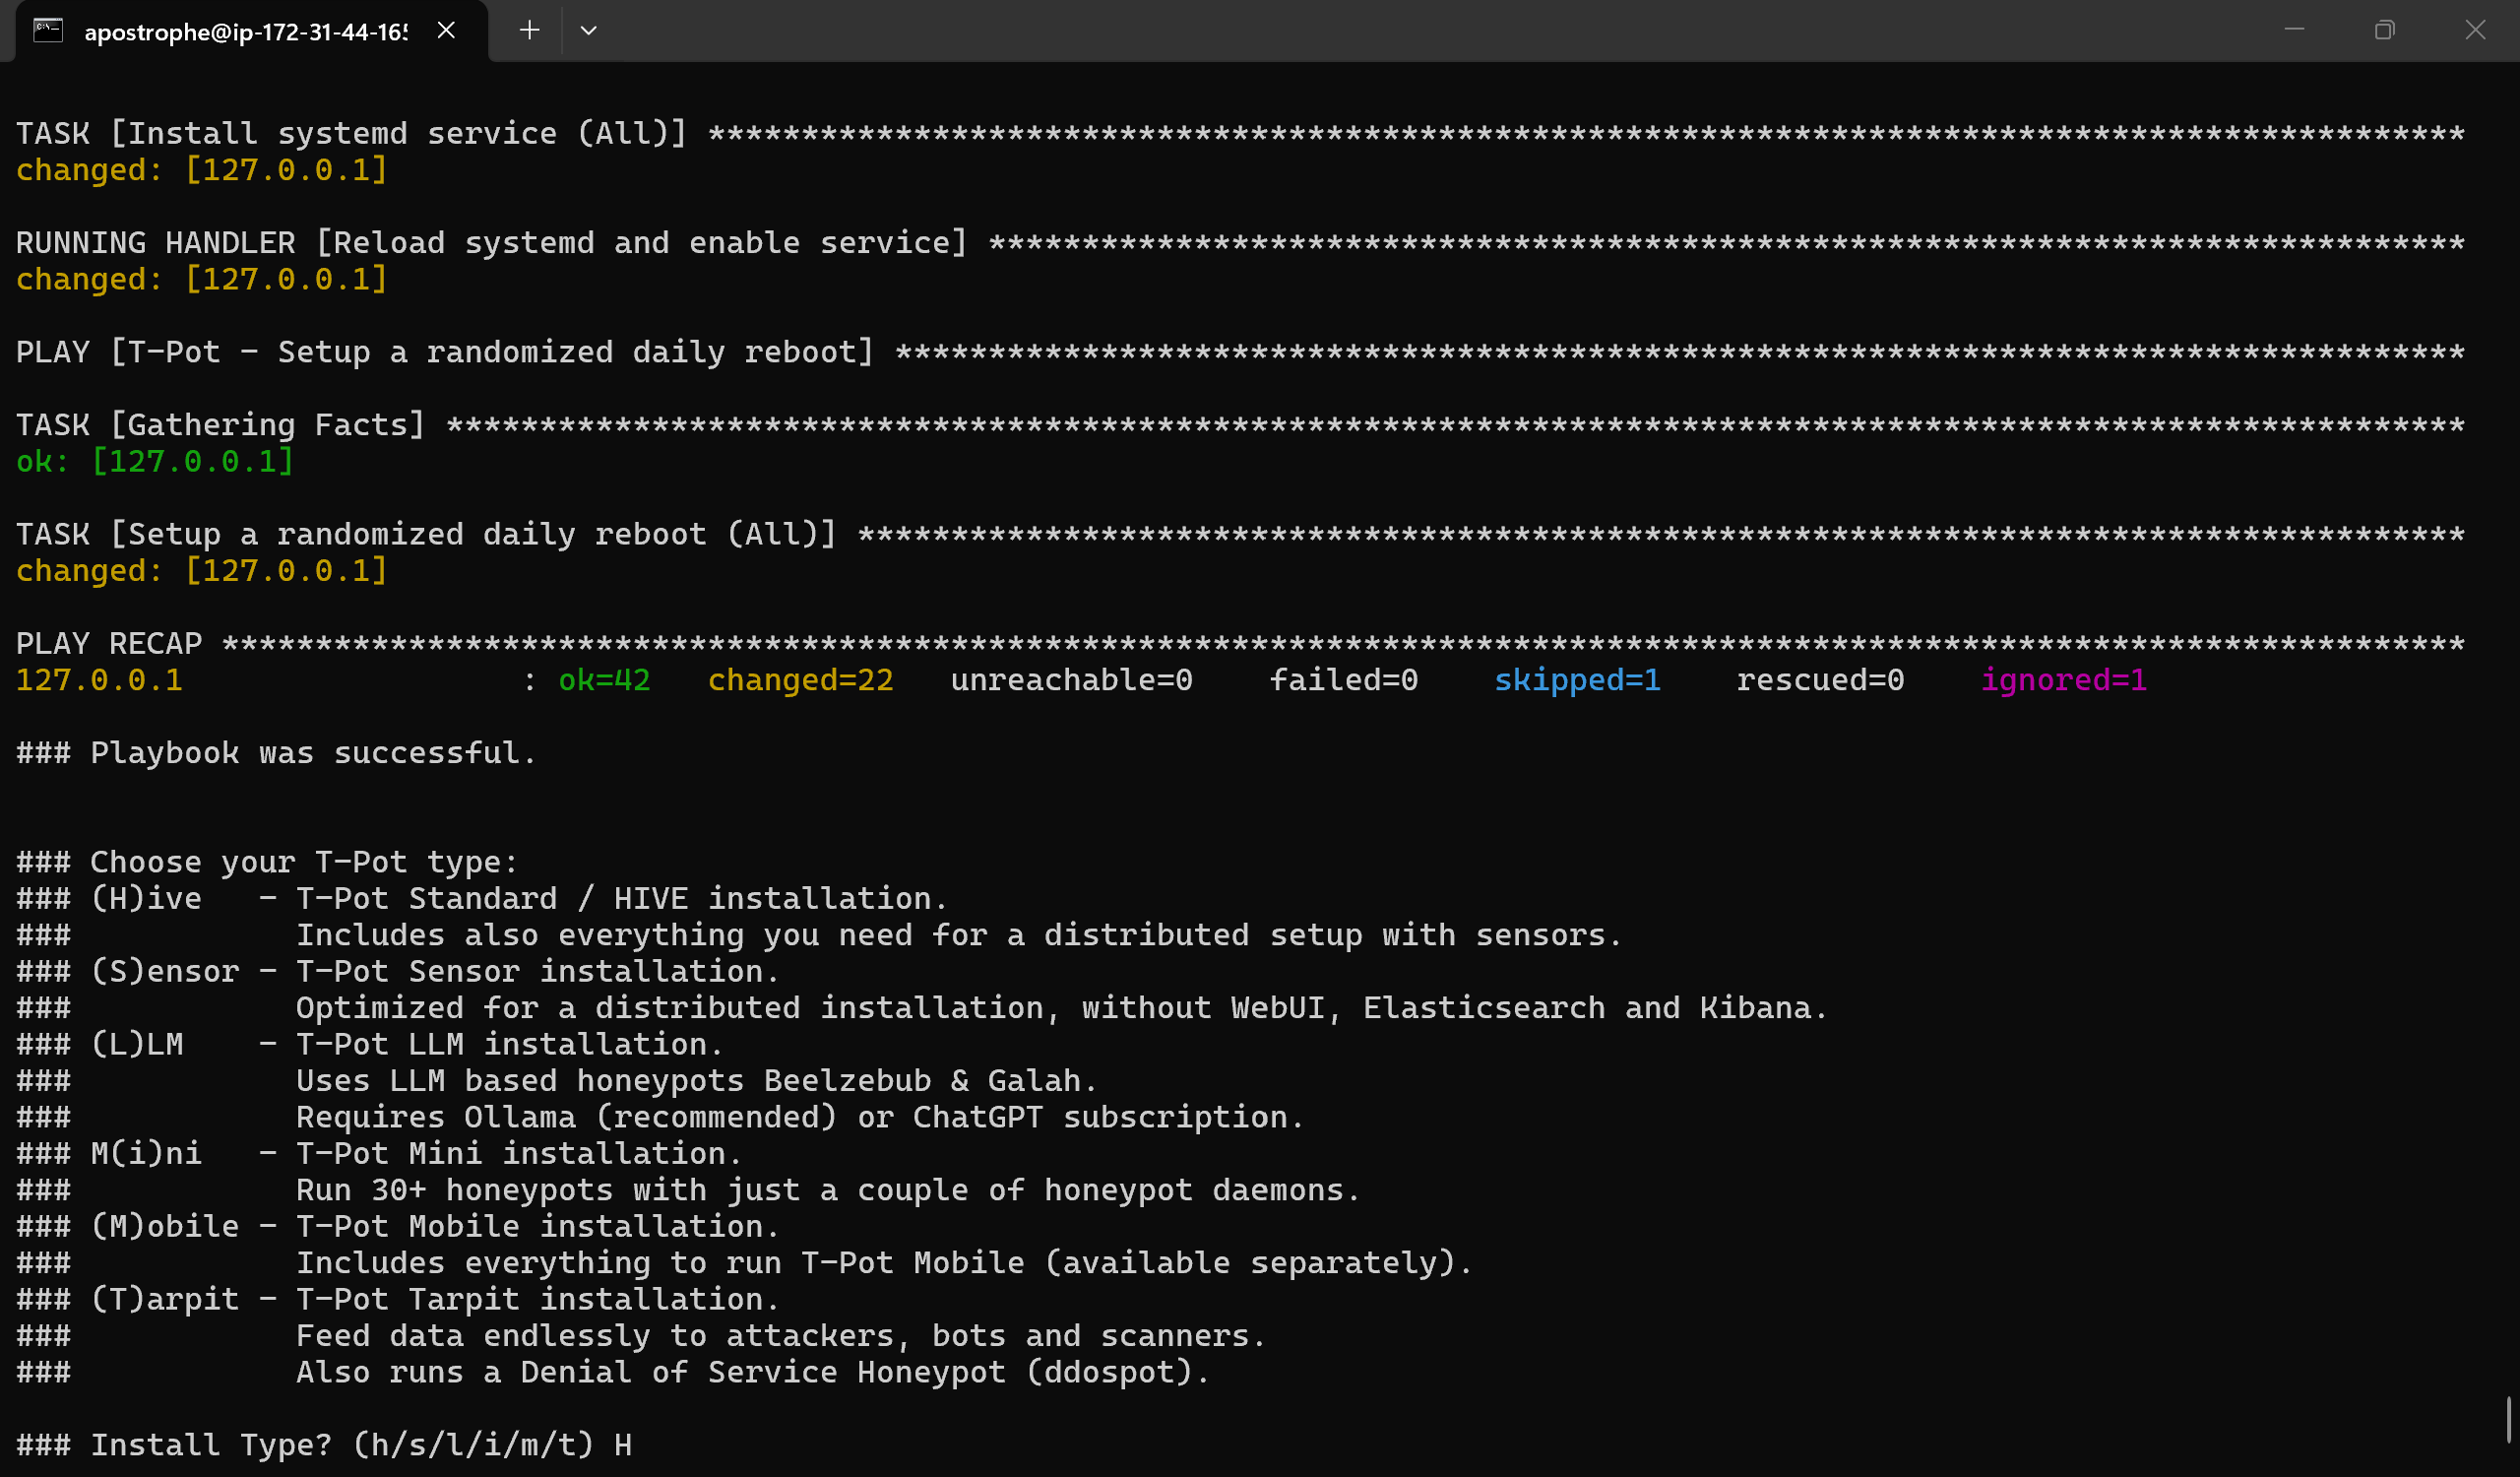
Installation options selected:
- **Type:** Hive - the standard full install with maximum capabilities
- **Web UI credentials:** Set a username and password (not writing them here obviously lol)
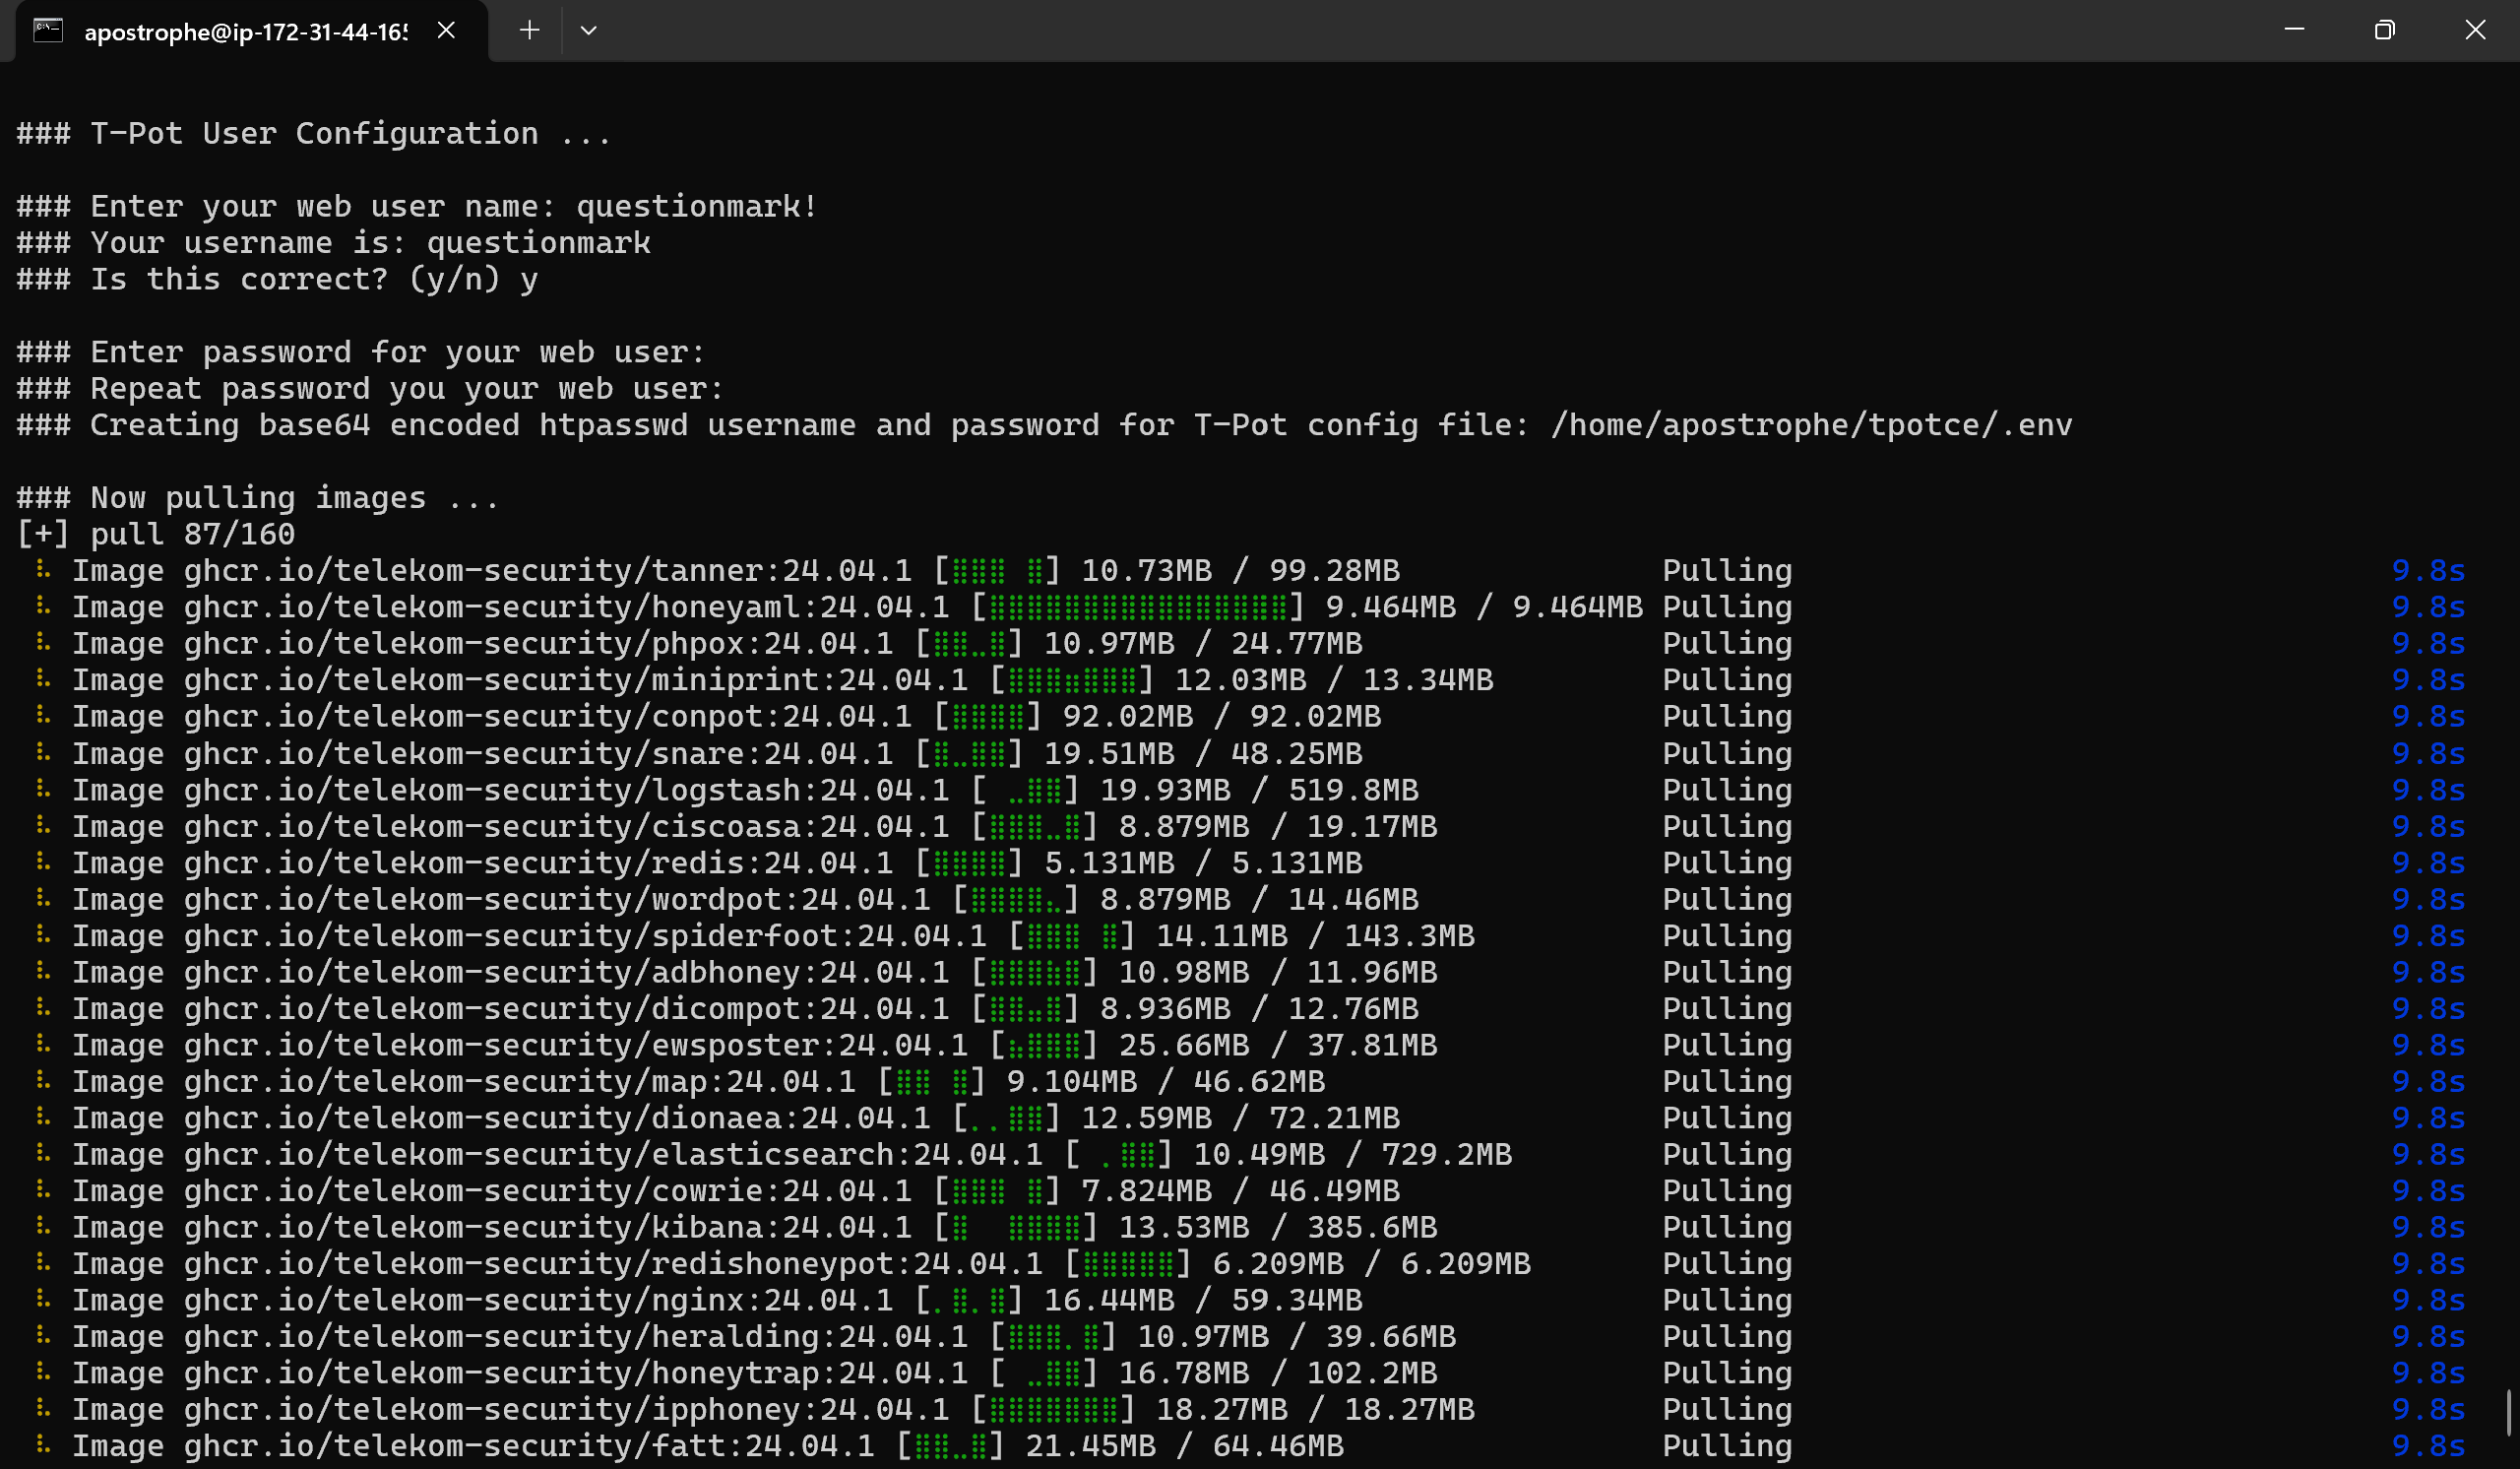
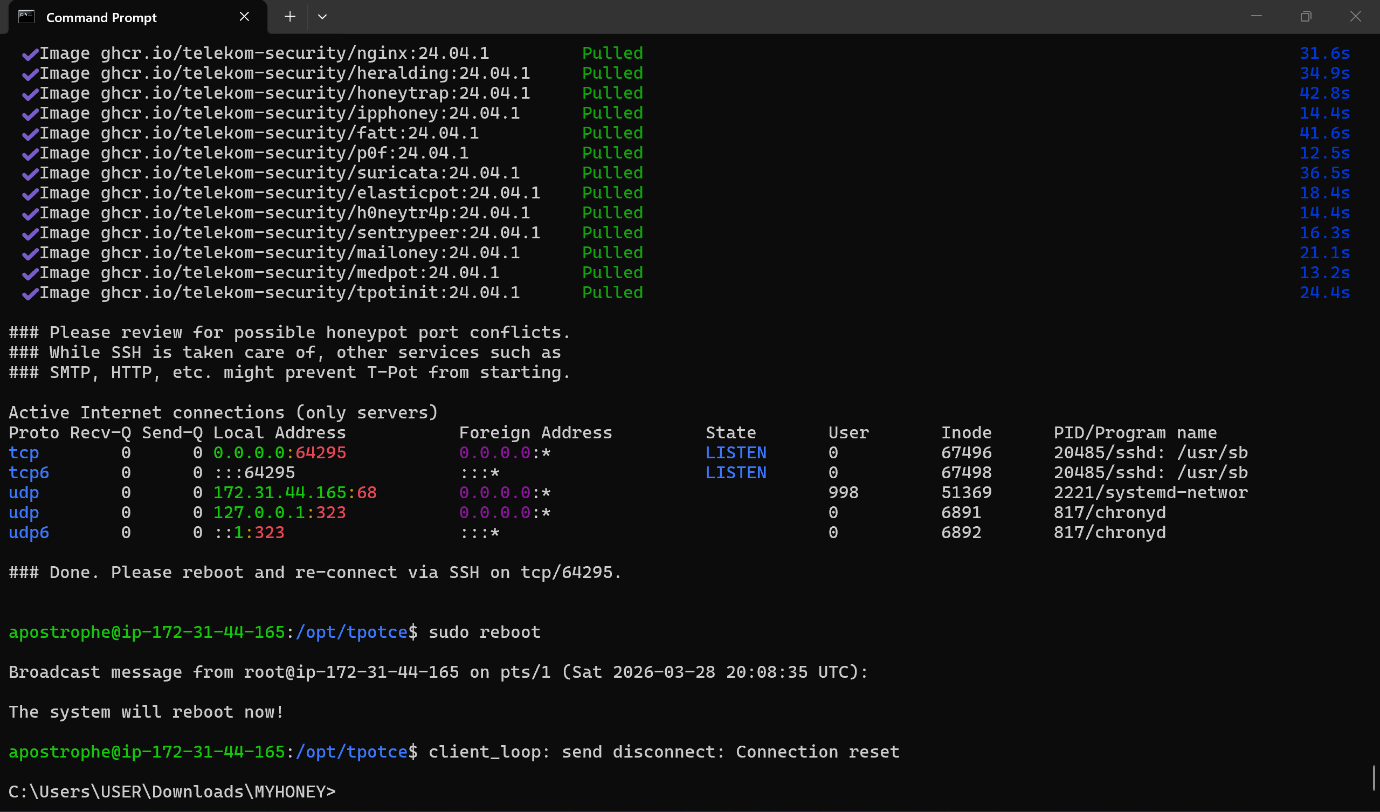
The installer pulls all the Docker images, configures the ELK stack, and changes the main SSH port. In my case it moved to **port 64295** - the old port 22 becomes the Cowrie SSH honeypot.
After install completed, rebooted the instance:
sudo reboot
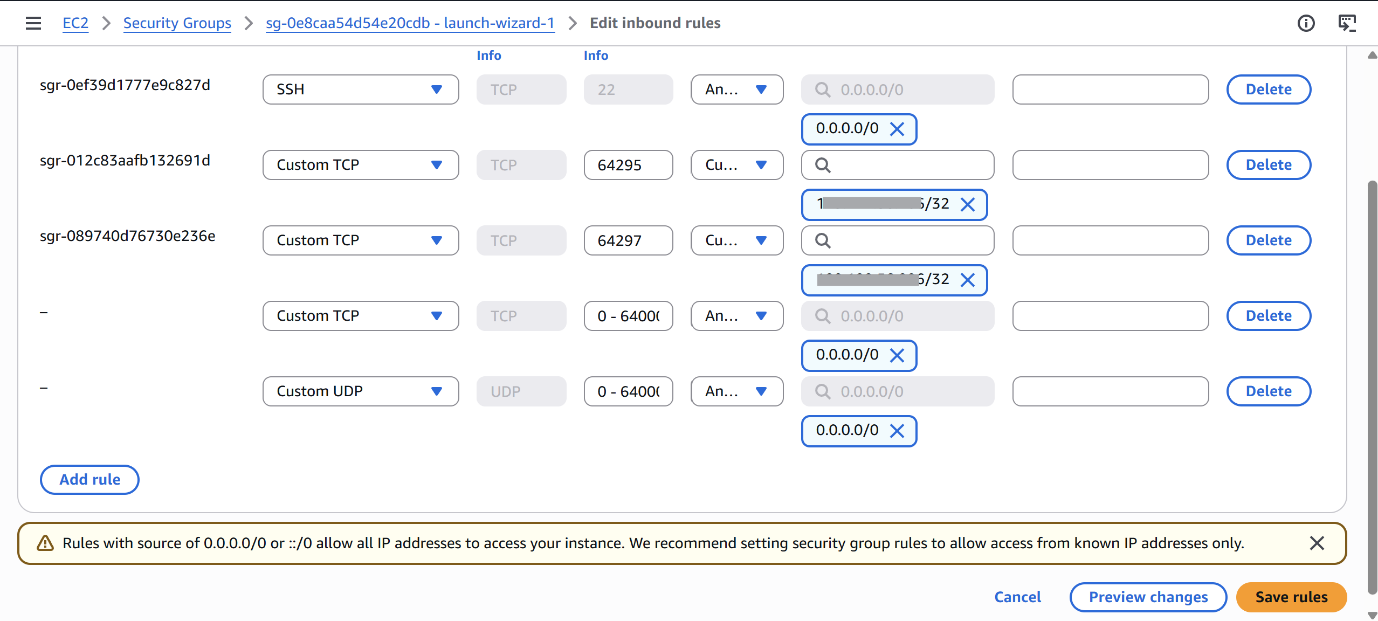
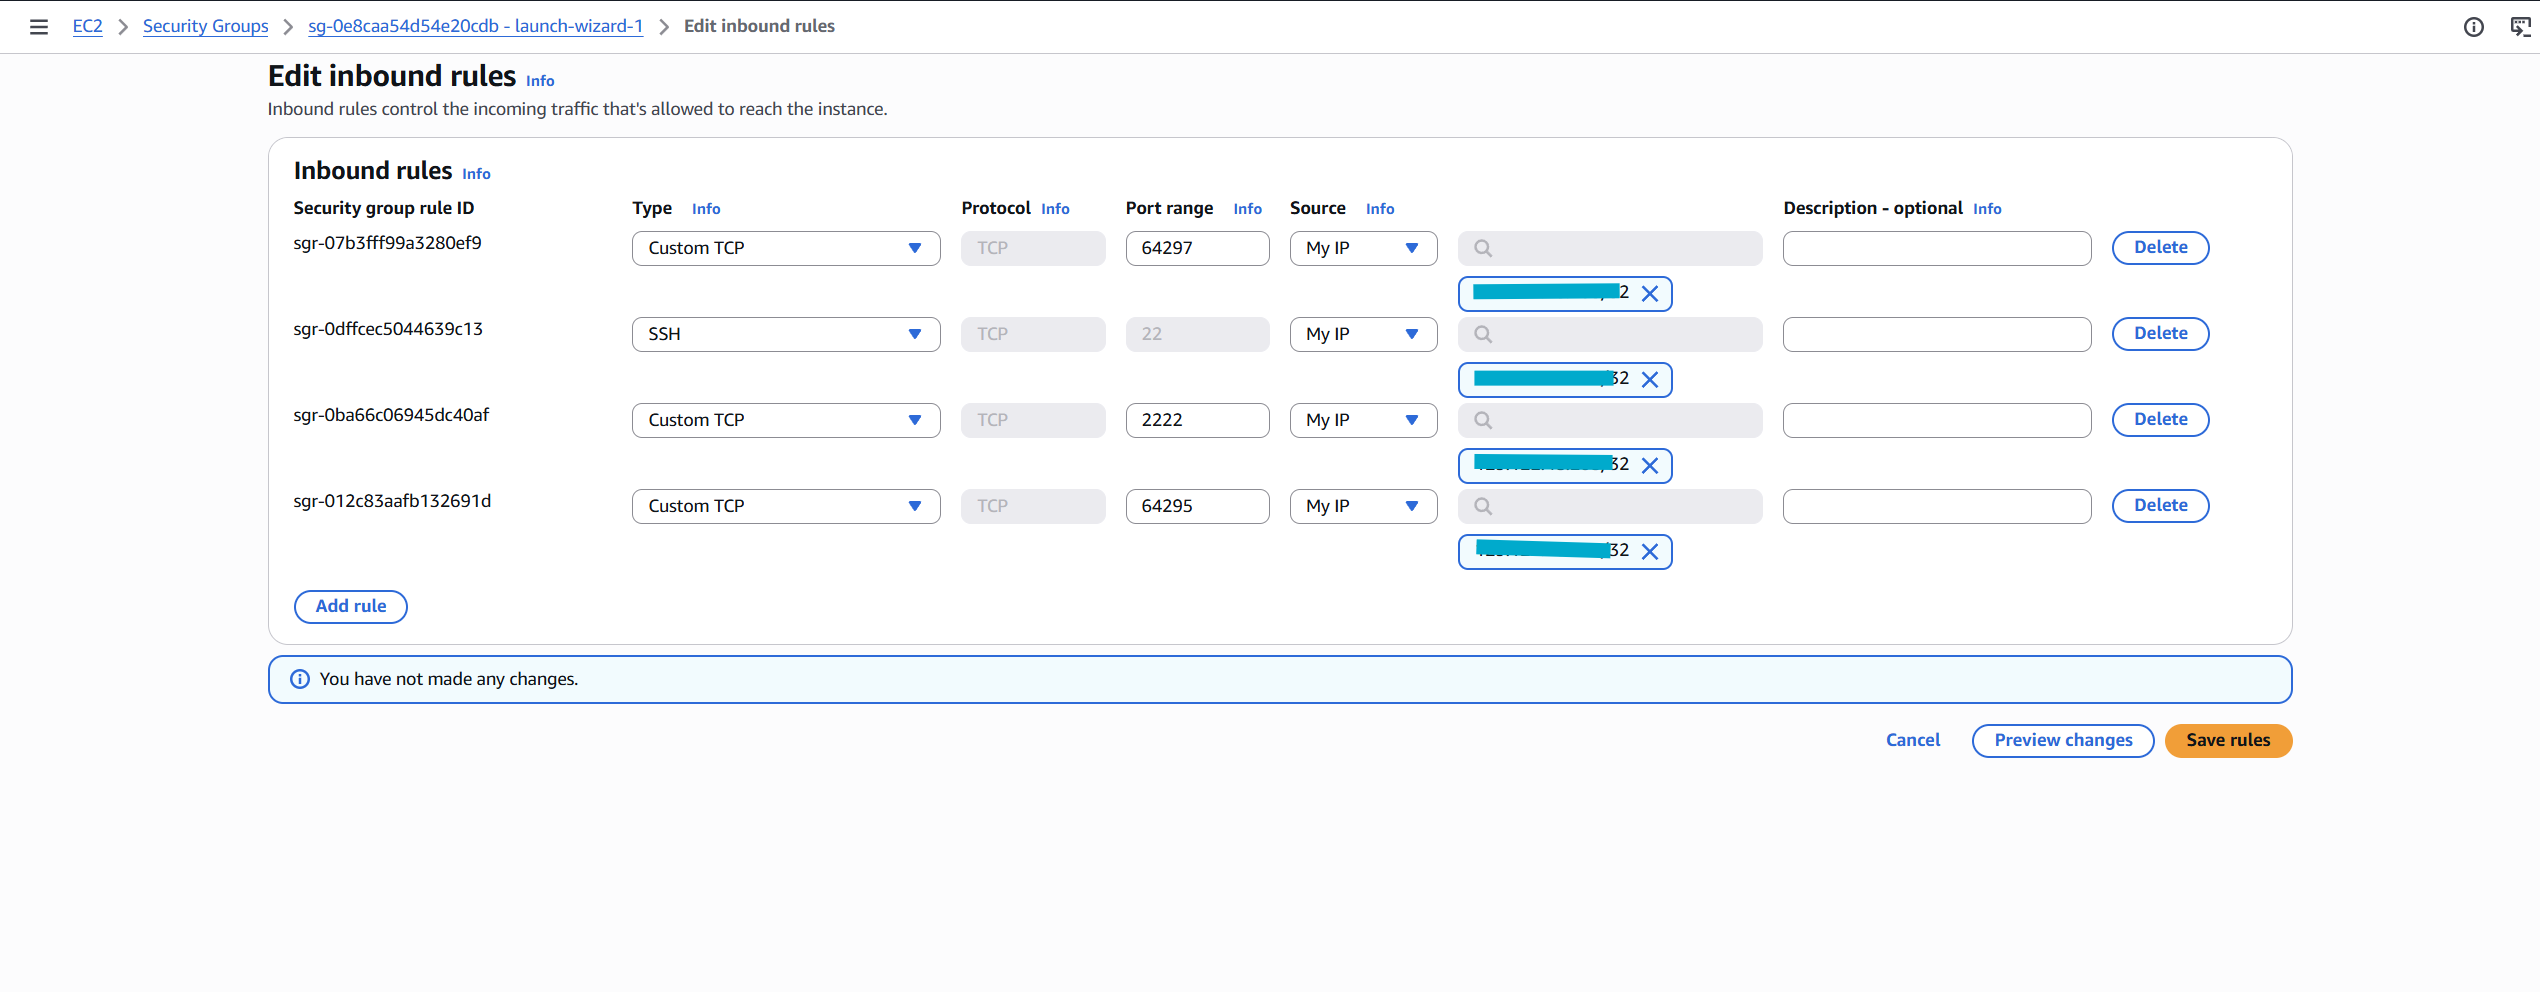
### 4.2 Security Group Rules
Before reconnecting, updated the EC2 security group inbound rules:
| Port Range | Protocol | Source | Purpose |
| --- | --- | --- | --- |
| 64295 | TCP | My IP only | Admin SSH access |
| 64297 | TCP | My IP only | T-Pot Web UI |
| 22 | TCP | 0.0.0.0/0 | Cowrie SSH honeypot |
The logic: everything on the admin ports is locked to my IP, everything on the honeypot ports is wide open to the internet.
Reconnected using the new port:
ssh -i "myhoney.pem" -p 64295 apostrophe@
### 4.3 Verifying the Web UI
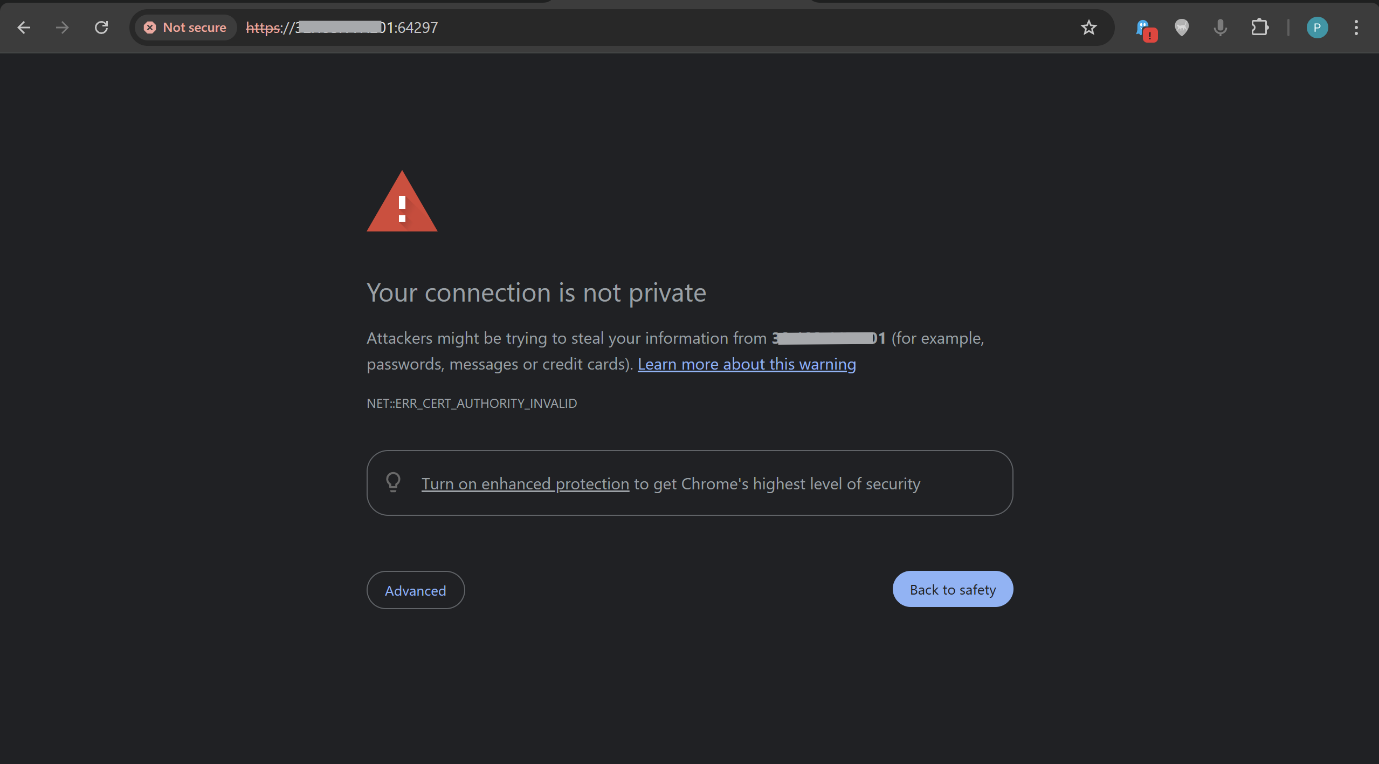
Accessed the T-Pot web interface at `https://:64297`. Kept getting a "site can't be reached" error. Everything looked fine in the backend though:
sudo systemctl status tpot
sudo docker ps
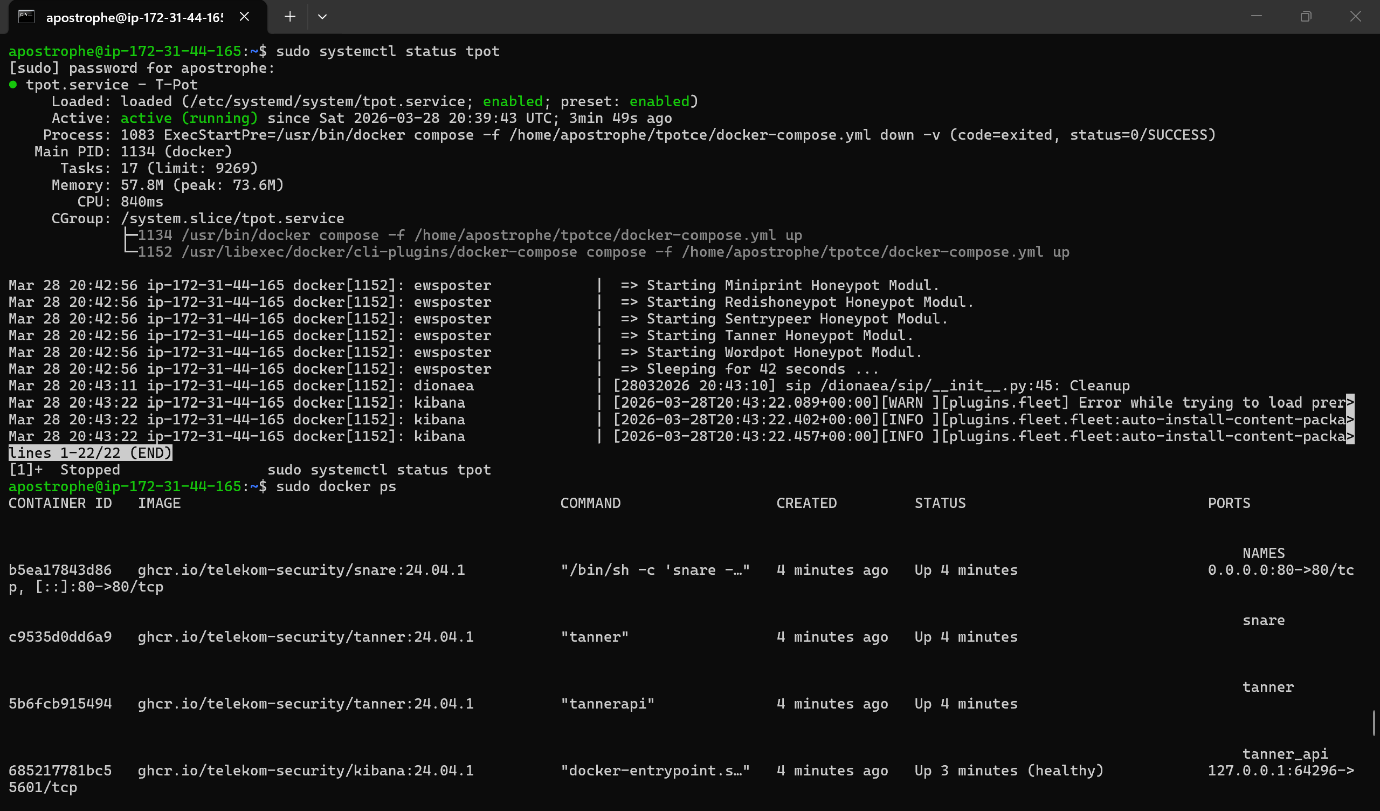
All containers were running. Turned out the issue was that my IP filter in the security group rule was too restrictive - a quirk with how AWS handles source IP matching on some browser setups. Fixed it by temporarily allowing `0.0.0.0/0` on port 64297, confirmed the UI loaded, then immediately locked it back to my IP.
First time logging in I had a credential issue. The exclamation mark in my intended username (`questionmark!`) was being silently dropped by the T-Pot user management script. When I thought everything was going well... nope. Used the `genuser.sh` script from the tpot directory to create a clean new credential set:
cd /opt/tpotce
sudo ./genuser.sh
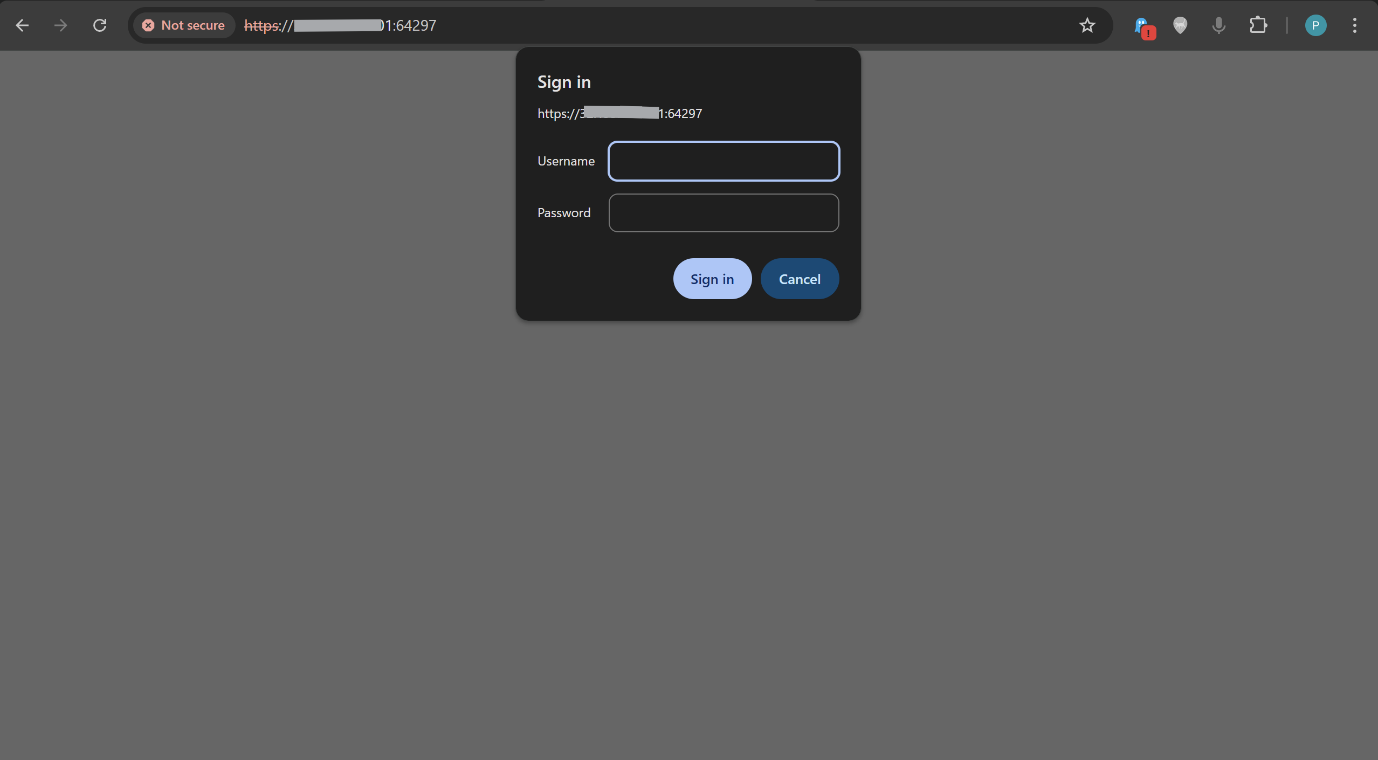 
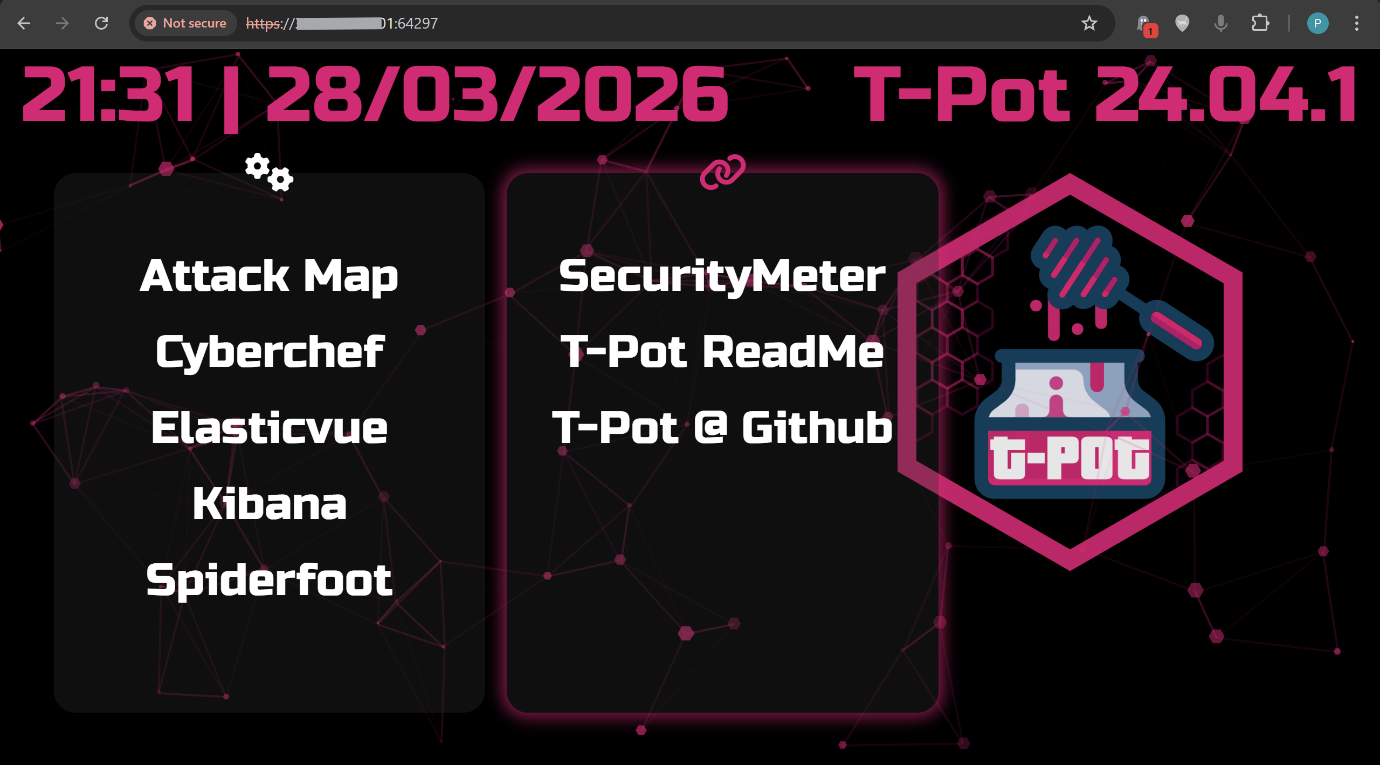
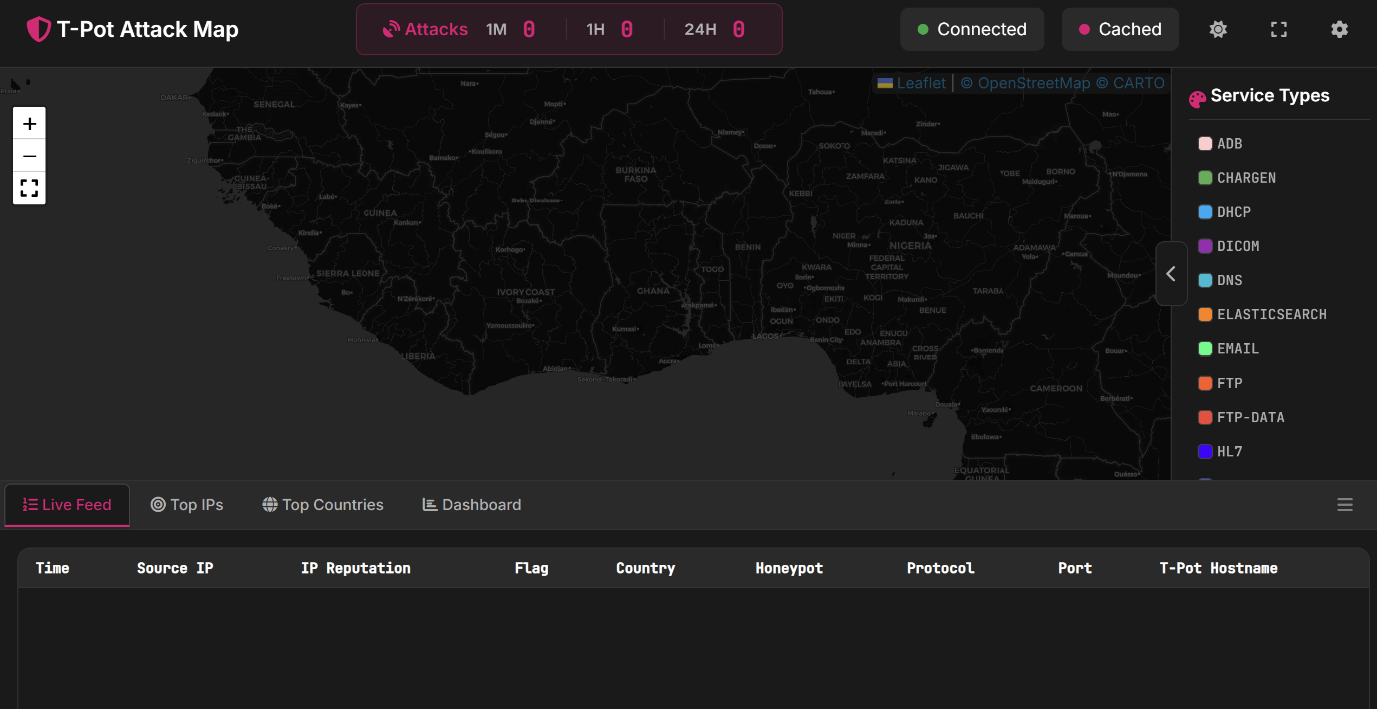
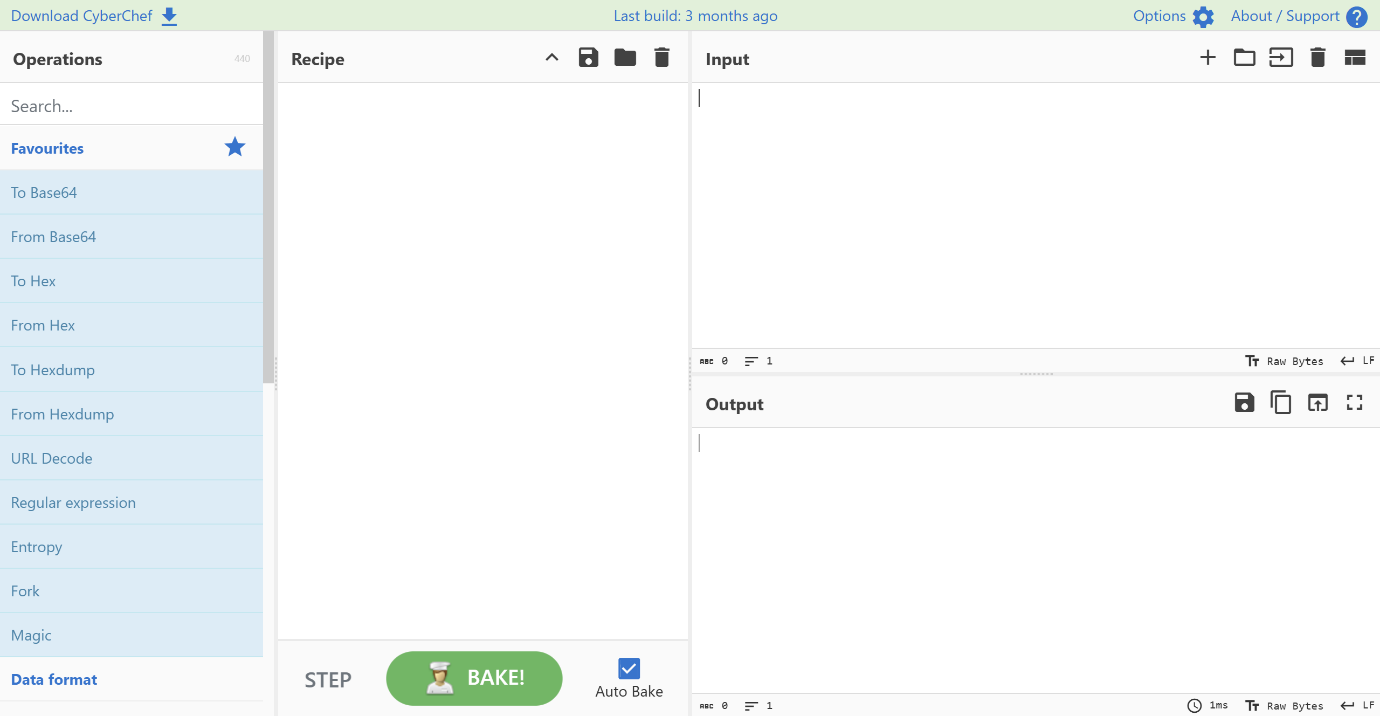
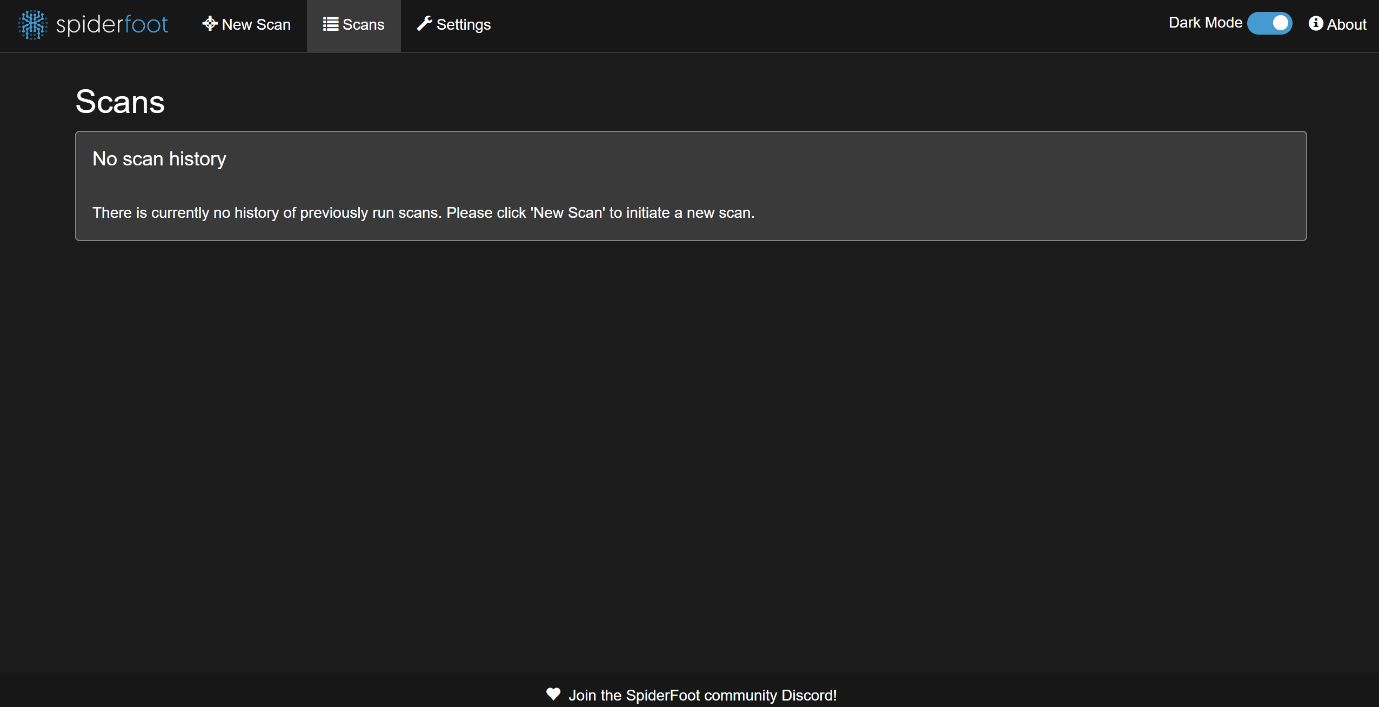
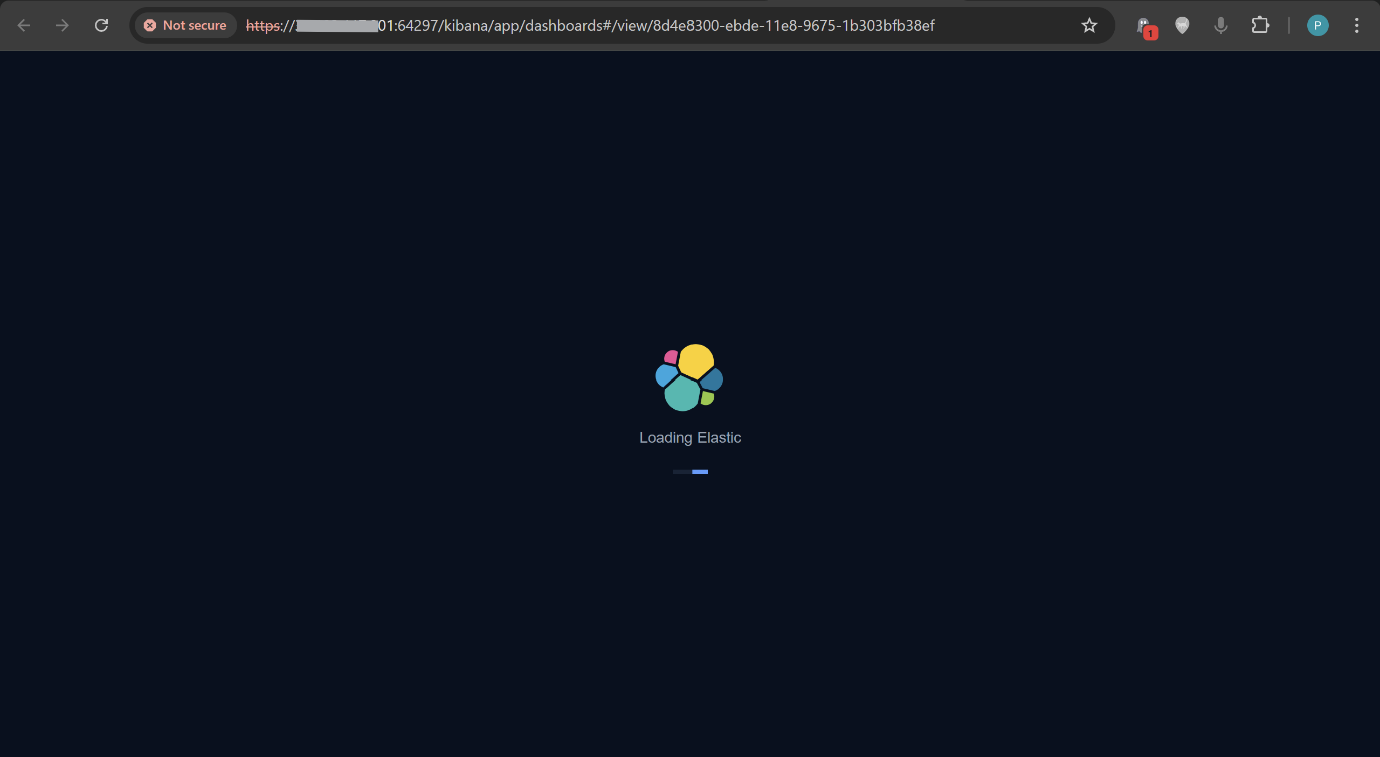
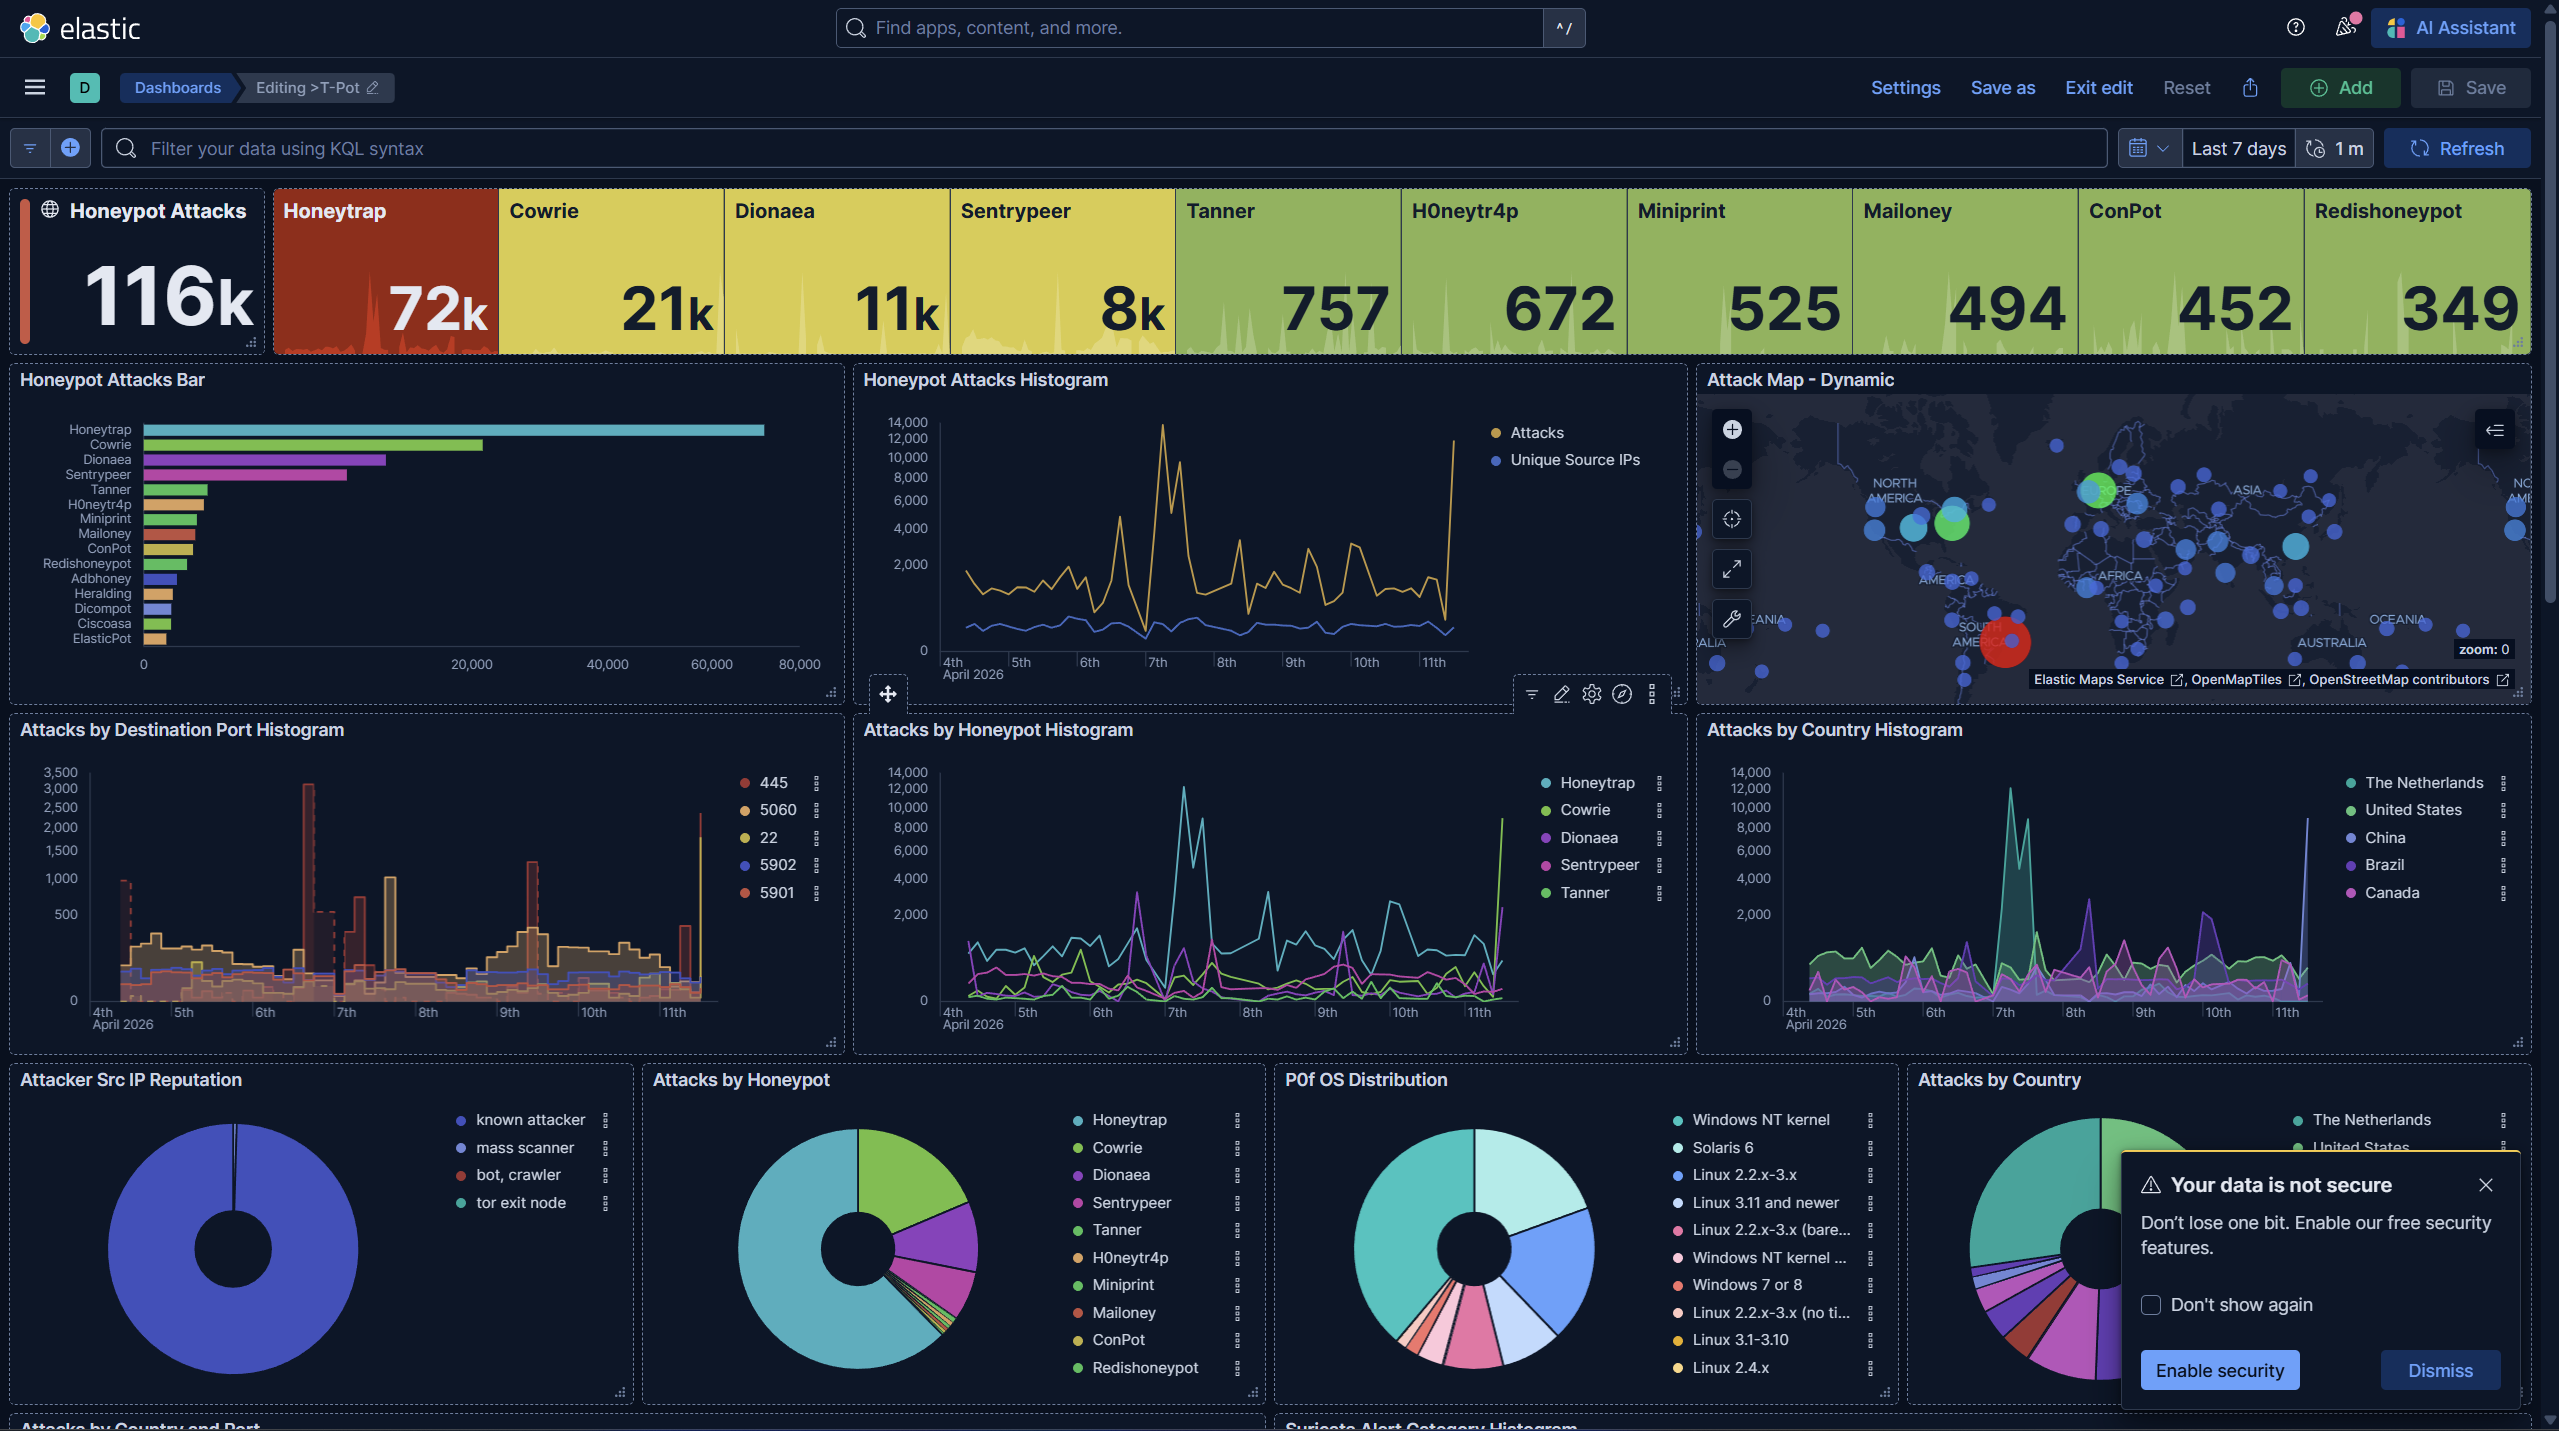
After that, the UI loaded clean. Confirmed all the built-in tools were working:
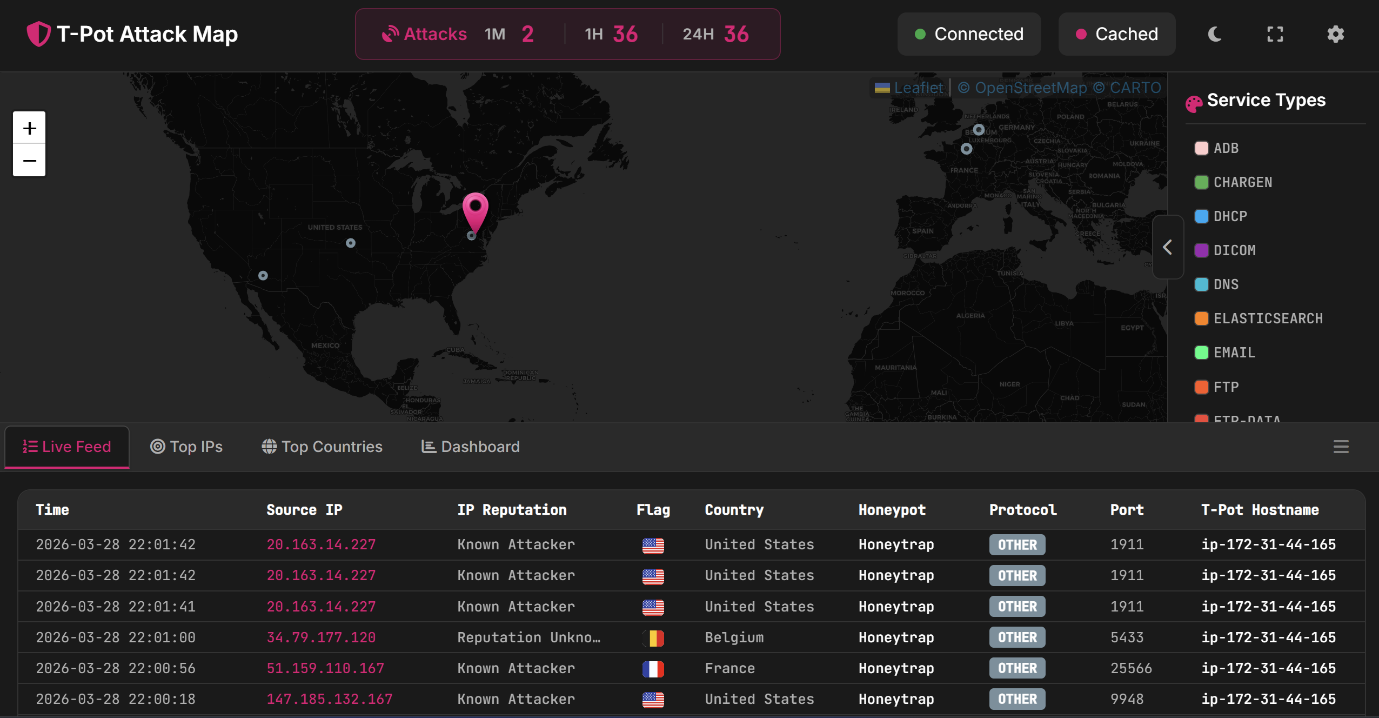
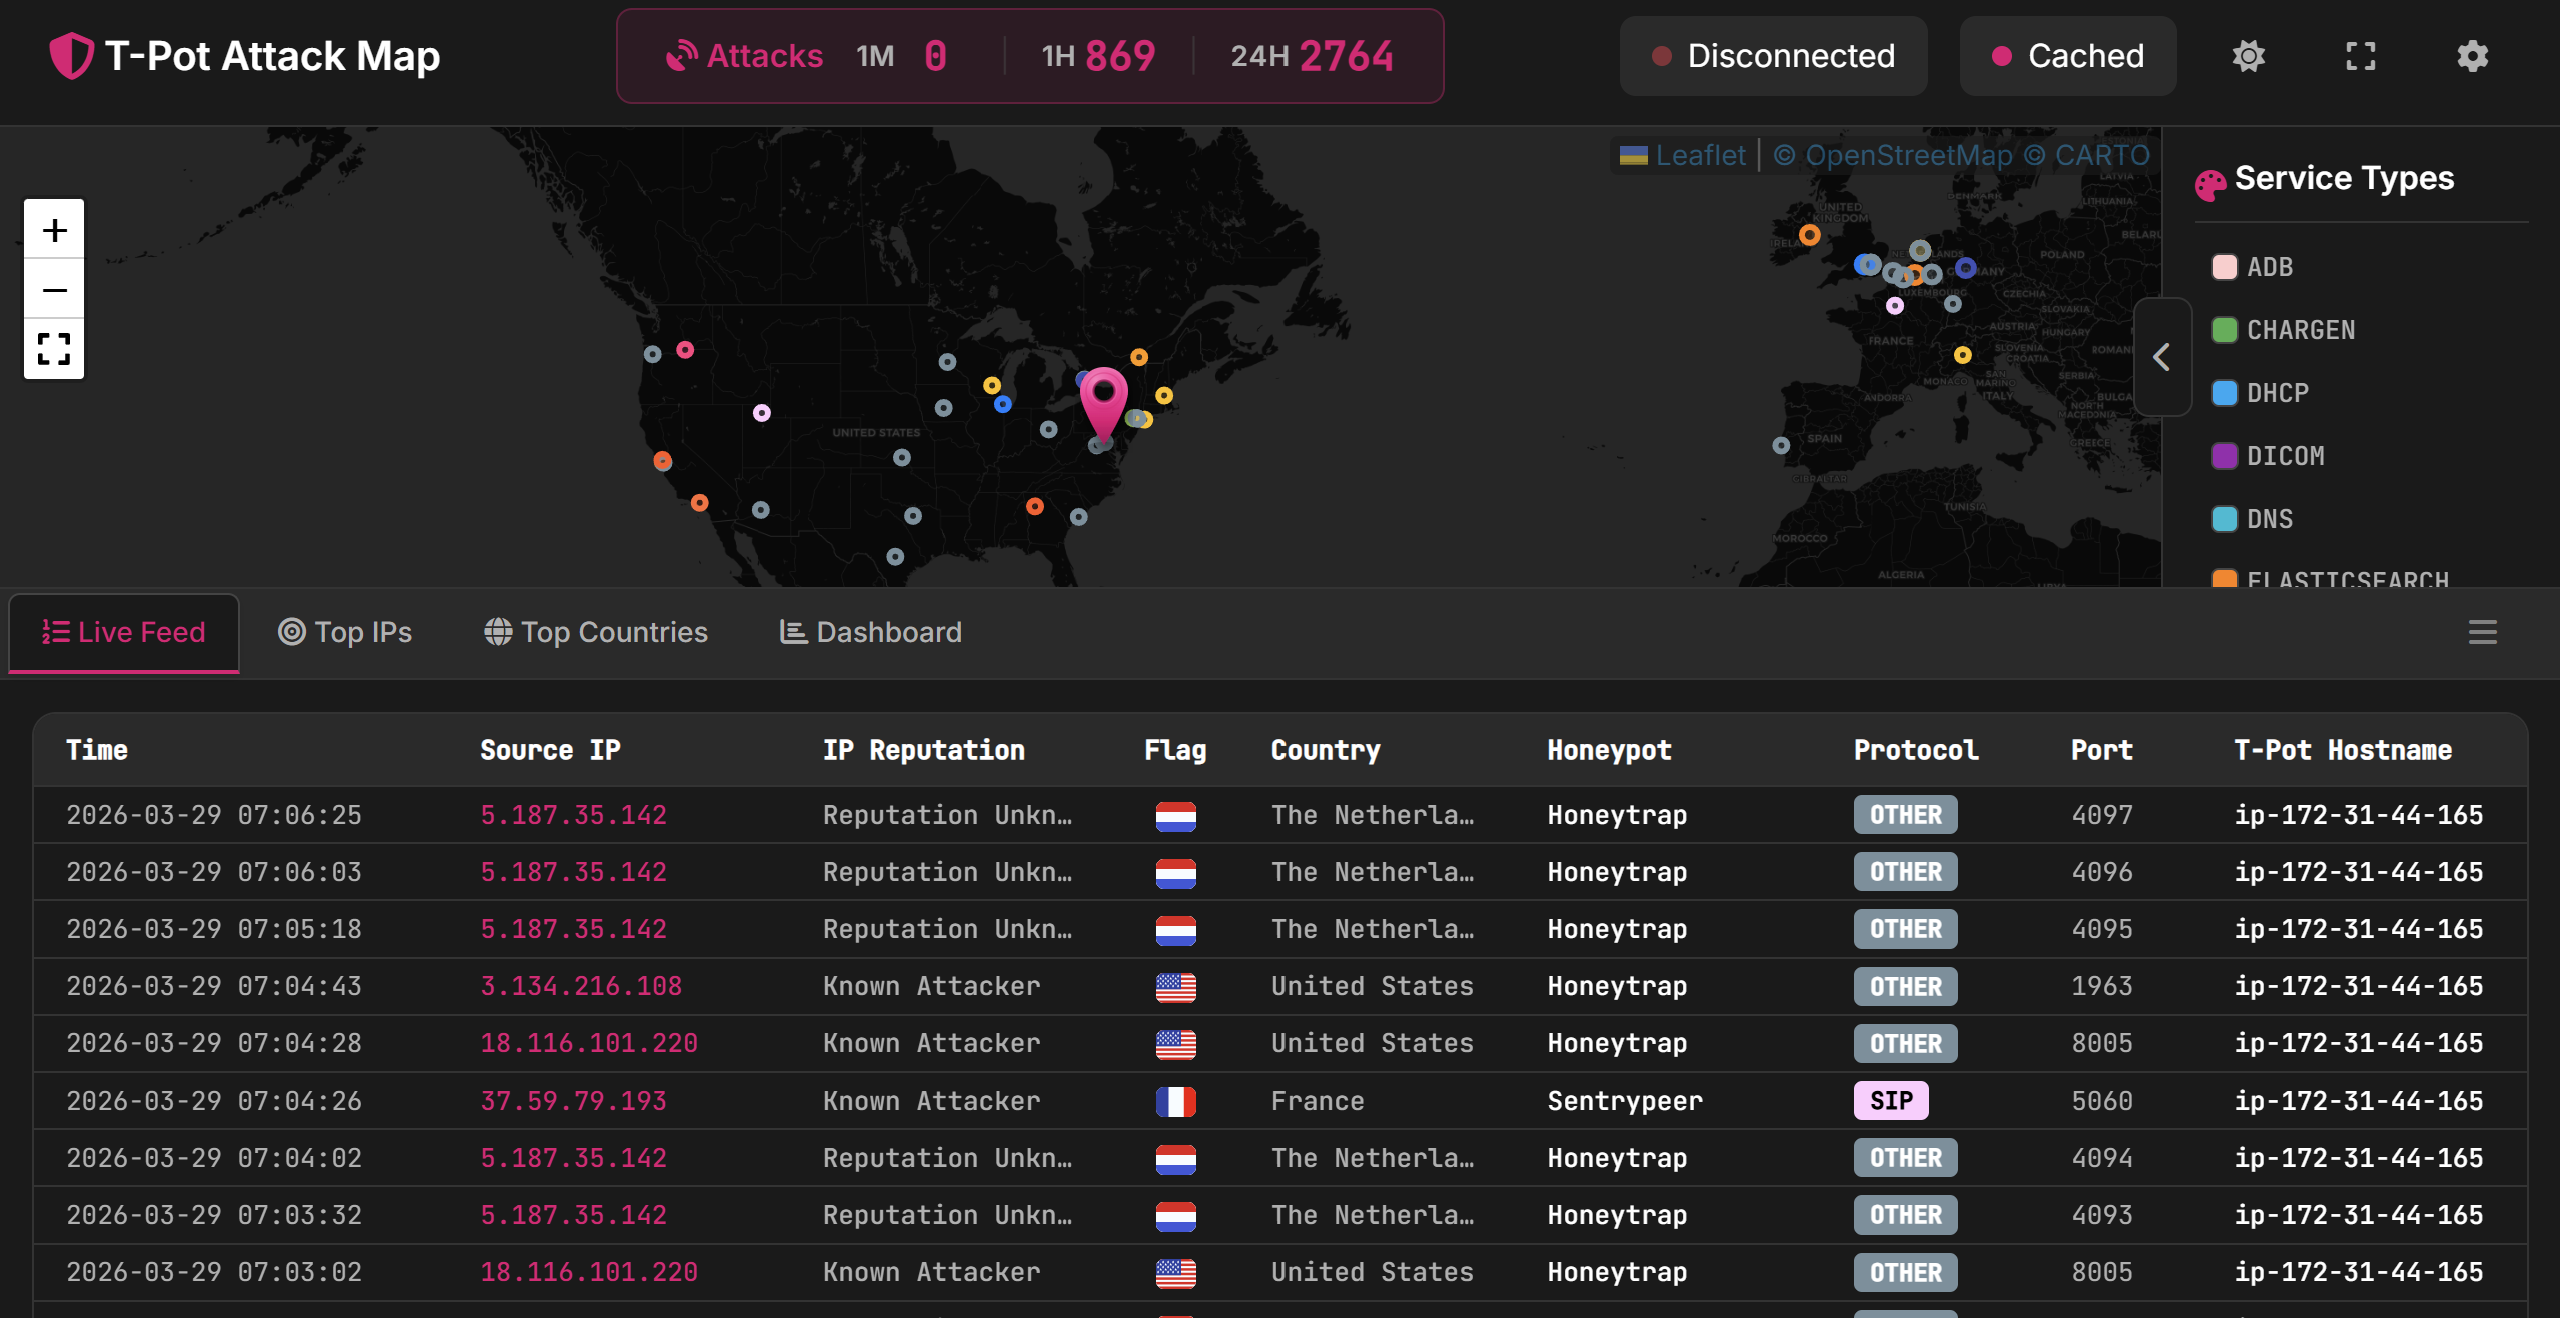
- Attack Map
- CyberChef
- Spiderfoot
- Kibana (was still loading - takes a couple of minutes on first boot)
### 4.4 Opening to the Internet
Once everything was confirmed working, updated the security group to allow all inbound traffic on ports 0–64000. Rebooted the instance and within a few minutes, hits started coming in.
- First hits: within minutes of going live
- After 7 hours: visible attack volume across multiple honeypots
- After 2 weeks: thousands of events per day, multiple countries
Edited the inbound rules back (restricted to my IP only) when it was time to do the analysis cleanly.
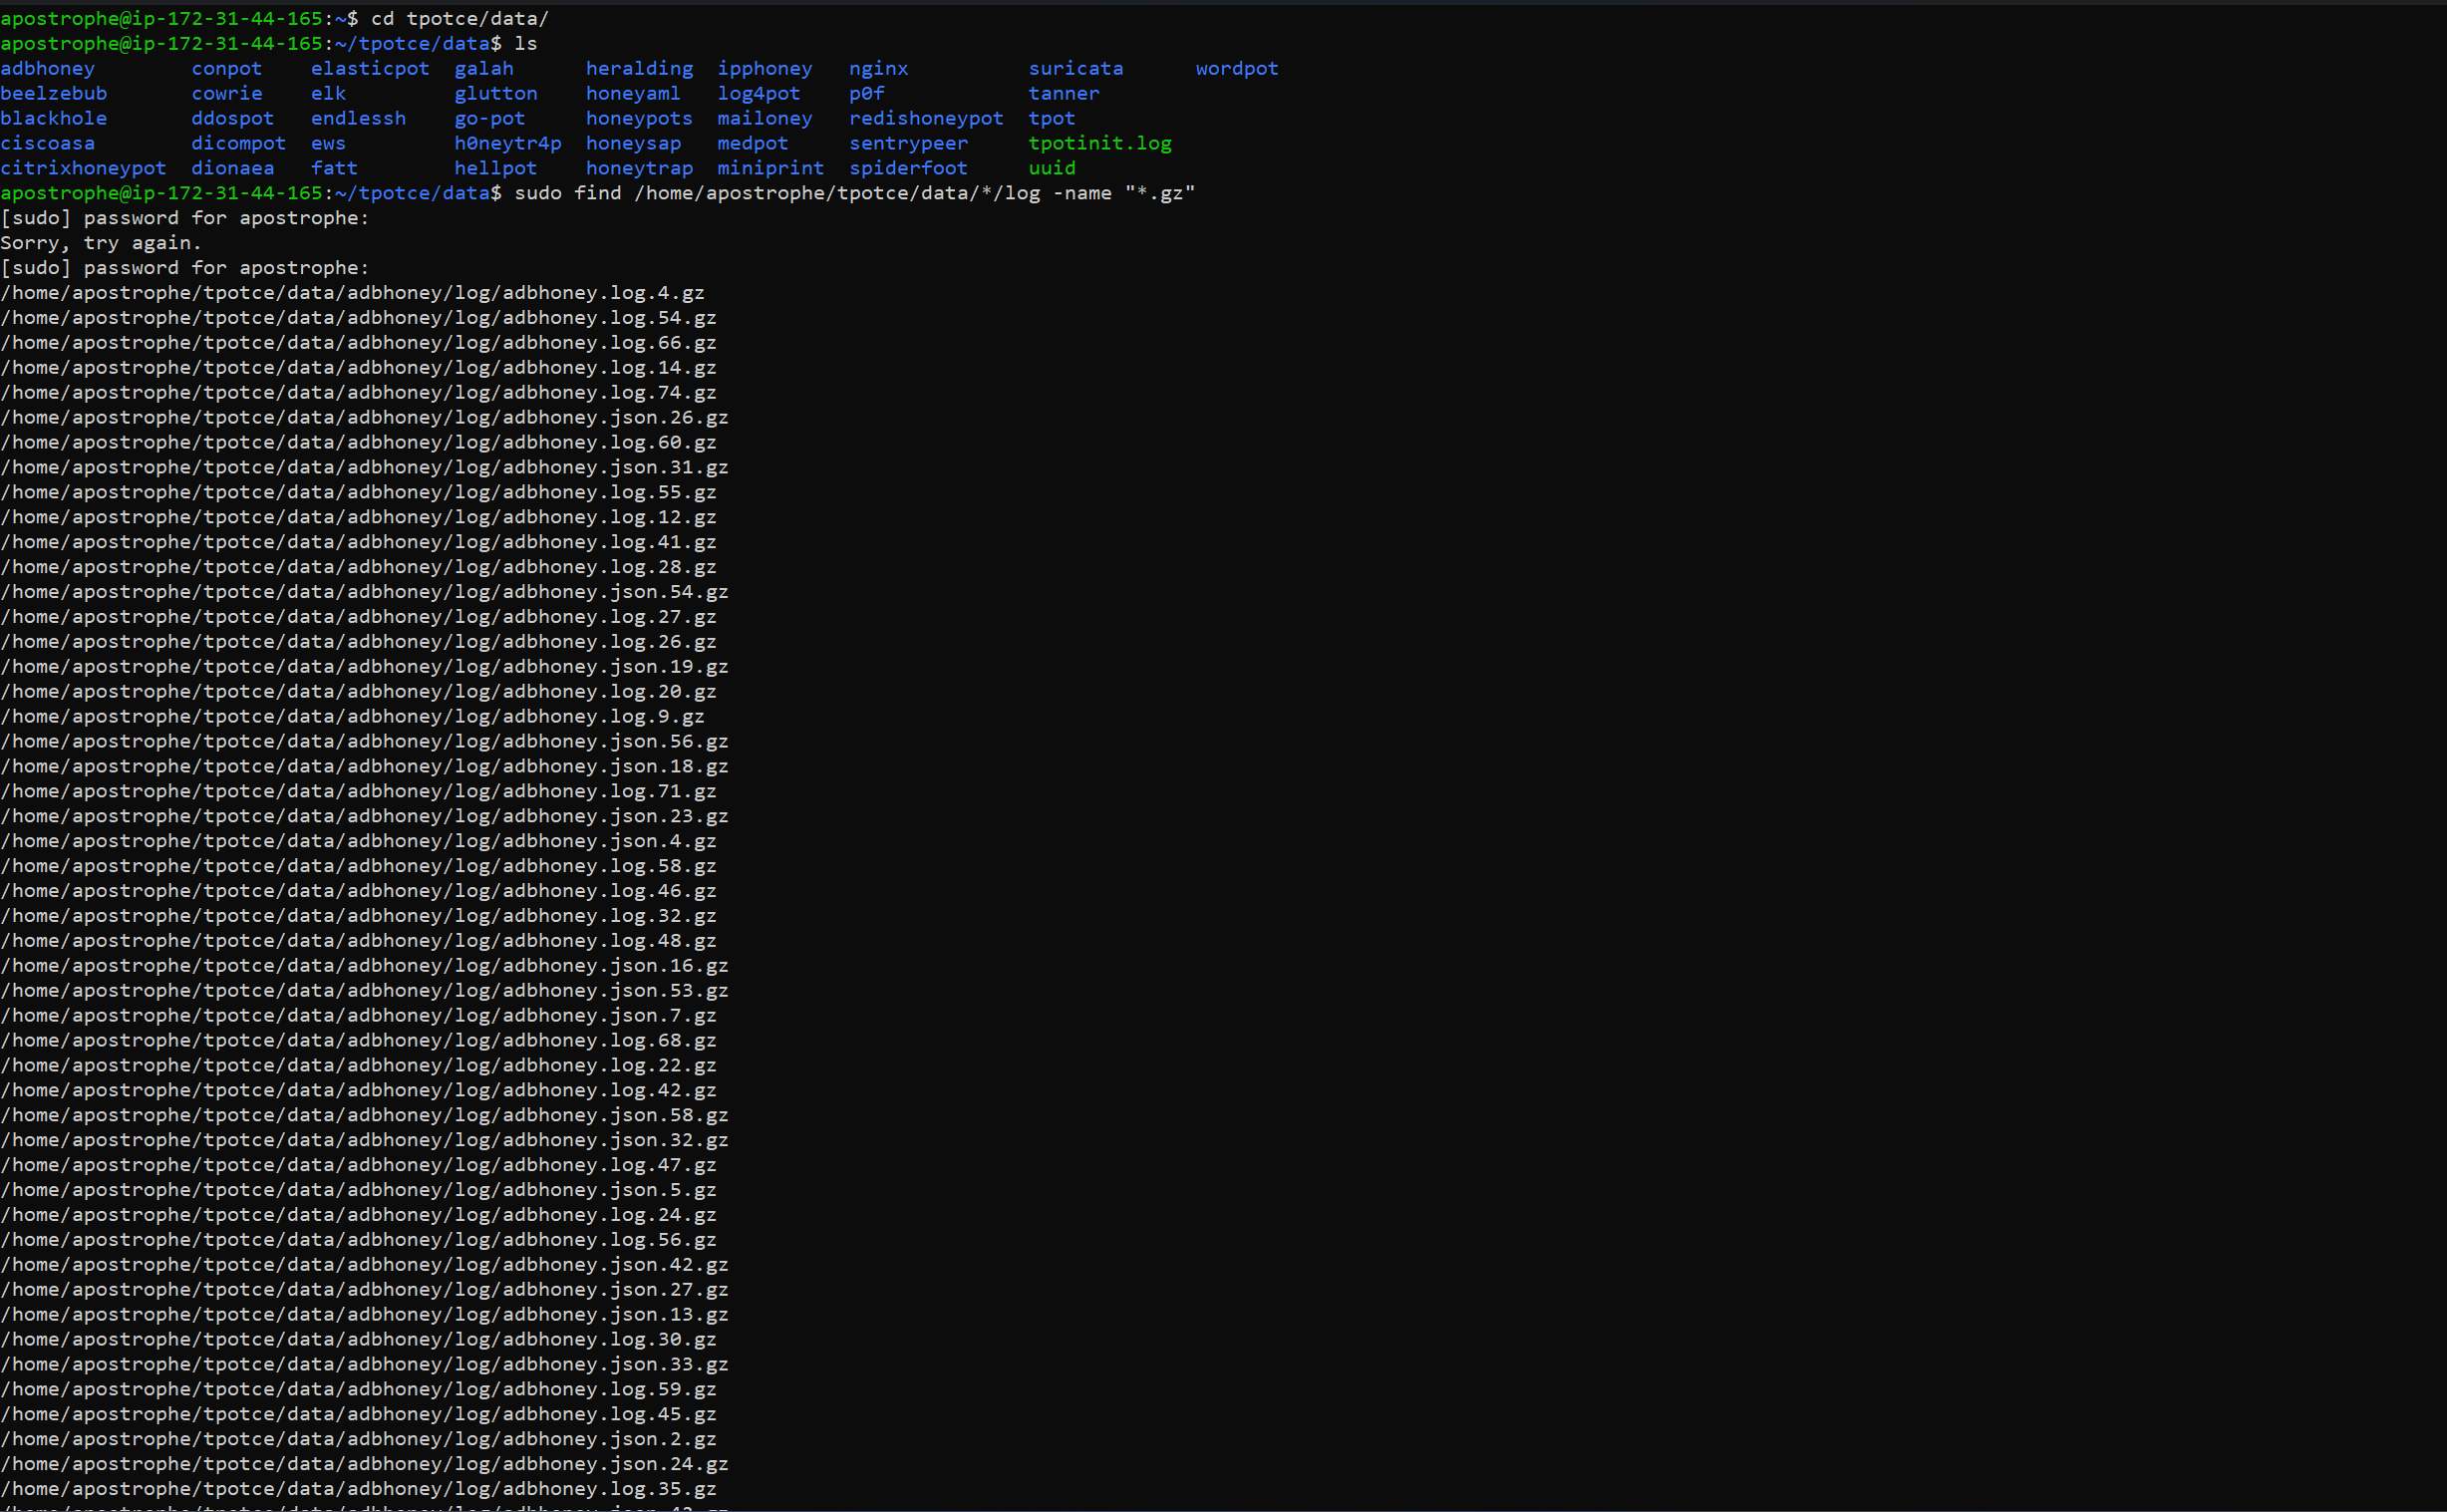
## 5\. Log Decompression & Preparation
T-Pot's internal logrotate compresses older logs to `.gz`. Splunk's Universal Forwarder can read `.gz` files but the ELK stack components don't always play well — and more importantly, I wanted to make sure everything was readable before pointing Splunk at it.
Found all compressed log files:
sudo find /home/apostrophe/tpotce/data/*/log -name "*.gz"
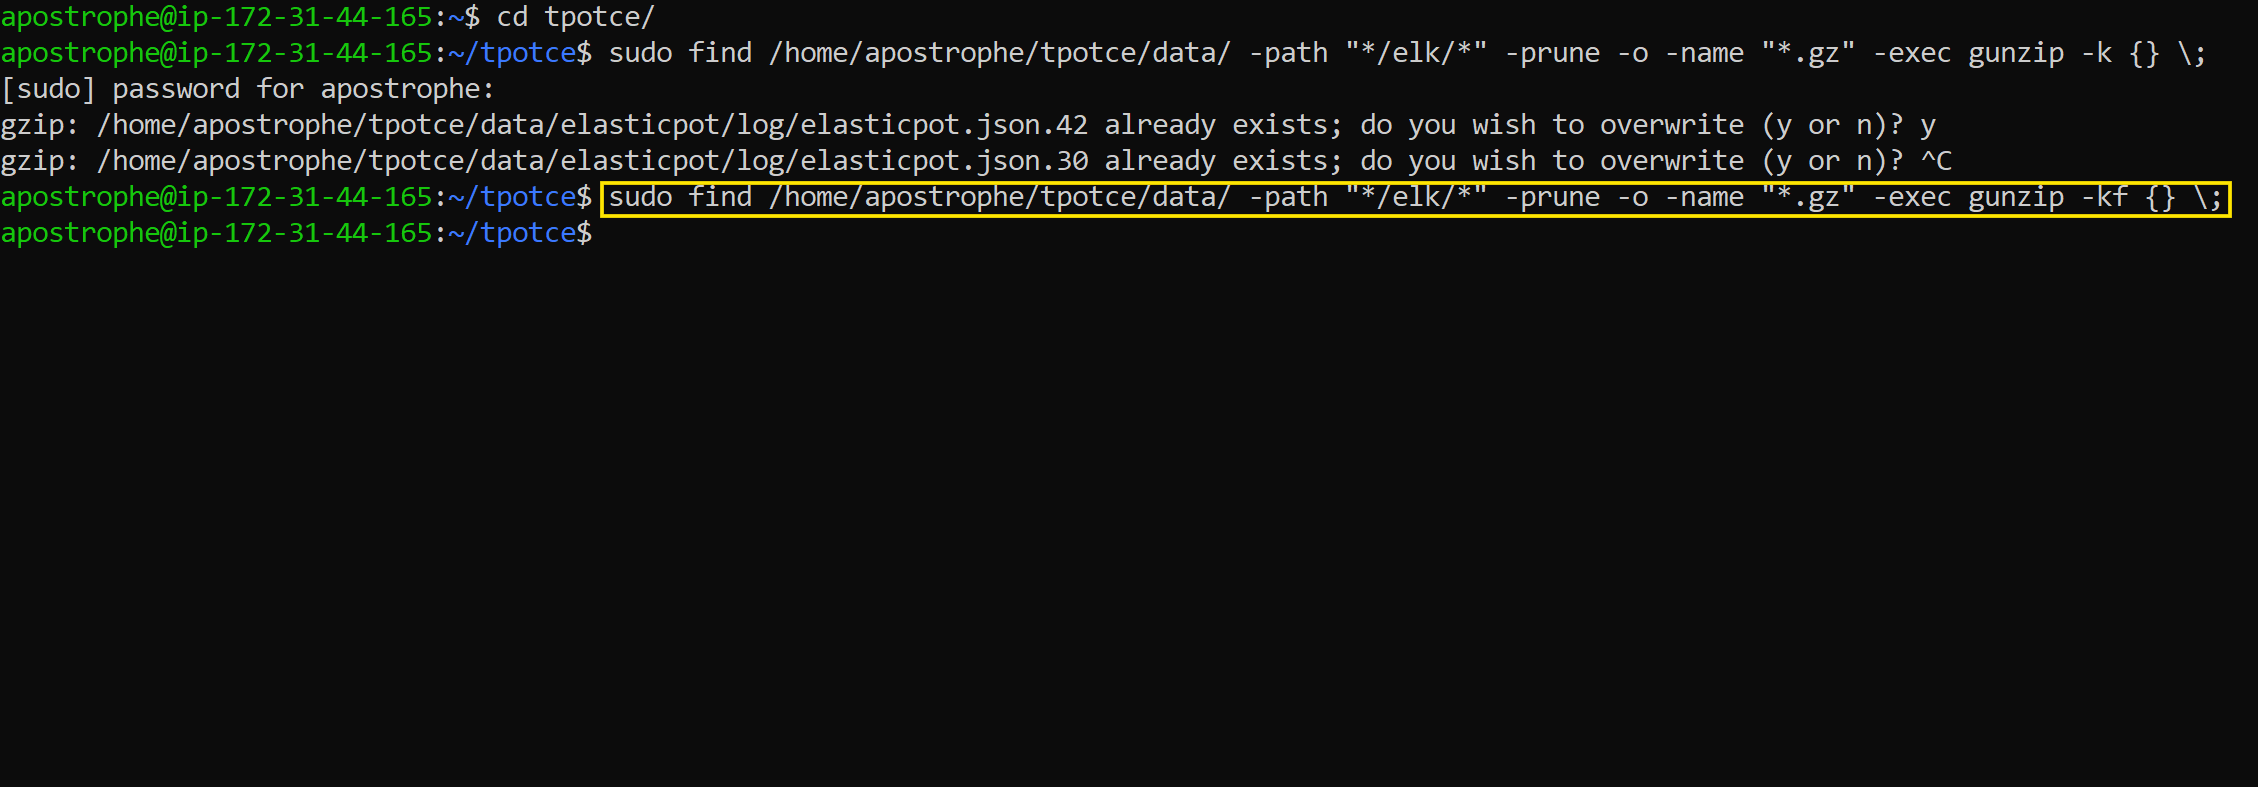
Decompressed everything while keeping the originals (the `-k` flag) and skipping the ELK directory (those are internal T-Pot indexes, not attack logs):
sudo find /home/apostrophe/tpotce/data \
-path "*/elk/*" -prune \
-o -name "*.gz" -exec gunzip -kf {} \;
Verified the output:
sudo find /home/apostrophe/tpotce/data \
-path "*/elk/*" -prune \
-o \( -name "*.json" -o -name "*.csv" -o -name "*.log" \) -print | head -10
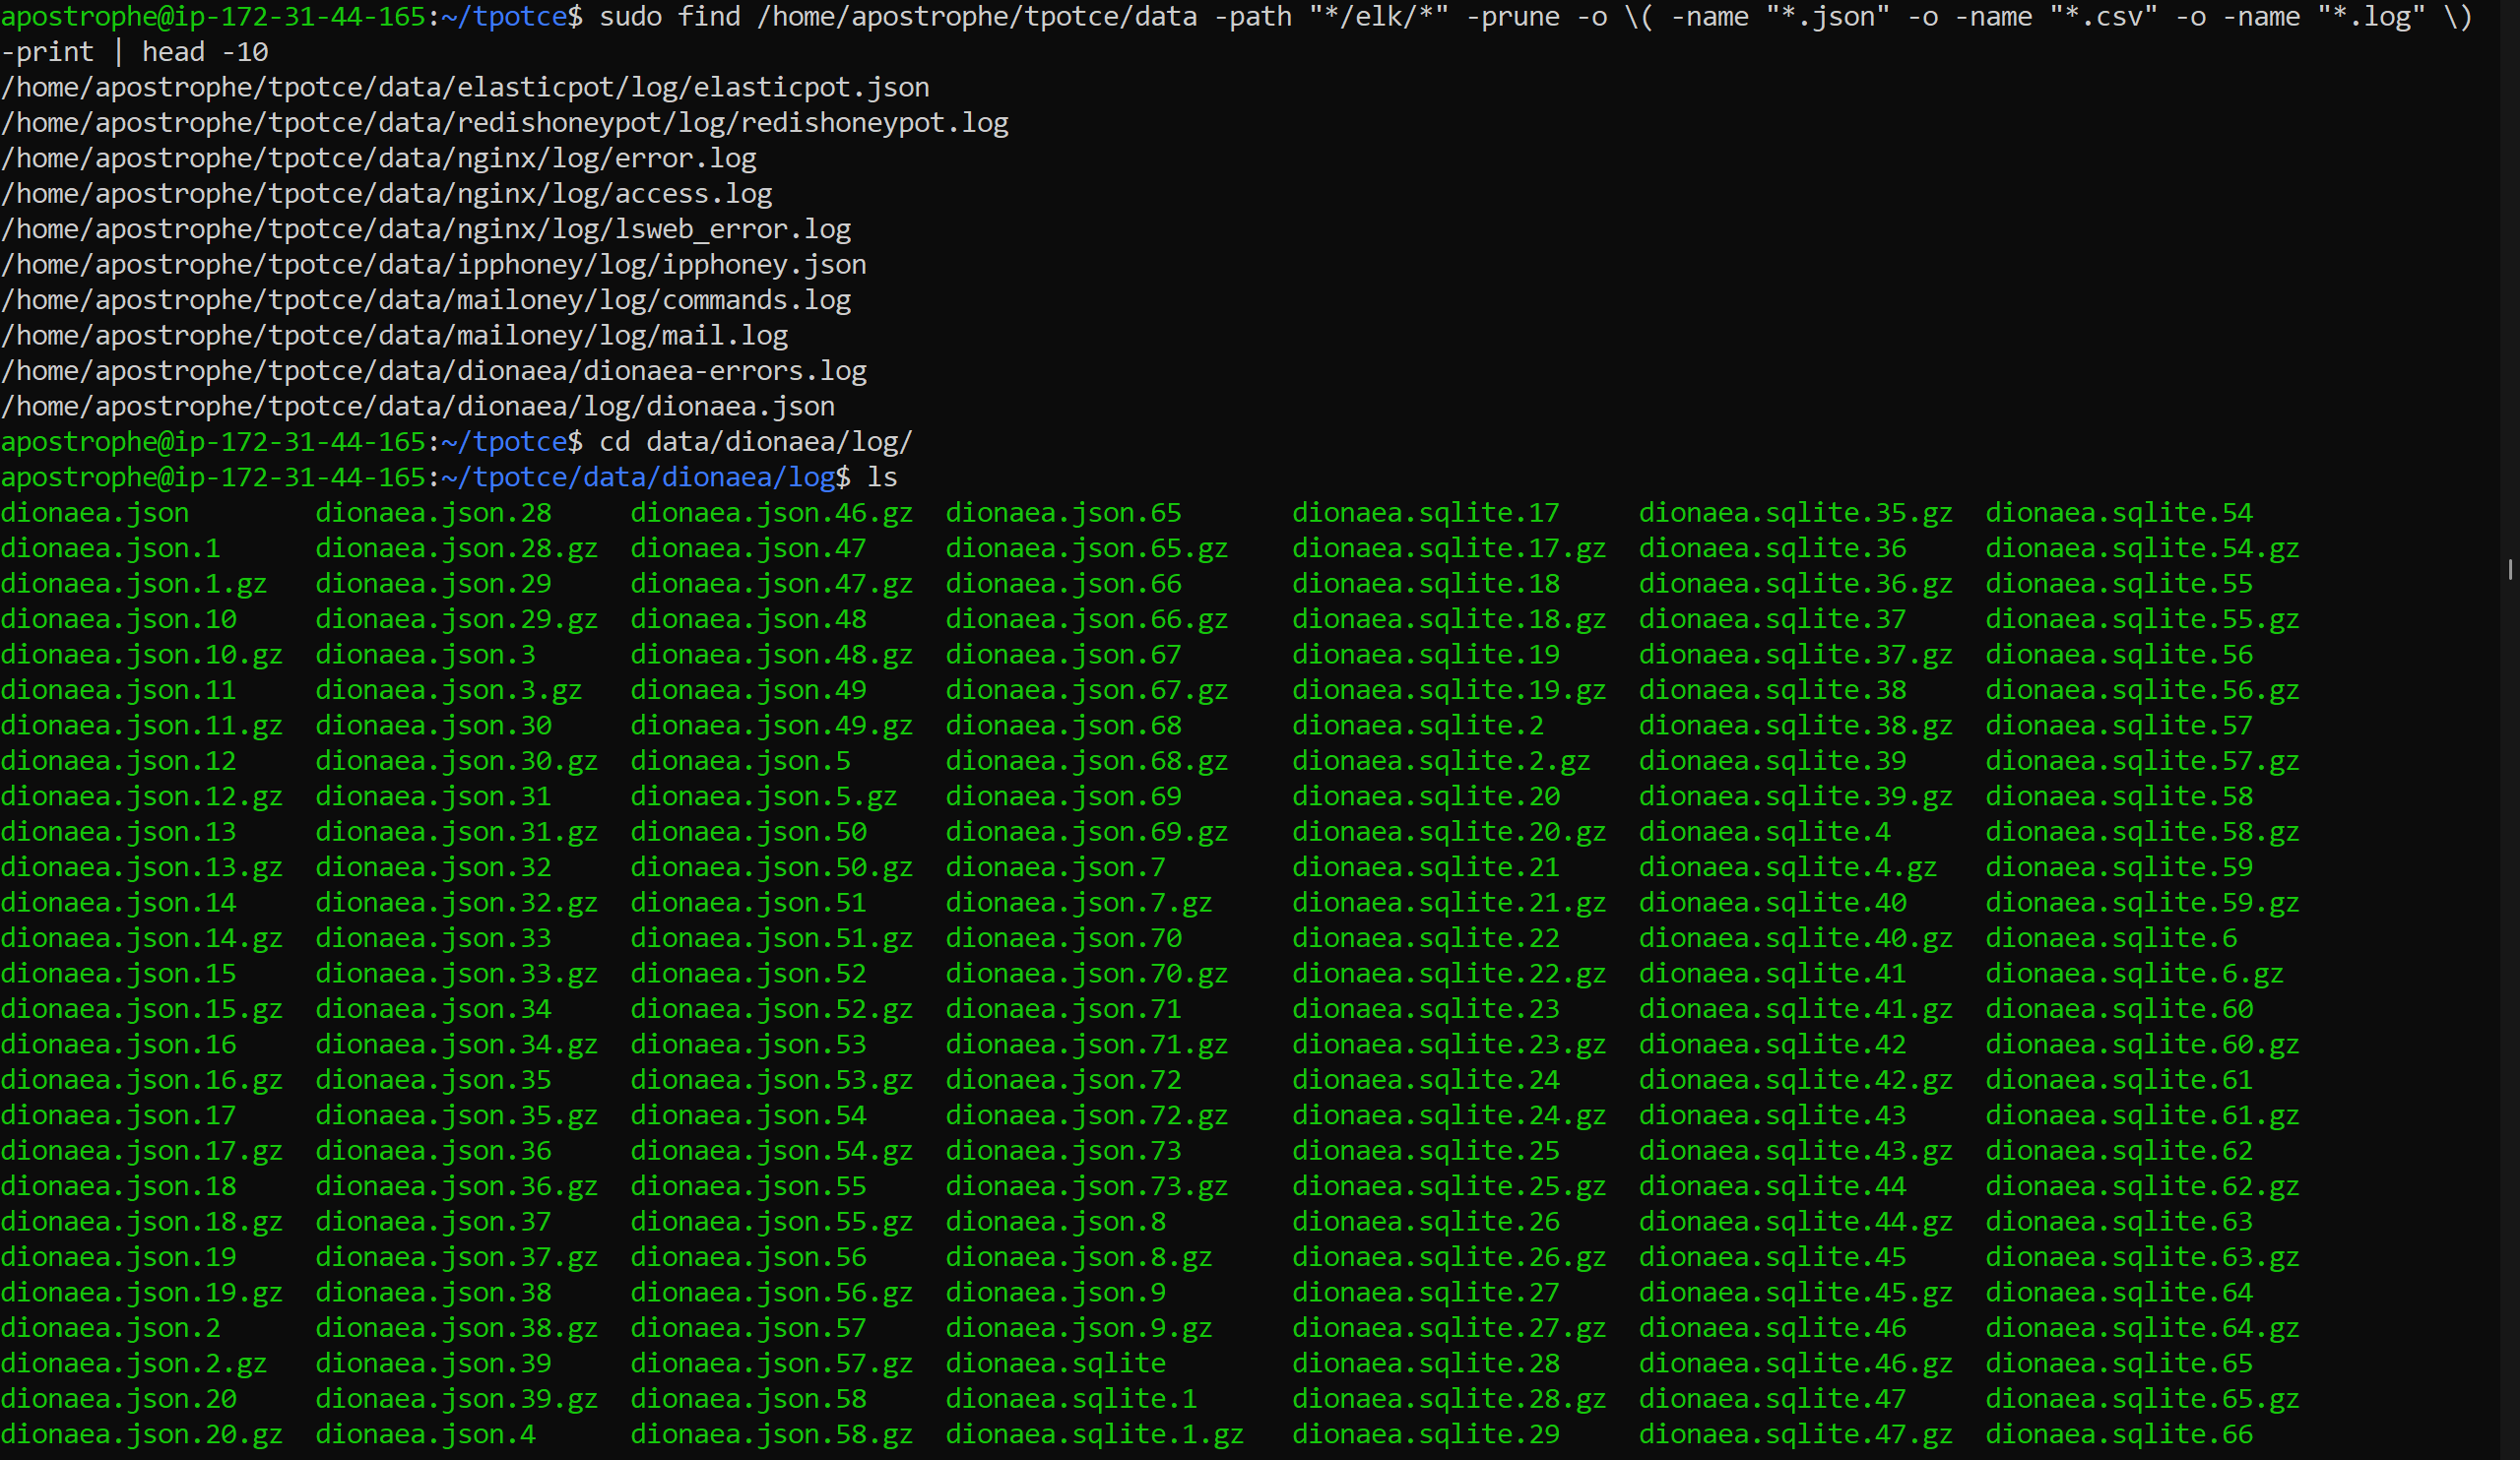
Worked.
## 6\. Splunk SIEM Setup
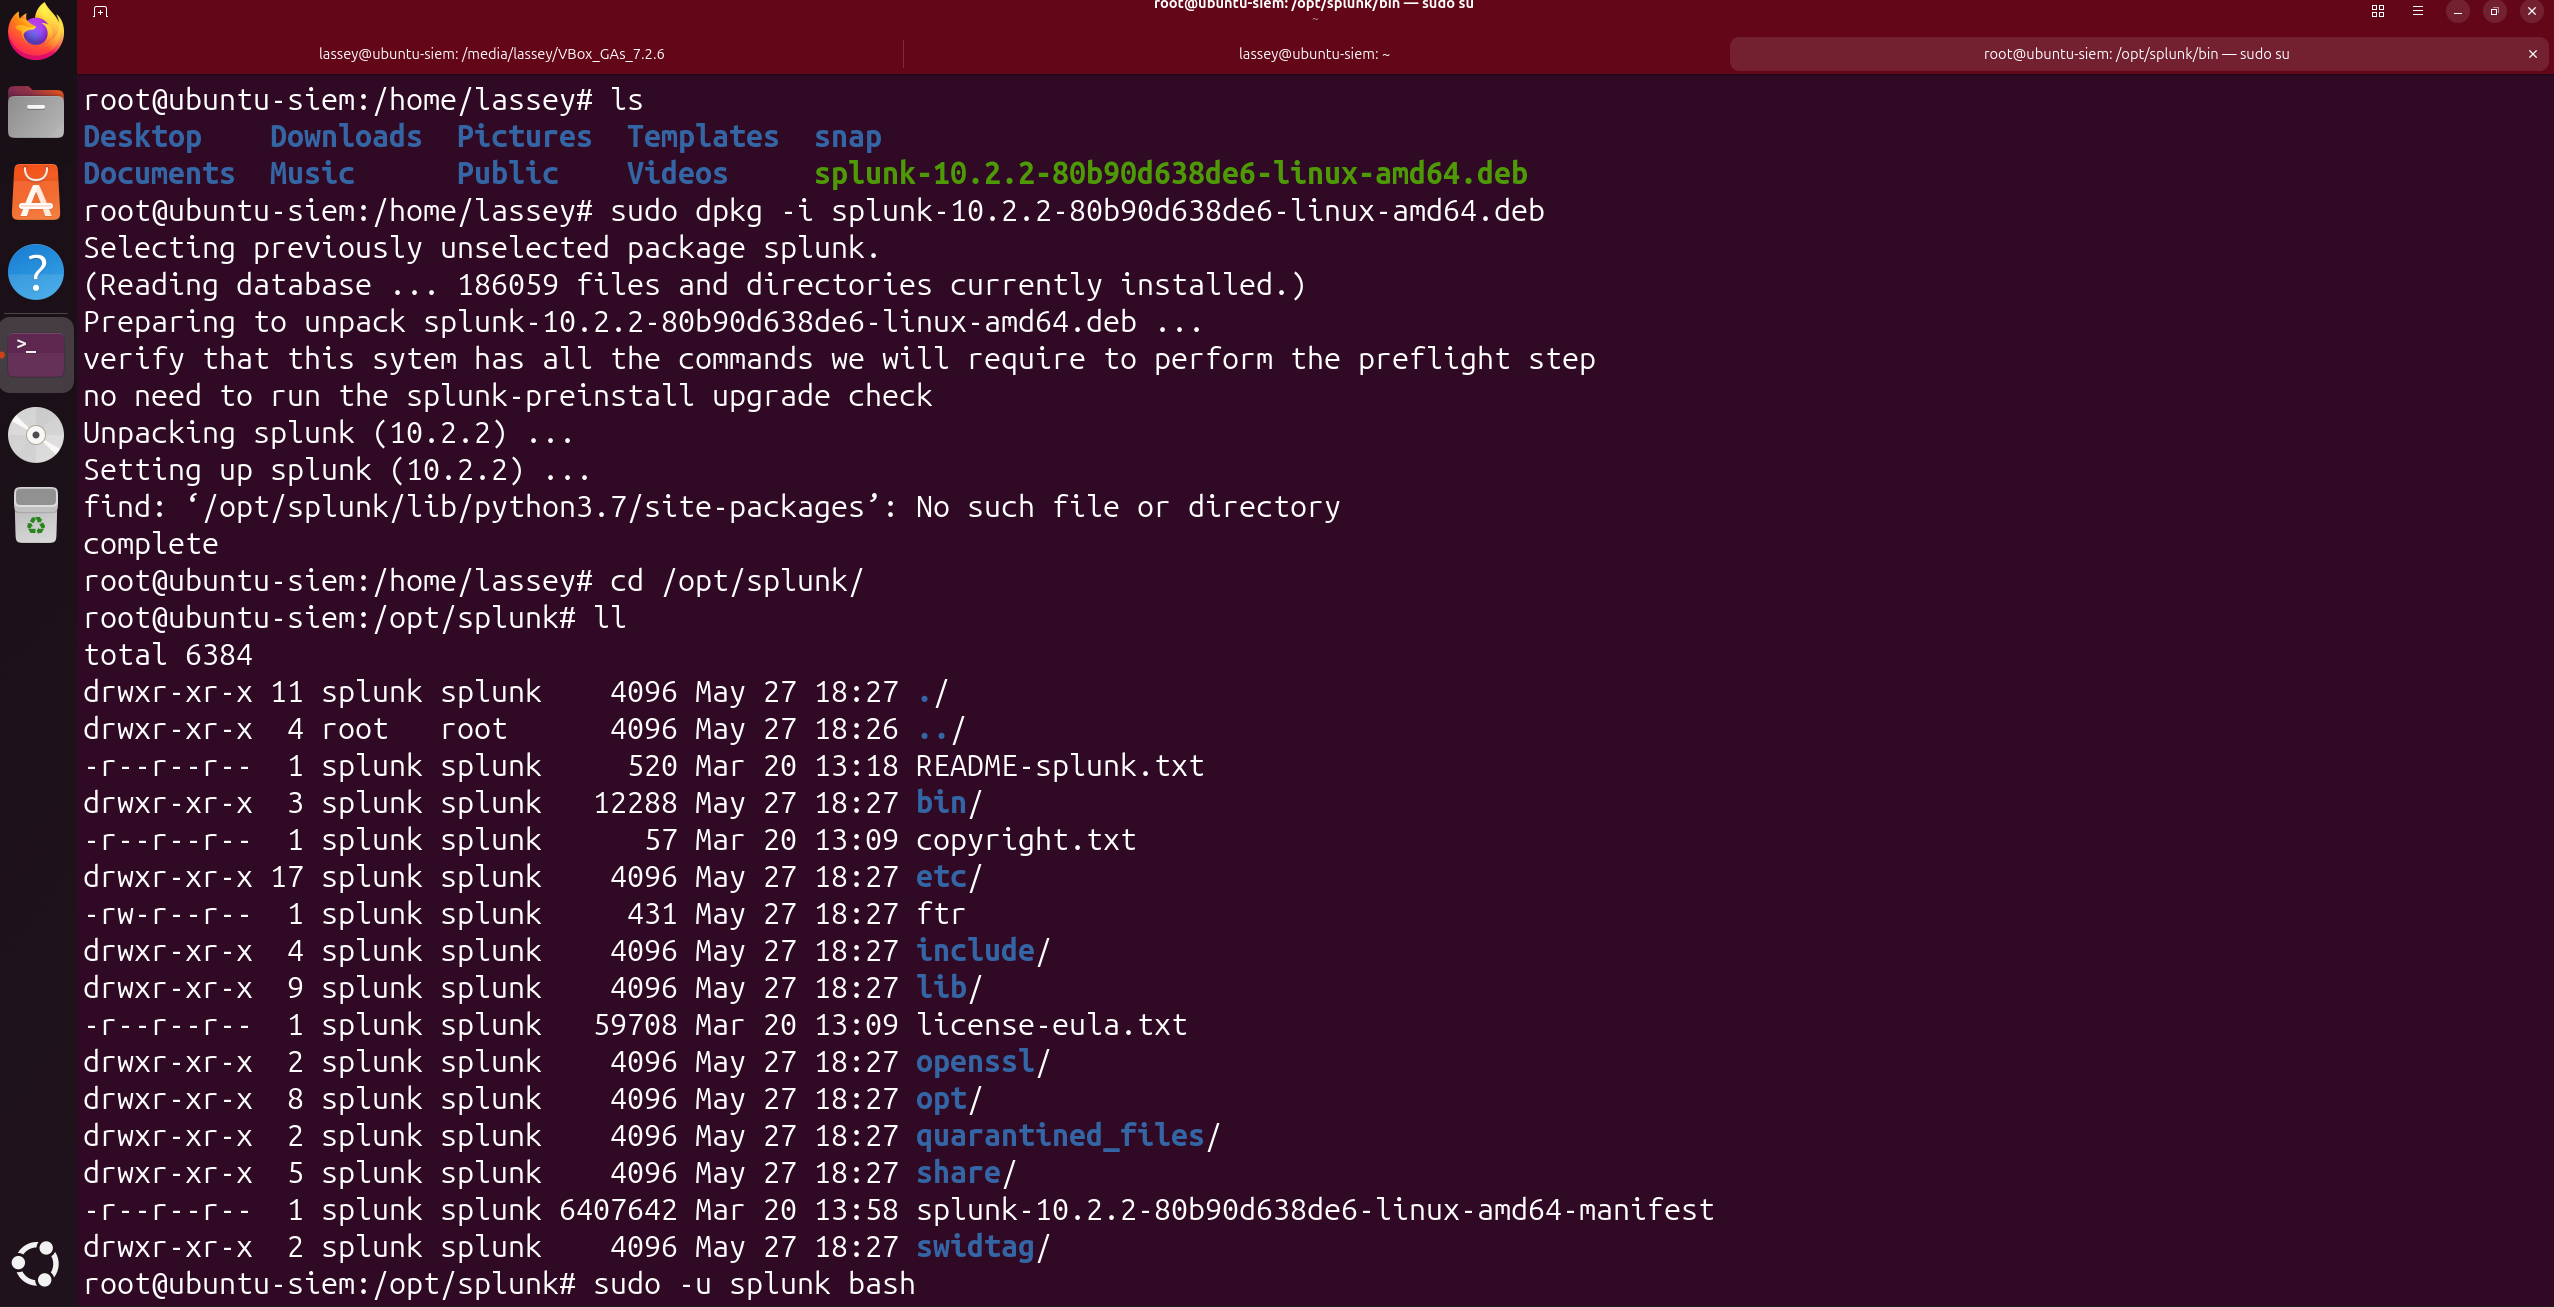
### 6.1 Installing Splunk Enterprise
Installed Splunk Enterprise on my local VM using the `.deb` package:
sudo dpkg -i splunk*.deb
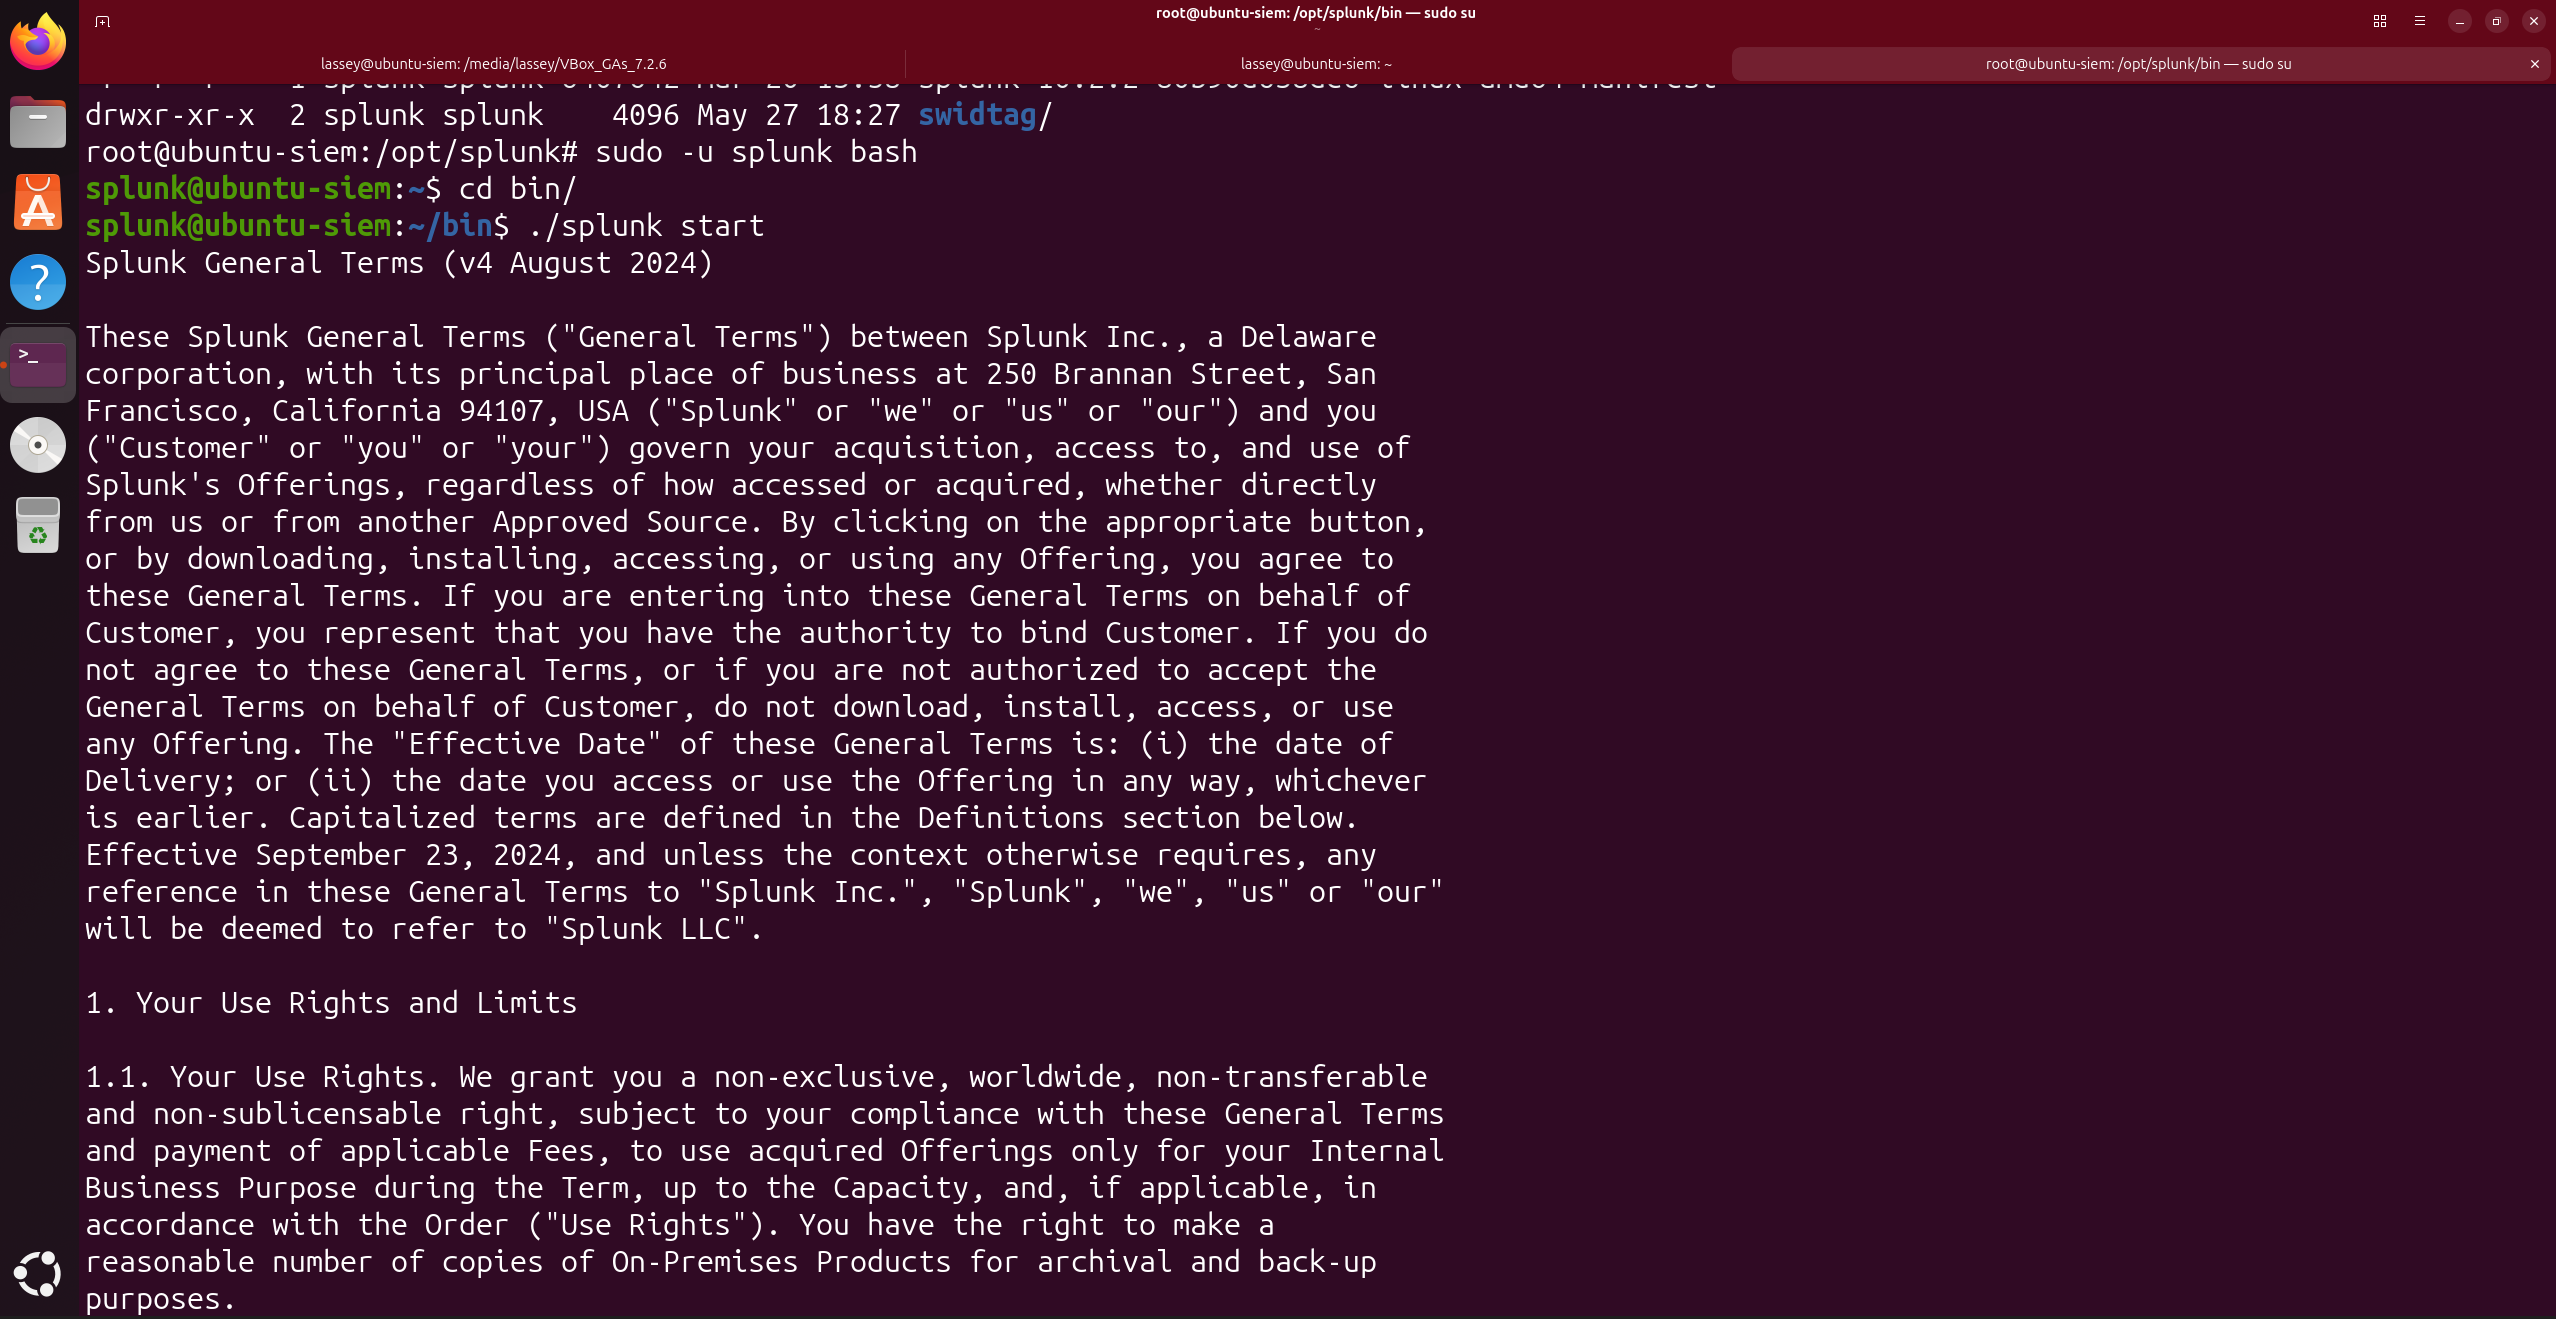
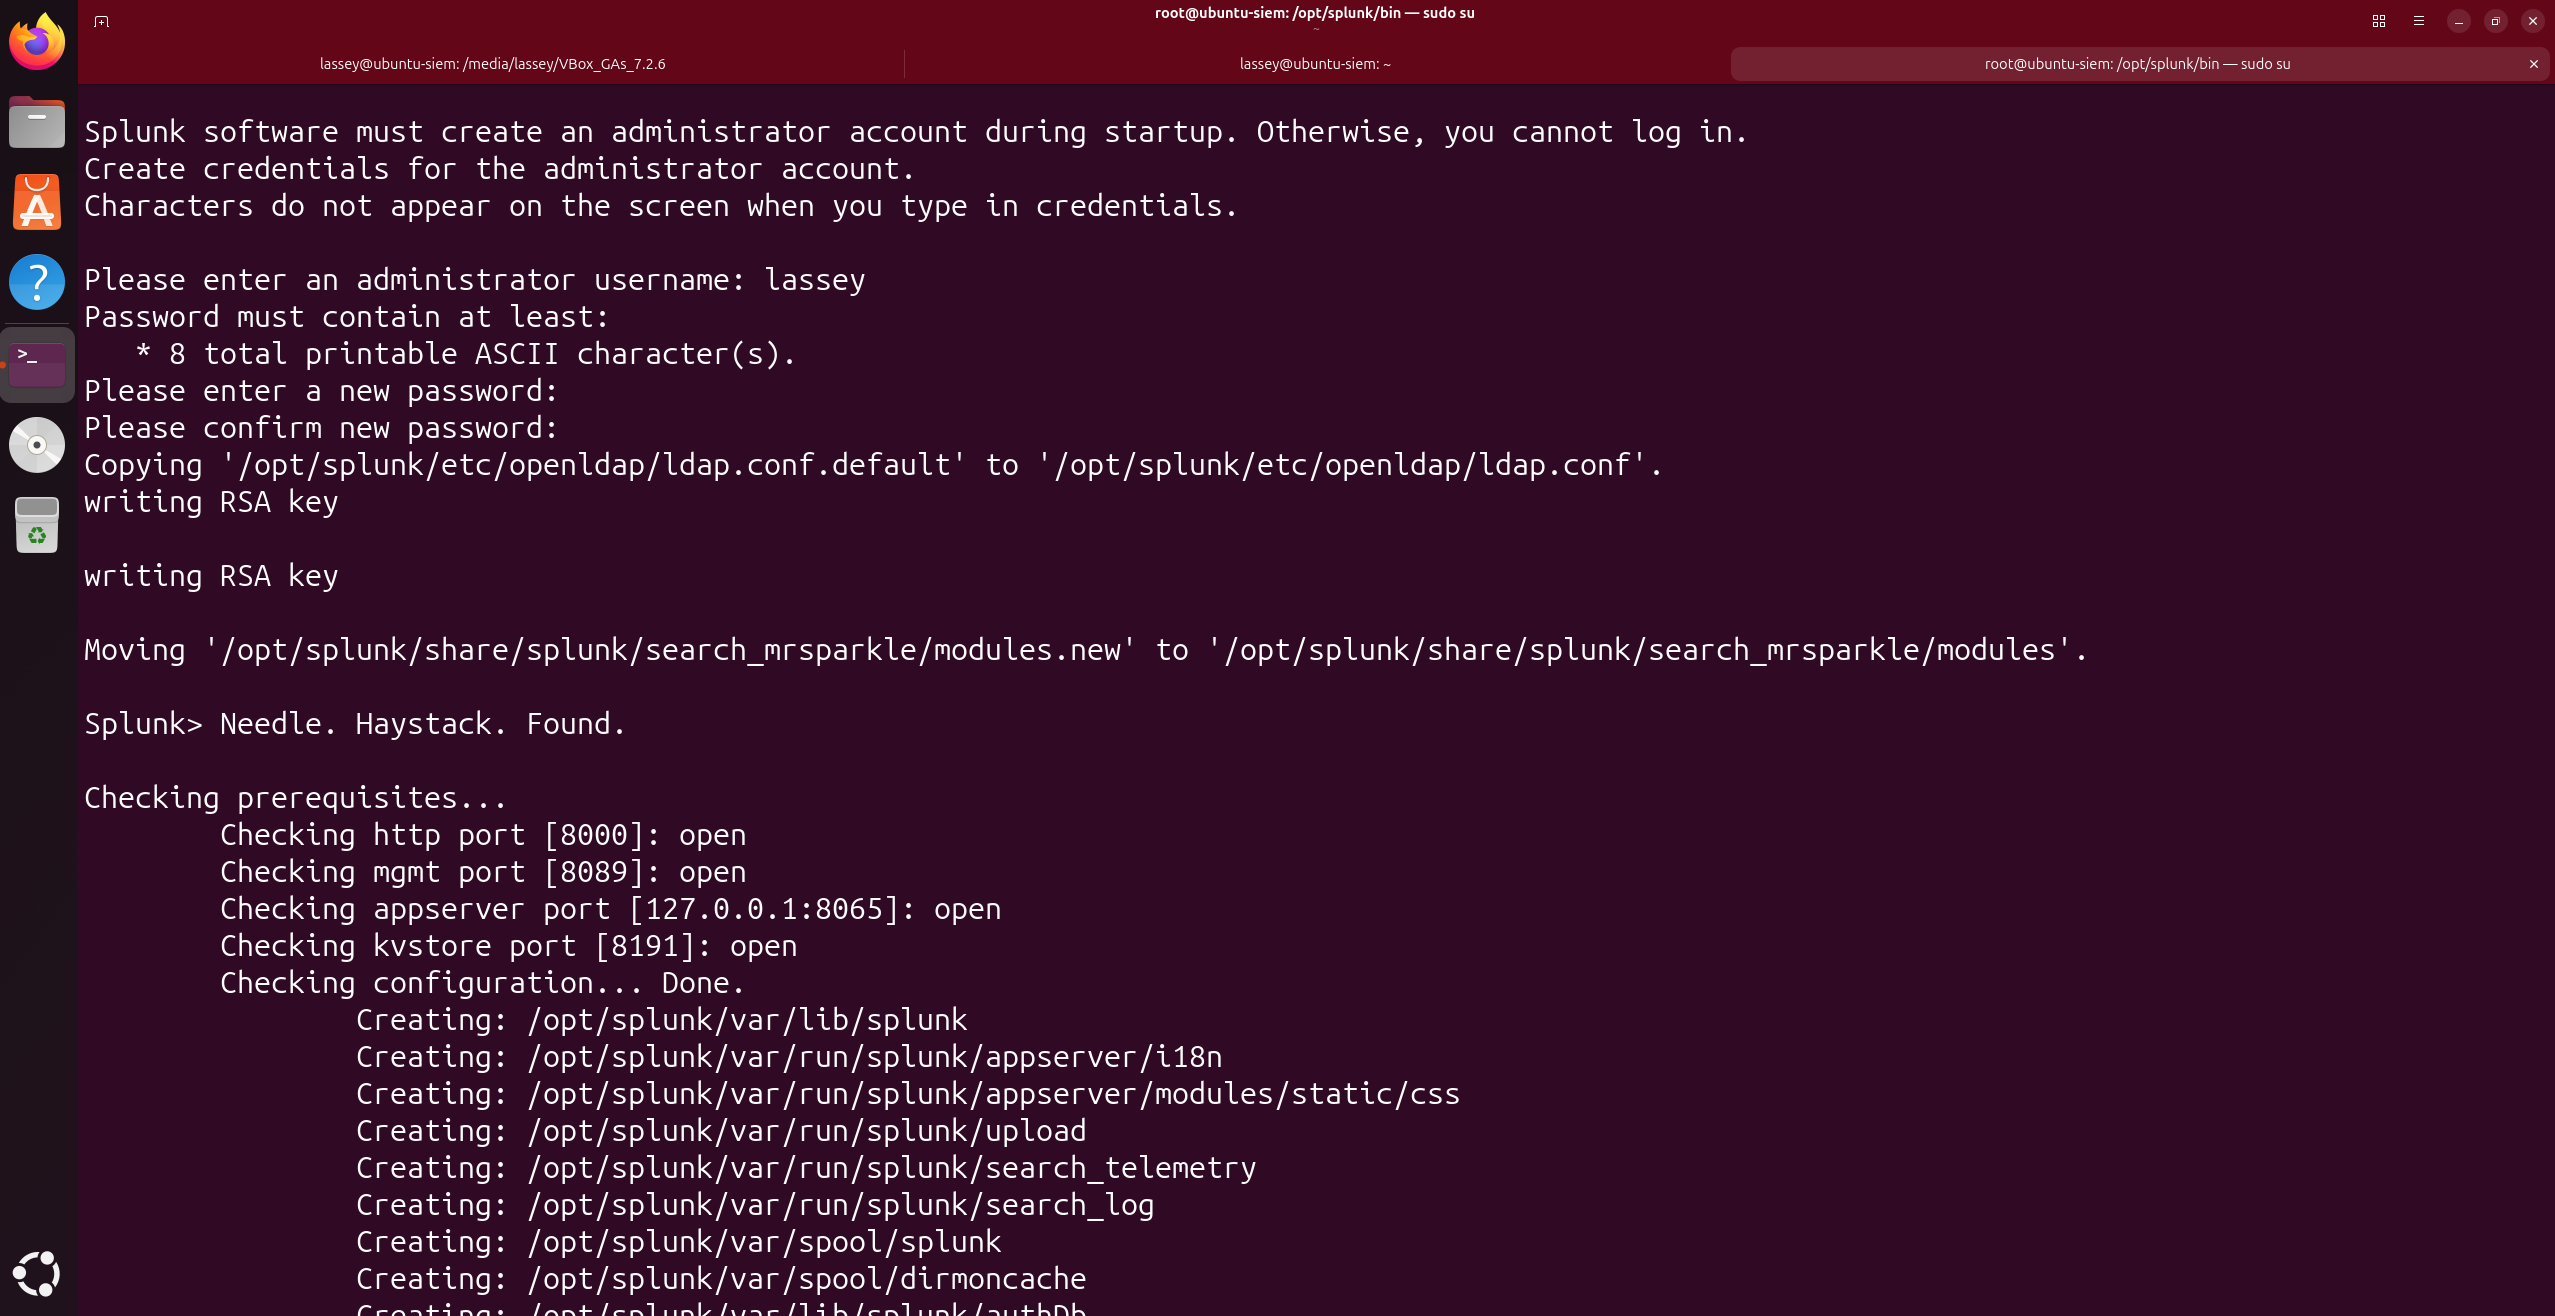
cd /opt/splunk
sudo -u splunk ./bin/splunk start
   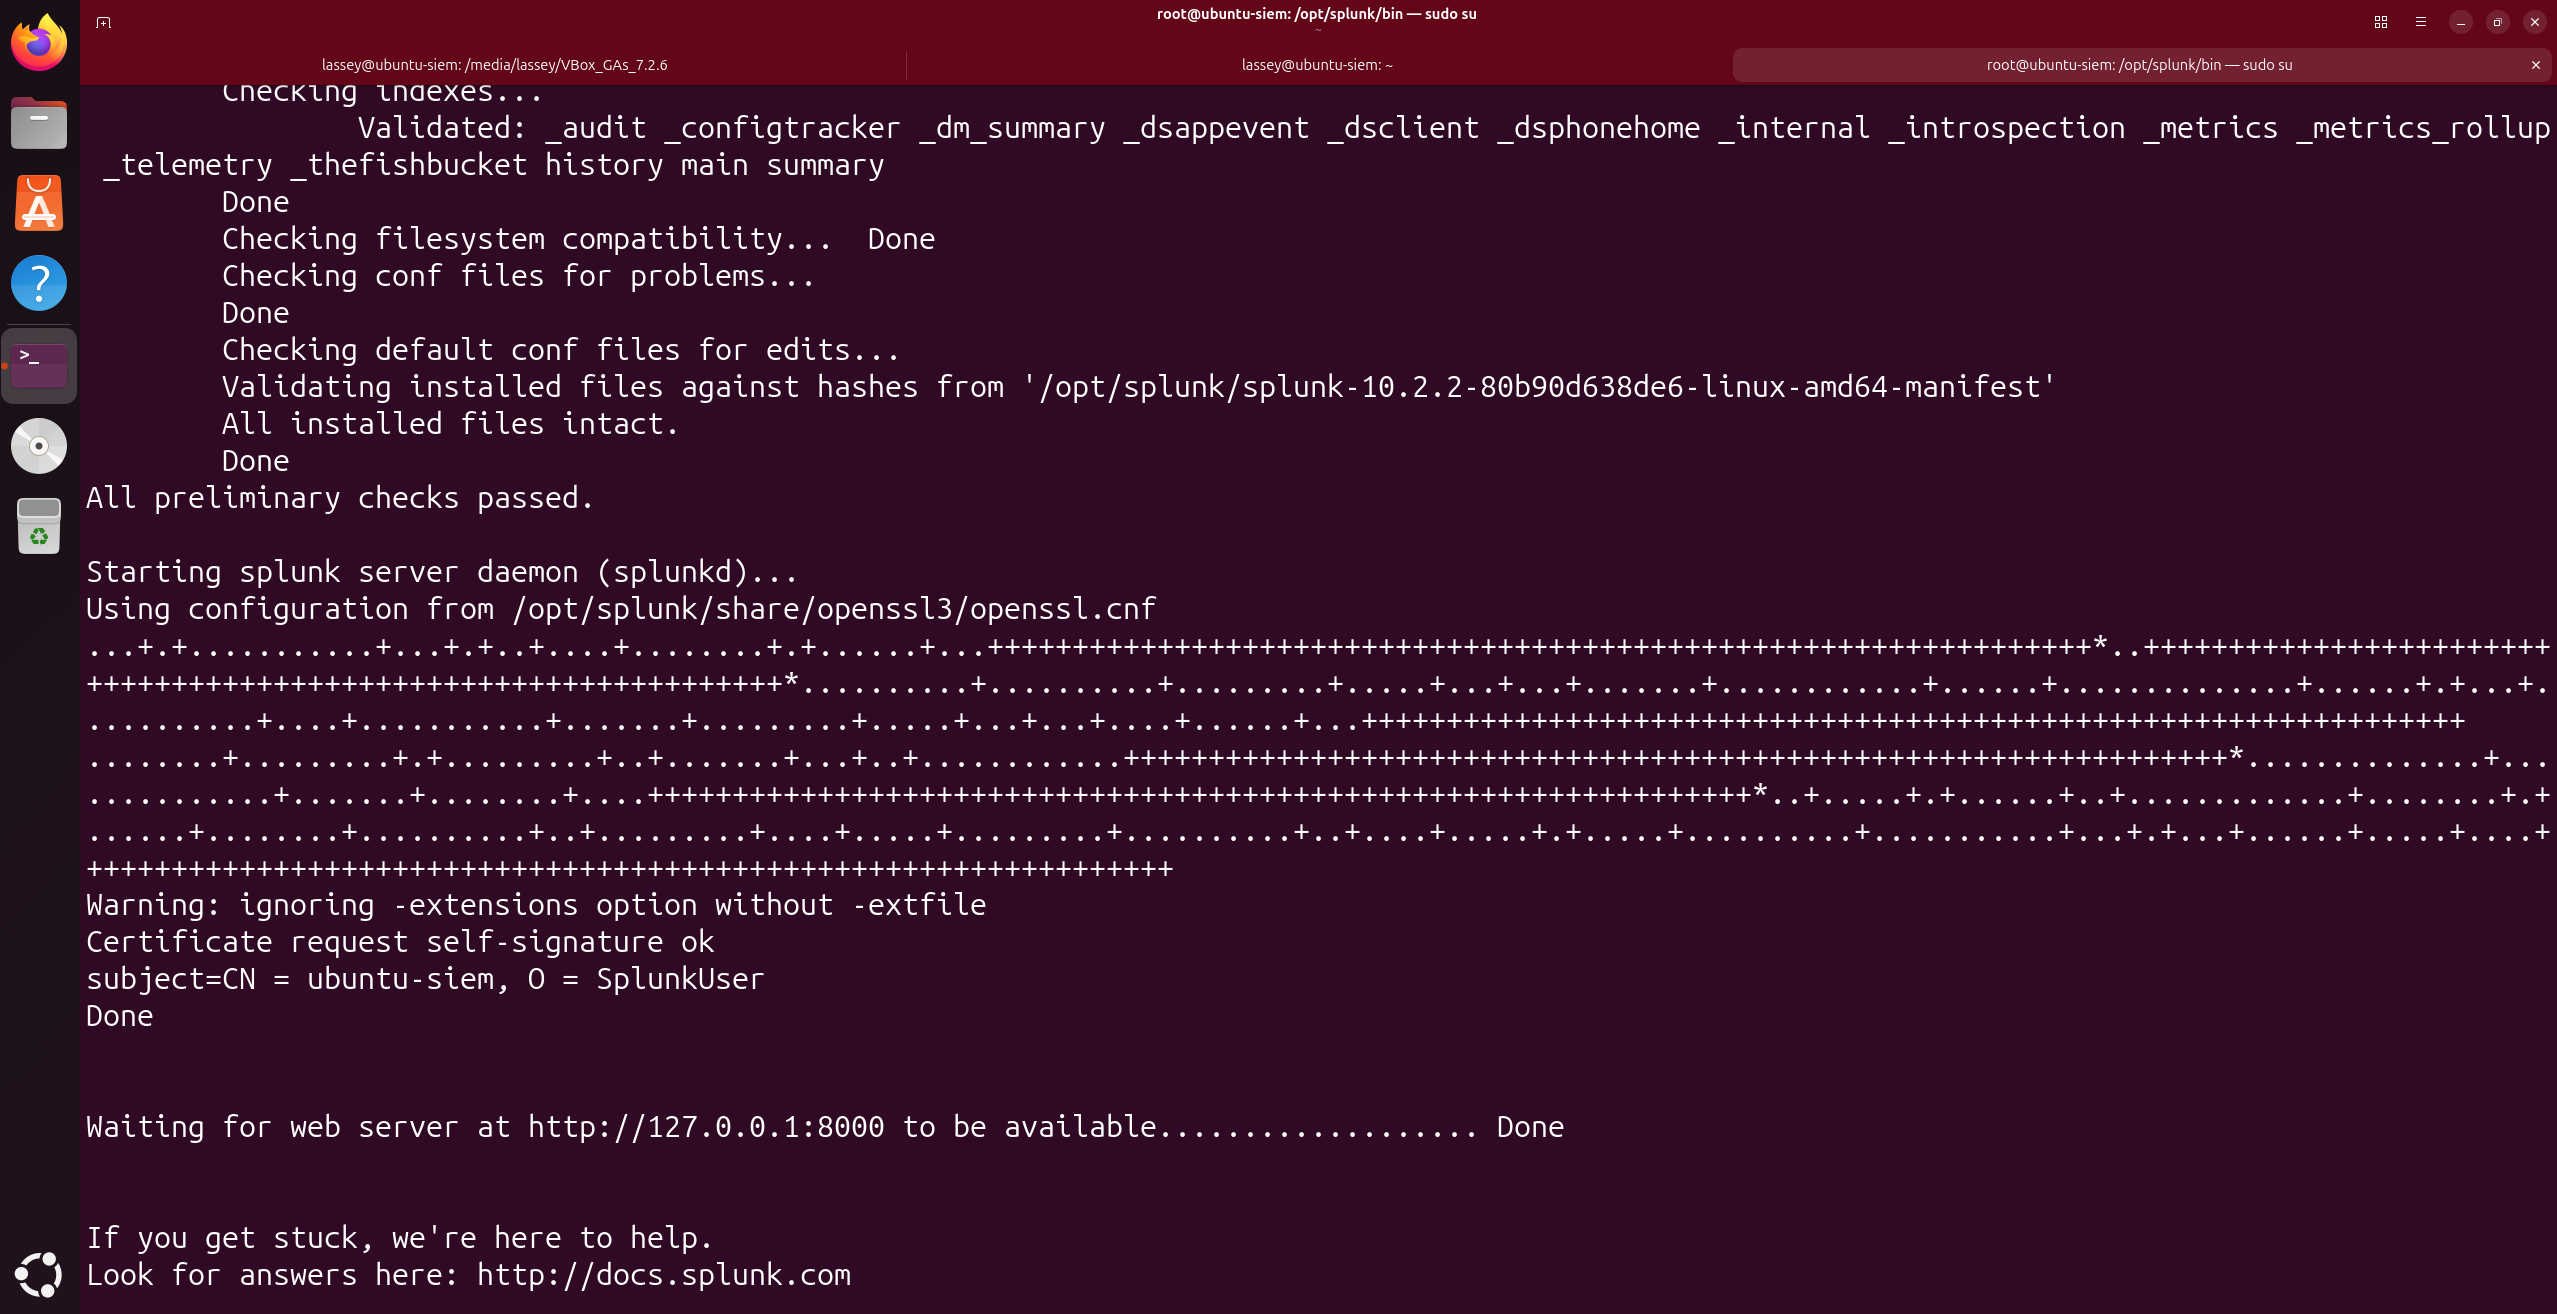
Enabled Splunk to start automatically on boot:
sudo /opt/splunk/bin/splunk enable boot-start -user splunk
sudo systemctl enable Splunk
sudo systemctl start Splunk
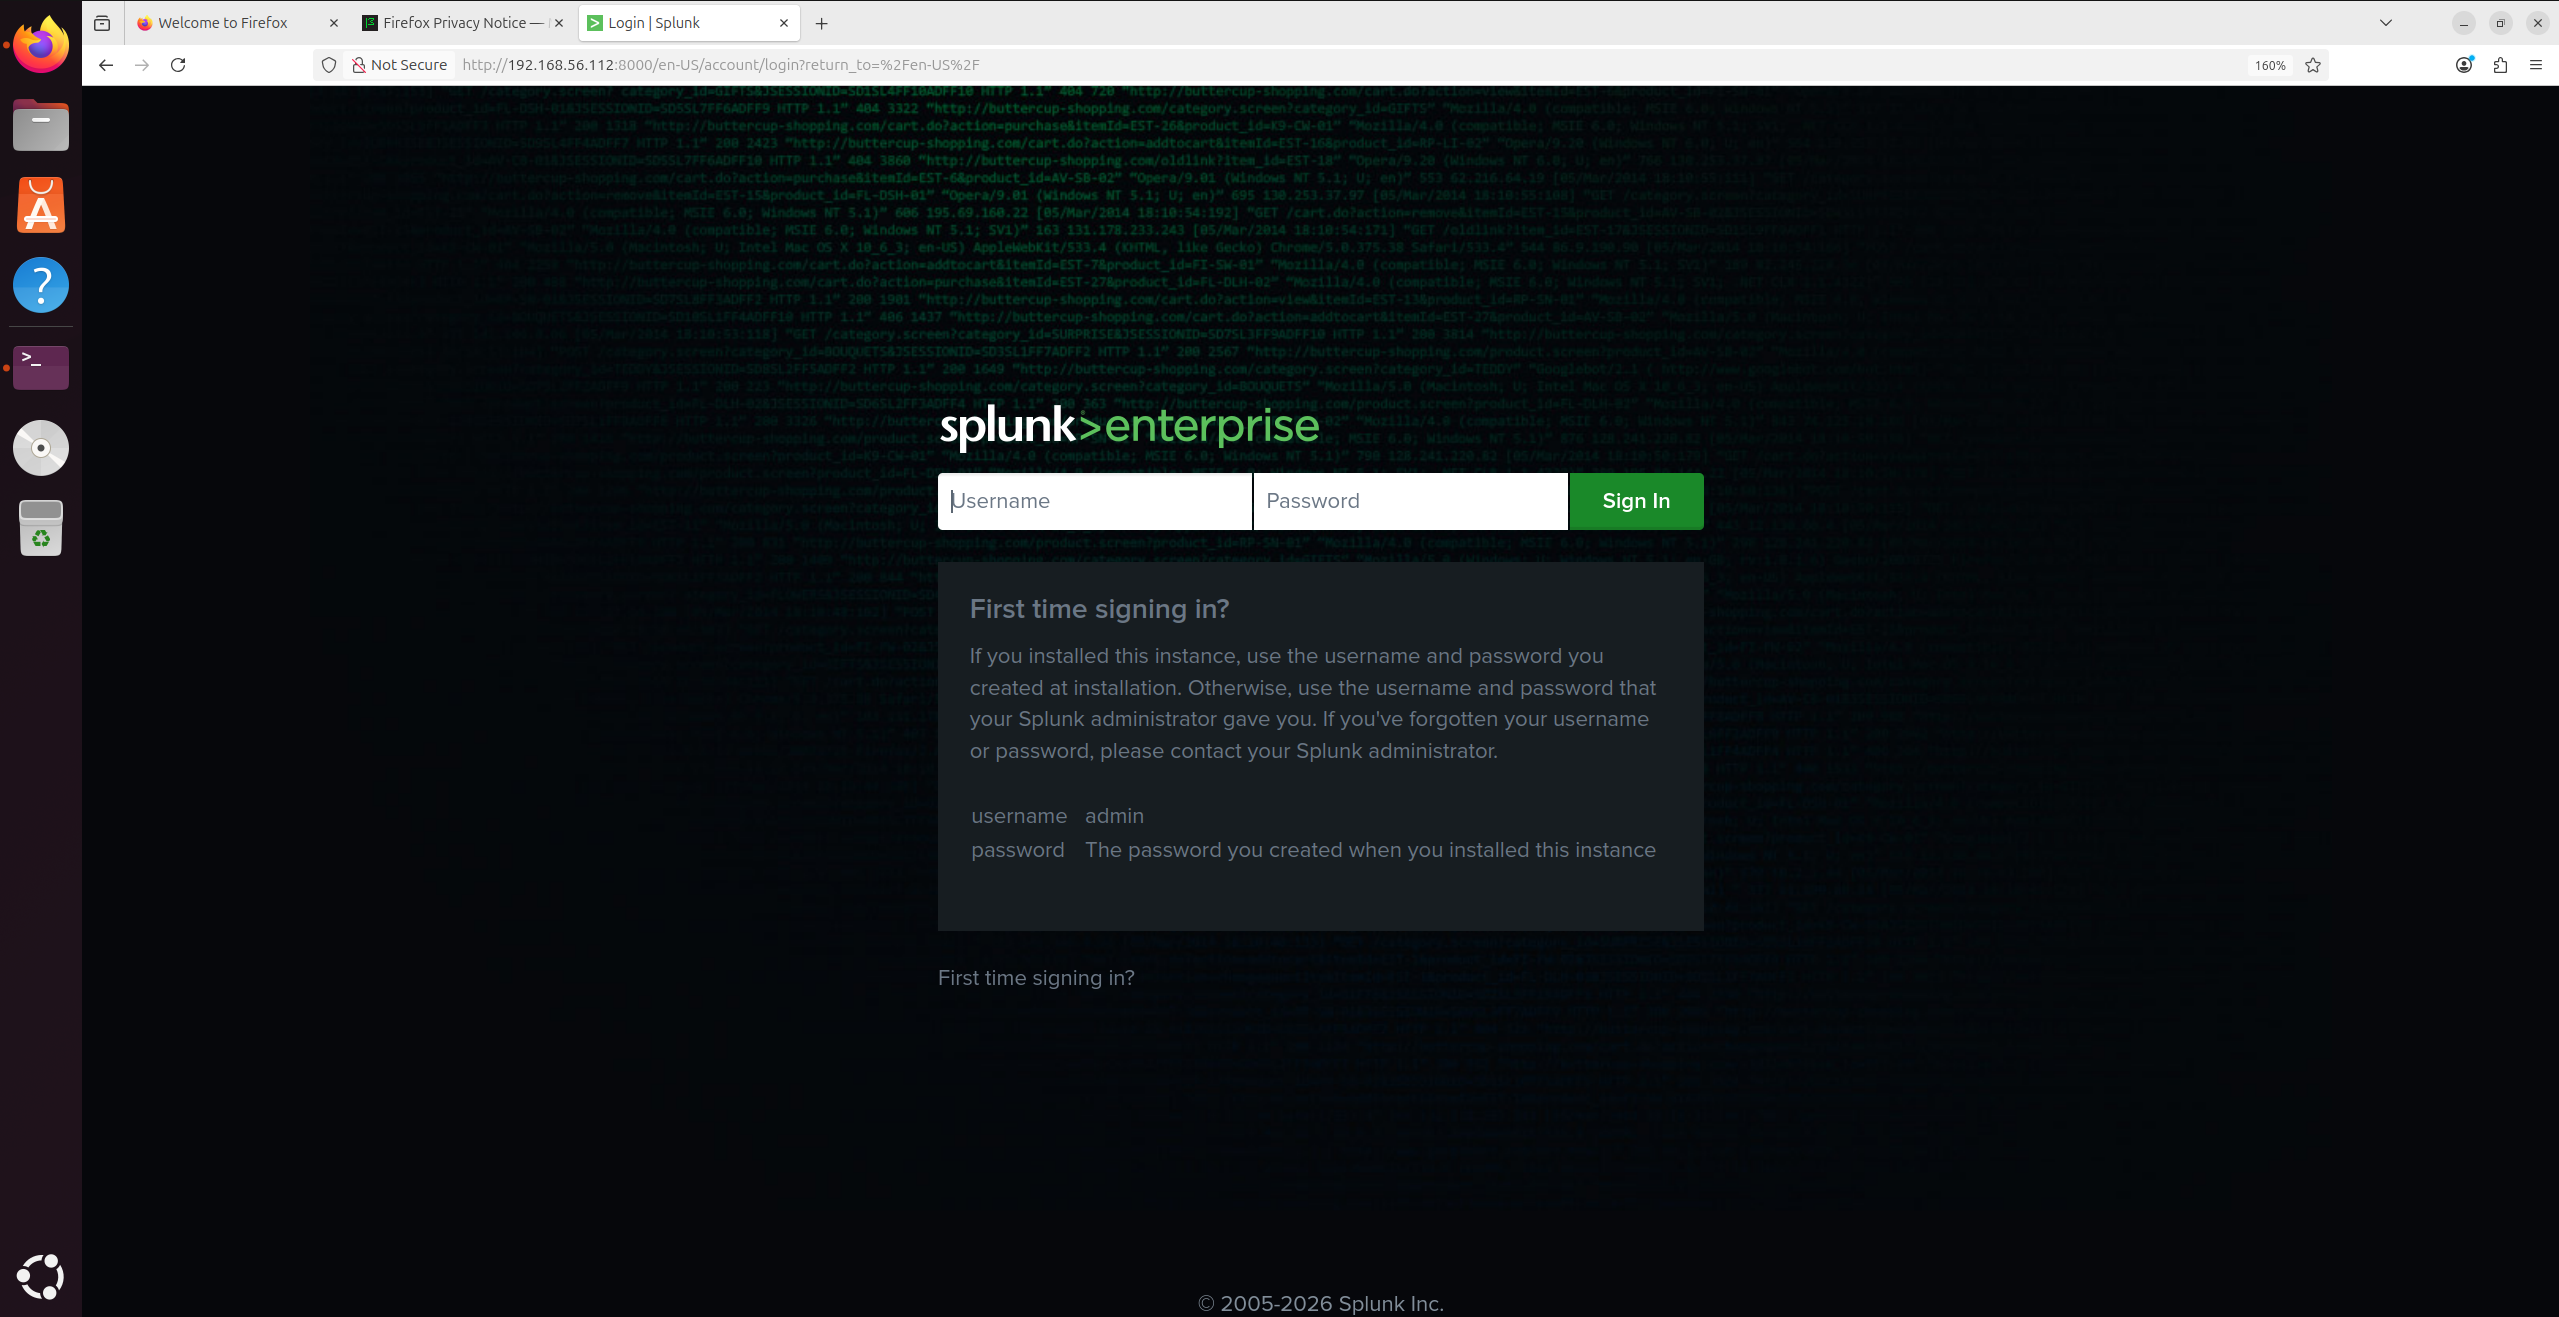
Verified it was running at `http://localhost:8000`.
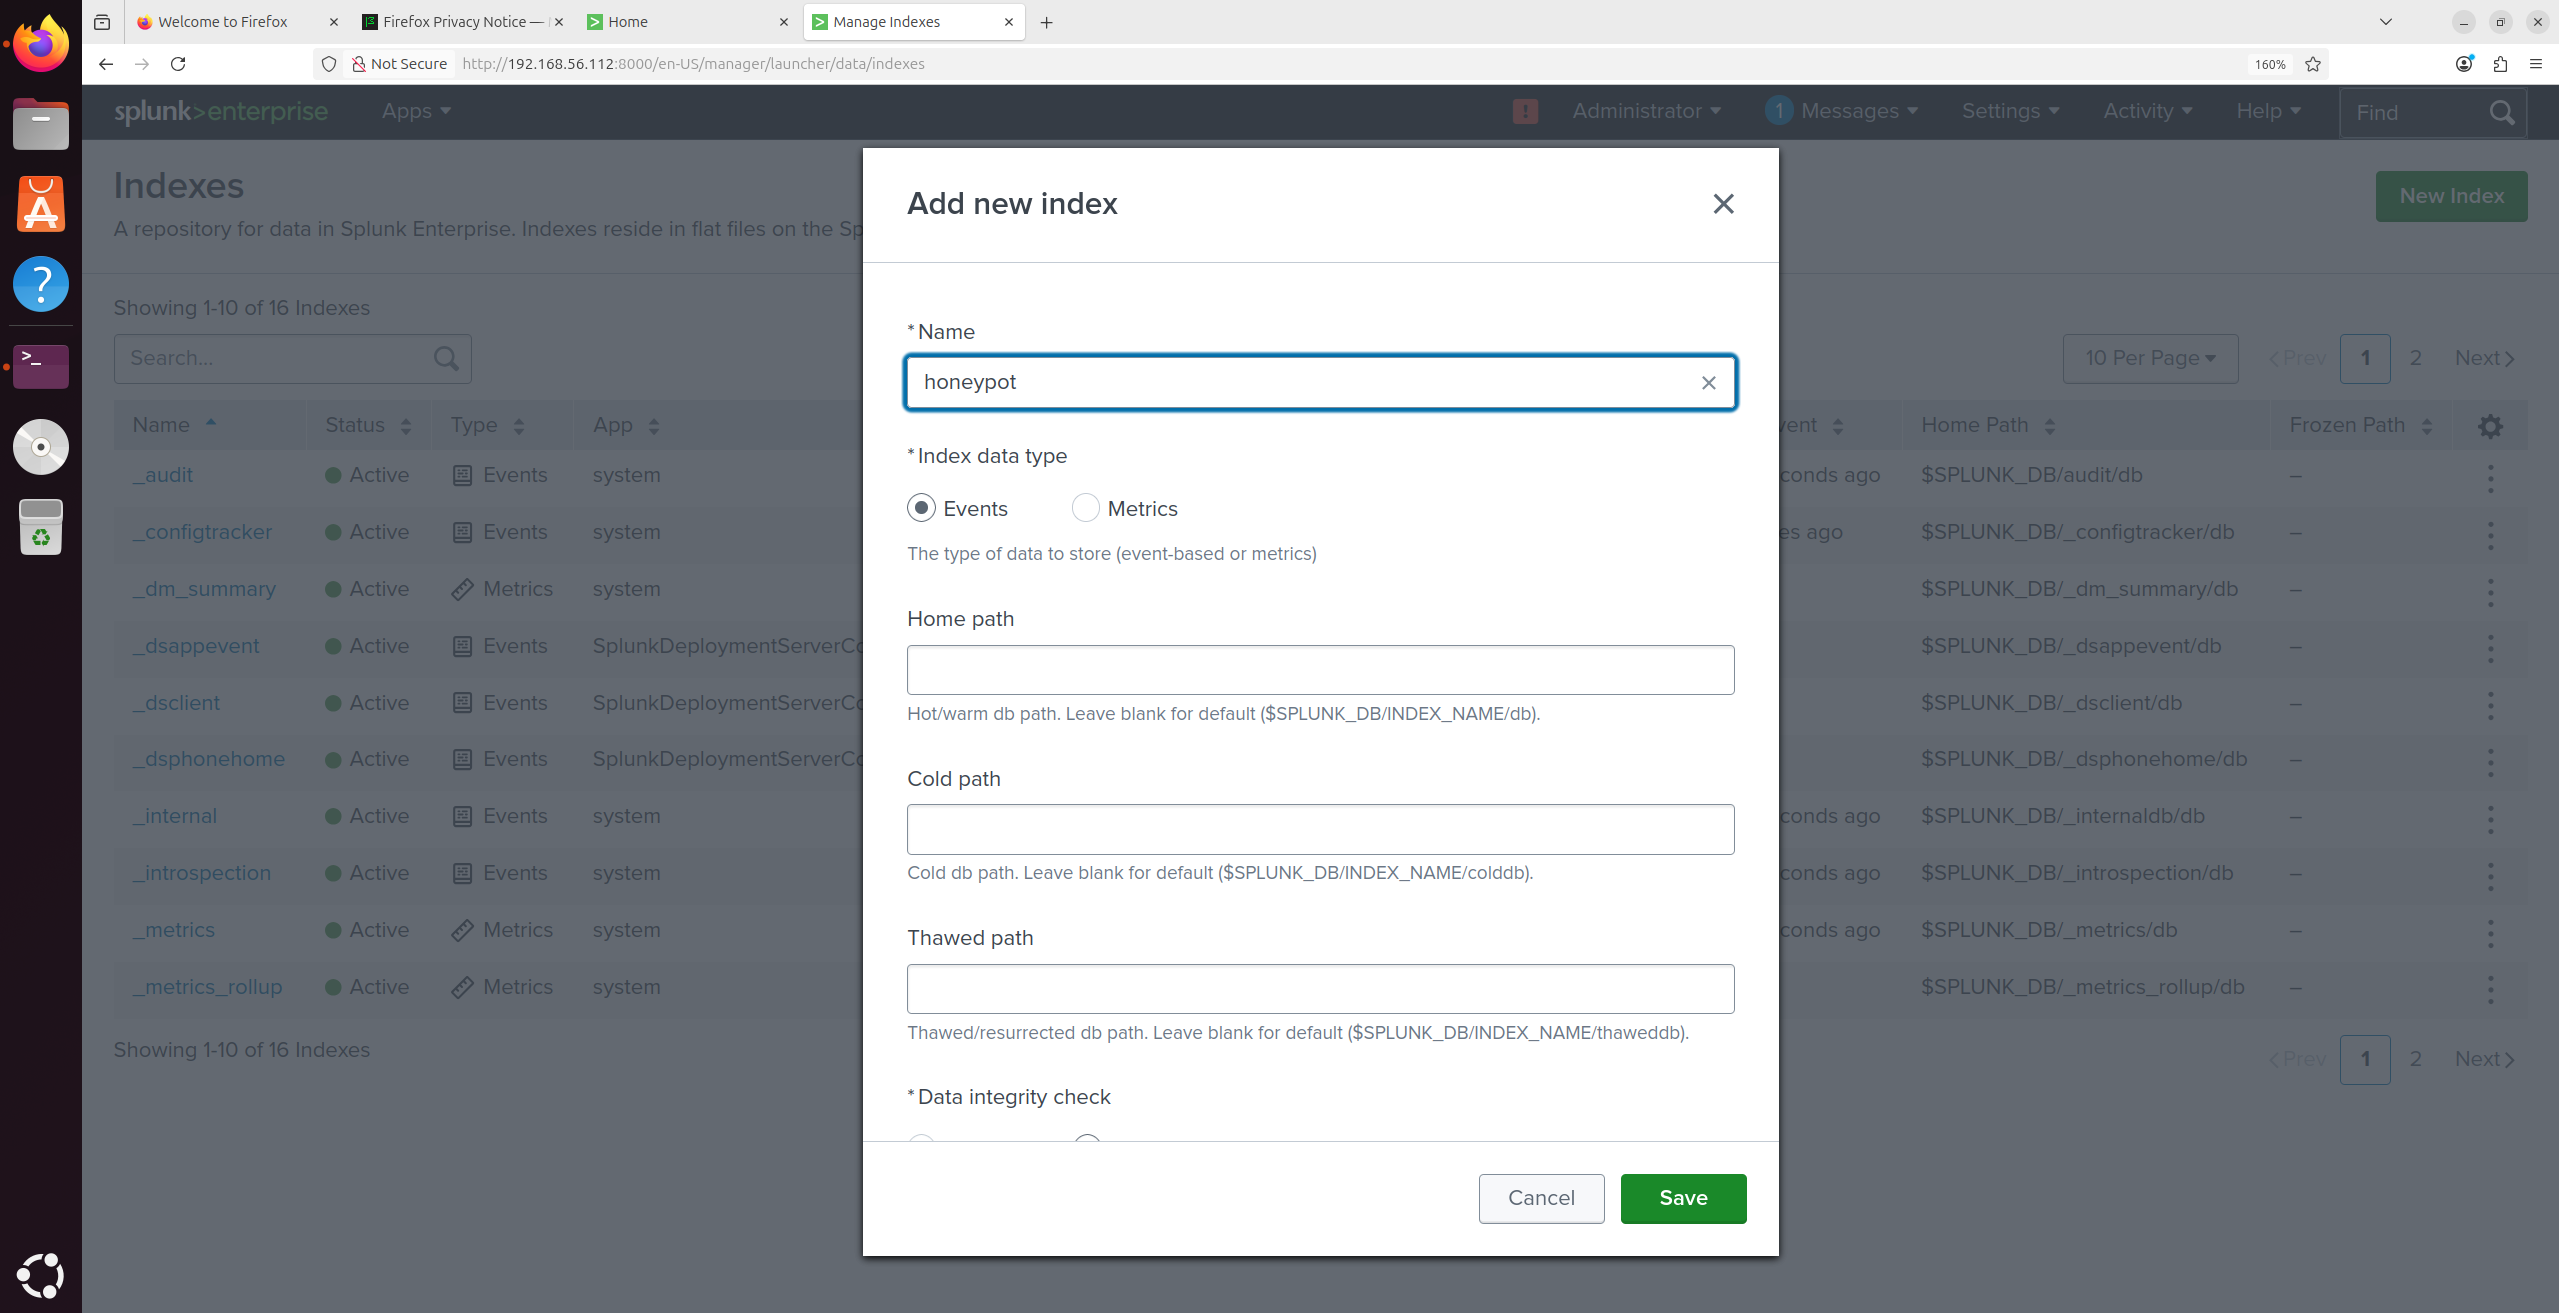
### 6.2 Creating the Honeypot Index
In the Splunk web UI:
Settings > Indexes > New Index
| Setting | Value |
| --- | --- |
| Index Name | `honeypot` |
Then configured Splunk to receive forwarded data:
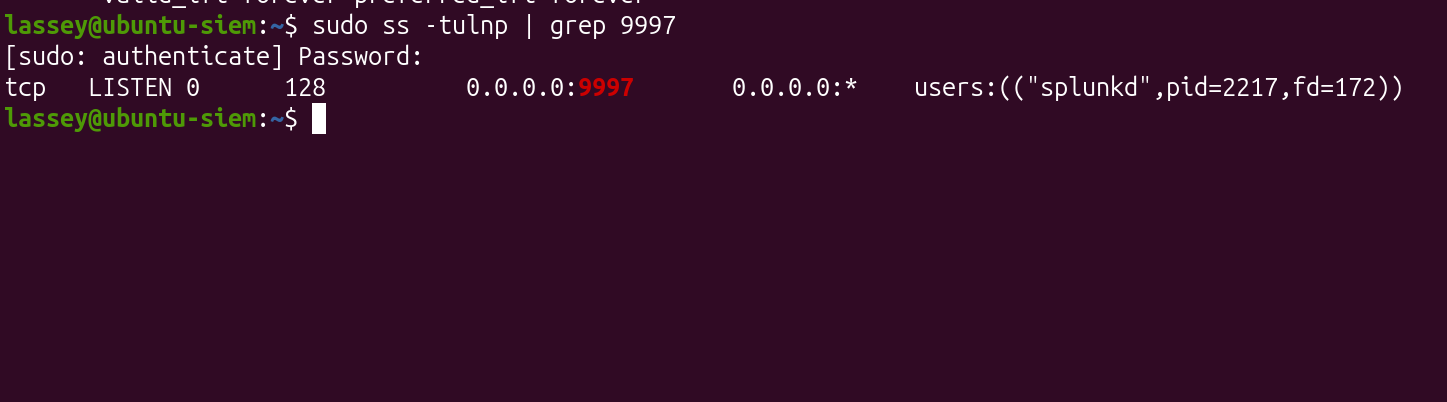
Settings > Forwarding and Receiving > Configure Receiving > New Receiving Port: **9997**
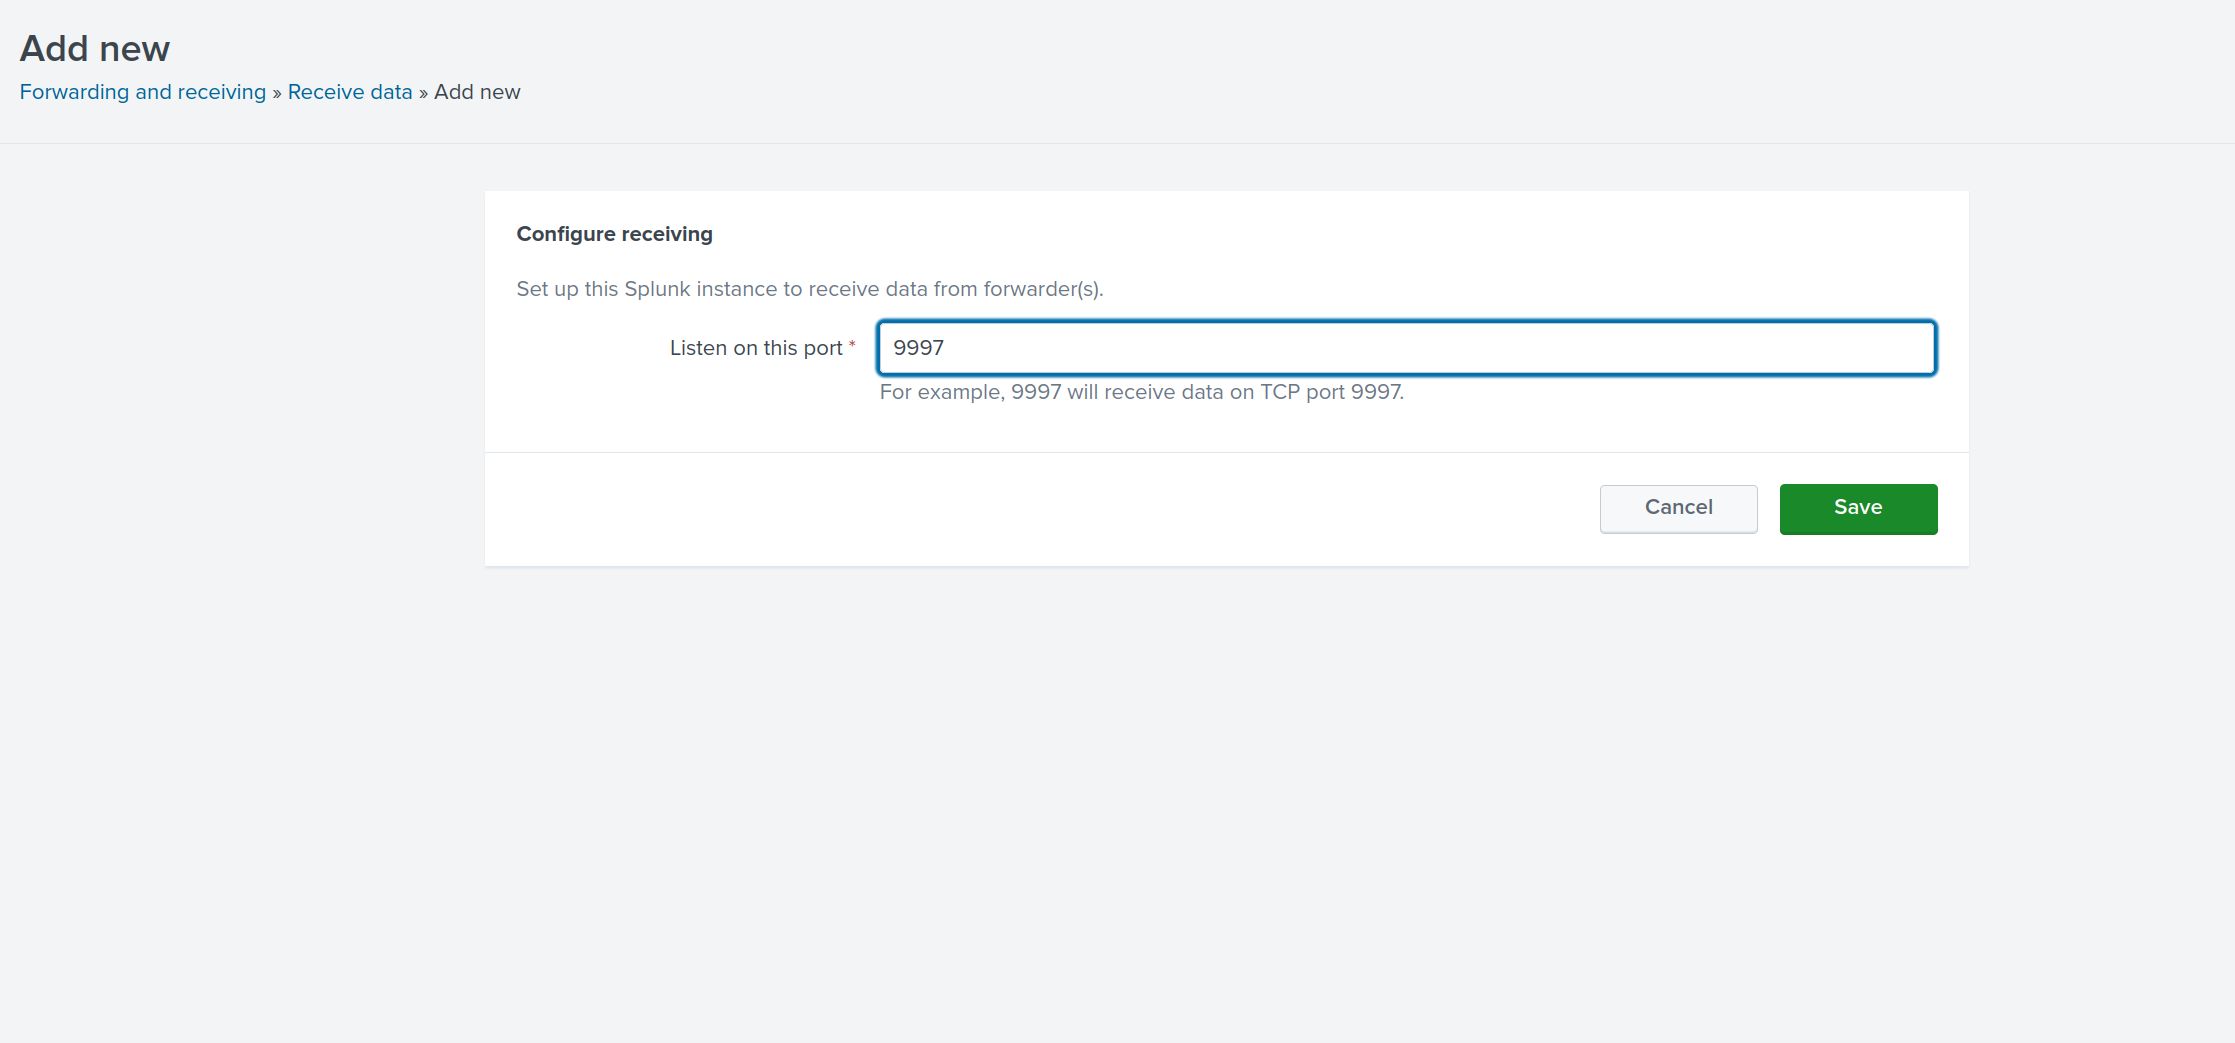
Verified Splunk was listening:
sudo netstat -tlnp | grep 9997
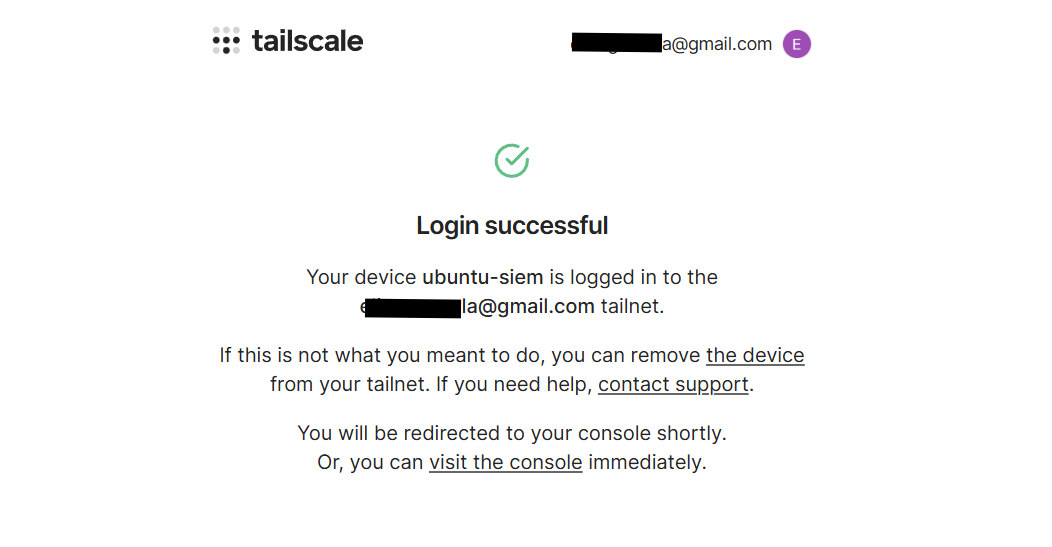
## 7\. Tailscale Network Setup
Rather than opening a Splunk port to the internet or running a full VPN, I used **Tailscale** to create a private mesh network between the EC2 instance and my local VM. The forwarder sends to the EC2's Tailscale IP, no public exposure of Splunk at all.
Installed Tailscale on both machines:
curl -fsSL https://tailscale.com/install.sh | sh
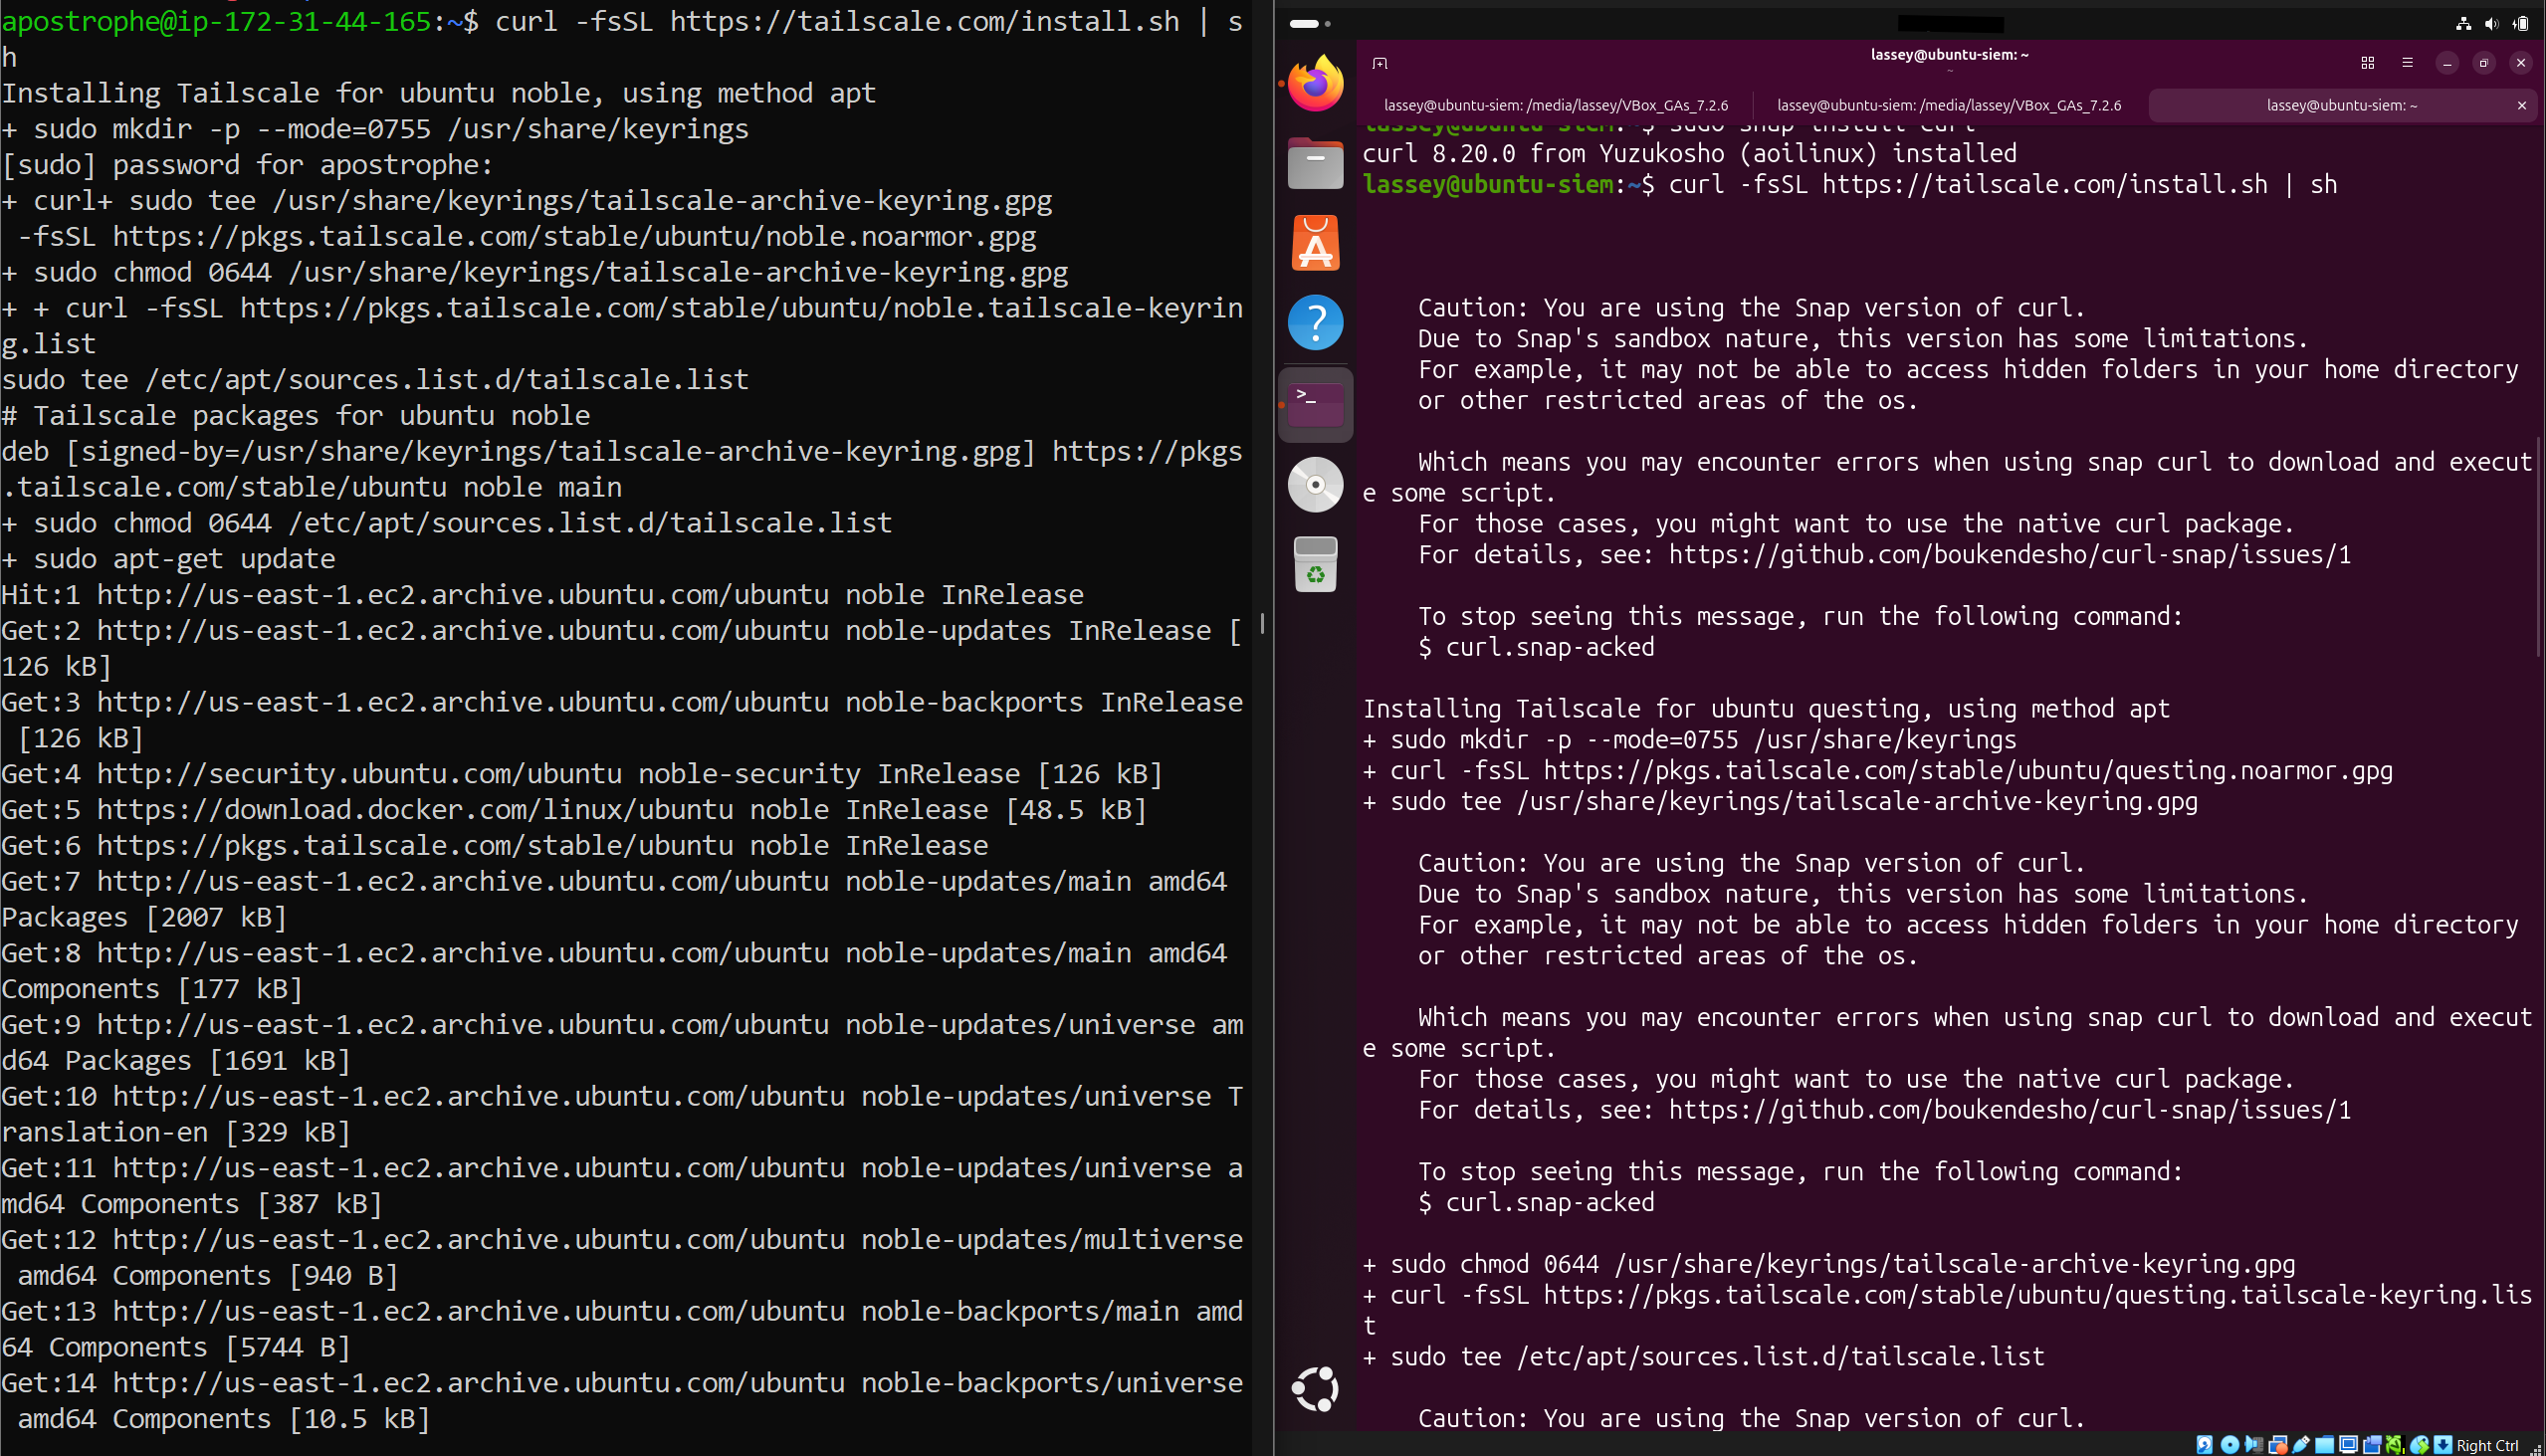
sudo tailscale up
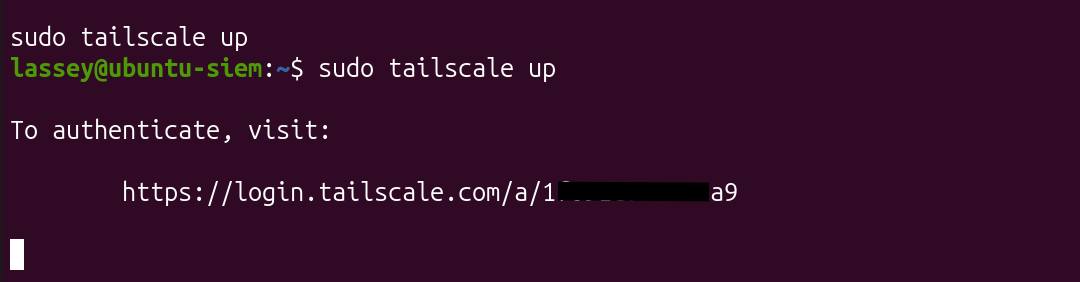
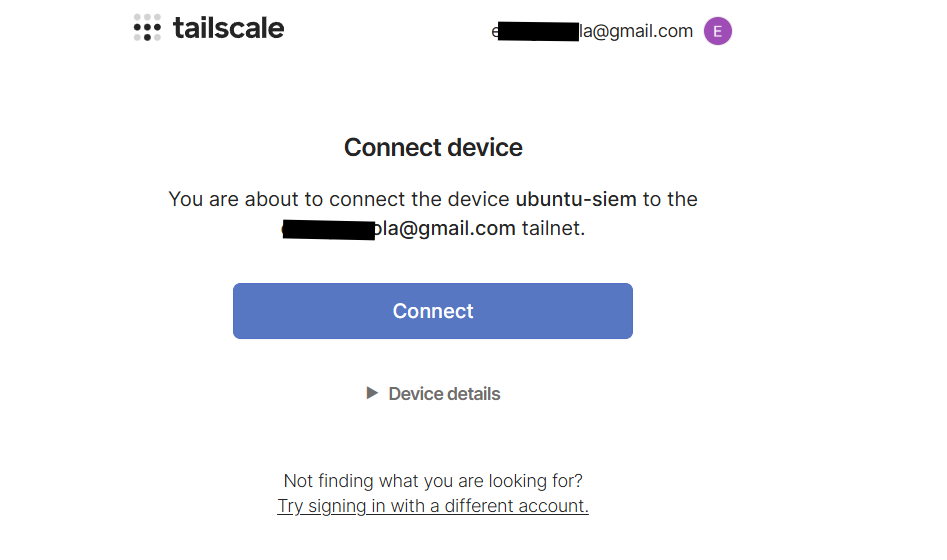
Logged into the same Tailscale account on both. After auth, each machine gets a stable private IP in the `100.x.x.x` range that never changes.
  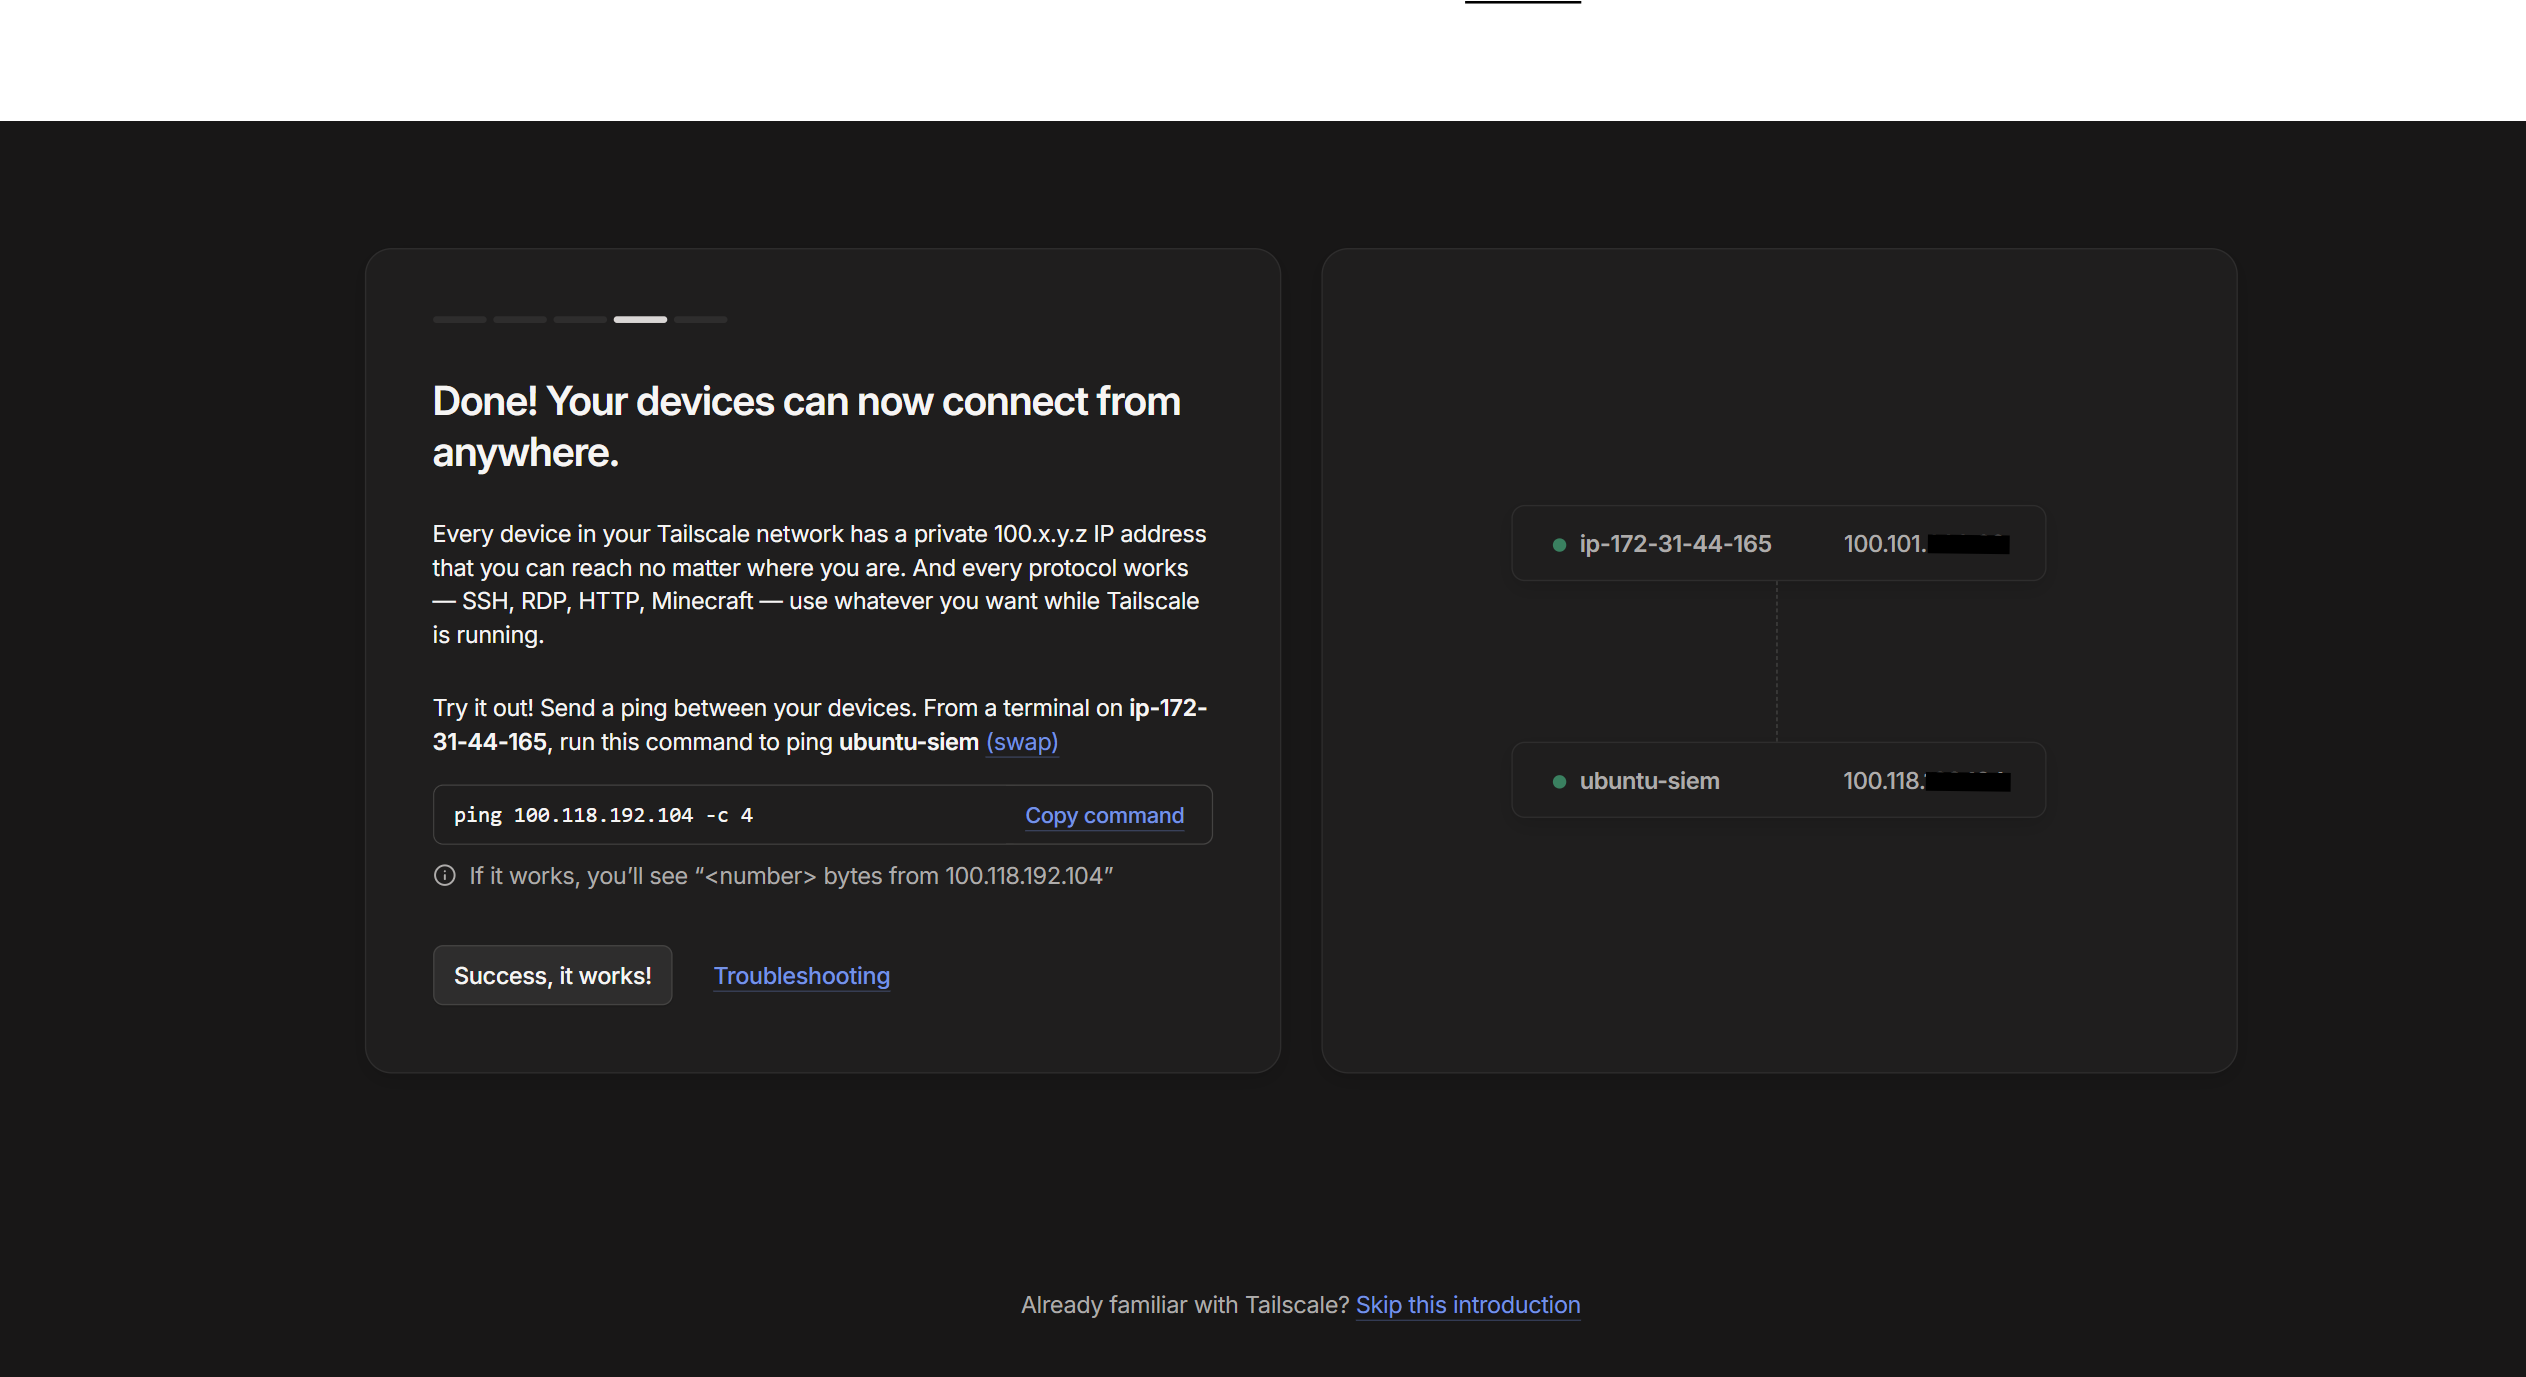
One thing to note: I masked the Tailscale IP in the documentation screenshots since I was planning to use a Tailscale Funnel for another project, didn't want to expose that IP unnecessarily.
Verified connectivity between the two machines:
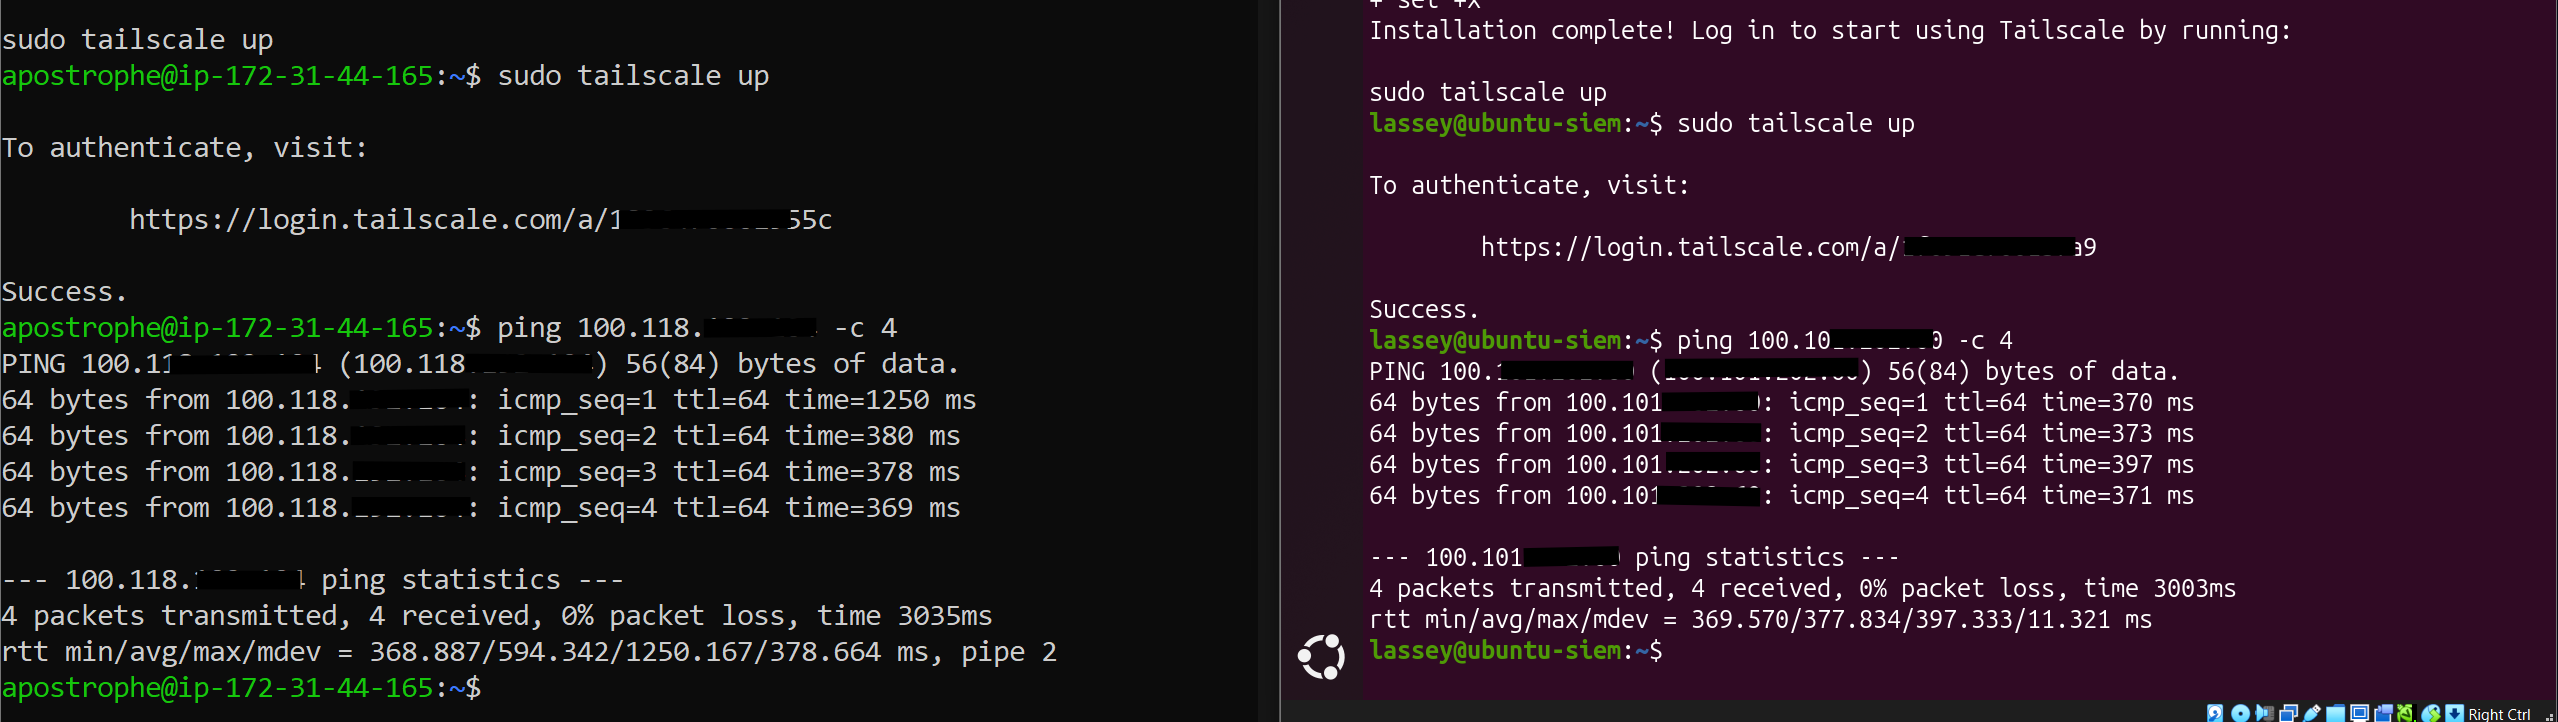
ping
Success. The EC2 instance could now reach the Splunk receiver on the local VM over the private network.
## 8\. Splunk Universal Forwarder
### 8.1 Installation & Boot Configuration
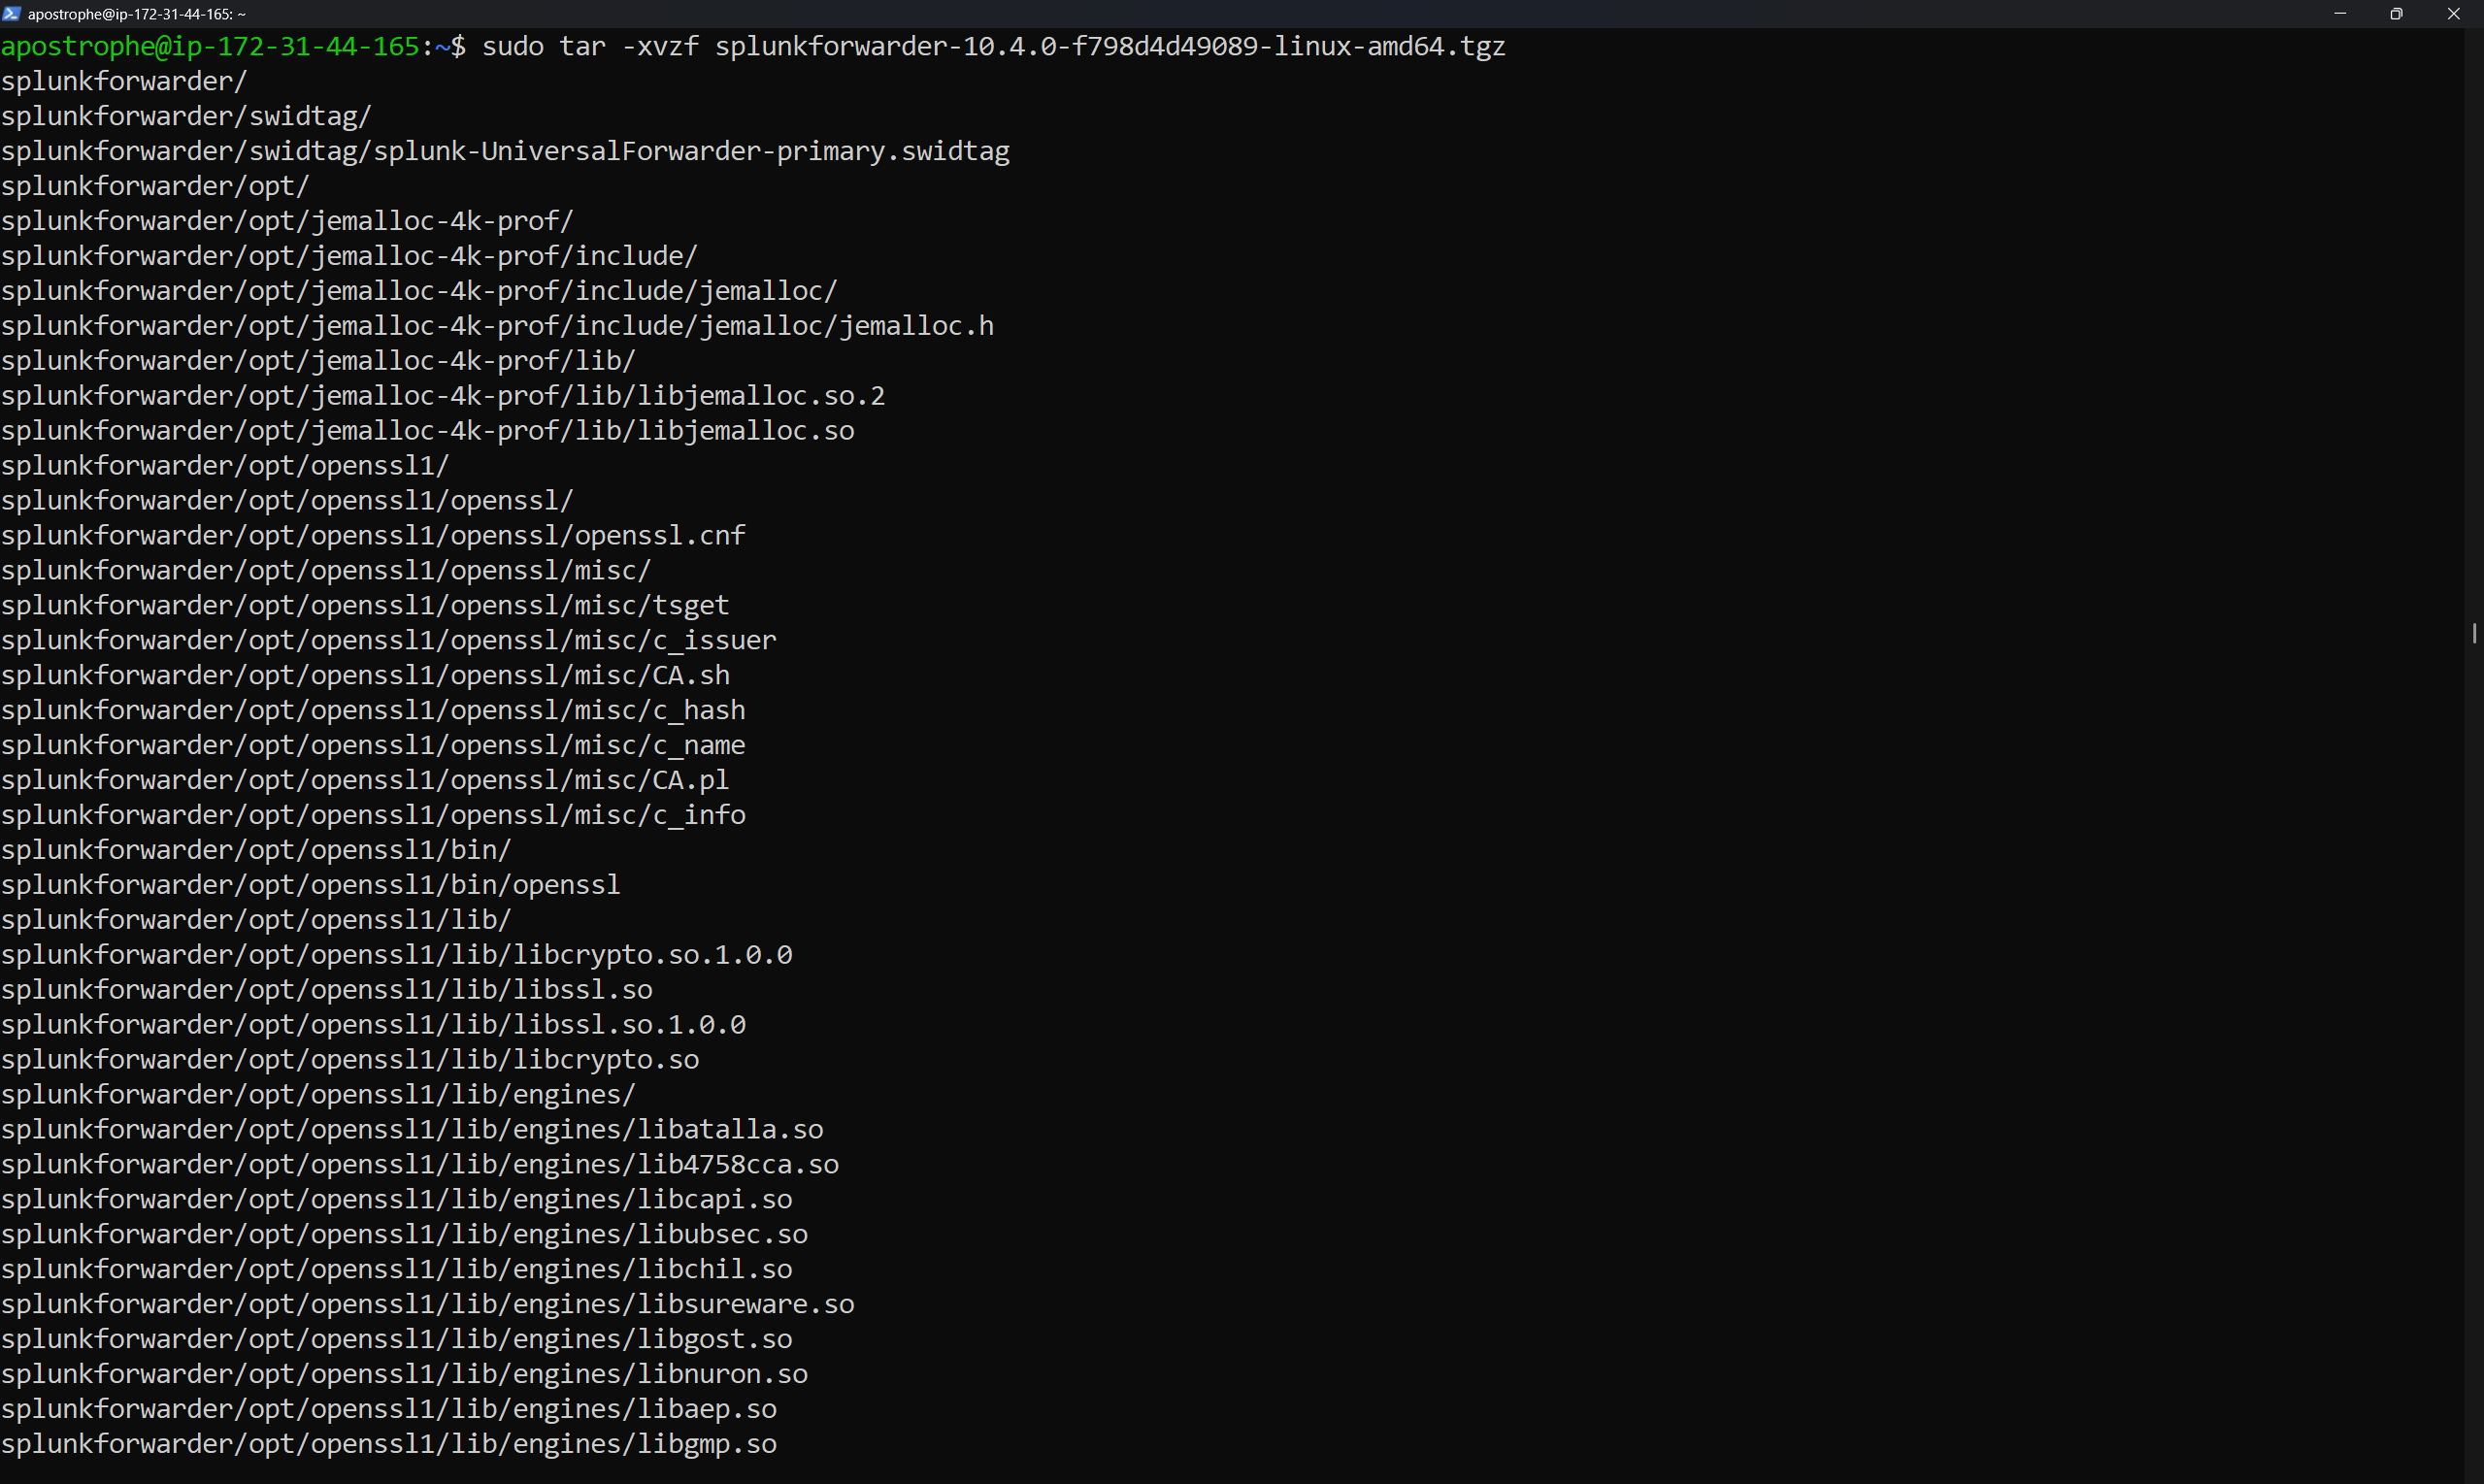
Downloaded and installed the [Splunk Universal Forwarder](https://www.splunk.com/en_us/download/universal-forwarder.html) on the EC2 instance:
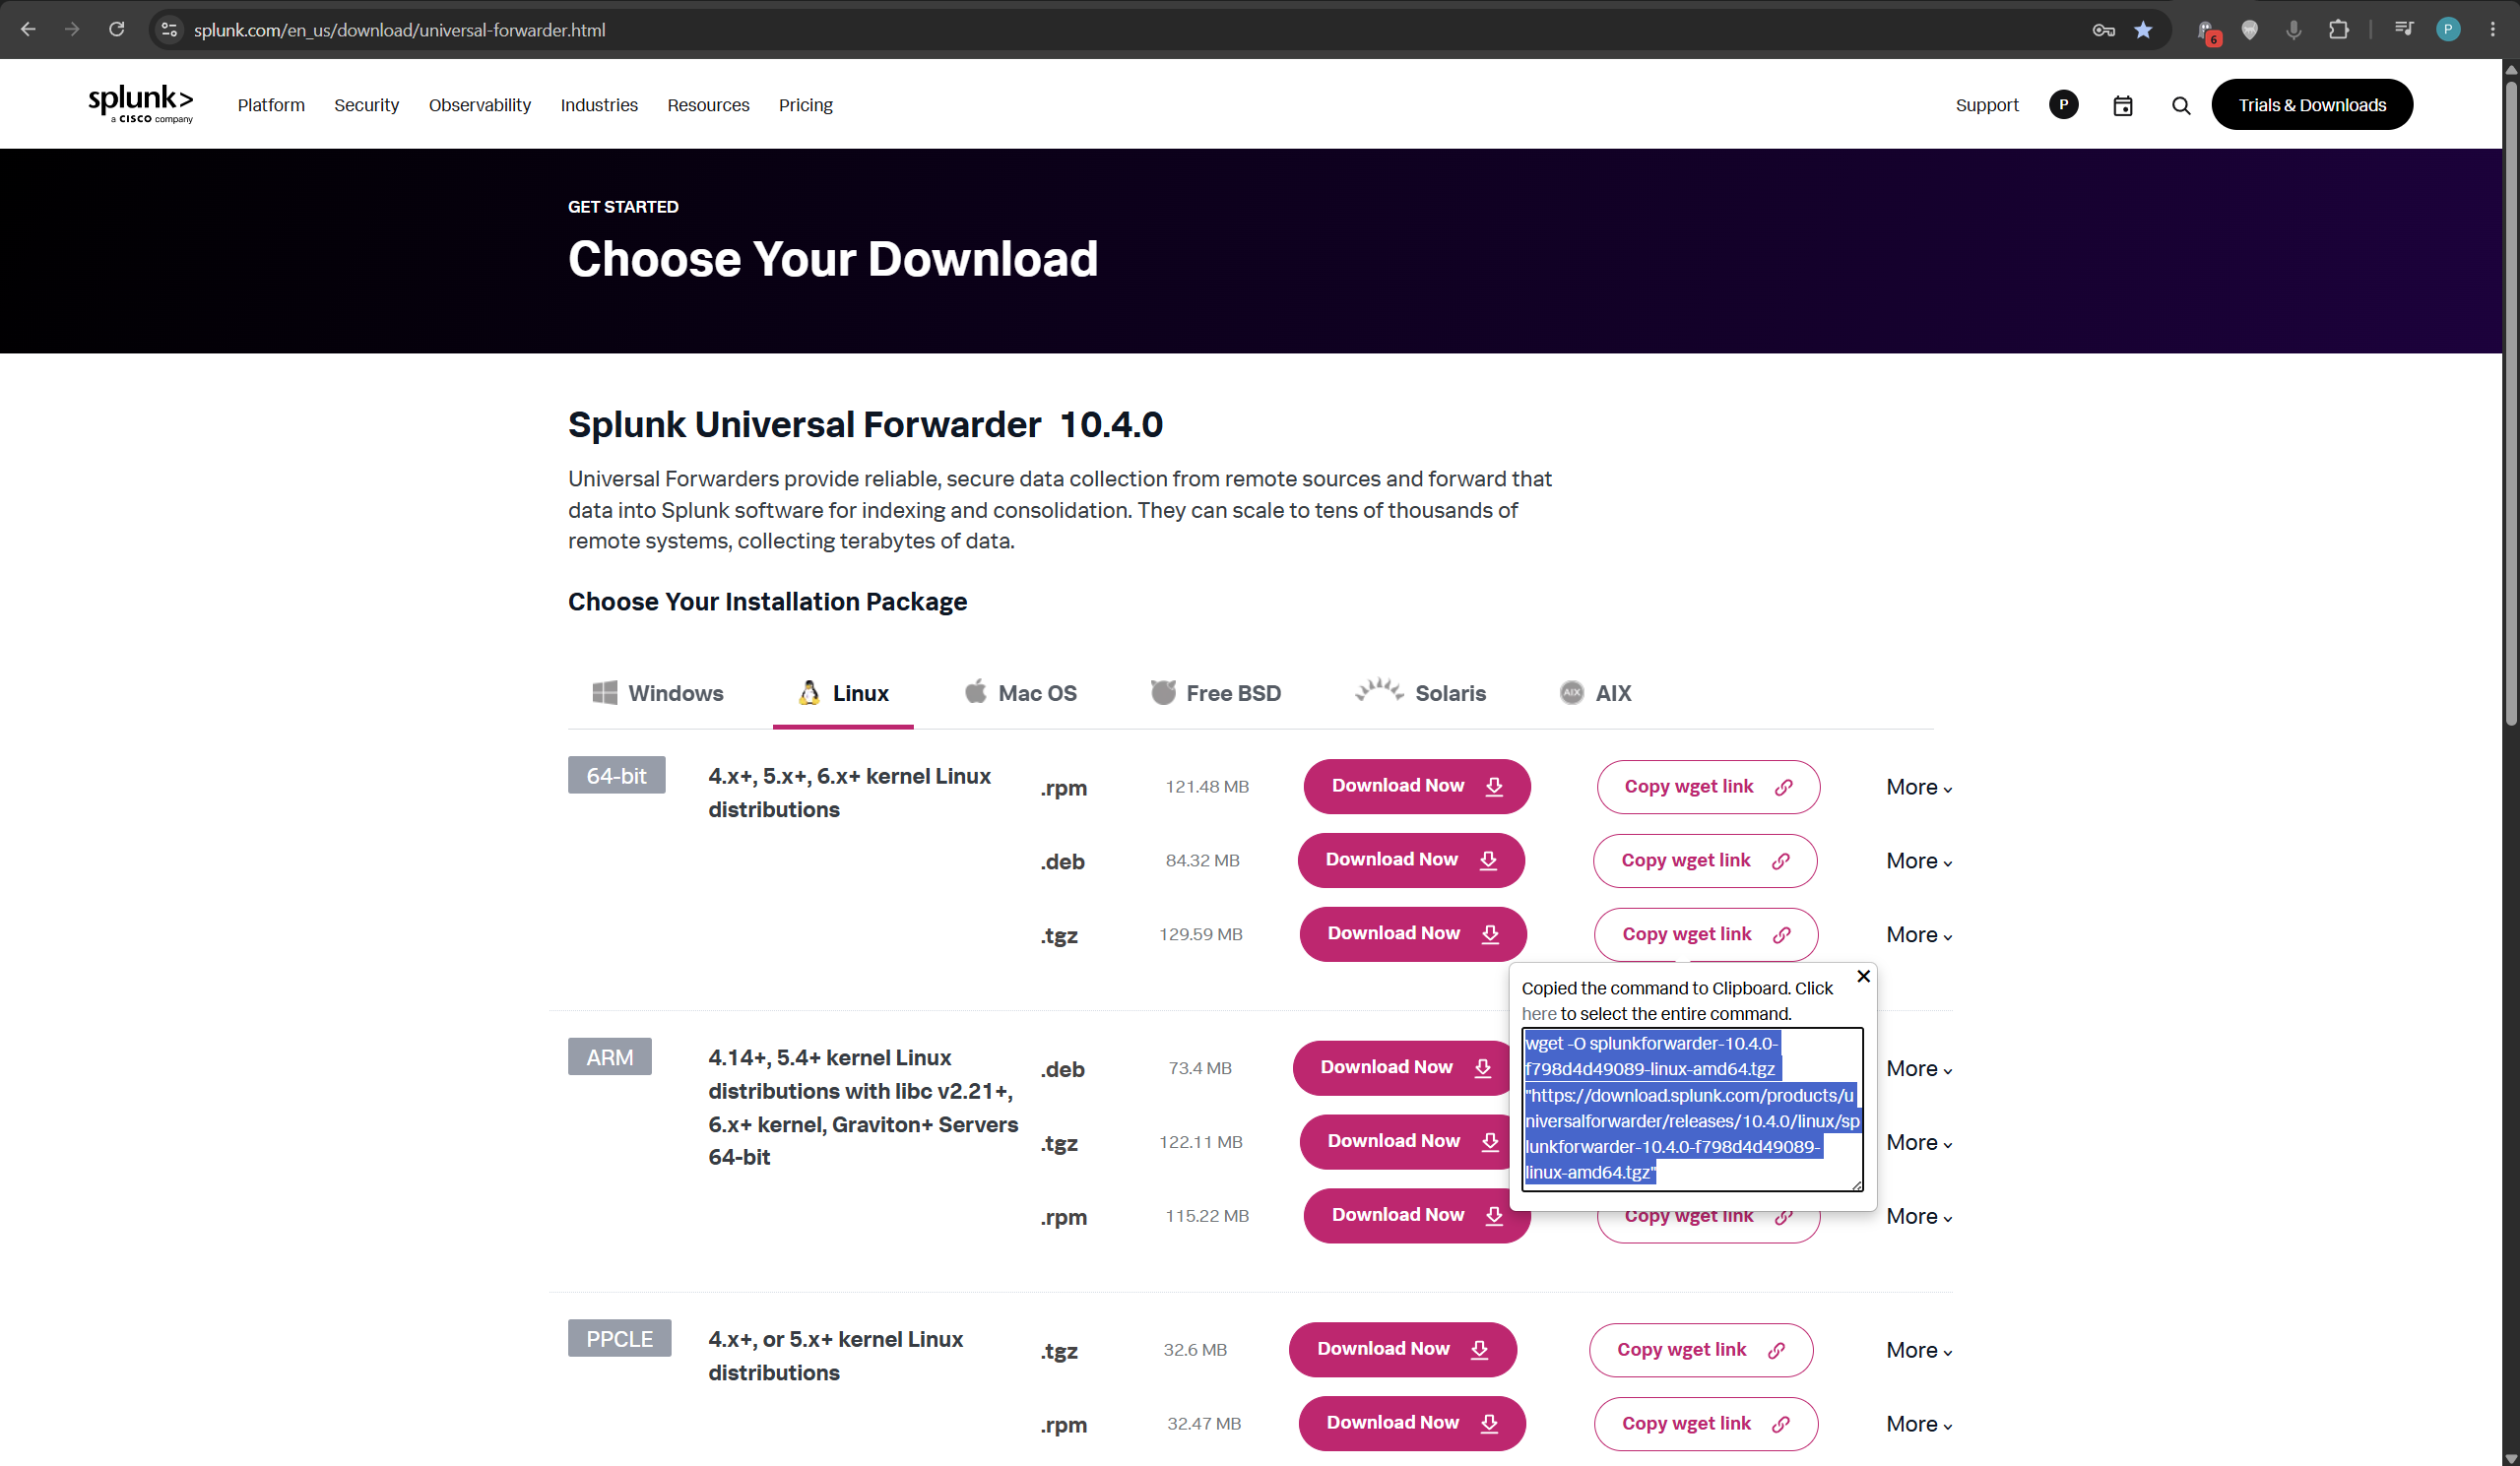
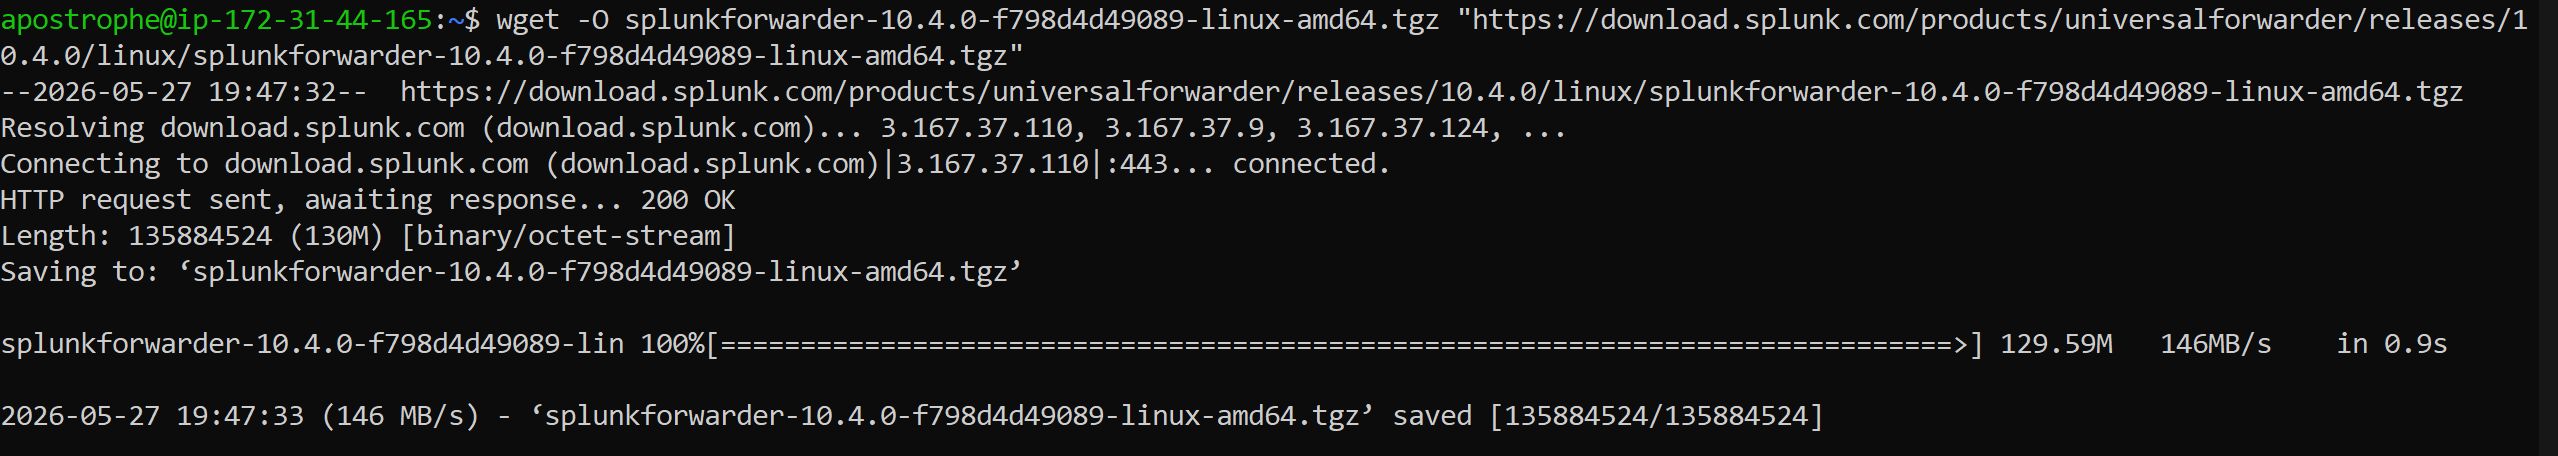
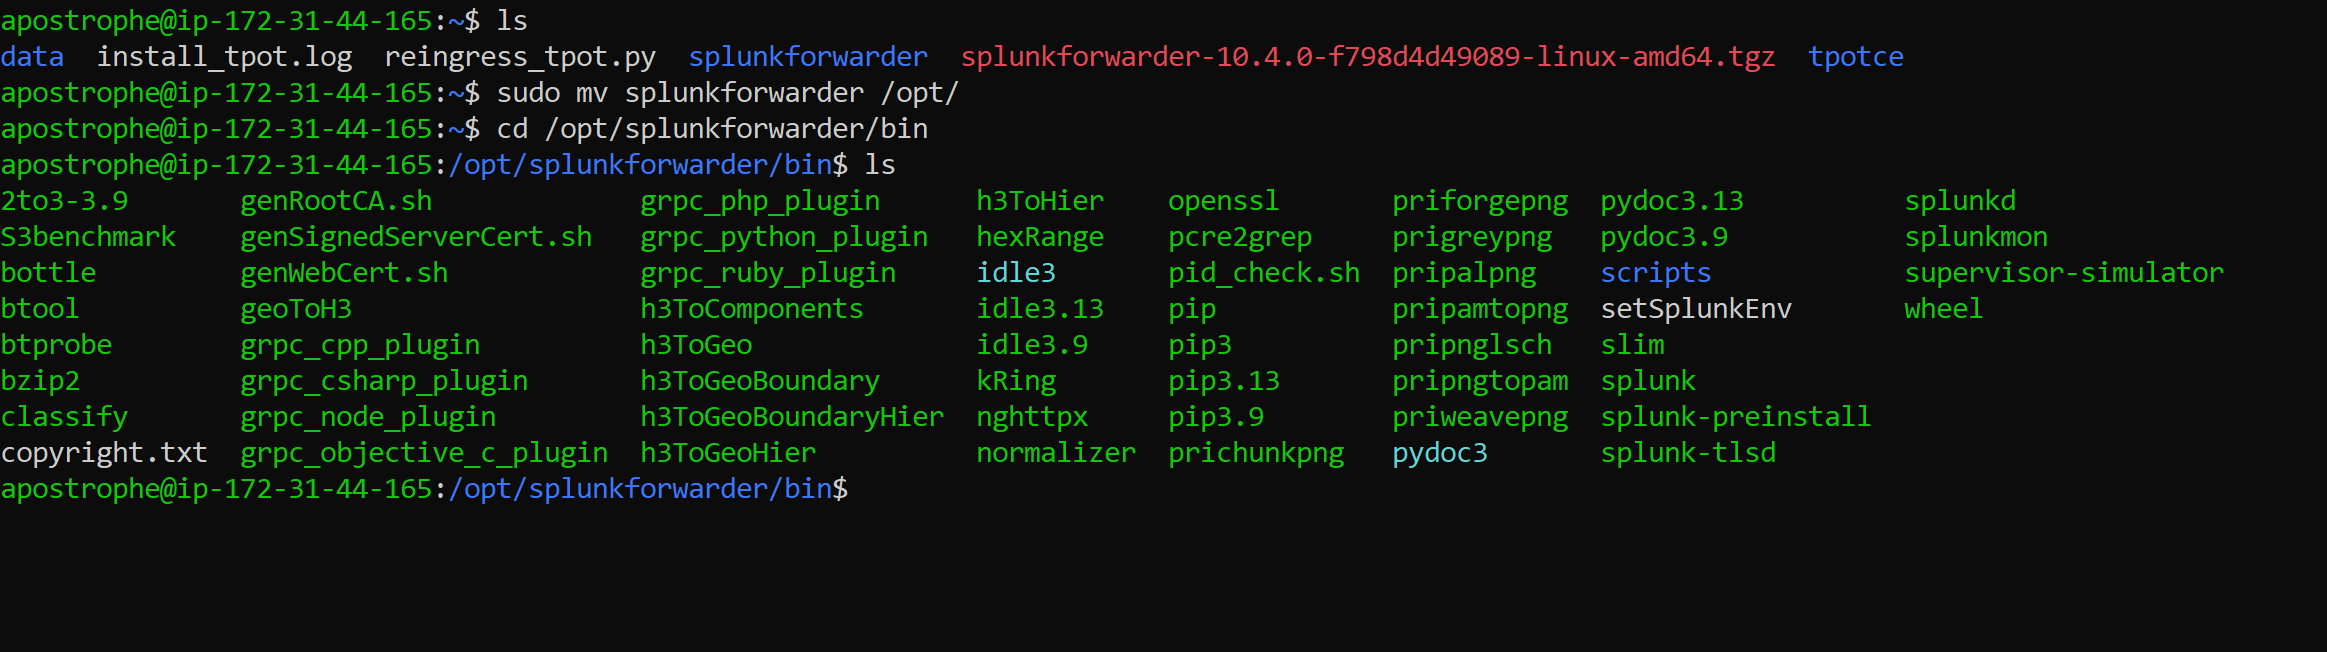
sudo tar -xvzf splunkforwarder*.tgz
sudo mv splunkforwarder /opt/
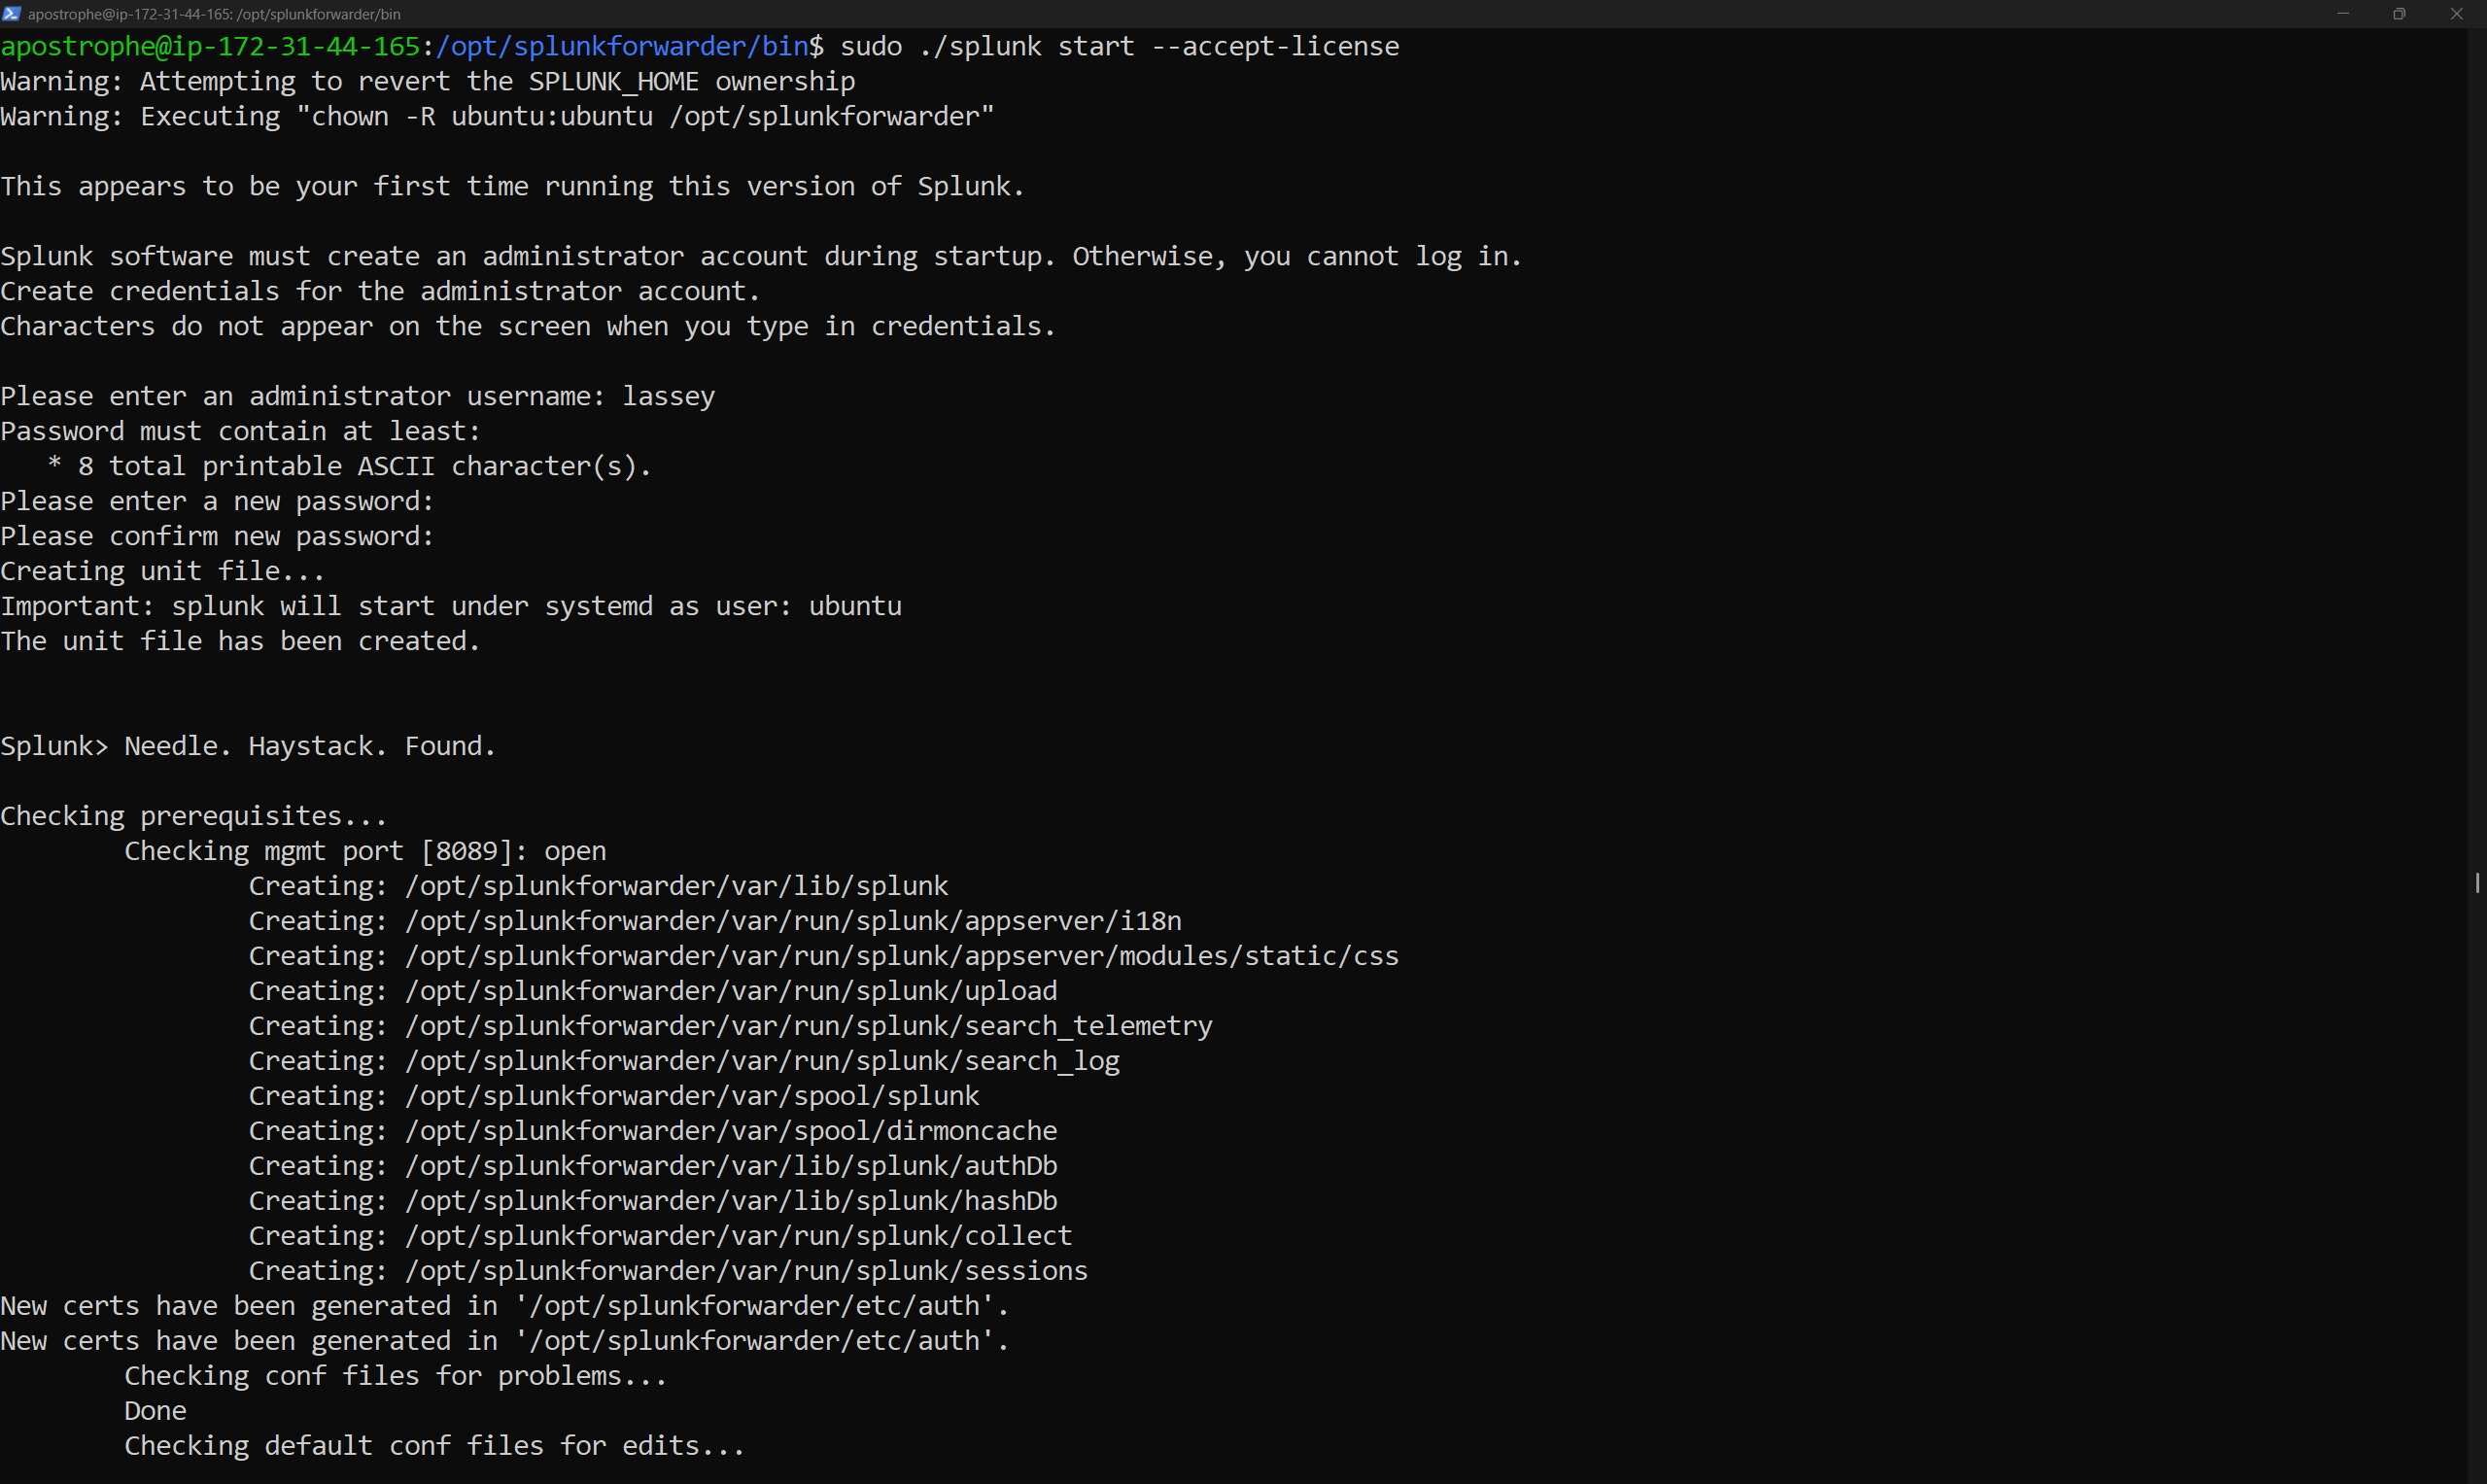
cd /opt/splunkforwarder/bin
sudo ./splunk start --accept-license
I then enabled bootstart to make sure the forwarder survives reboots automatically.
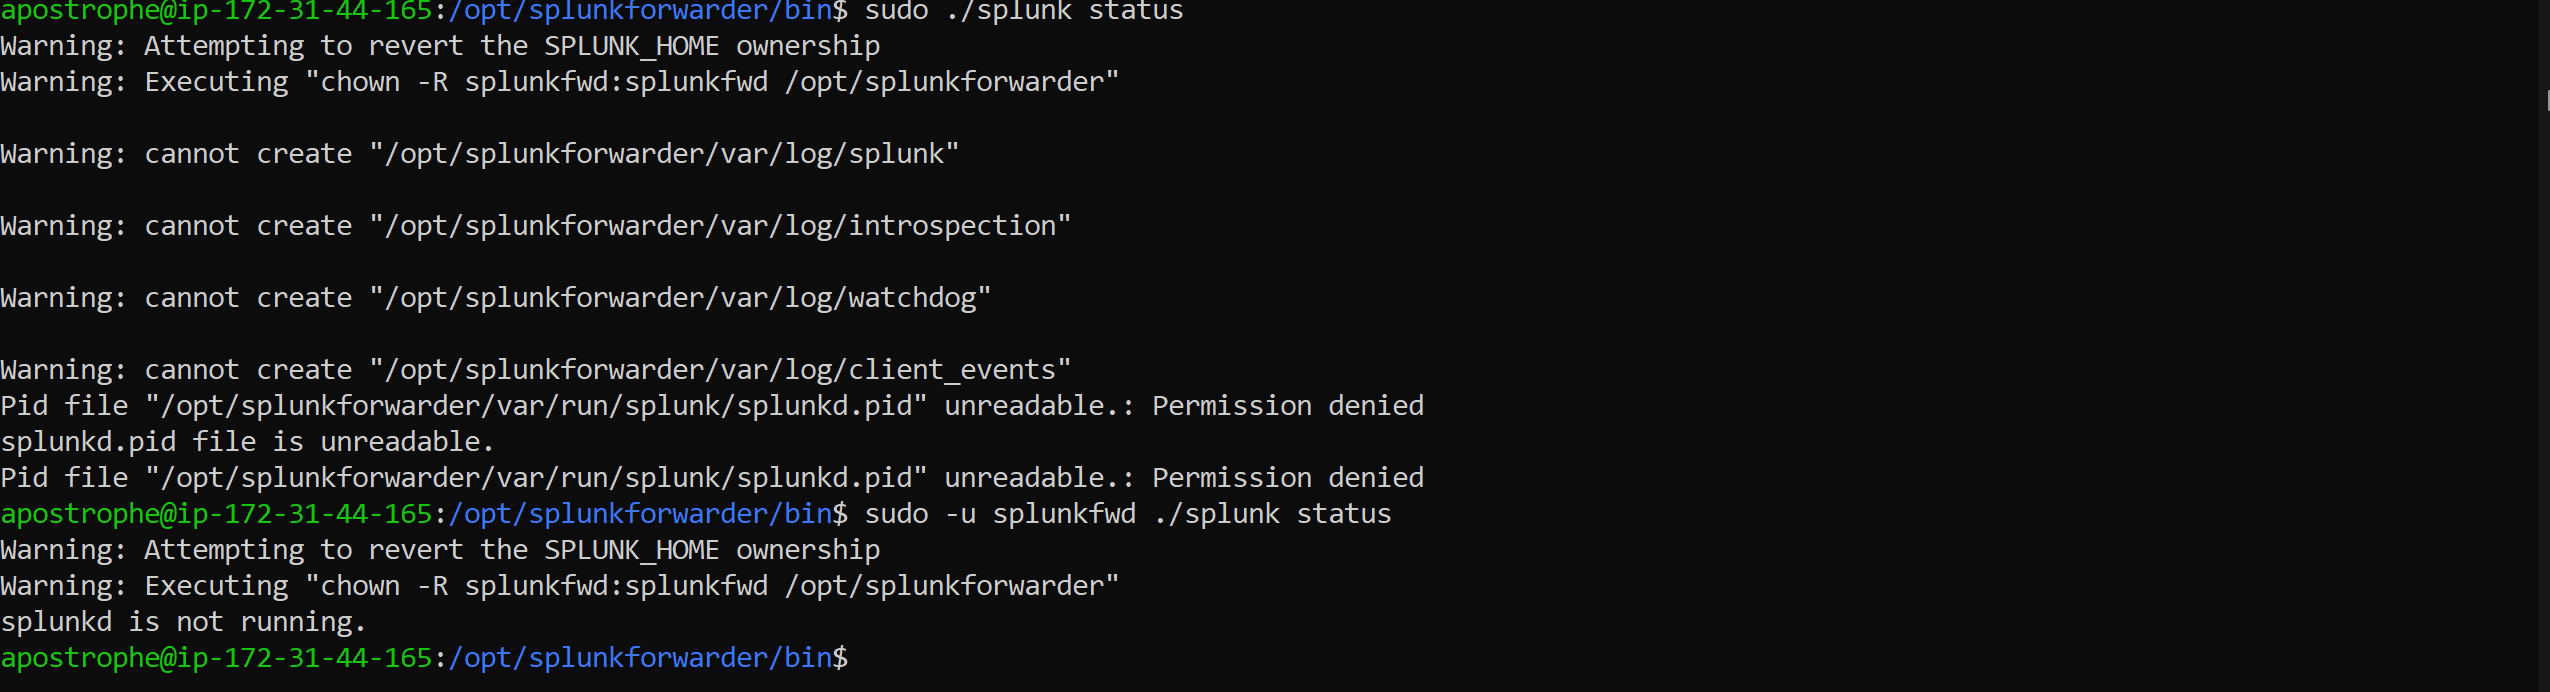
sudo ./splunk enable boot-start
Then I run
sudo ./splunk status
but it returned an error which I fixed by using the splunkfwd user to run those commands.
sudo -u splunkfwd ./splunk status
The forwarder was not started yet
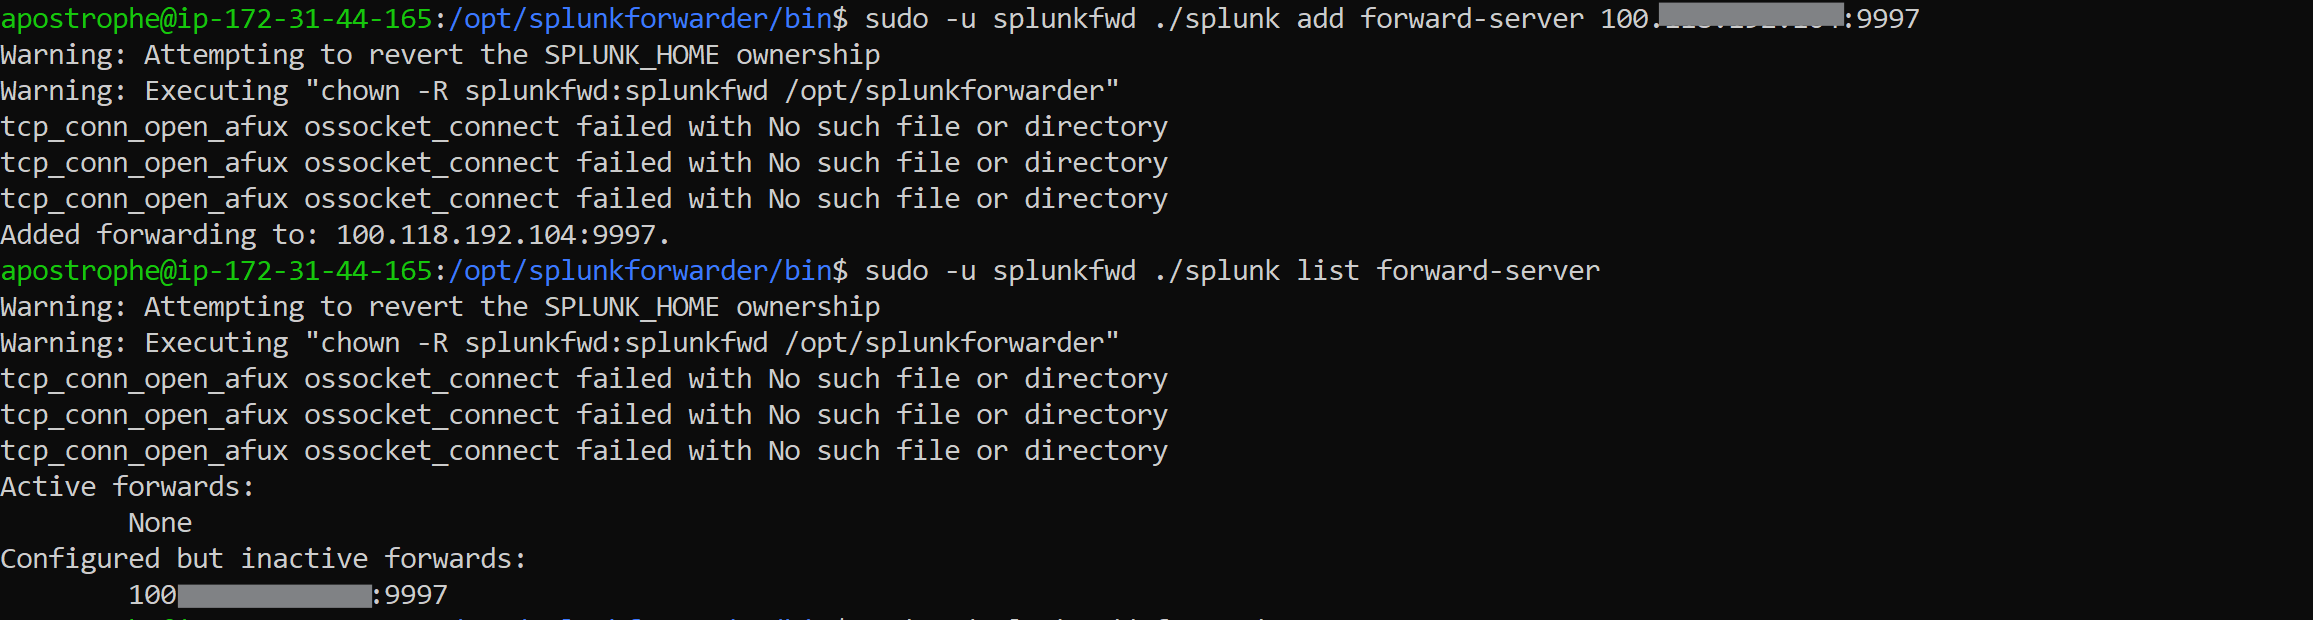
Pointed the forwarder at the Splunk receiver using the Tailscale IP:
sudo ./splunk add forward-server :9997
but listing the forwarders showed configured but inactive. I had to start splunkforwarder first.
Running `enable boot-start` as root, Splunk records root as the boot user in the systemd unit file and then refuses to start as the `splunkfwd` user.
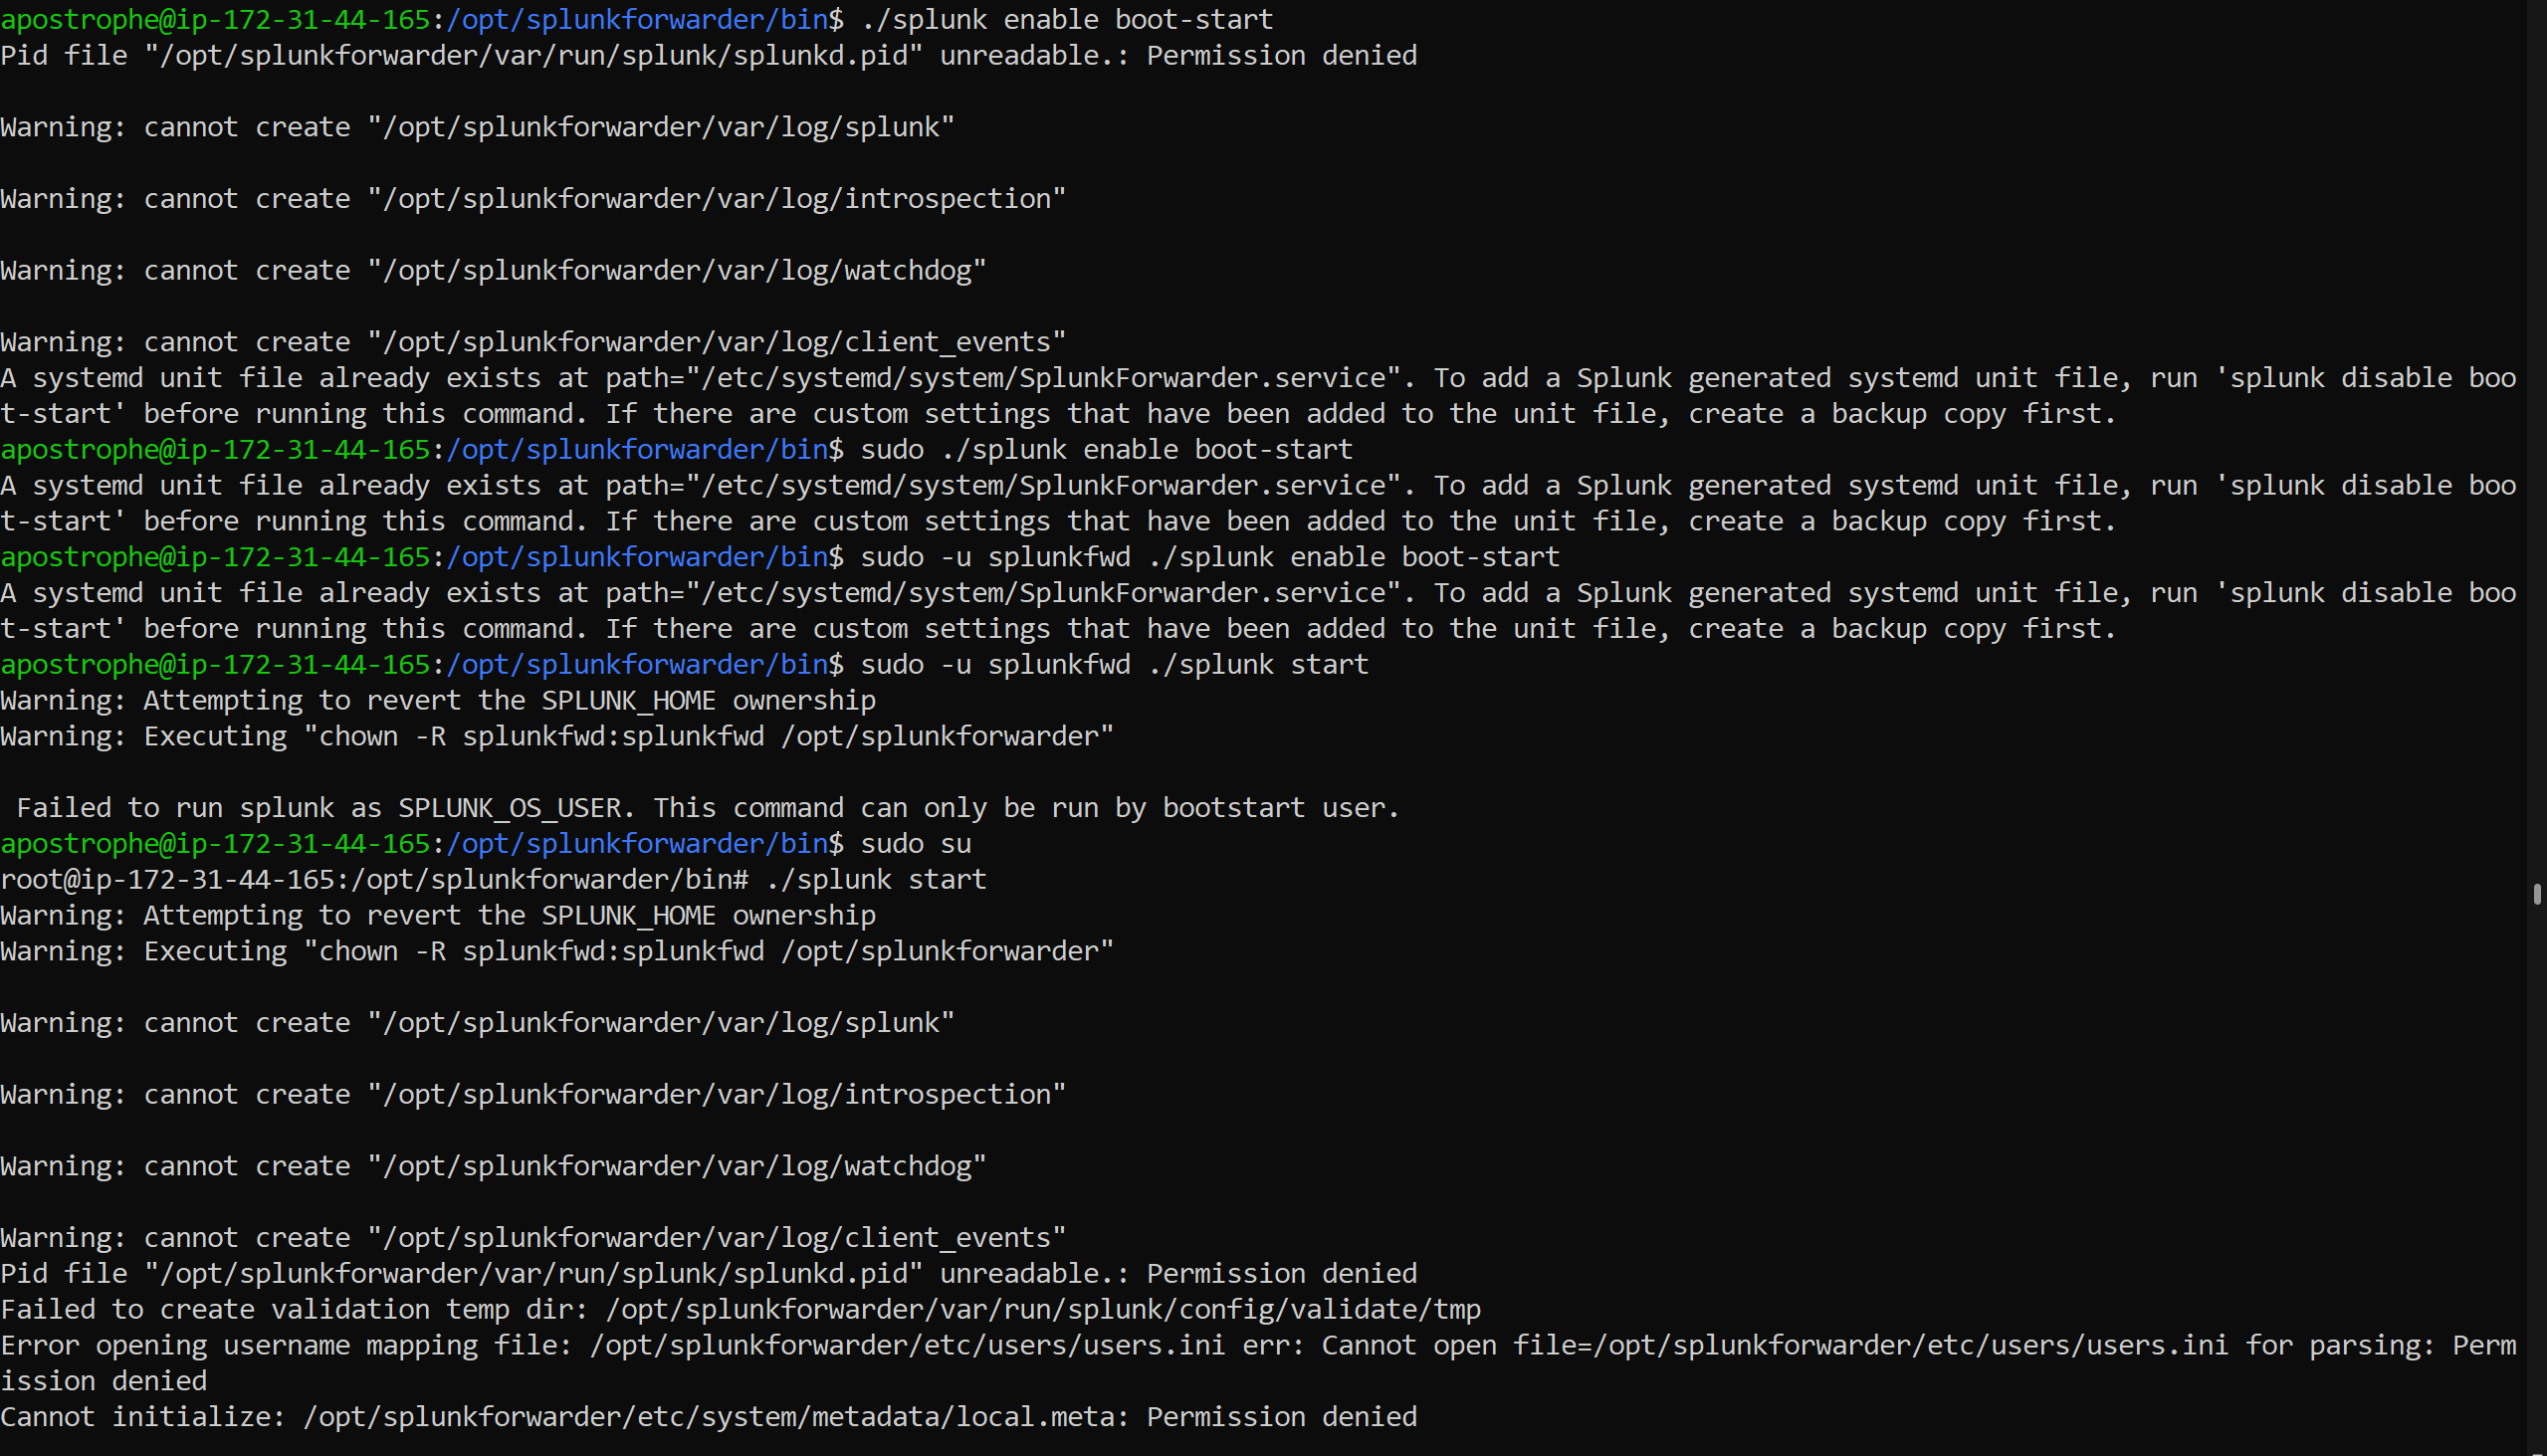
To fix it, this is what I did:
# Fixed ownership
sudo chown -R splunkfwd:splunkfwd /opt/splunkforwarder
# Removed the bad systemd unit
sudo /opt/splunkforwarder/bin/splunk disable boot-start
# Re-enabled with the correct user
sudo /opt/splunkforwarder/bin/splunk enable boot-start -user splunkfwd
# Started via systemd
sudo systemctl start SplunkForwarder
sudo systemctl status SplunkForwarder
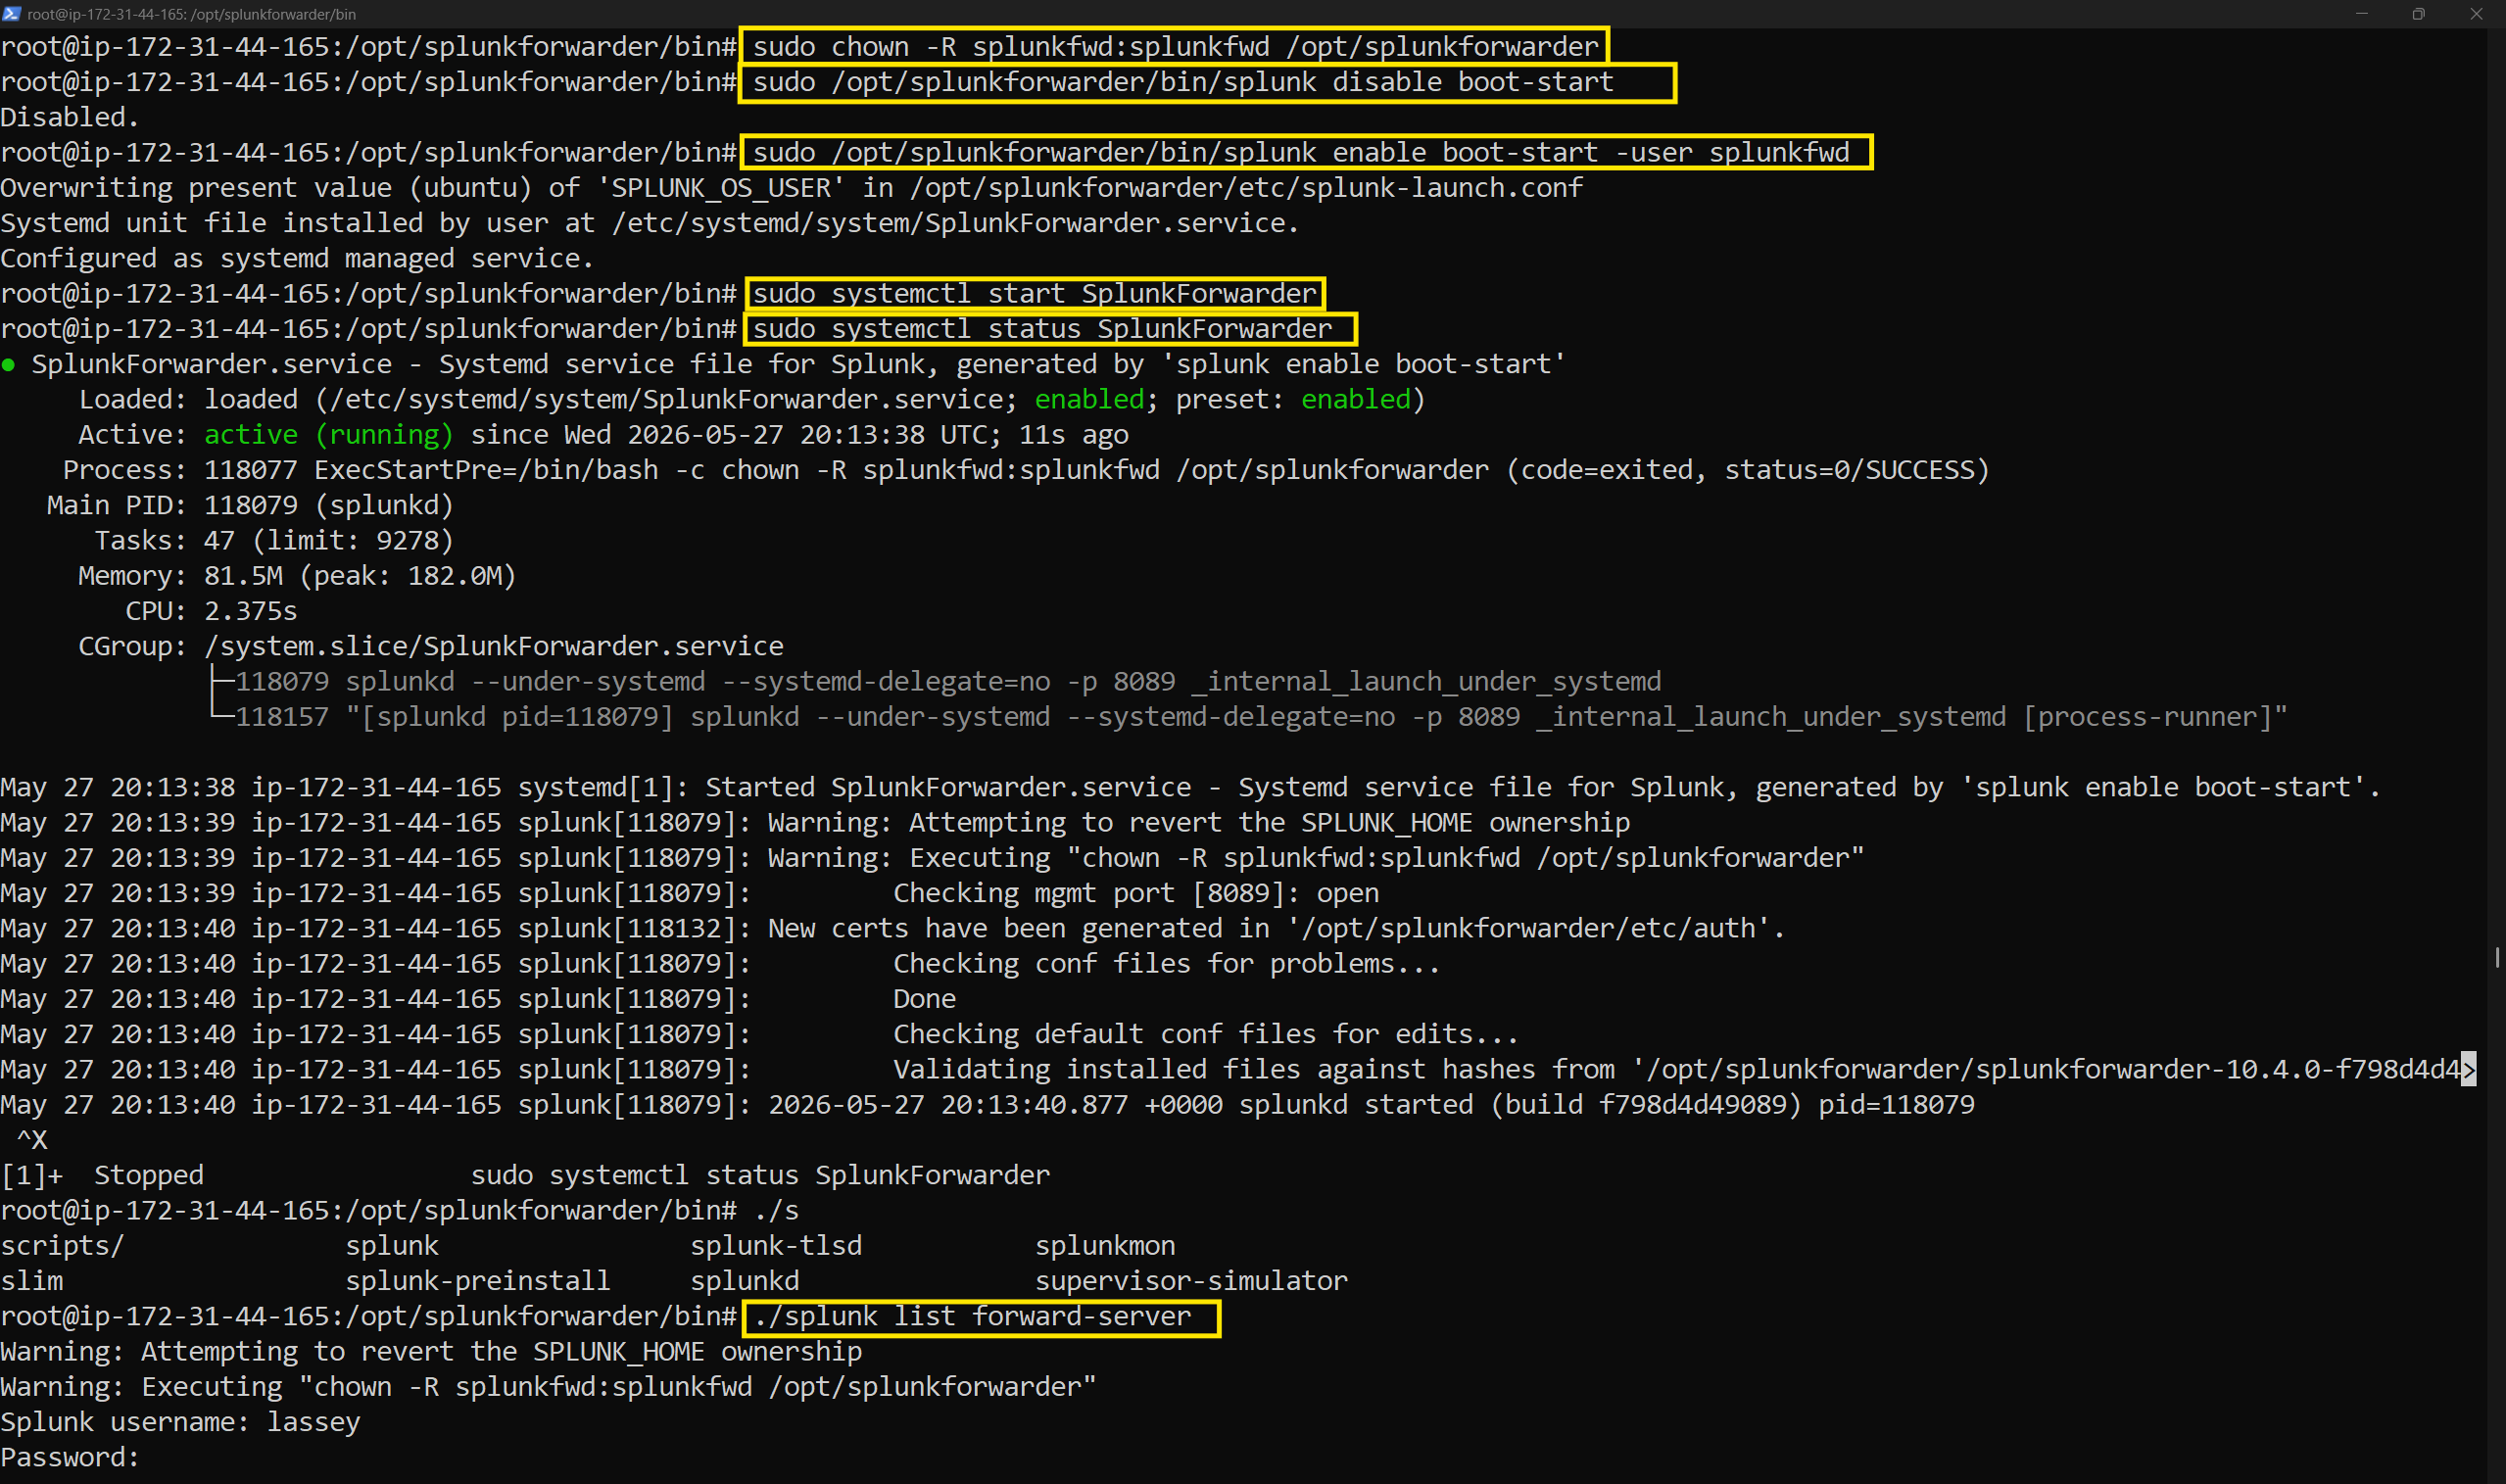
I then run
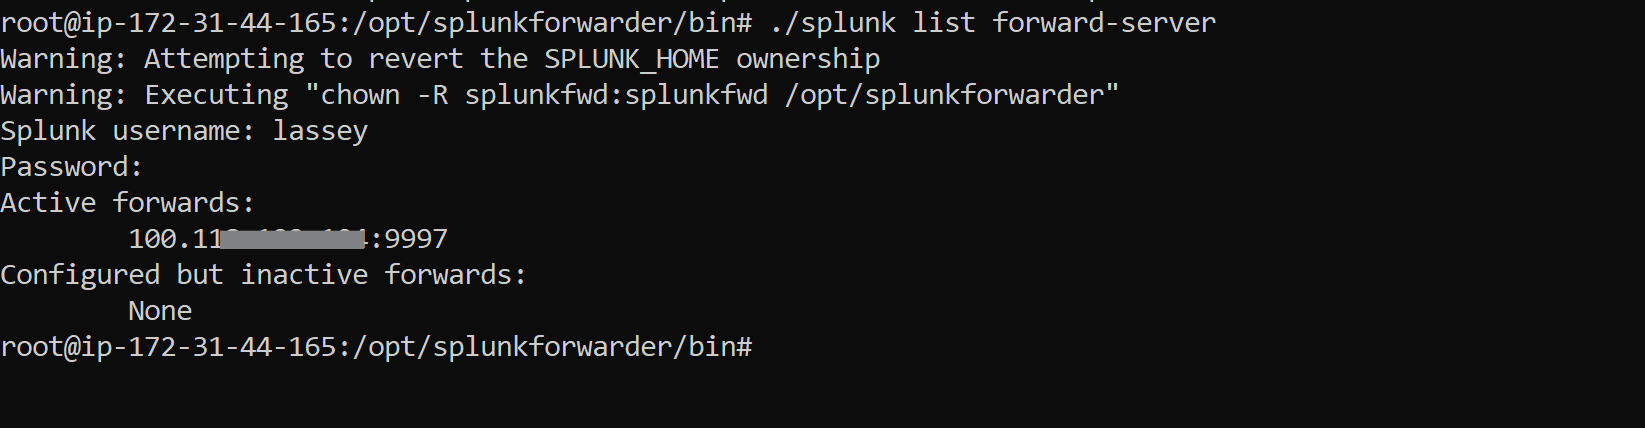
./splunk list forward-server
which asked me to login using the username and password I had created earlier on. Now, I had an active forward.
### 8.2 inputs.conf Configuration
The inputs.conf file lives at:
/opt/splunkforwarder/etc/apps/search/local/inputs.conf
Not `/opt/splunkforwarder/etc/system/local/inputs.conf` - that path exists but the apps path is where it actually takes effect. Learned that one the hard way lol.
The full configuration is in [`config/inputs.conf`](config/inputs.conf) in this repo. Here's what each parameter does:
| Parameter | Value | Purpose |
| --- | --- | --- |
| `[monitor://...]` | `/home/apostrophe/tpotce/data/*/log` | Monitors log directories for all honeypot services |
| `disabled` | `false` | Forwarder is active |
| `index` | `honeypot` | Routes all events to the dedicated honeypot index |
| `followTail` | `0` | Reads existing files from byte 0 — ensures complete historical ingestion on first run, then automatically transitions to real-time tailing |
| `crcSalt` | `` | Includes the full file path in Splunk's checksum. Critical: ensures logrotate-numbered copies (`cowrie.json.1`, `suricata.csv.3`) are treated as unique inputs rather than duplicates of the active file |
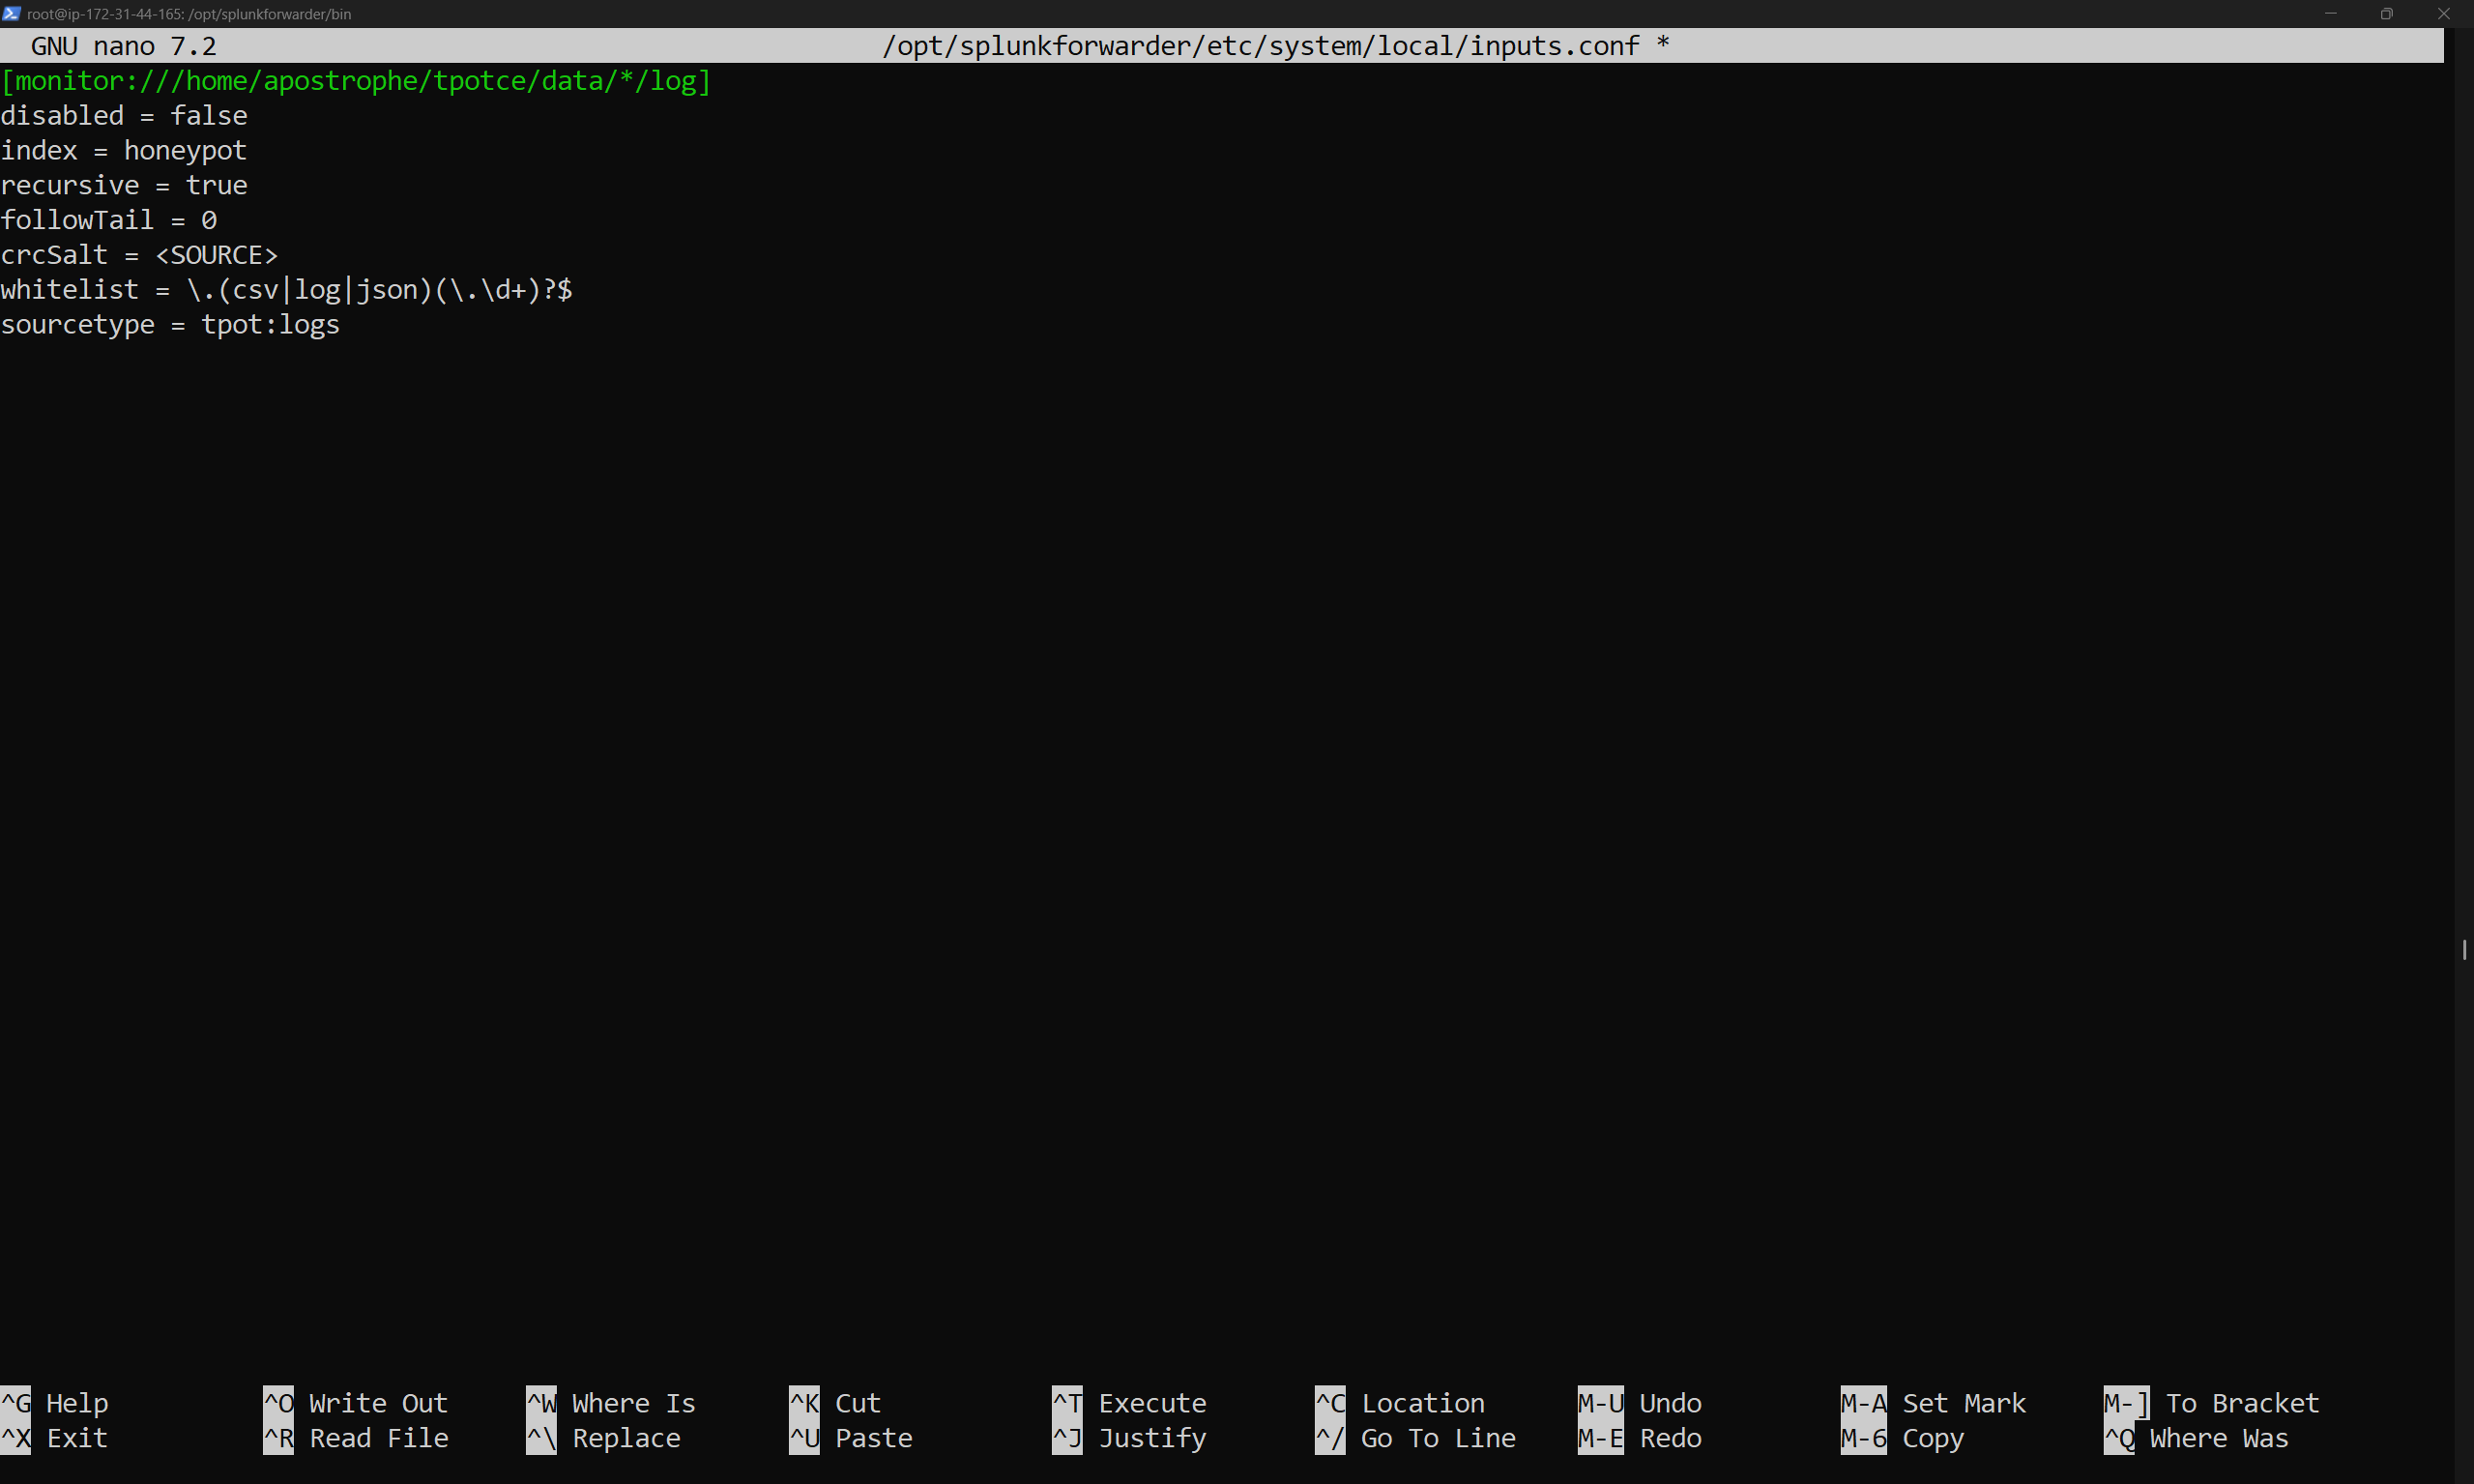
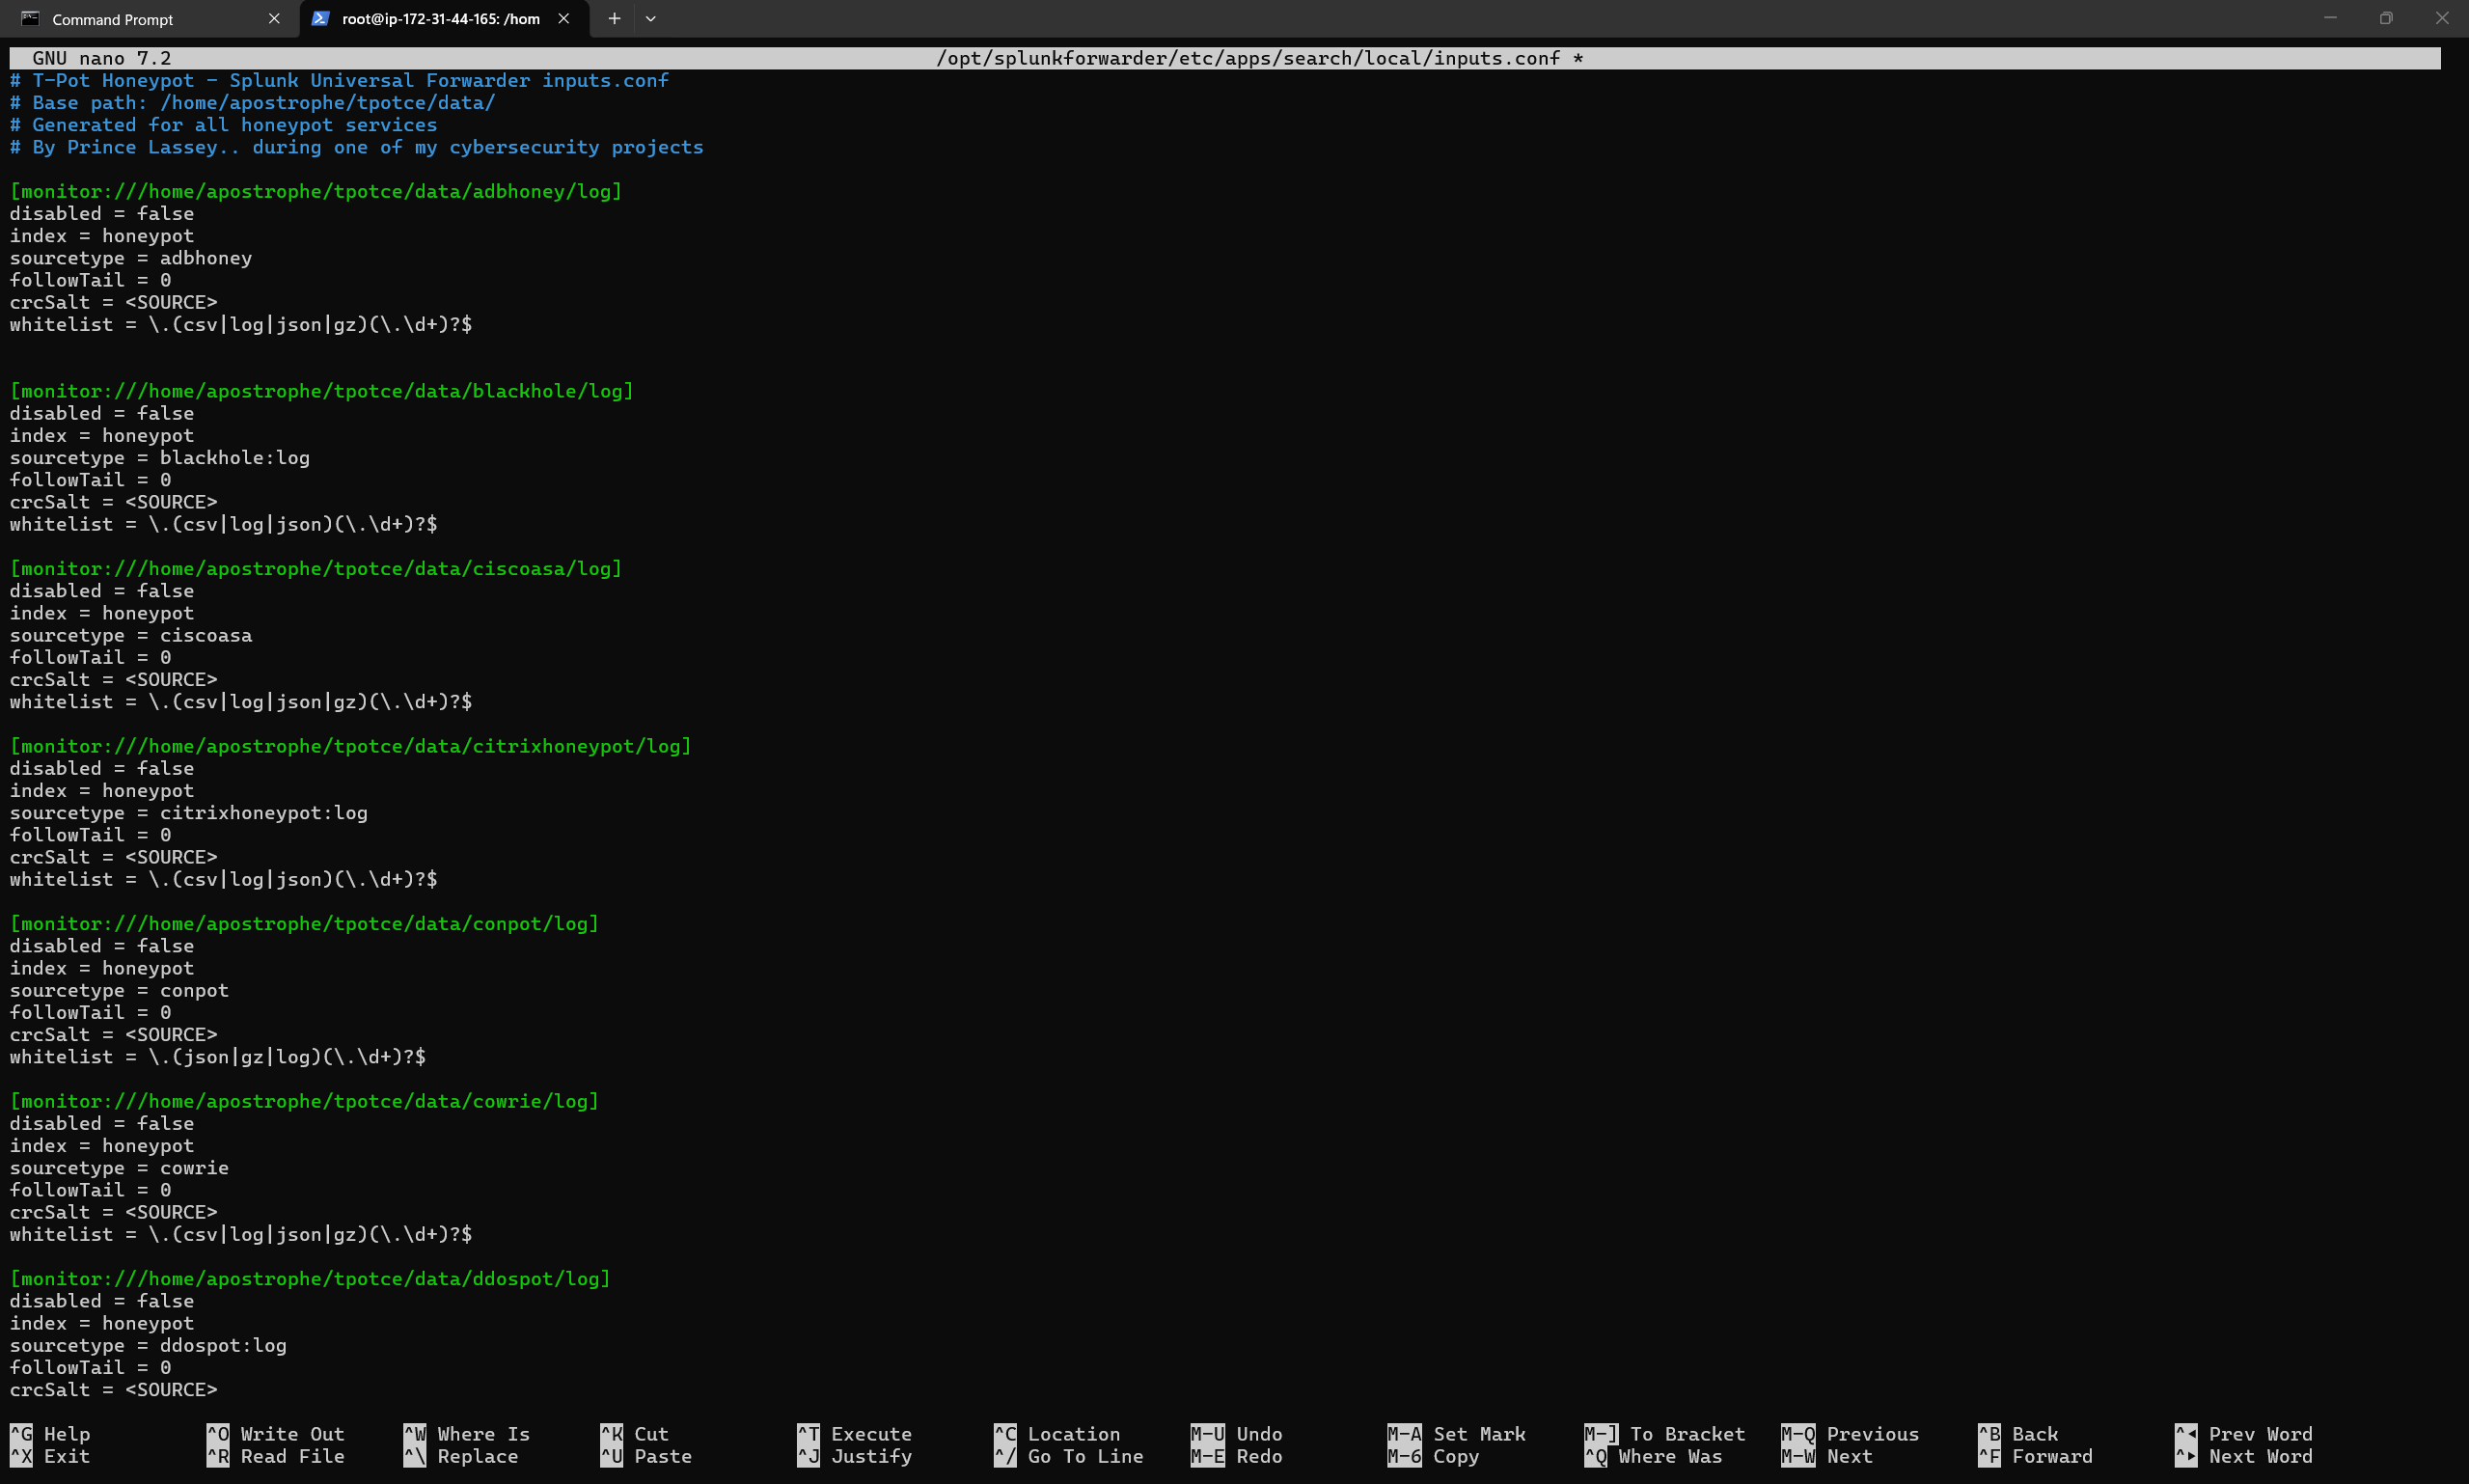
| `whitelist` | \.(csv\|log\|json)(\.\d+)?$ | log |
| `sourcetype` | Per-honeypot (see config) | Each honeypot has its own sourcetype for proper field extraction |
**The single-stanza mistake:** My first attempt used one wildcard stanza with `sourcetype = tpot:logs` for everything. Zero events showed up. The issue is that each honeypot produces differently structured logs - JSON, CSV, plain text and Splunk's field extraction is tied to sourcetype. Fixing it meant giving every honeypot its own stanza with its specific sourcetype like you see below
### 8.3 Troubleshooting Ingestion
If ingestion isn't working:
# Check forwarder is running
sudo systemctl status SplunkForwarder
# Verify forward server is configured and active
sudo -u splunkfwd /opt/splunkforwarder/bin/splunk list forward-server
# Check forwarder logs for errors
sudo tail -f /opt/splunkforwarder/var/log/splunk/splunkd.log
# Test connectivity to Splunk receiver
nc -zv 9997
In Splunk, confirm events are arriving:
index=honeypot | head 10
## 9\. Claude AI + Splunk MCP Integration
This is the part that makes this project a bit different from the usual T-Pot write-up. Instead of just clicking around Kibana, I connected Claude AI directly to Splunk using the **Model Context Protocol (MCP)** which lets Claude issue real Splunk queries, read the results, and reason over them in natural language. Most importantly, I did this as a test for my SOC automation project which I plan to rather use a local AI deployment as my SOC assistant.
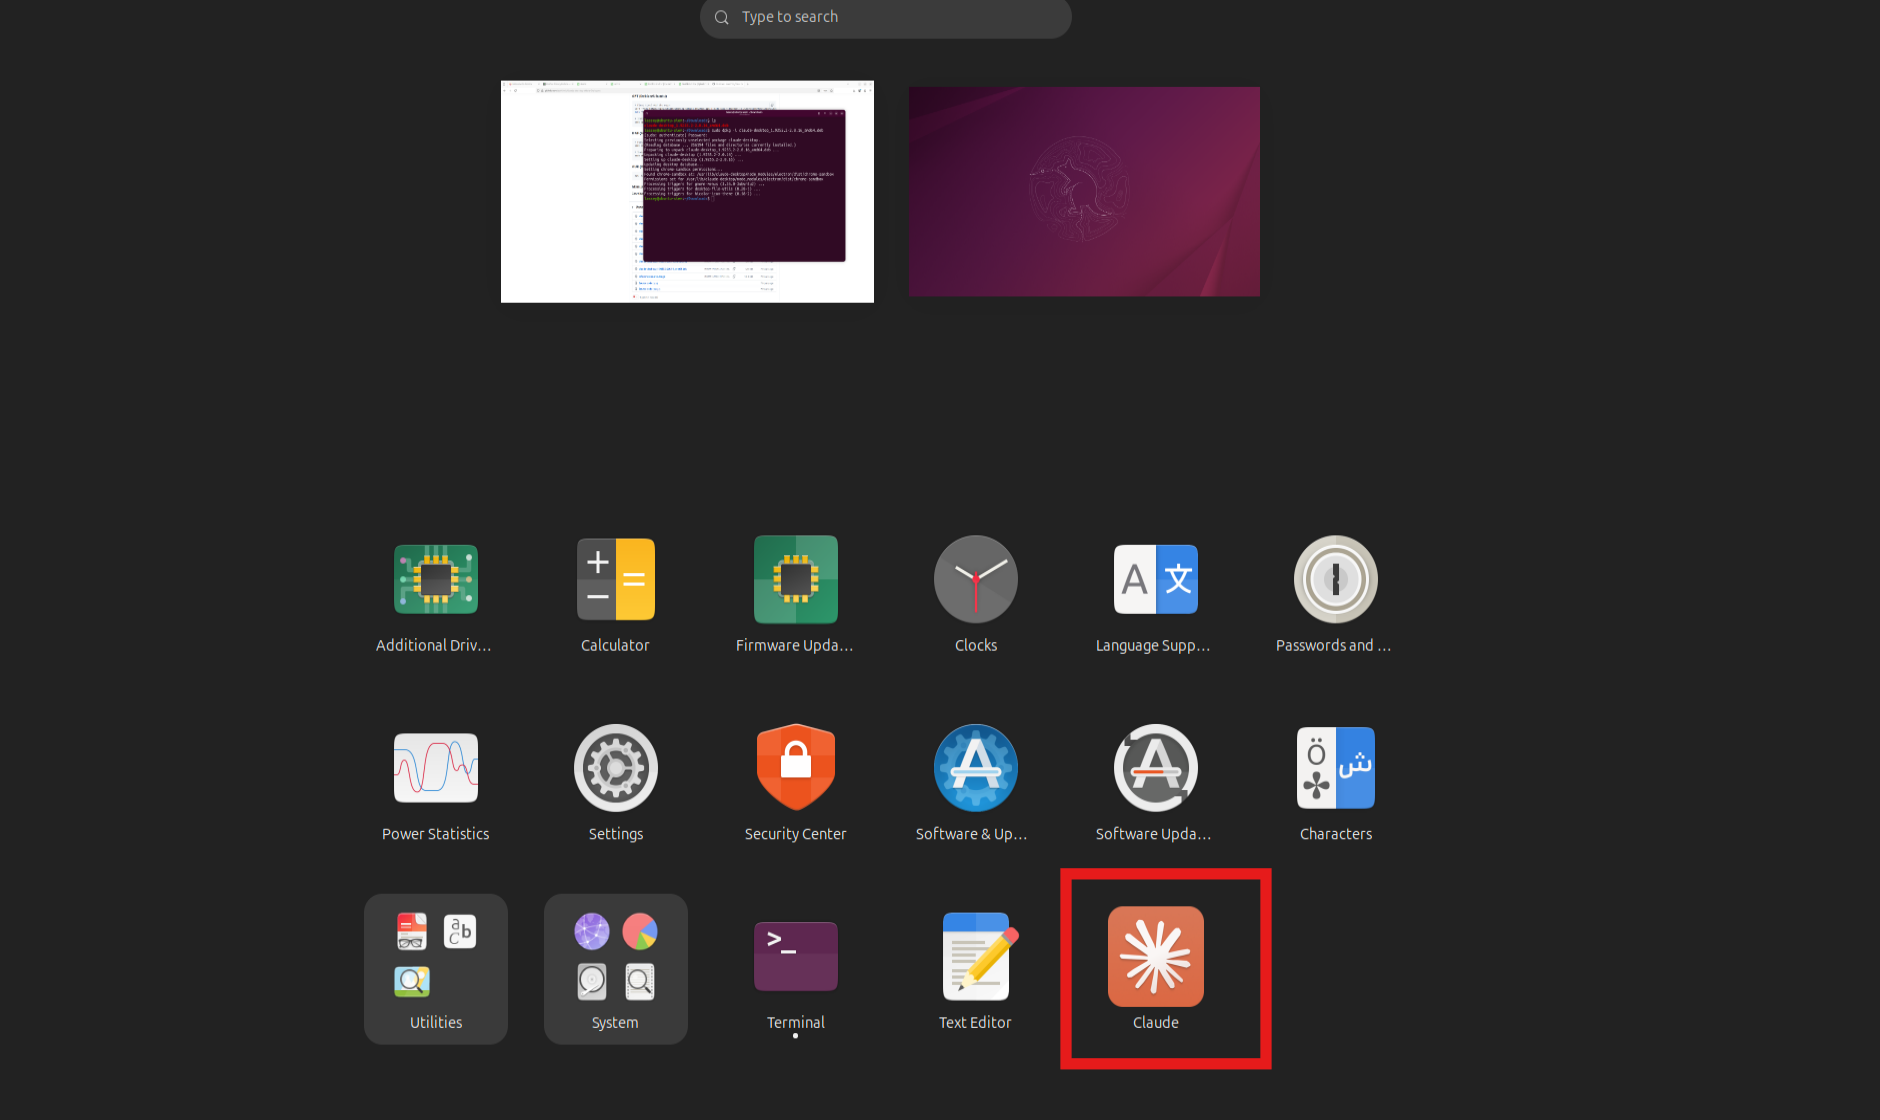
### 9.1 Installing Claude Desktop (Linux)
# Prerequisites
sudo apt update && sudo apt upgrade -y
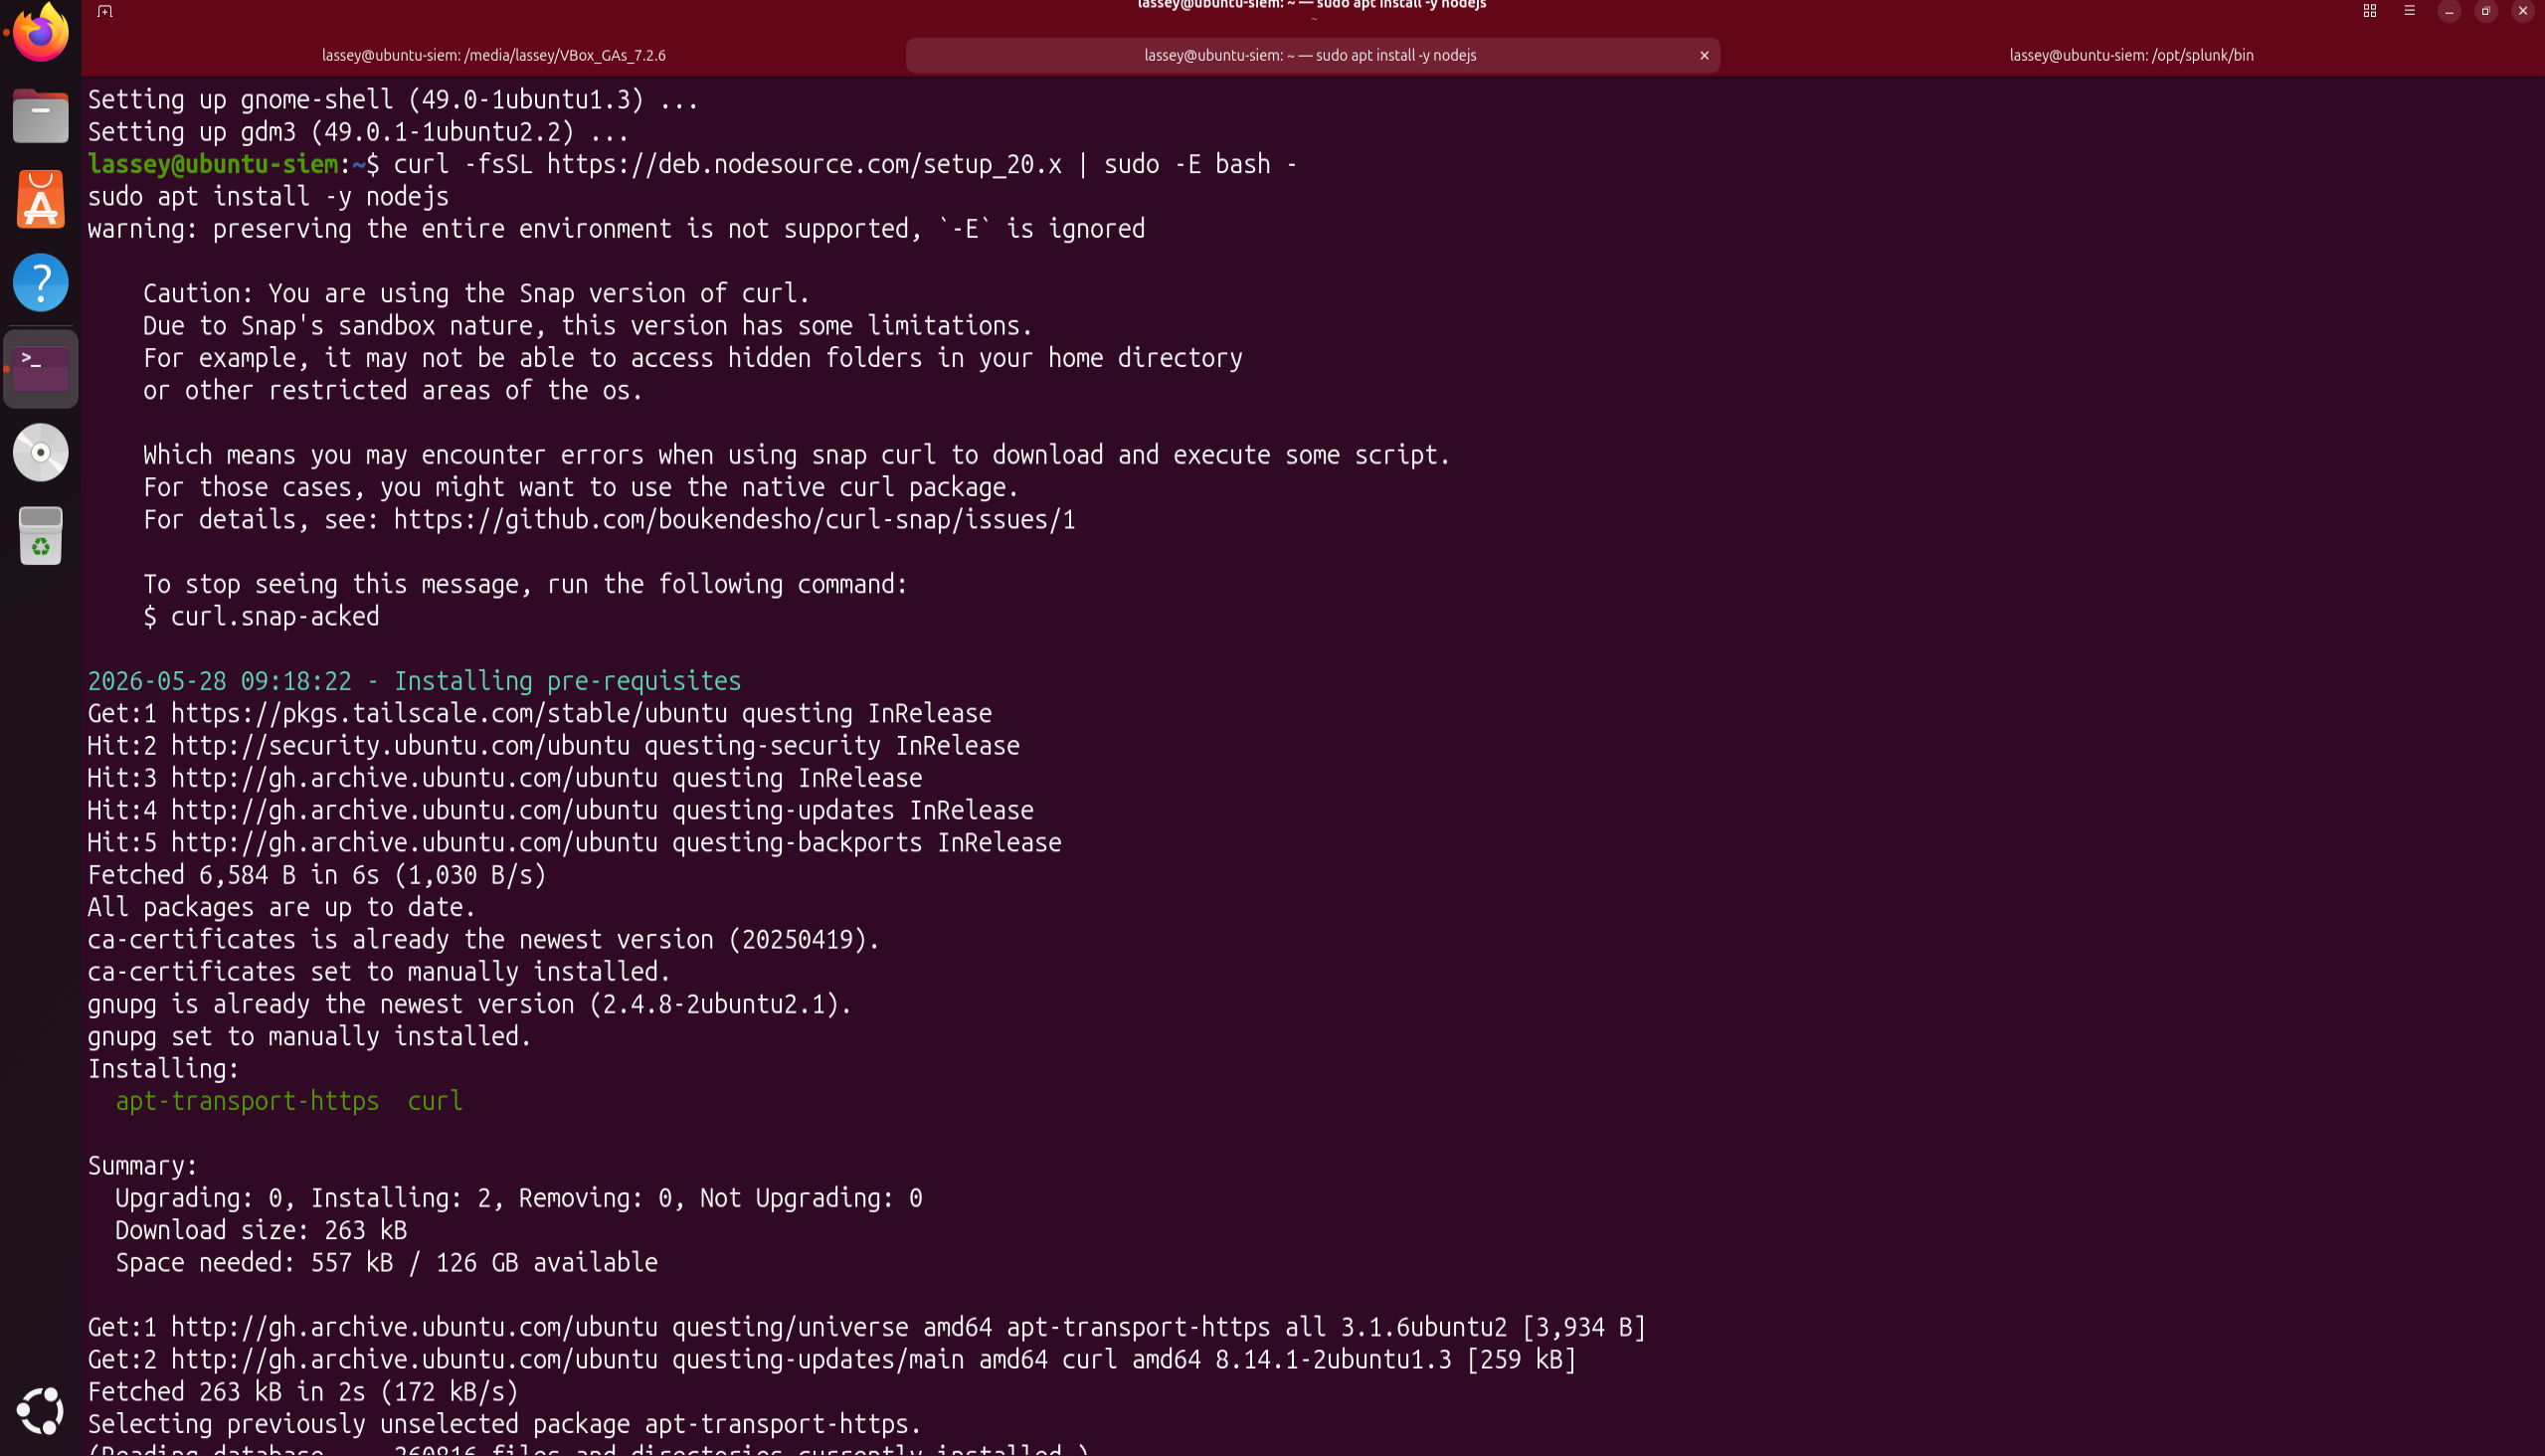
# Node.js (required for MCP servers)
curl -fsSL https://deb.nodesource.com/setup_20.x | sudo -E bash -
sudo apt install -y nodejs
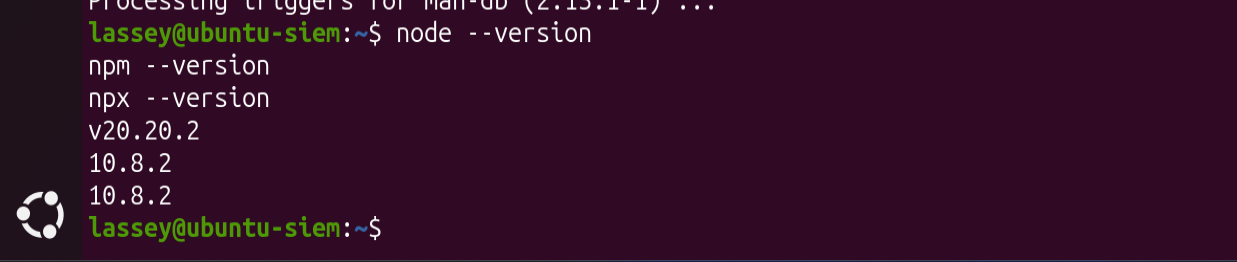
# Verify
node --version
npx --version
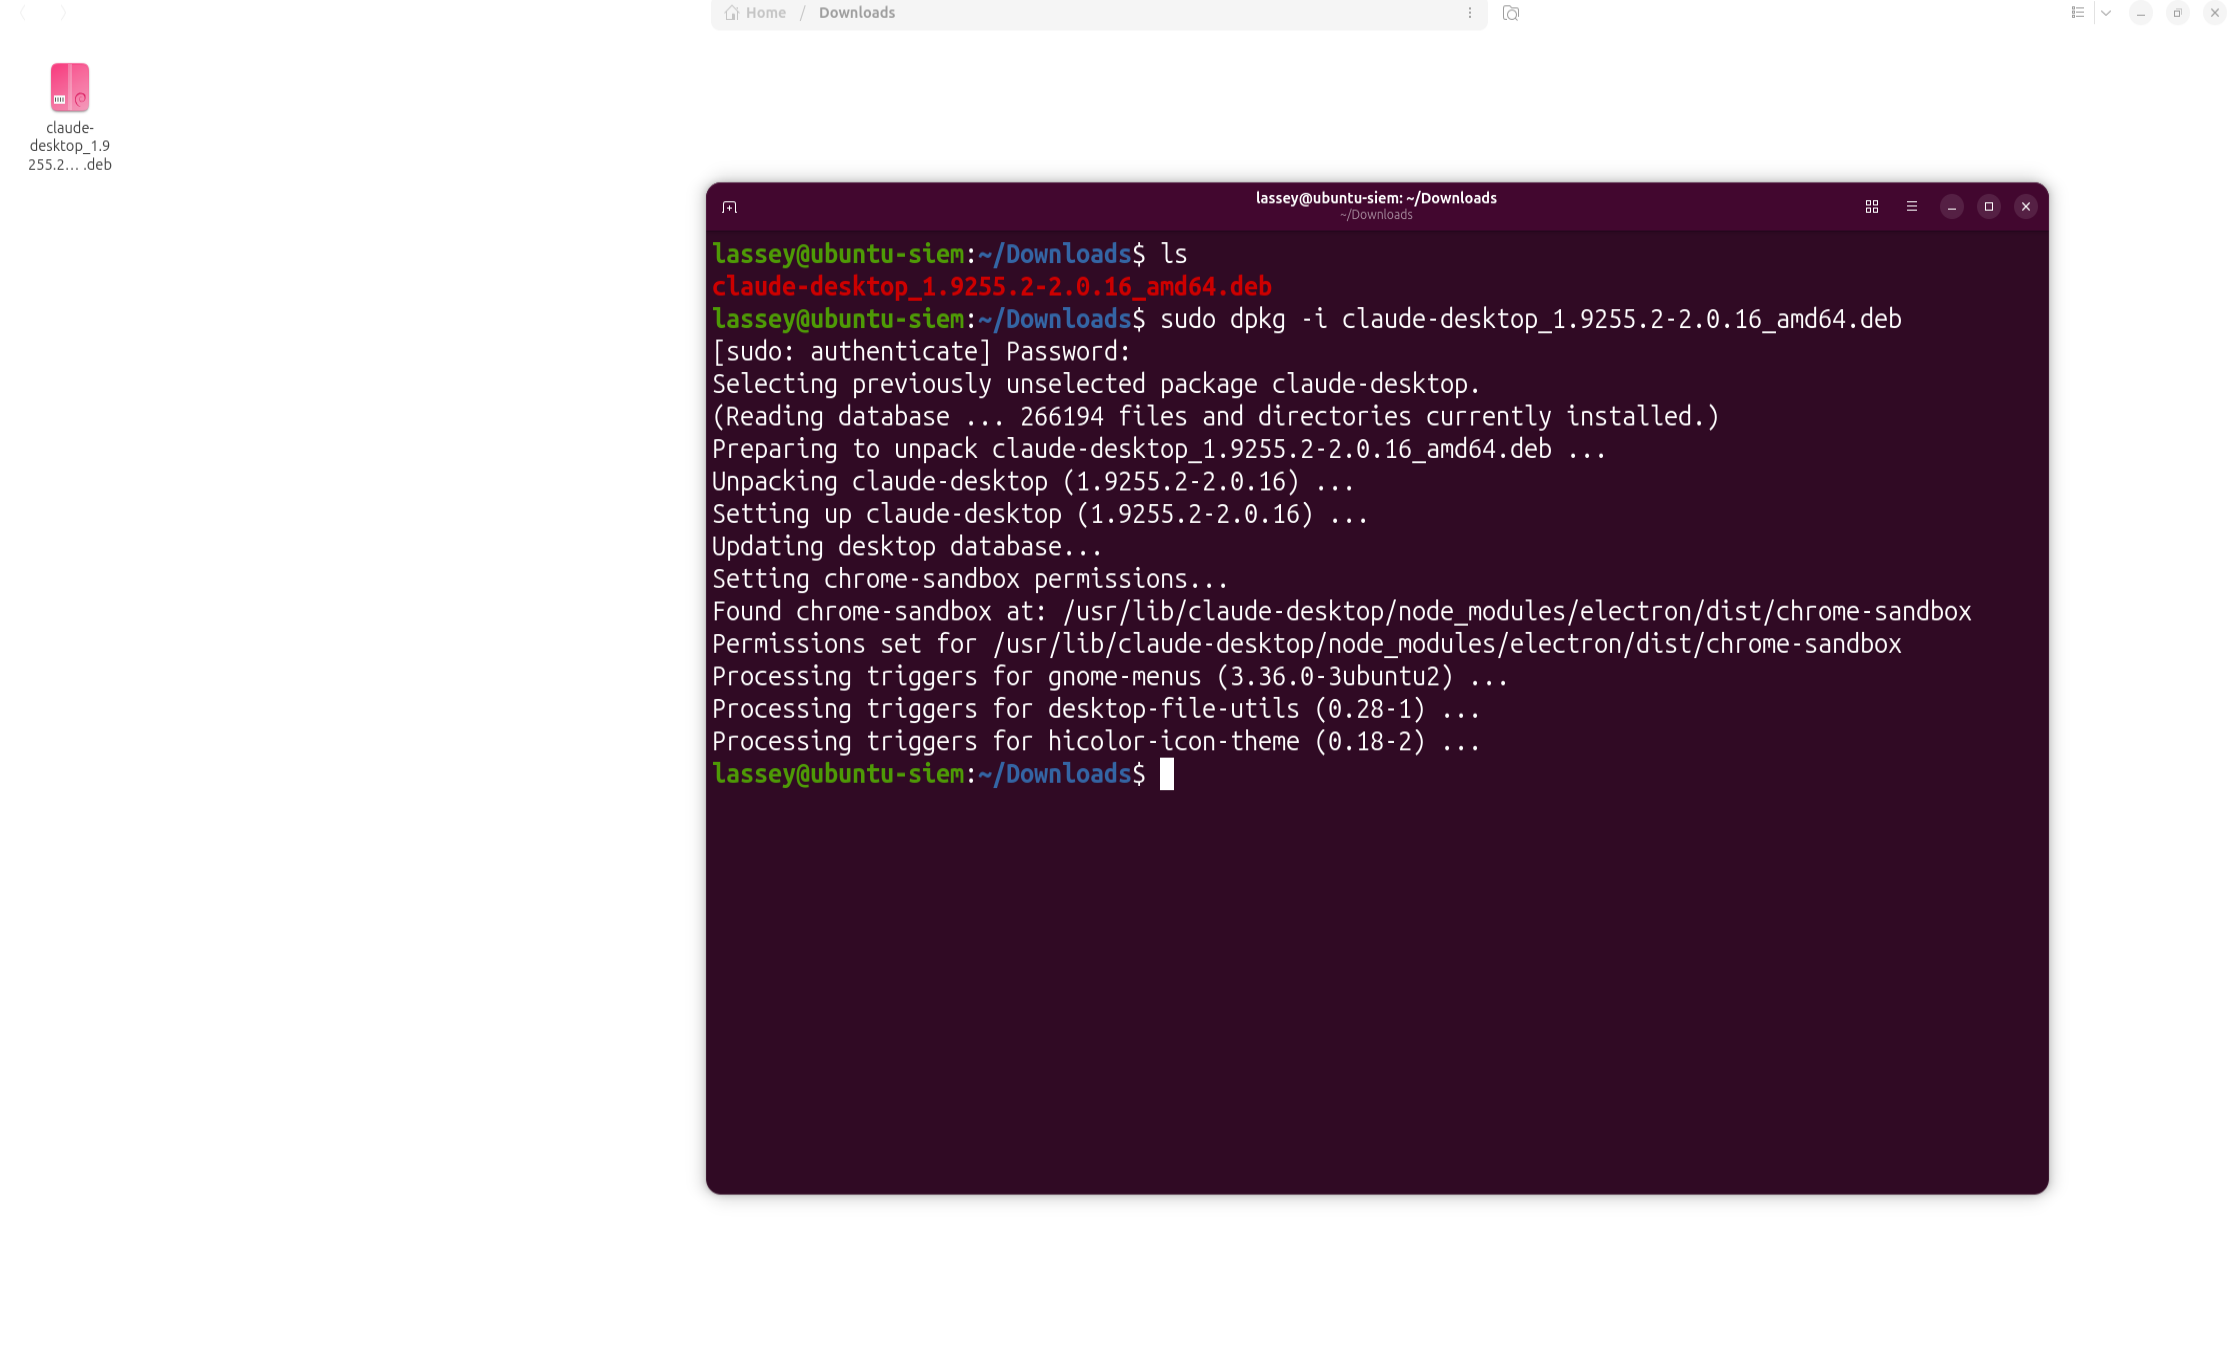
Downloaded the `.deb` from: [https://github.com/aaddrick/claude-desktop-debian/releases](https://github.com/aaddrick/claude-desktop-debian/releases)
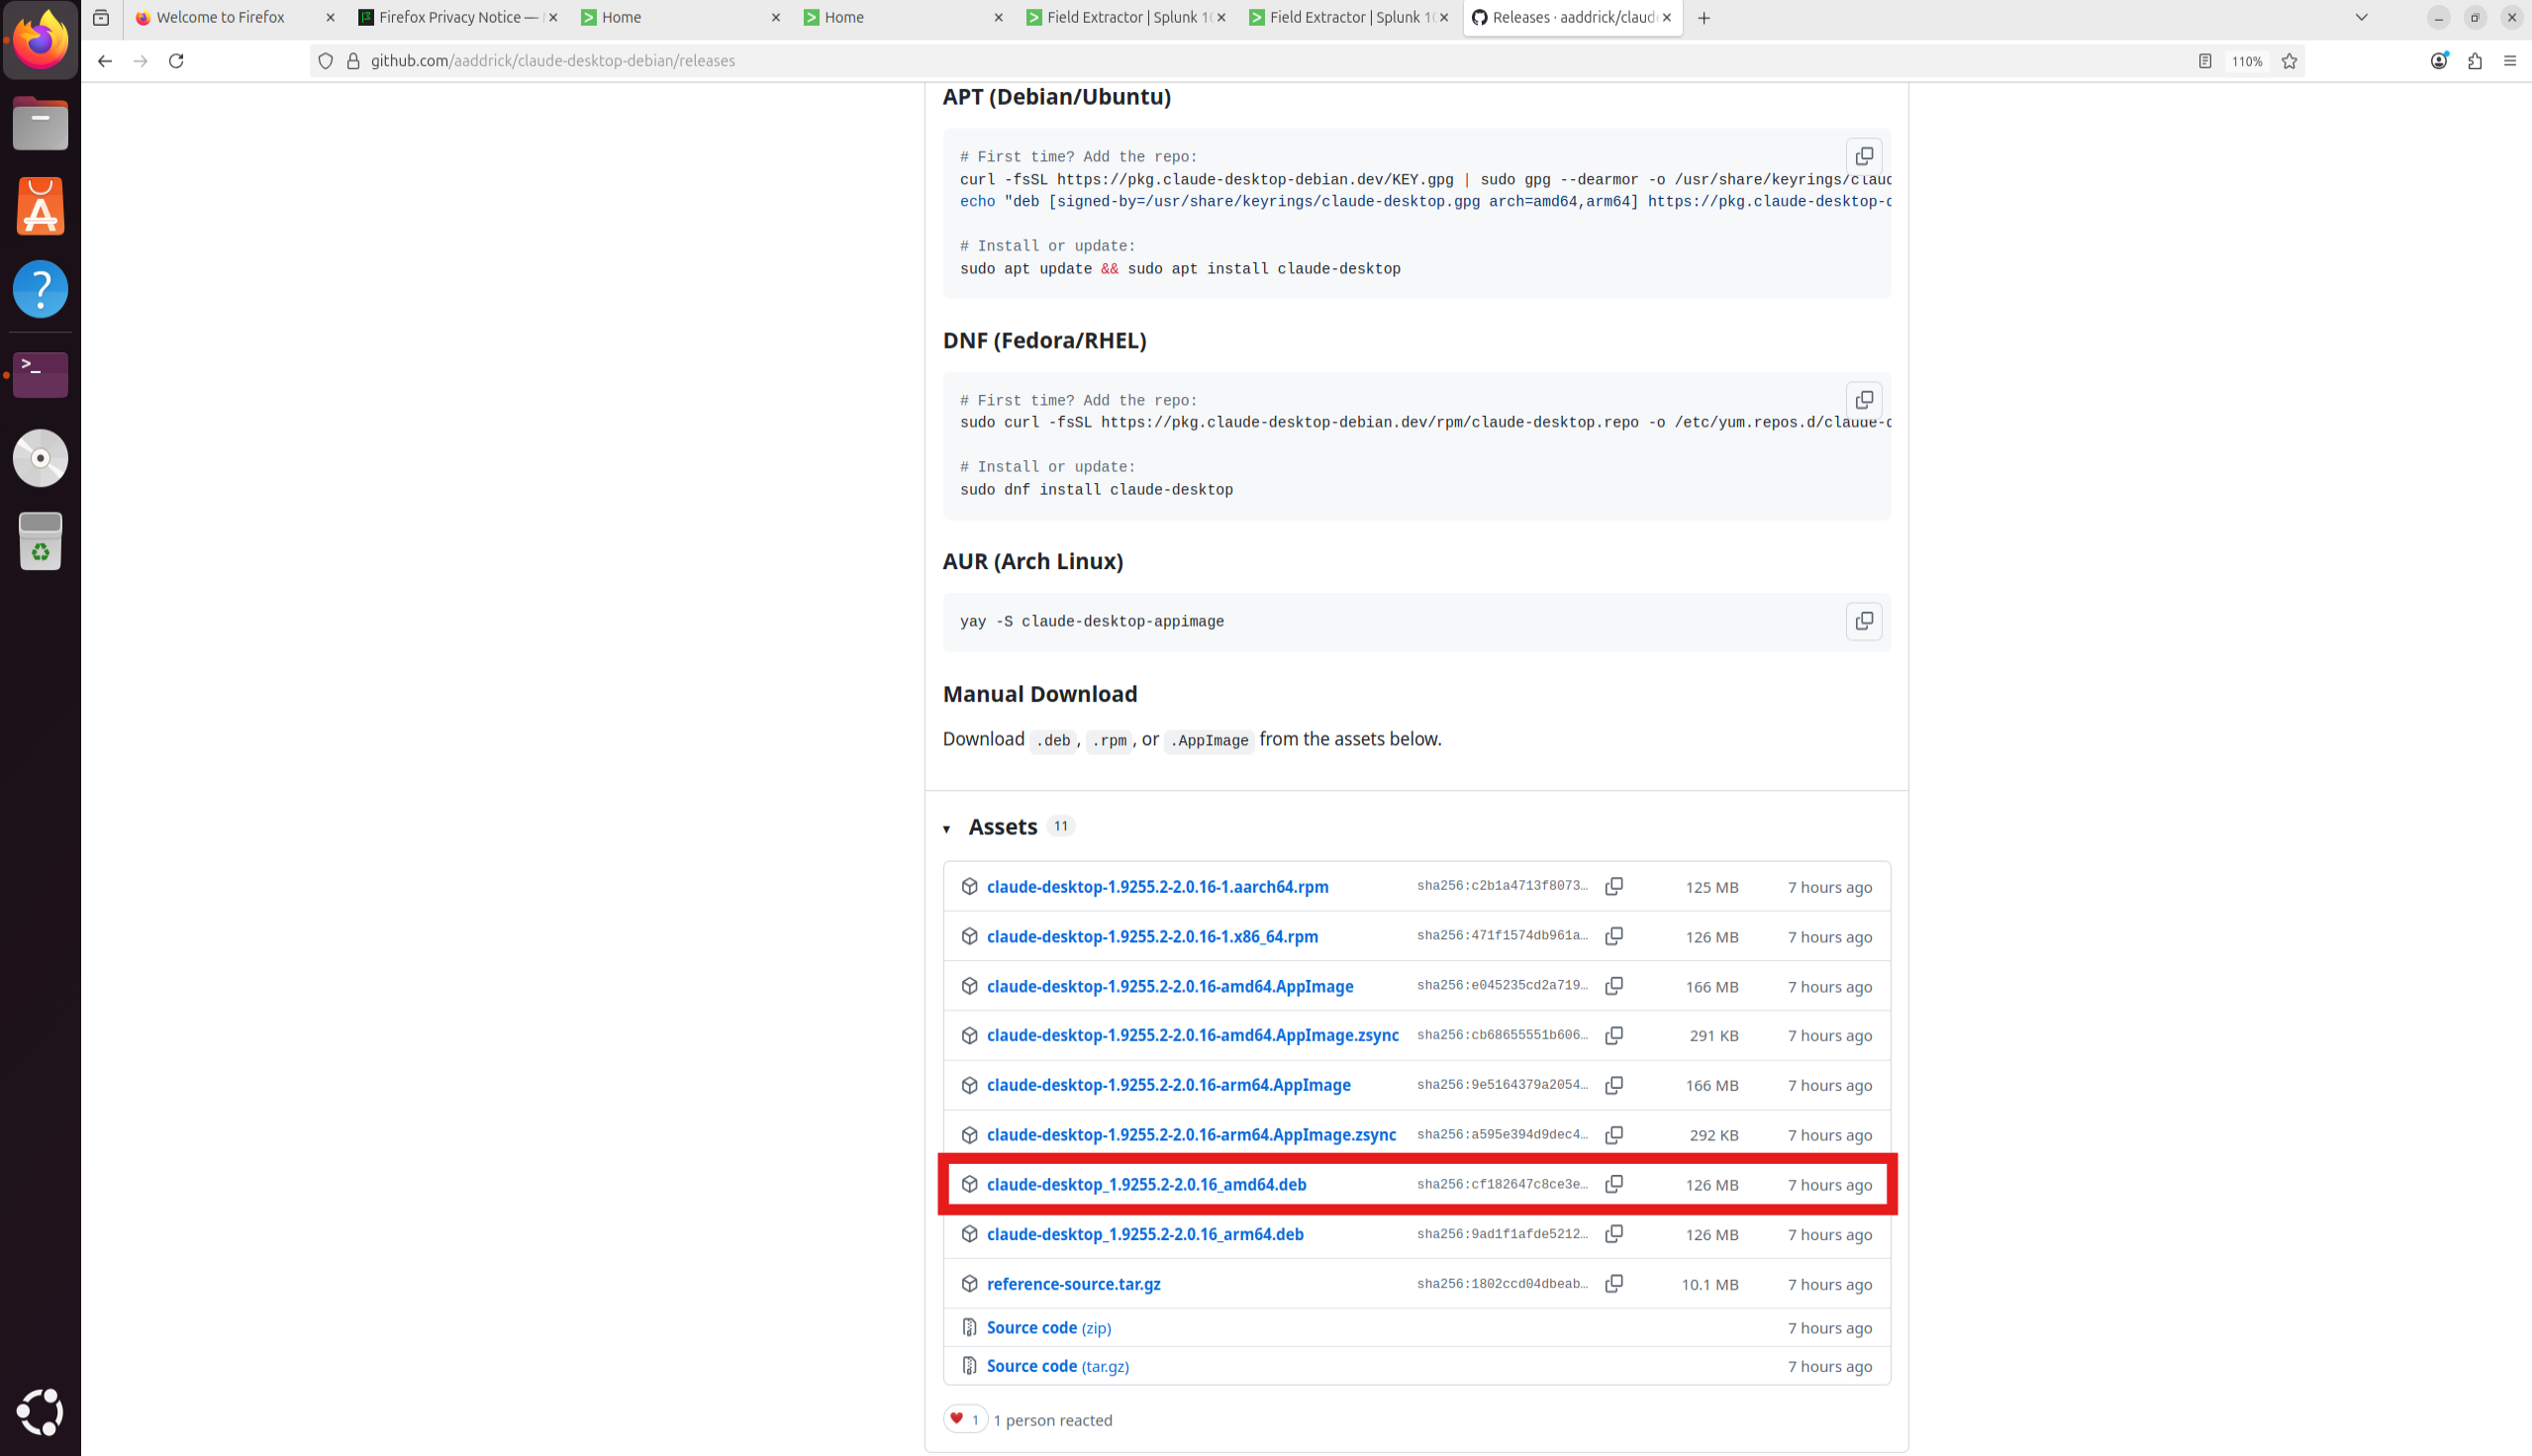
sudo dpkg -i claude-desktop-*-amd64.deb
### 9.2 Splunk MCP Server Setup
In Splunk Enterprise:
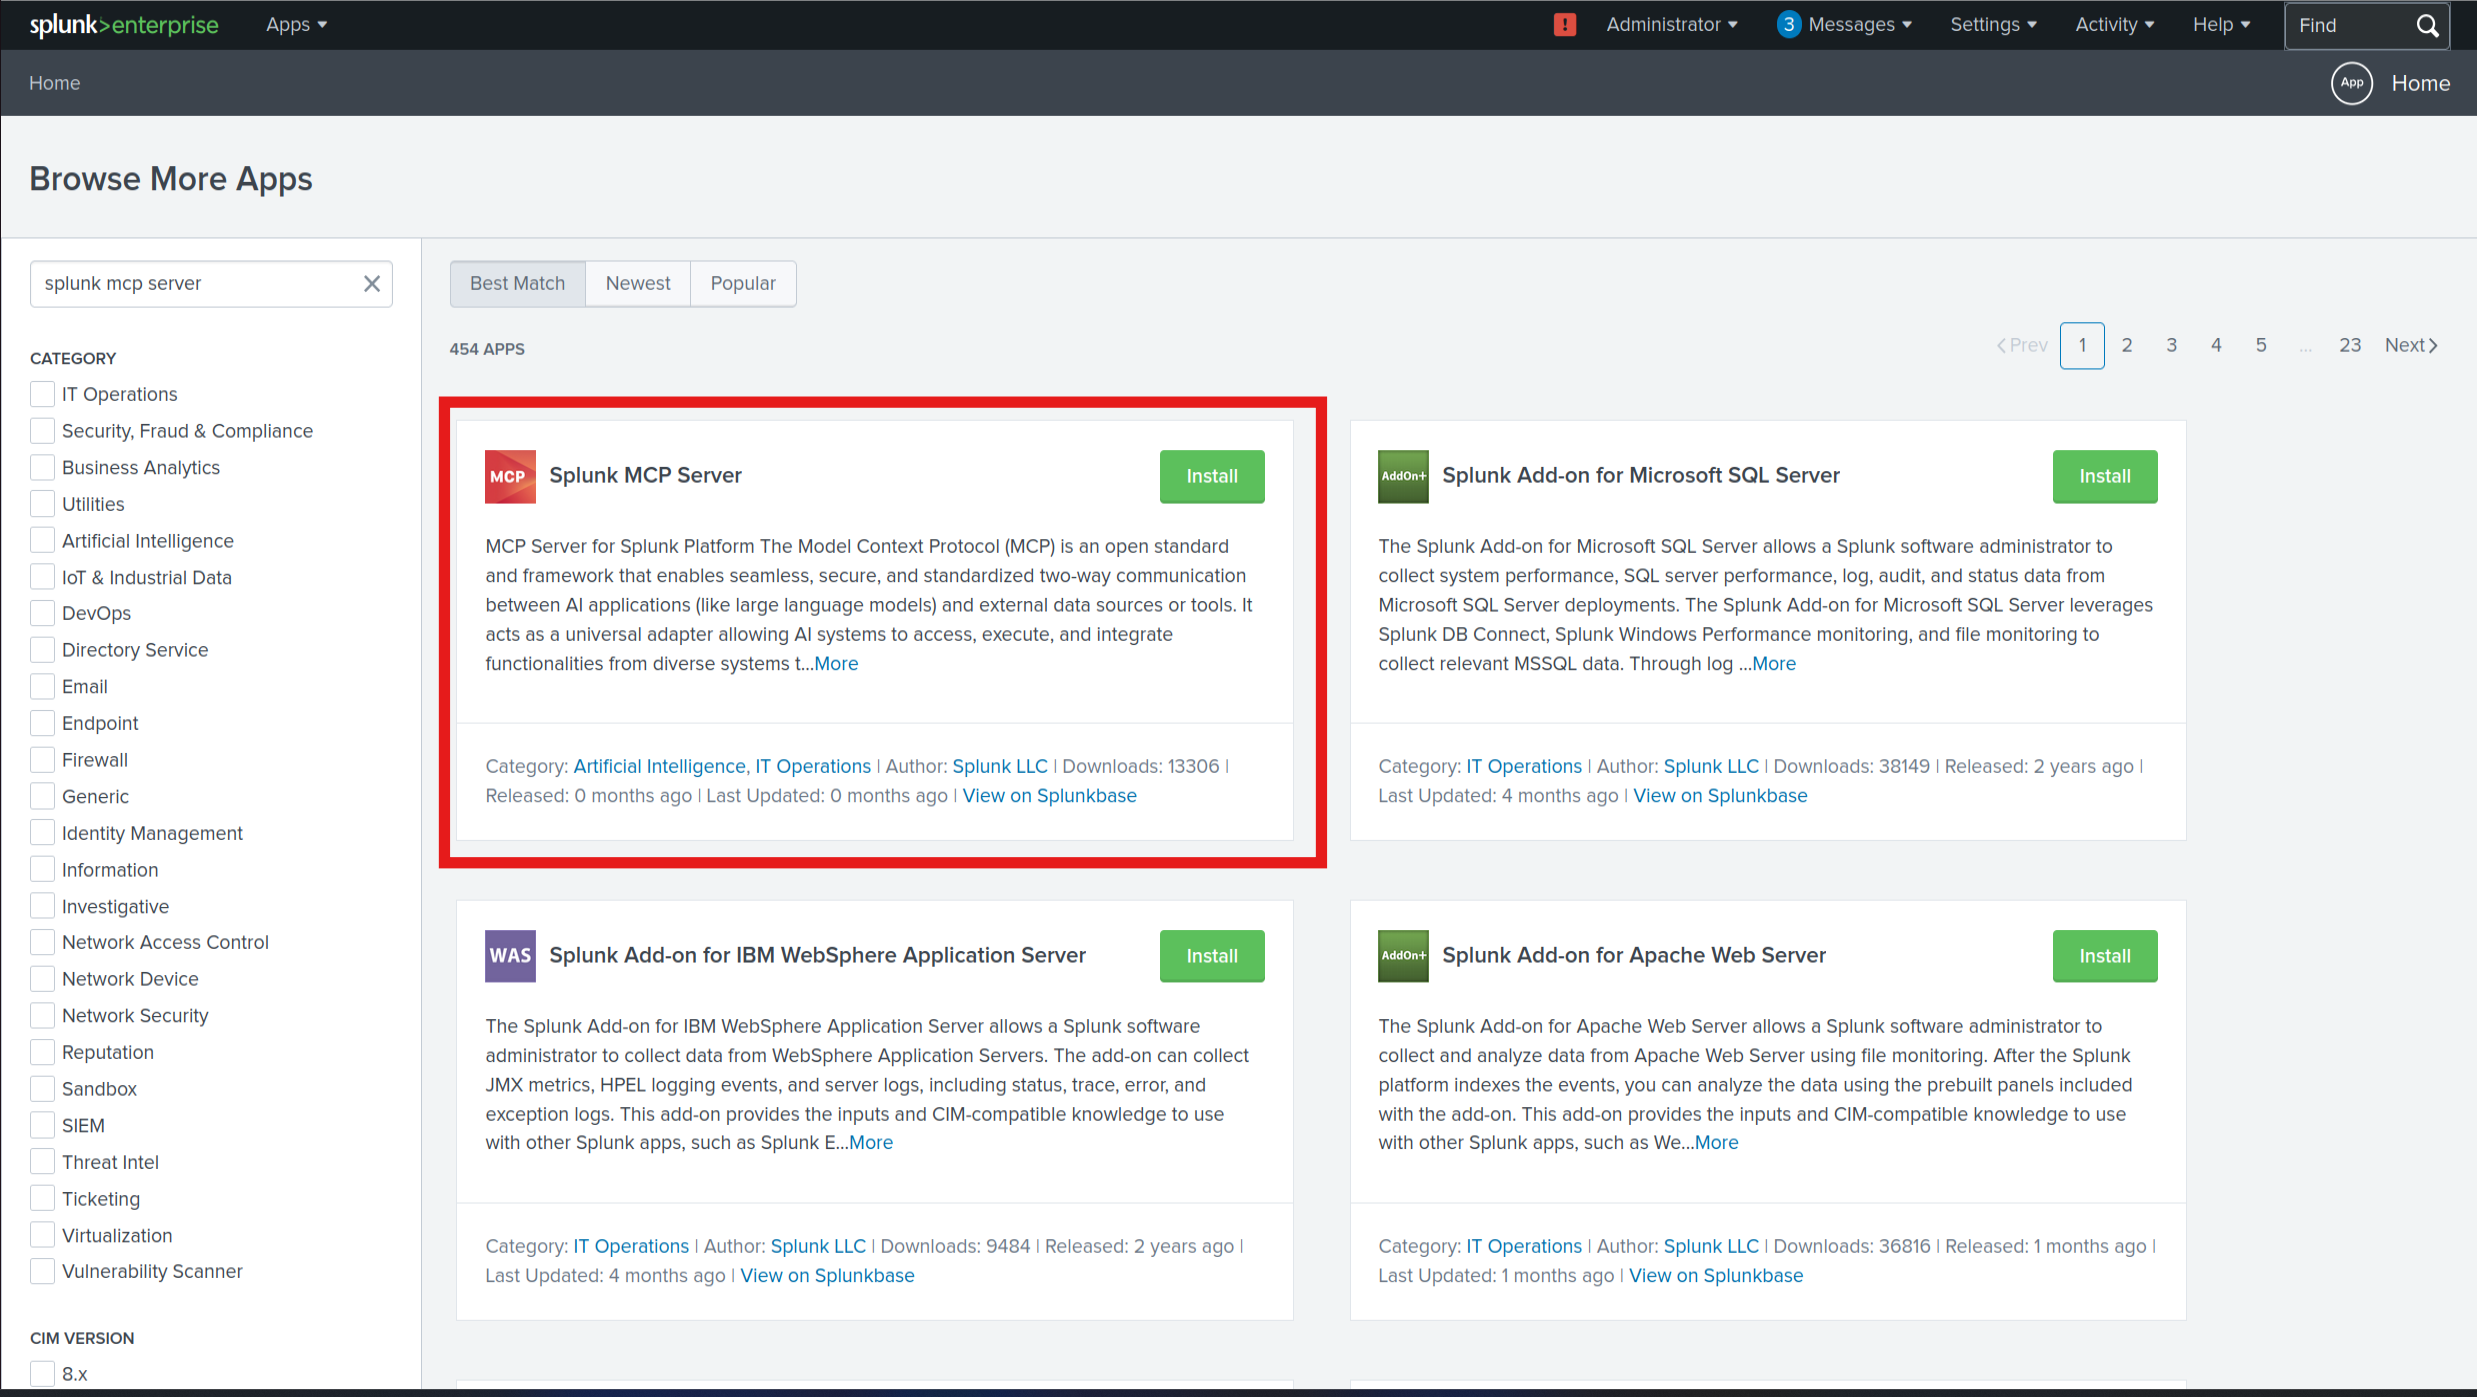
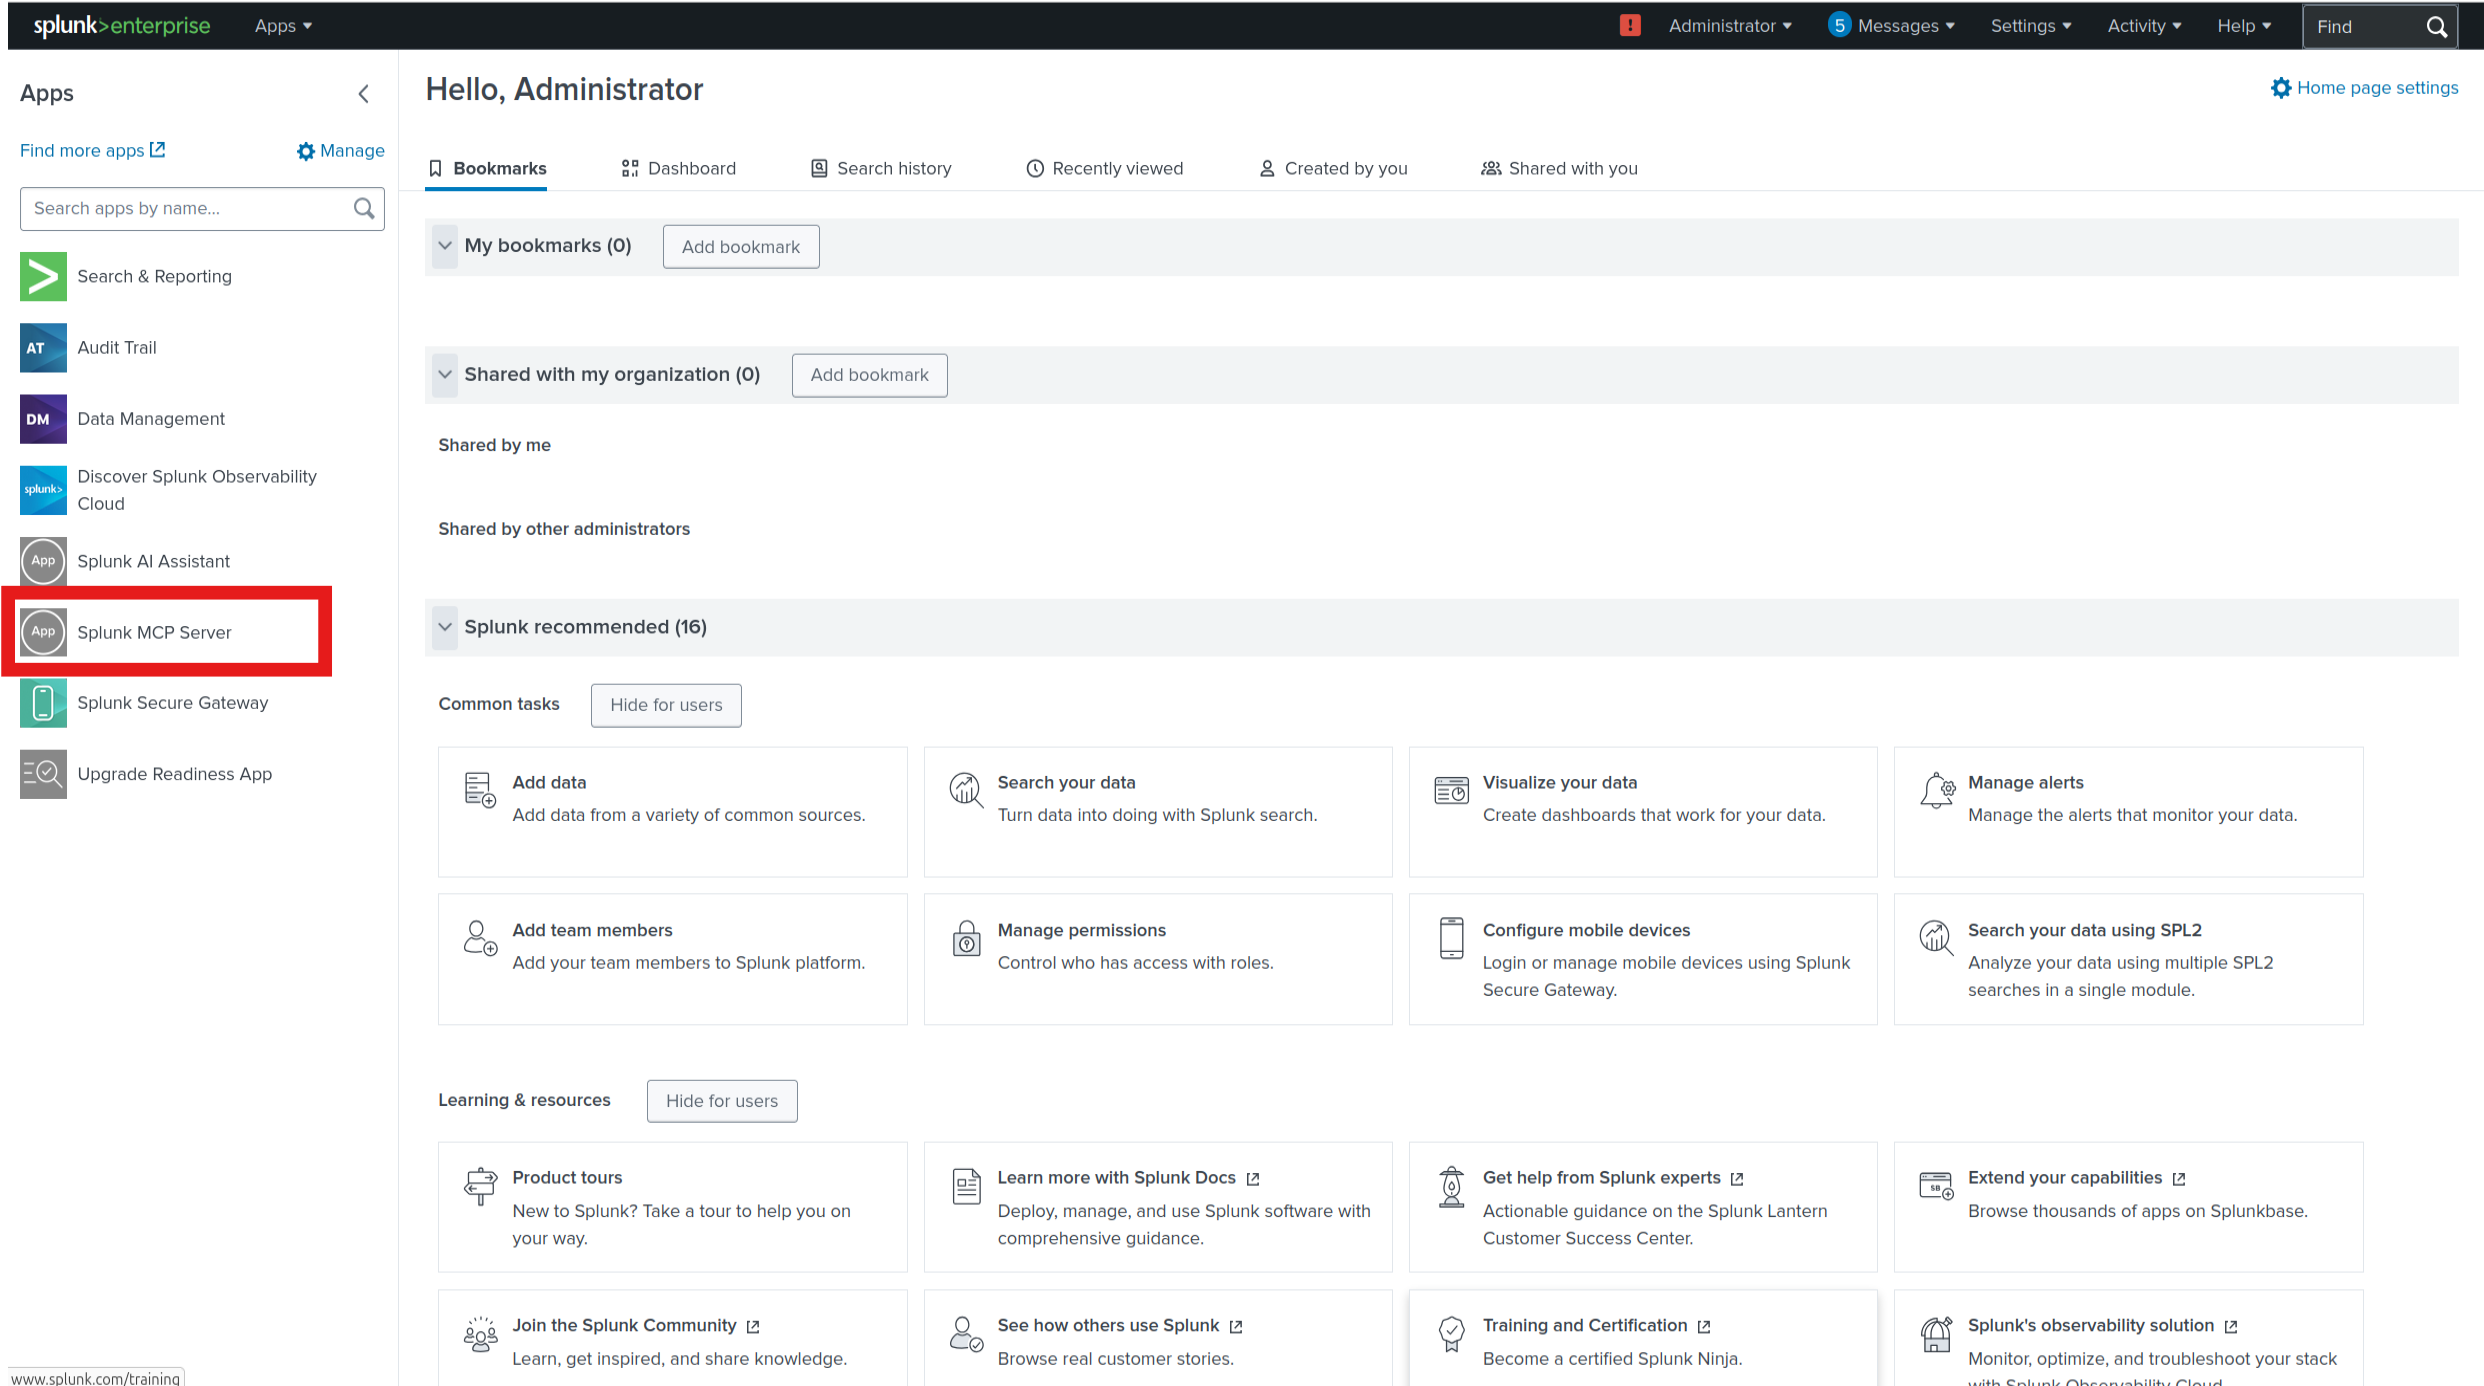
**1. Install the Splunk MCP Server app** from Splunkbase (search: "MCP Server")
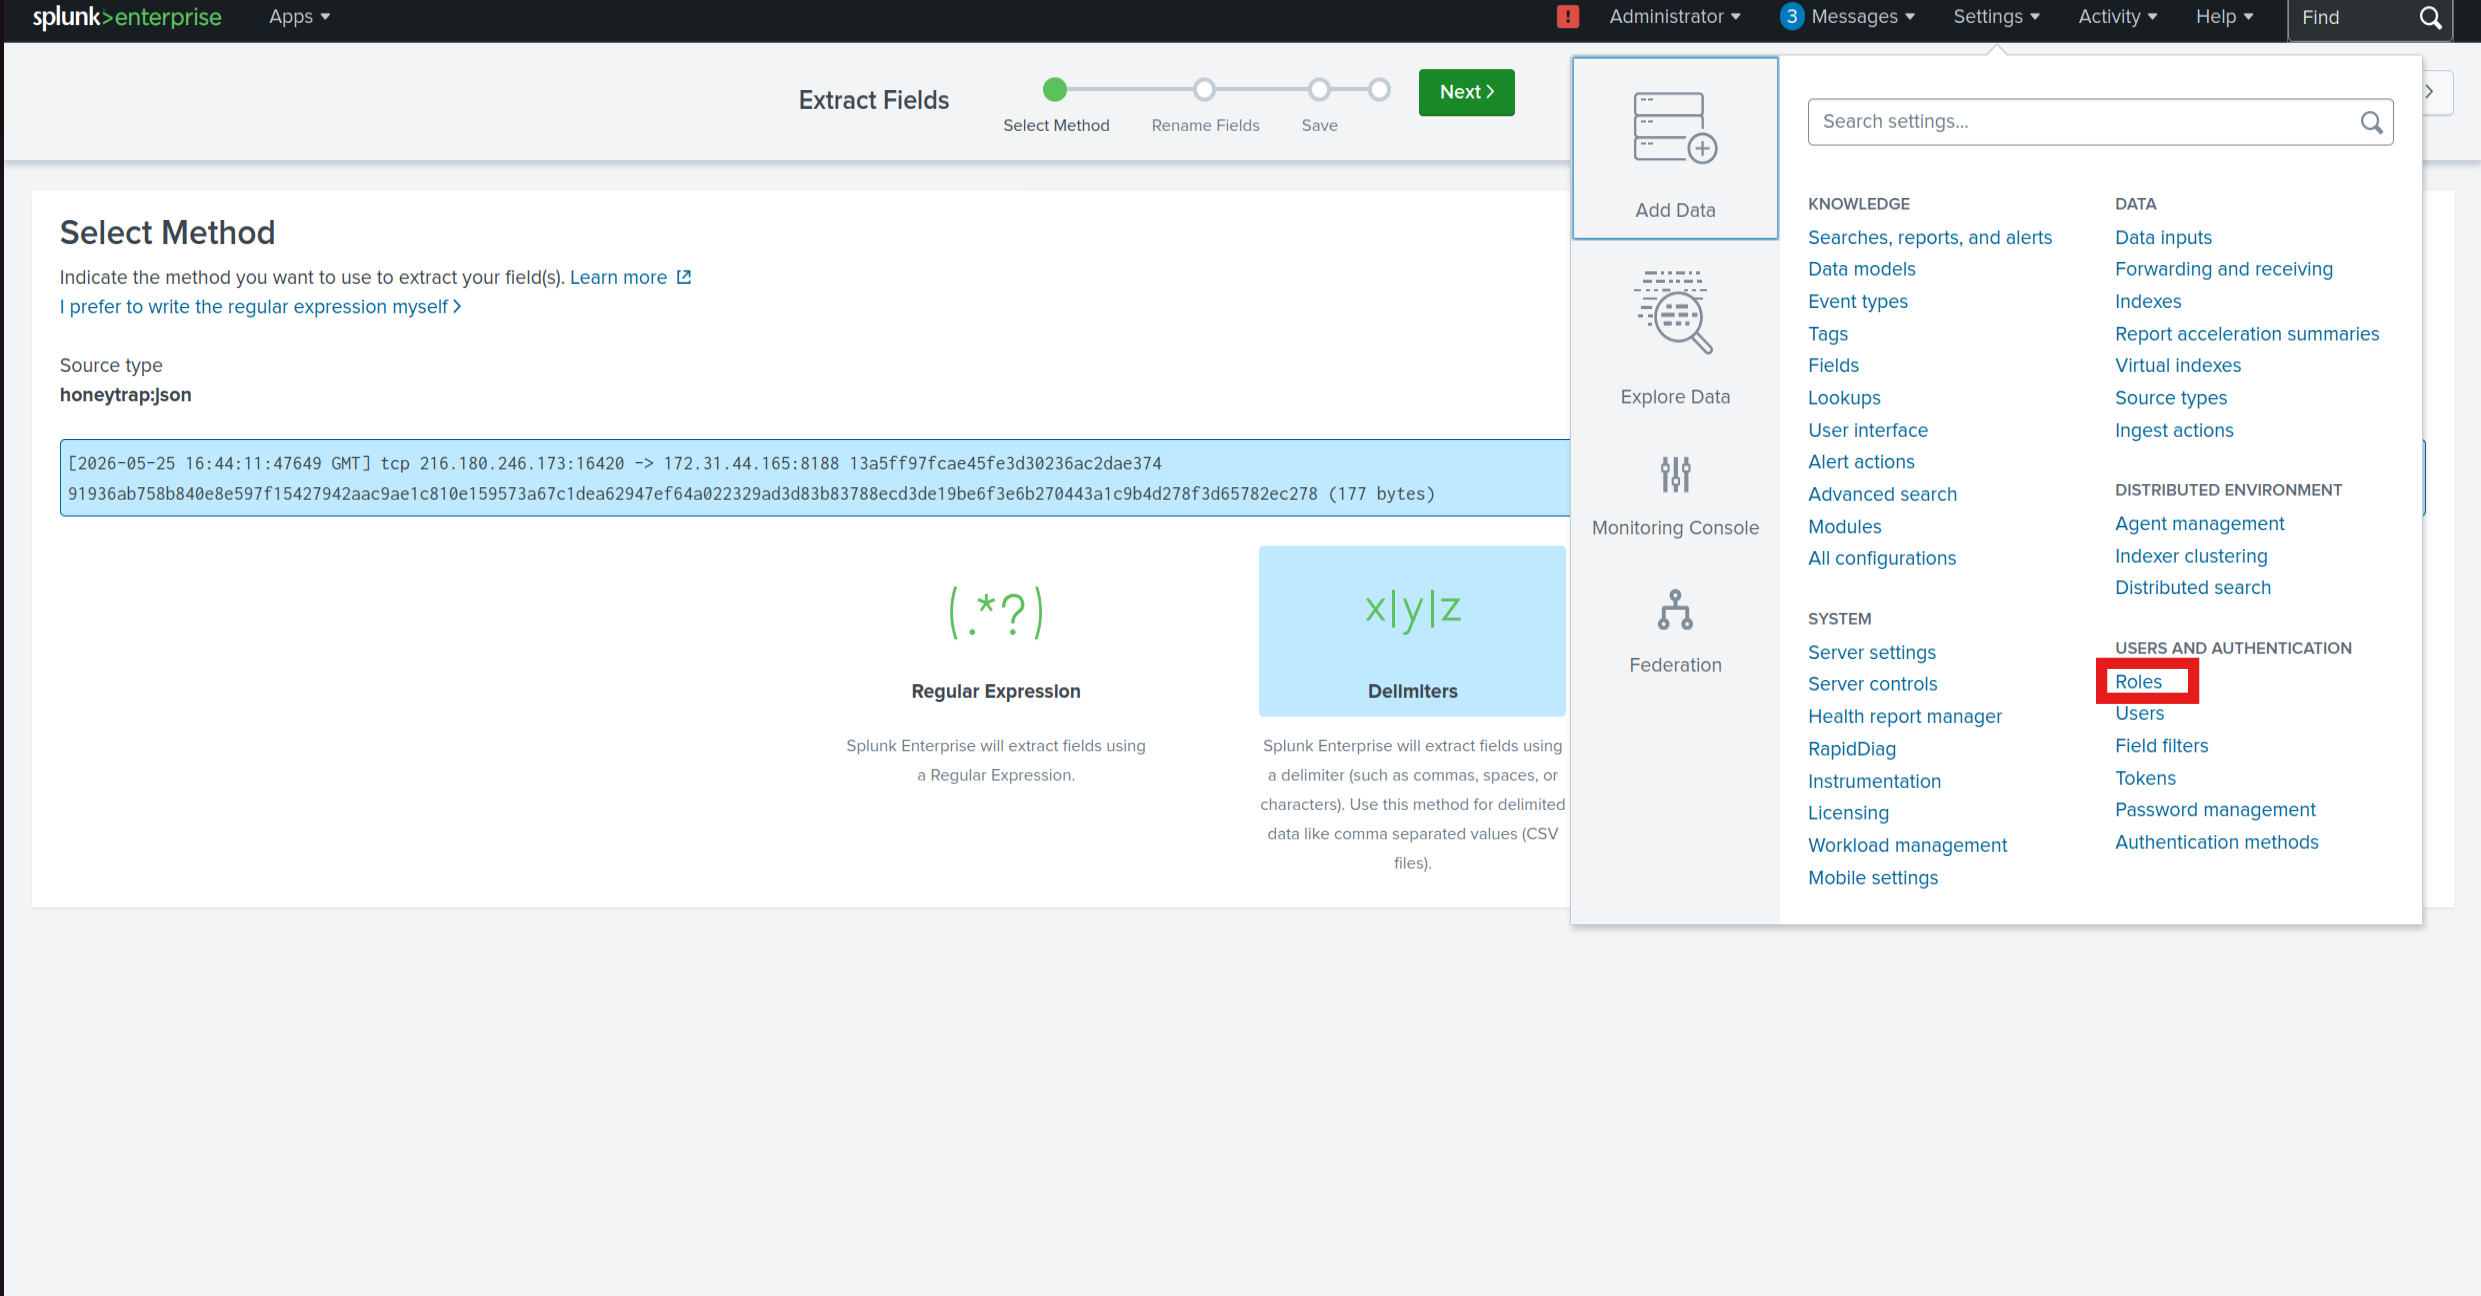
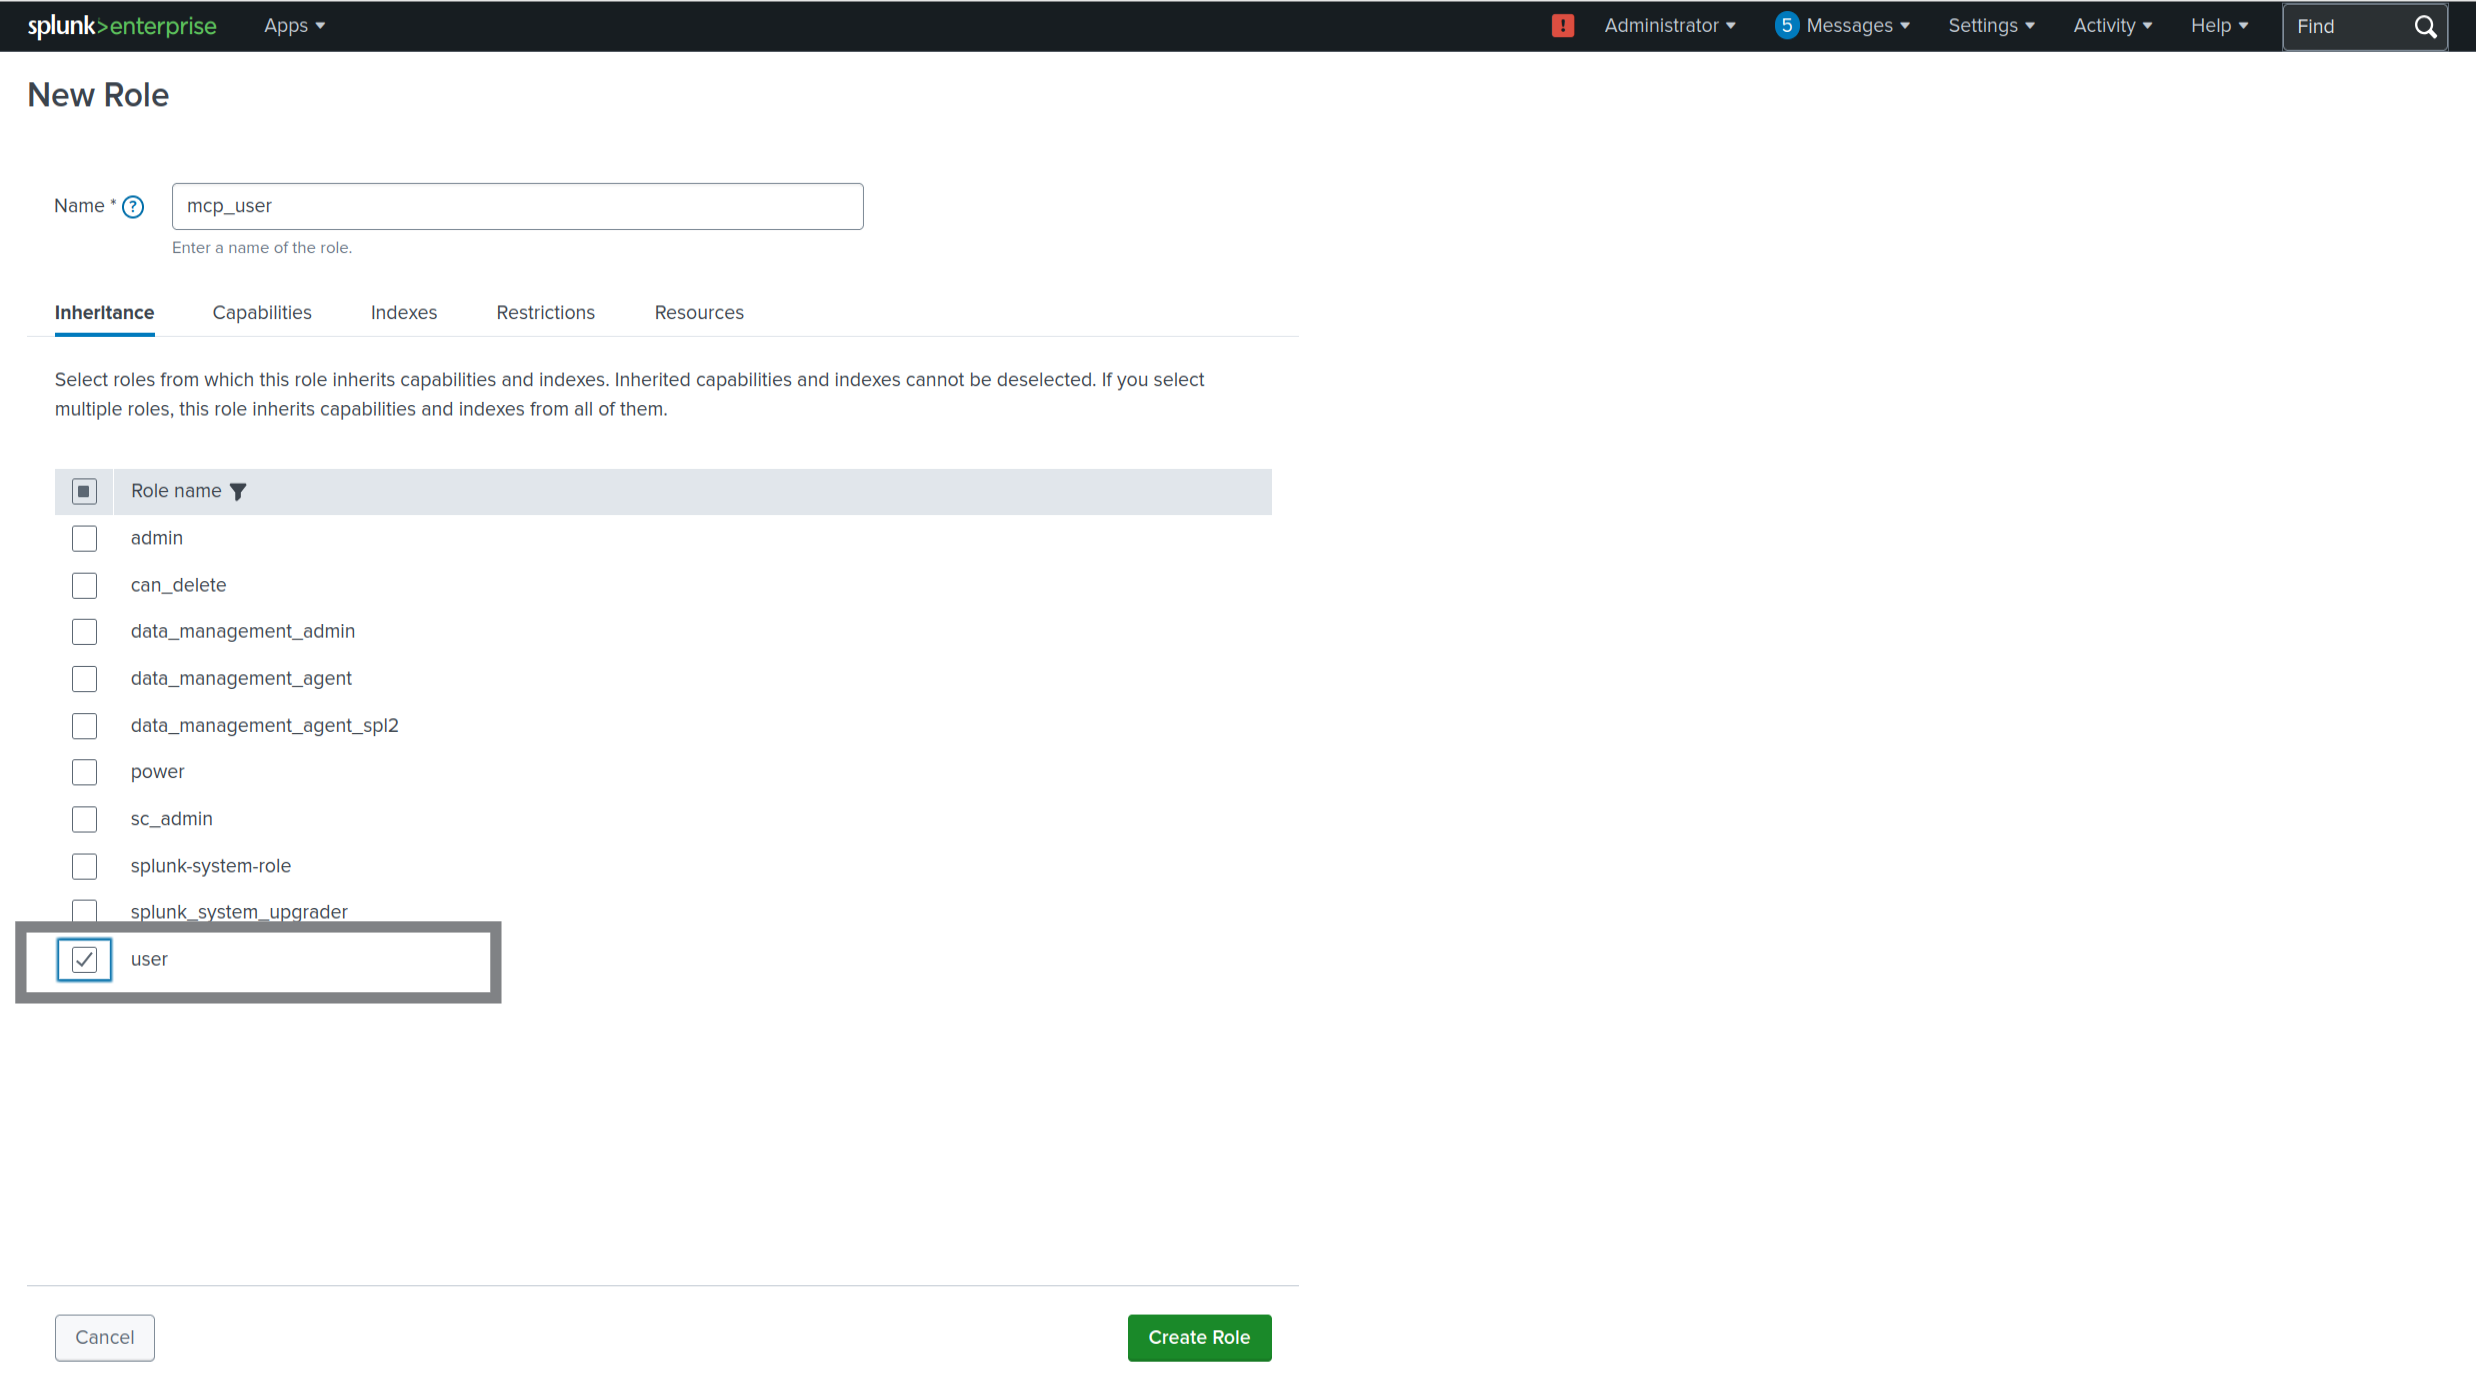
**2. Create an `mcp_user` role:**
Settings > Roles > New Role
- Inherit from: `user`
- Add capabilities: all `mcp_*` capabilities
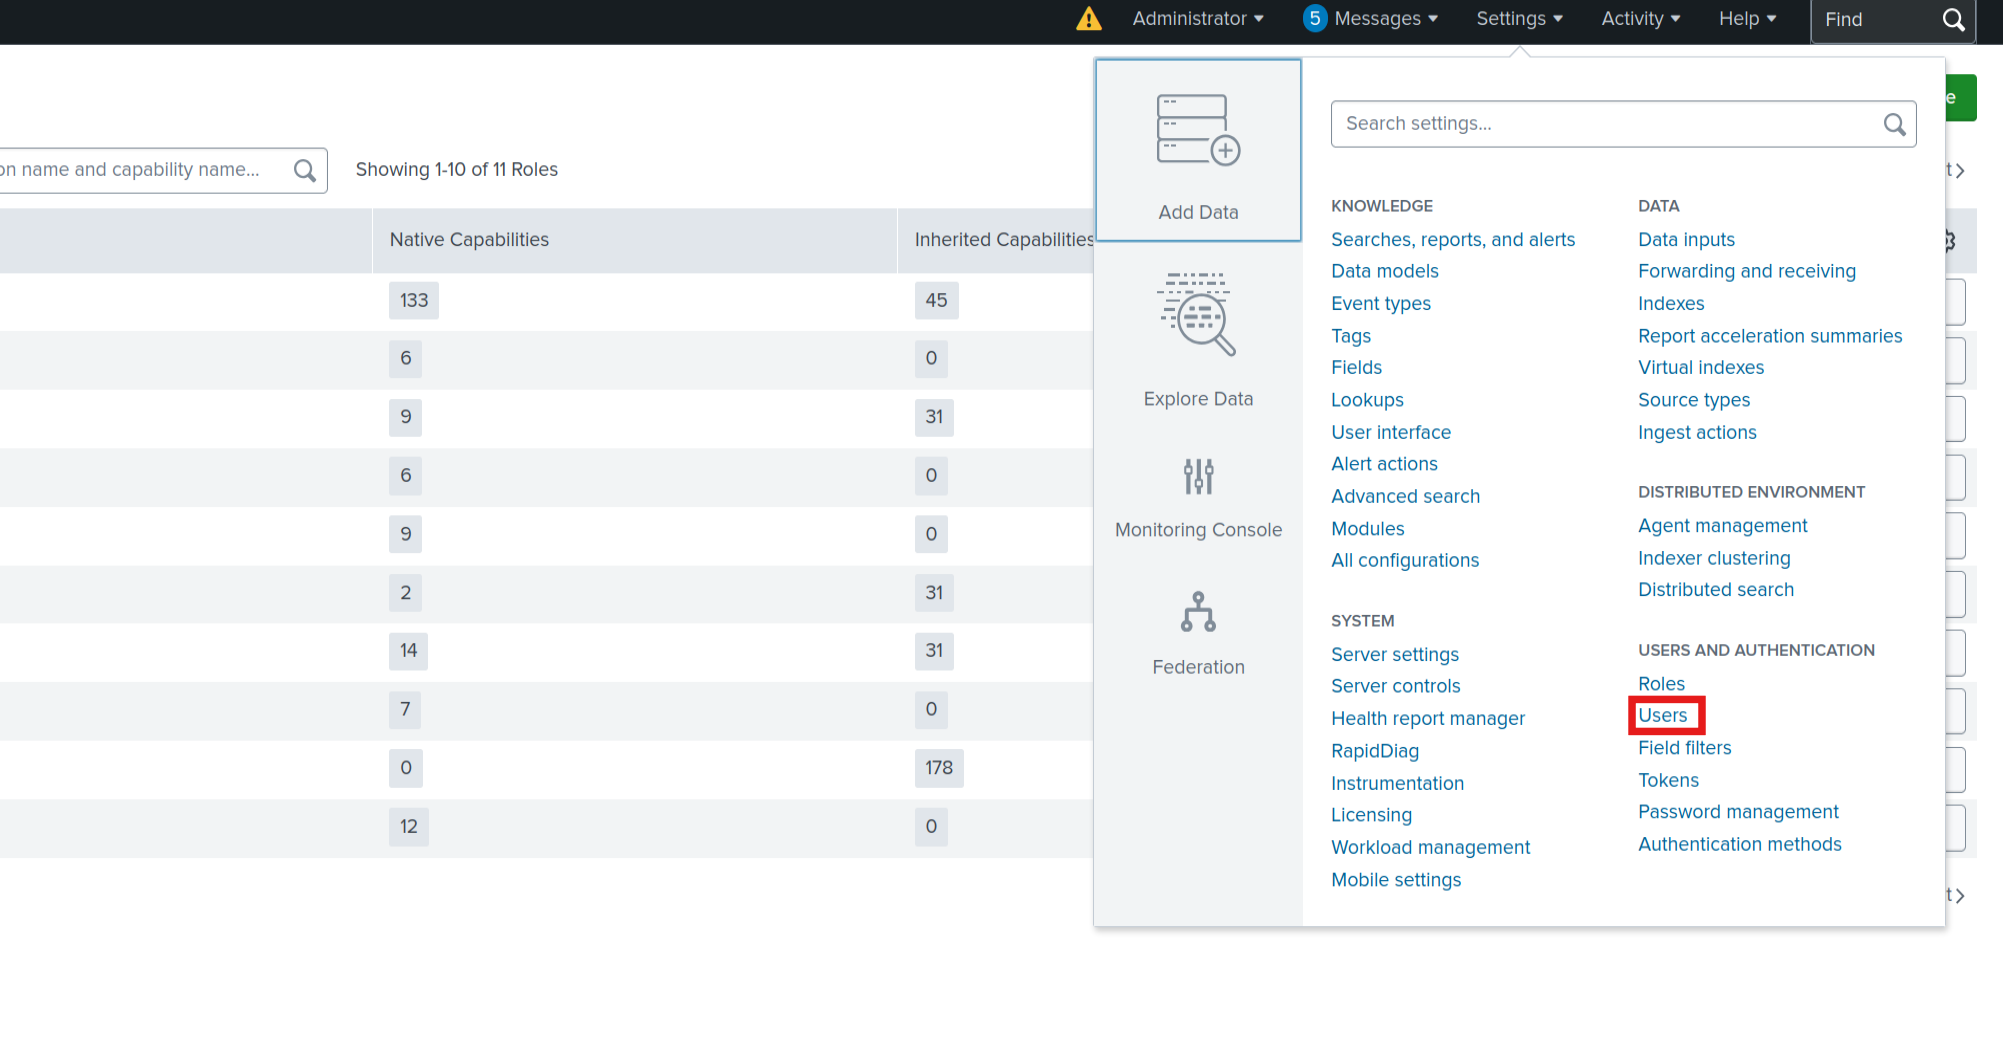
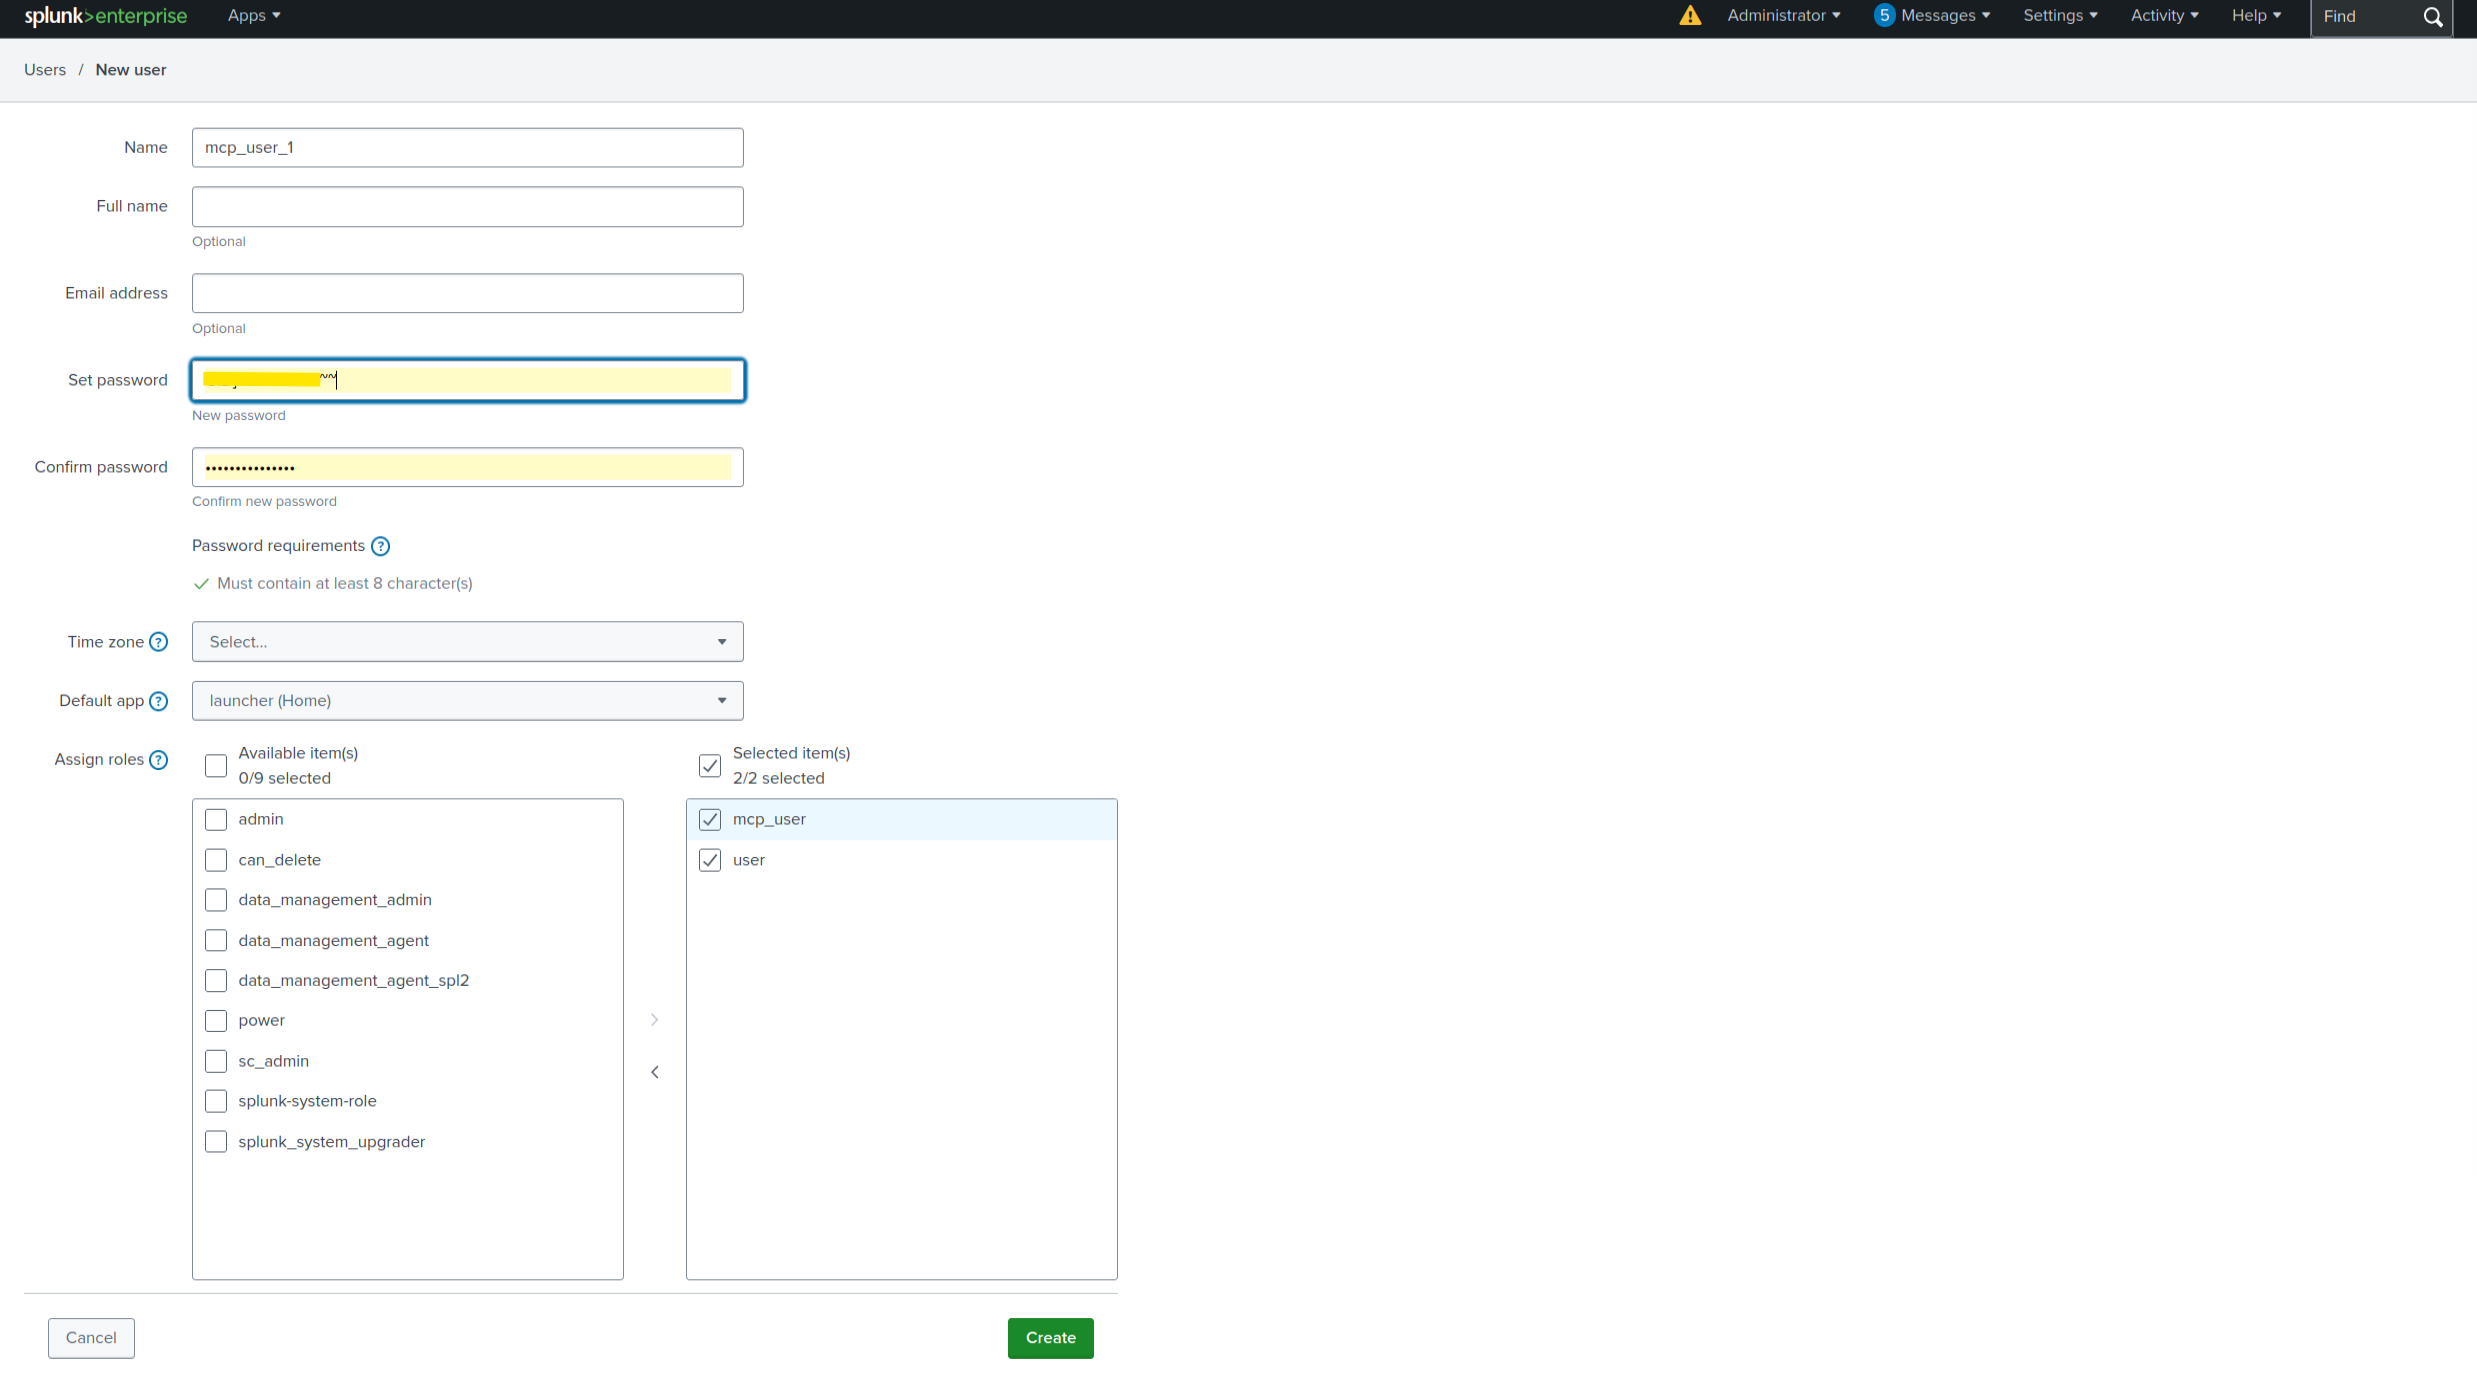
**3. Create an `mcp_user_1` account and assign it the `mcp_user` role**
  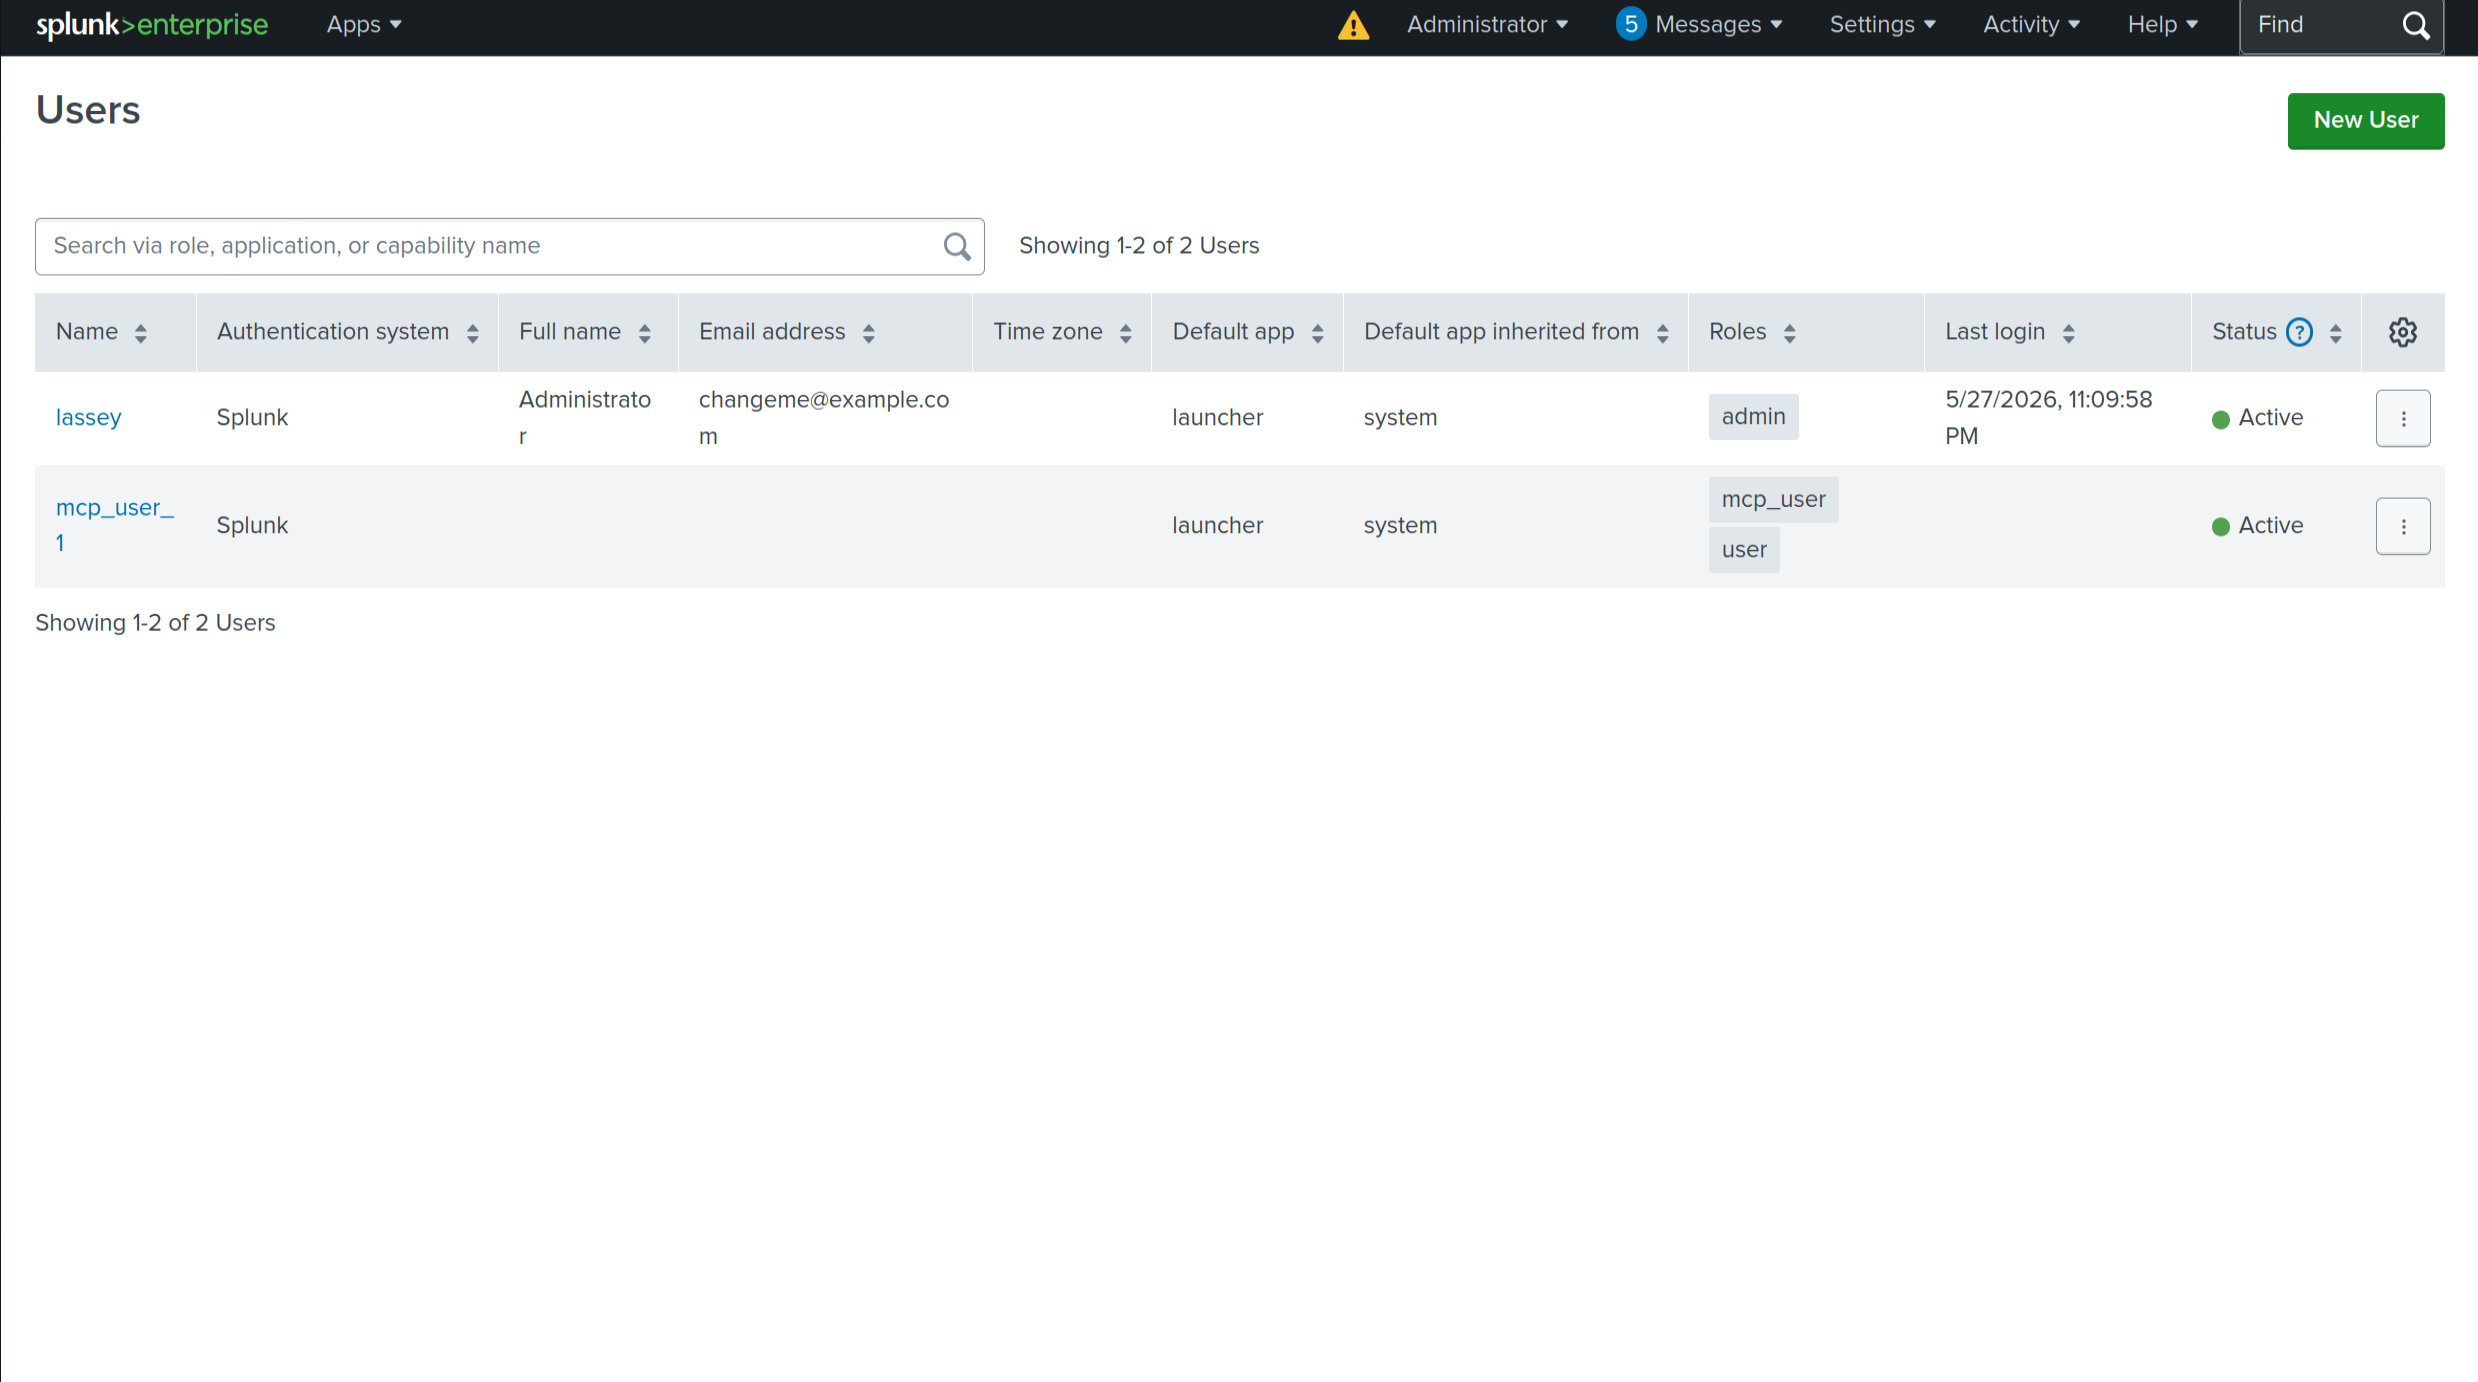
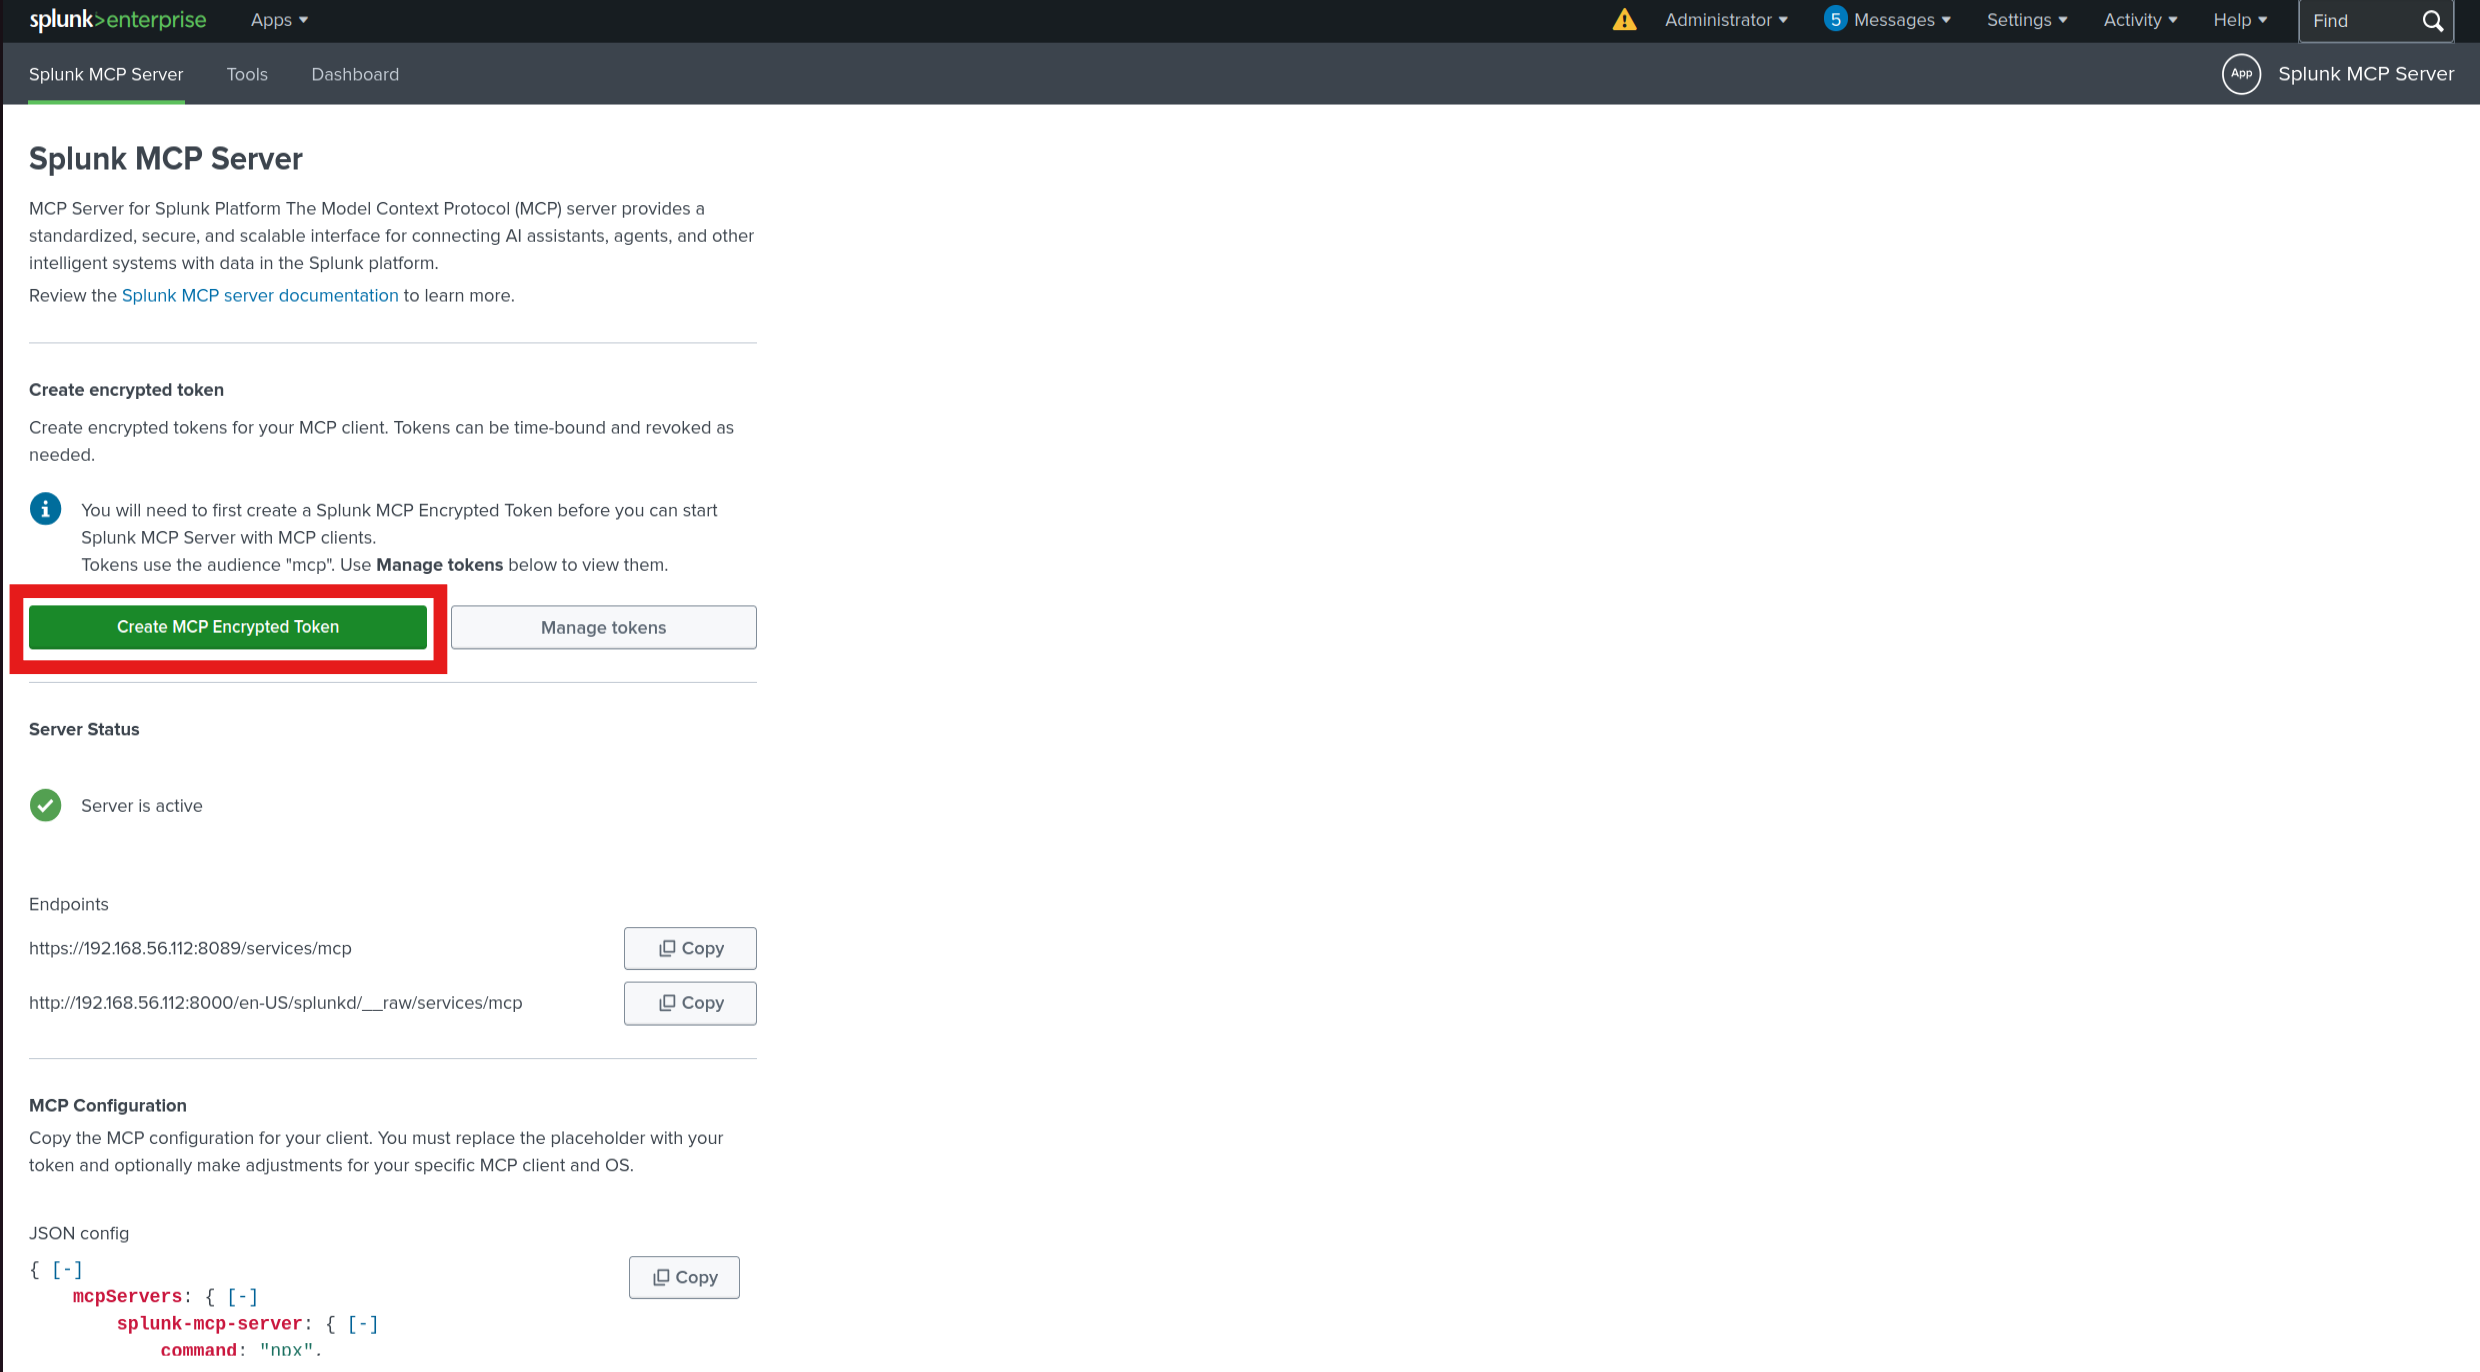
**4. Generate an MCP authentication token** for `mcp_user_1`:
Settings > Tokens > New Token
  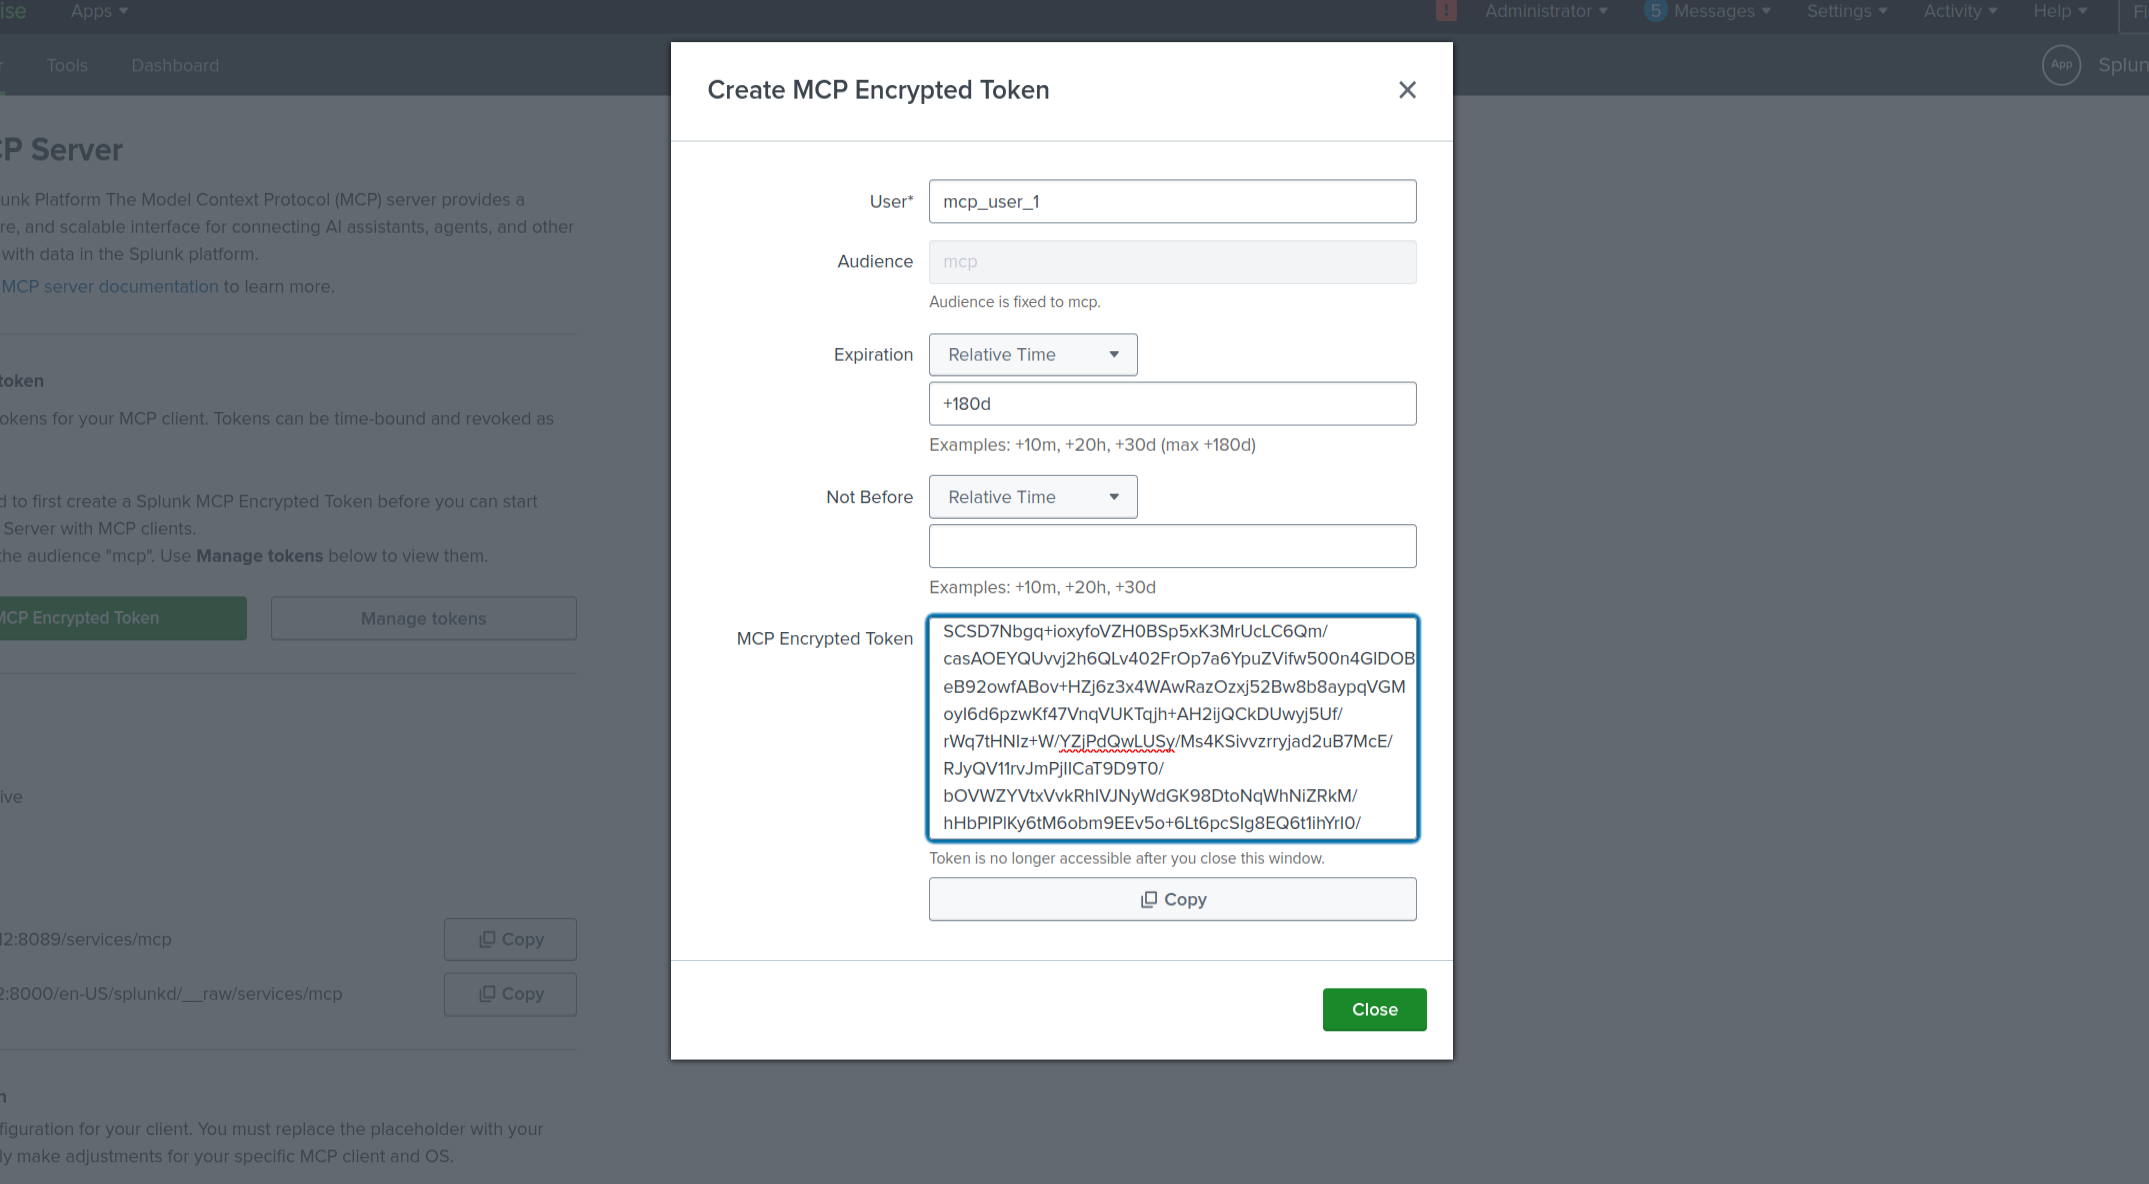
Copy the token immediately. Once you close that page it's gone forever and you'll have to generate a new one.
**5. Restart Splunk** (Settings > Server Controls > Restart Splunk)
### 9.3 MCP Configuration File
The Claude Desktop config lives at:
~/.config/Claude/claude_desktop_config.json
The full config.. with Virustotal MCP is in [`config/claude_desktop_config.json`](config/claude_desktop_config.json). Below shows that for Splunk.
{
"mcpServers": {
"splunk-mcp-server": {
"command": "npx",
"args": [
"-y",
"mcp-remote",
"https://192.168.56.112:8089/services/mcp",
"--header",
"Authorization: Bearer "
],
"env": {
"NODE_TLS_REJECT_UNAUTHORIZED": "0"
}
}
}
}
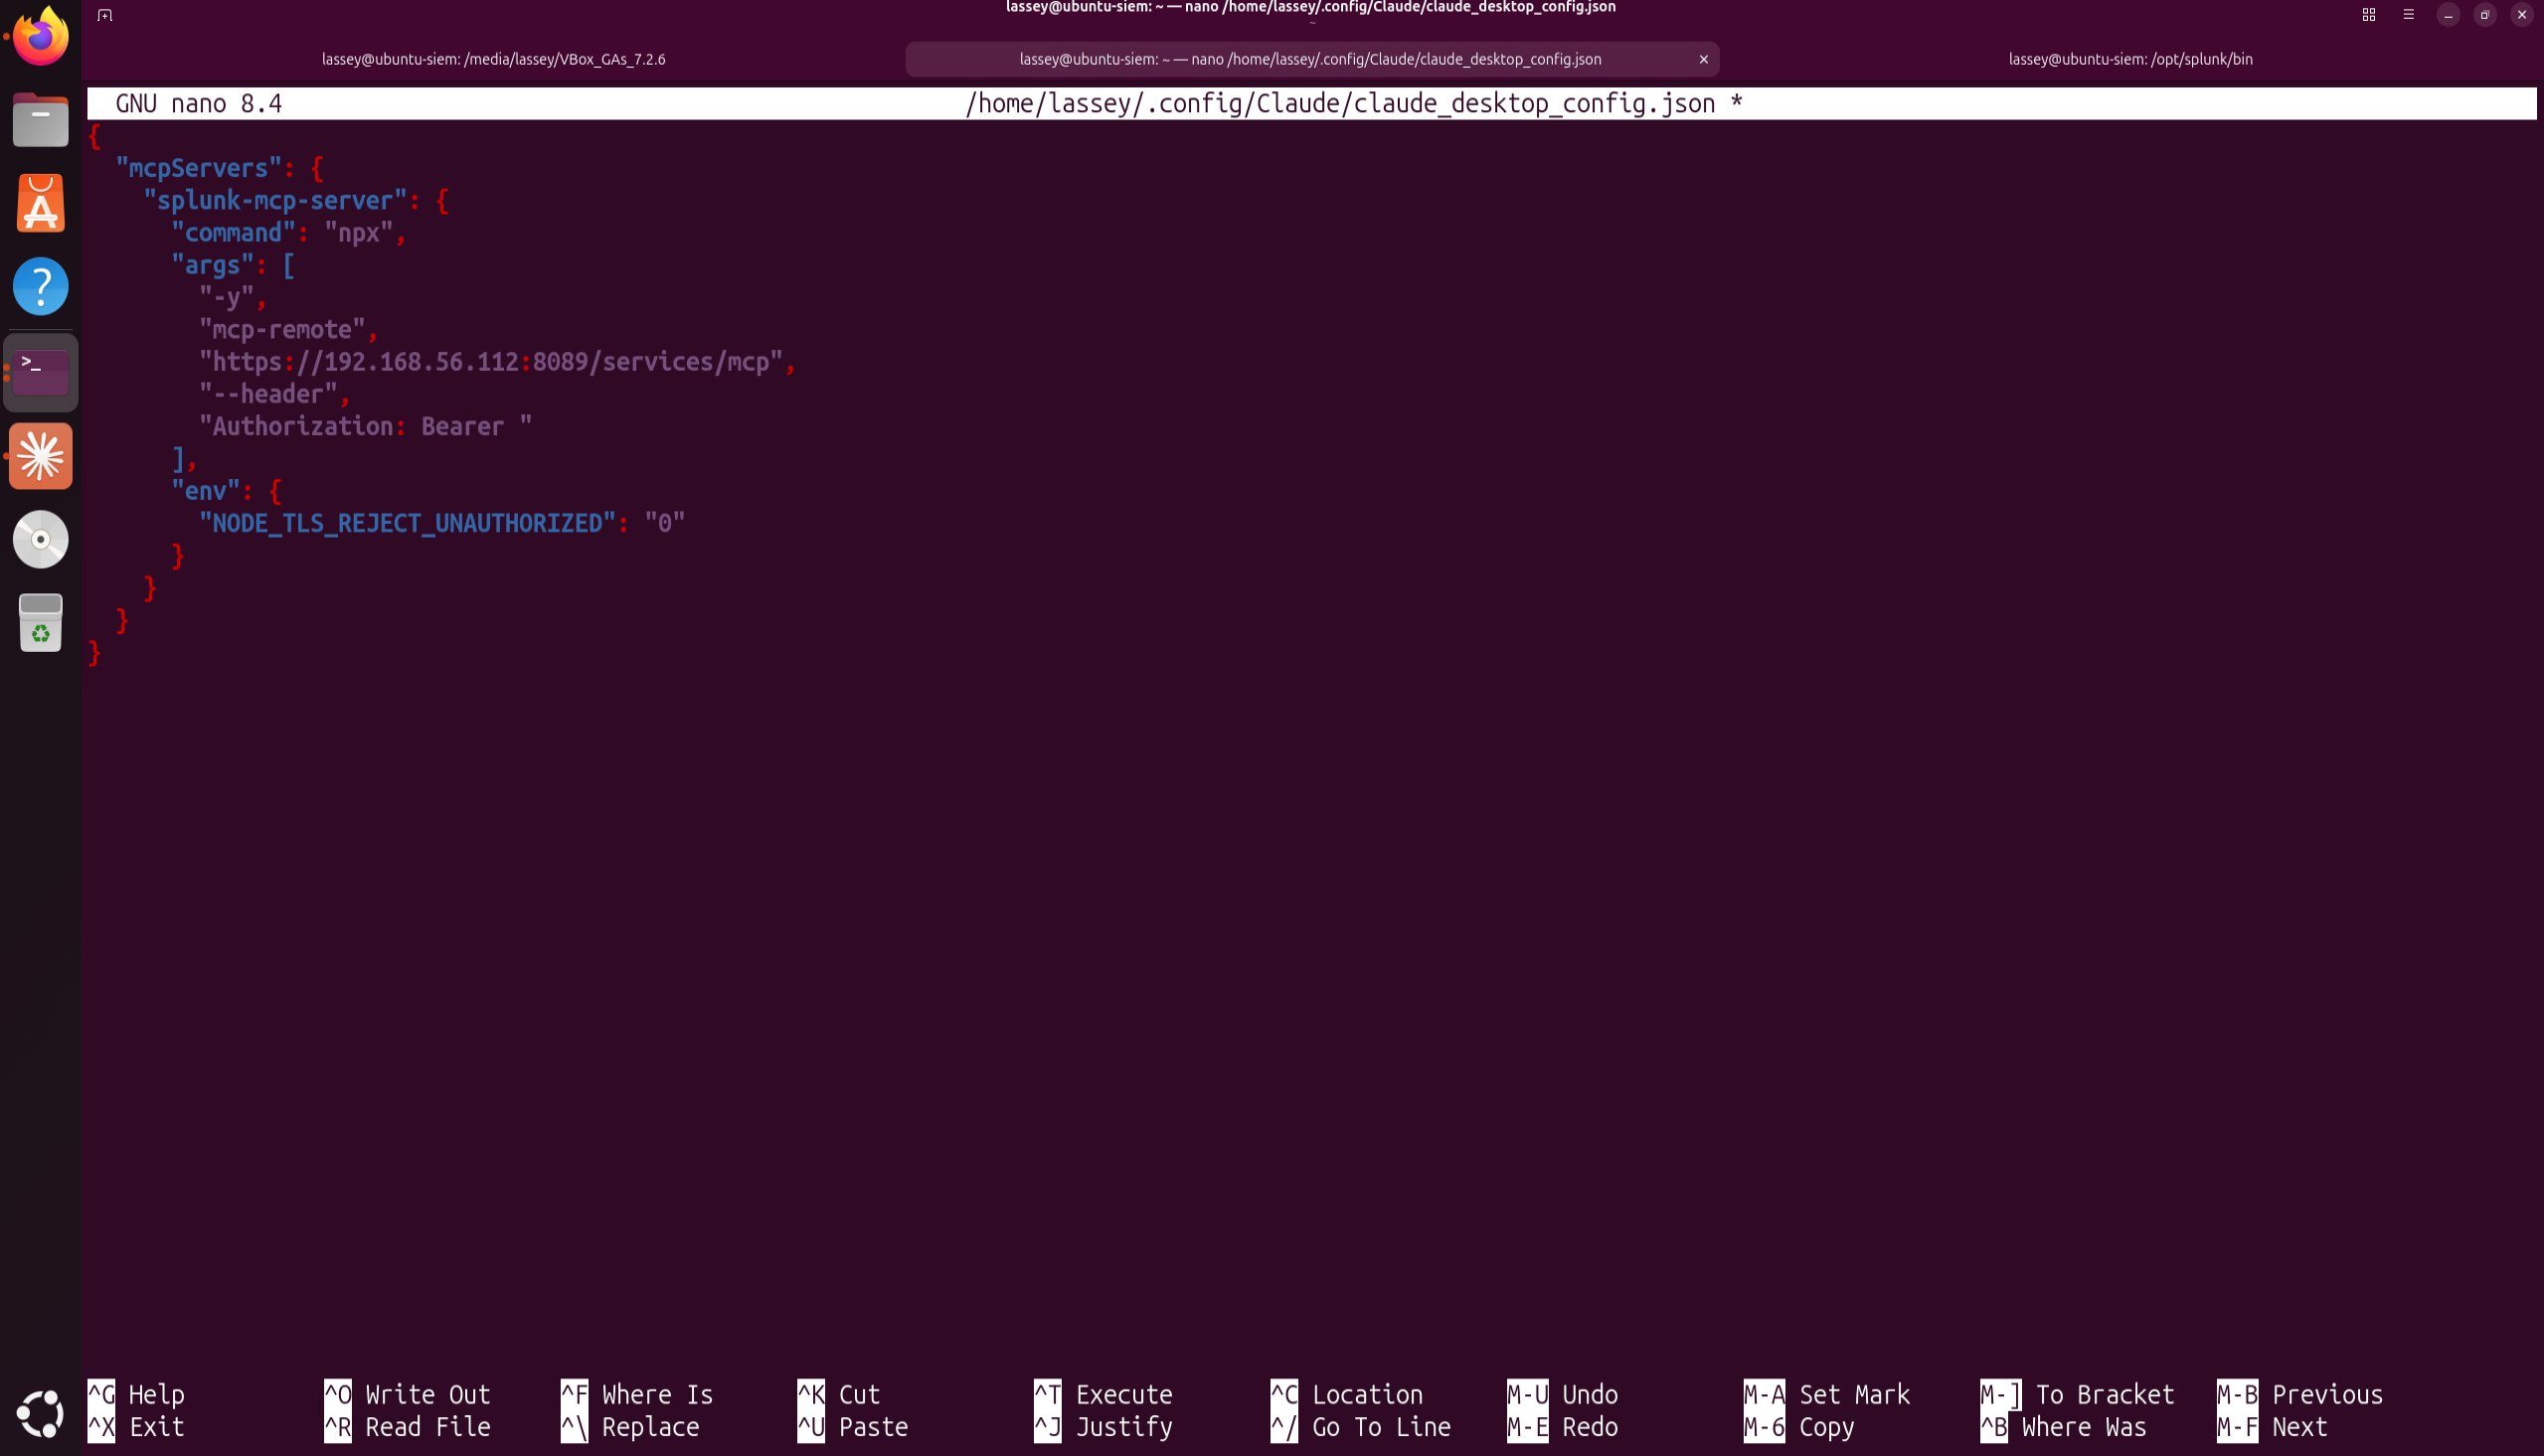
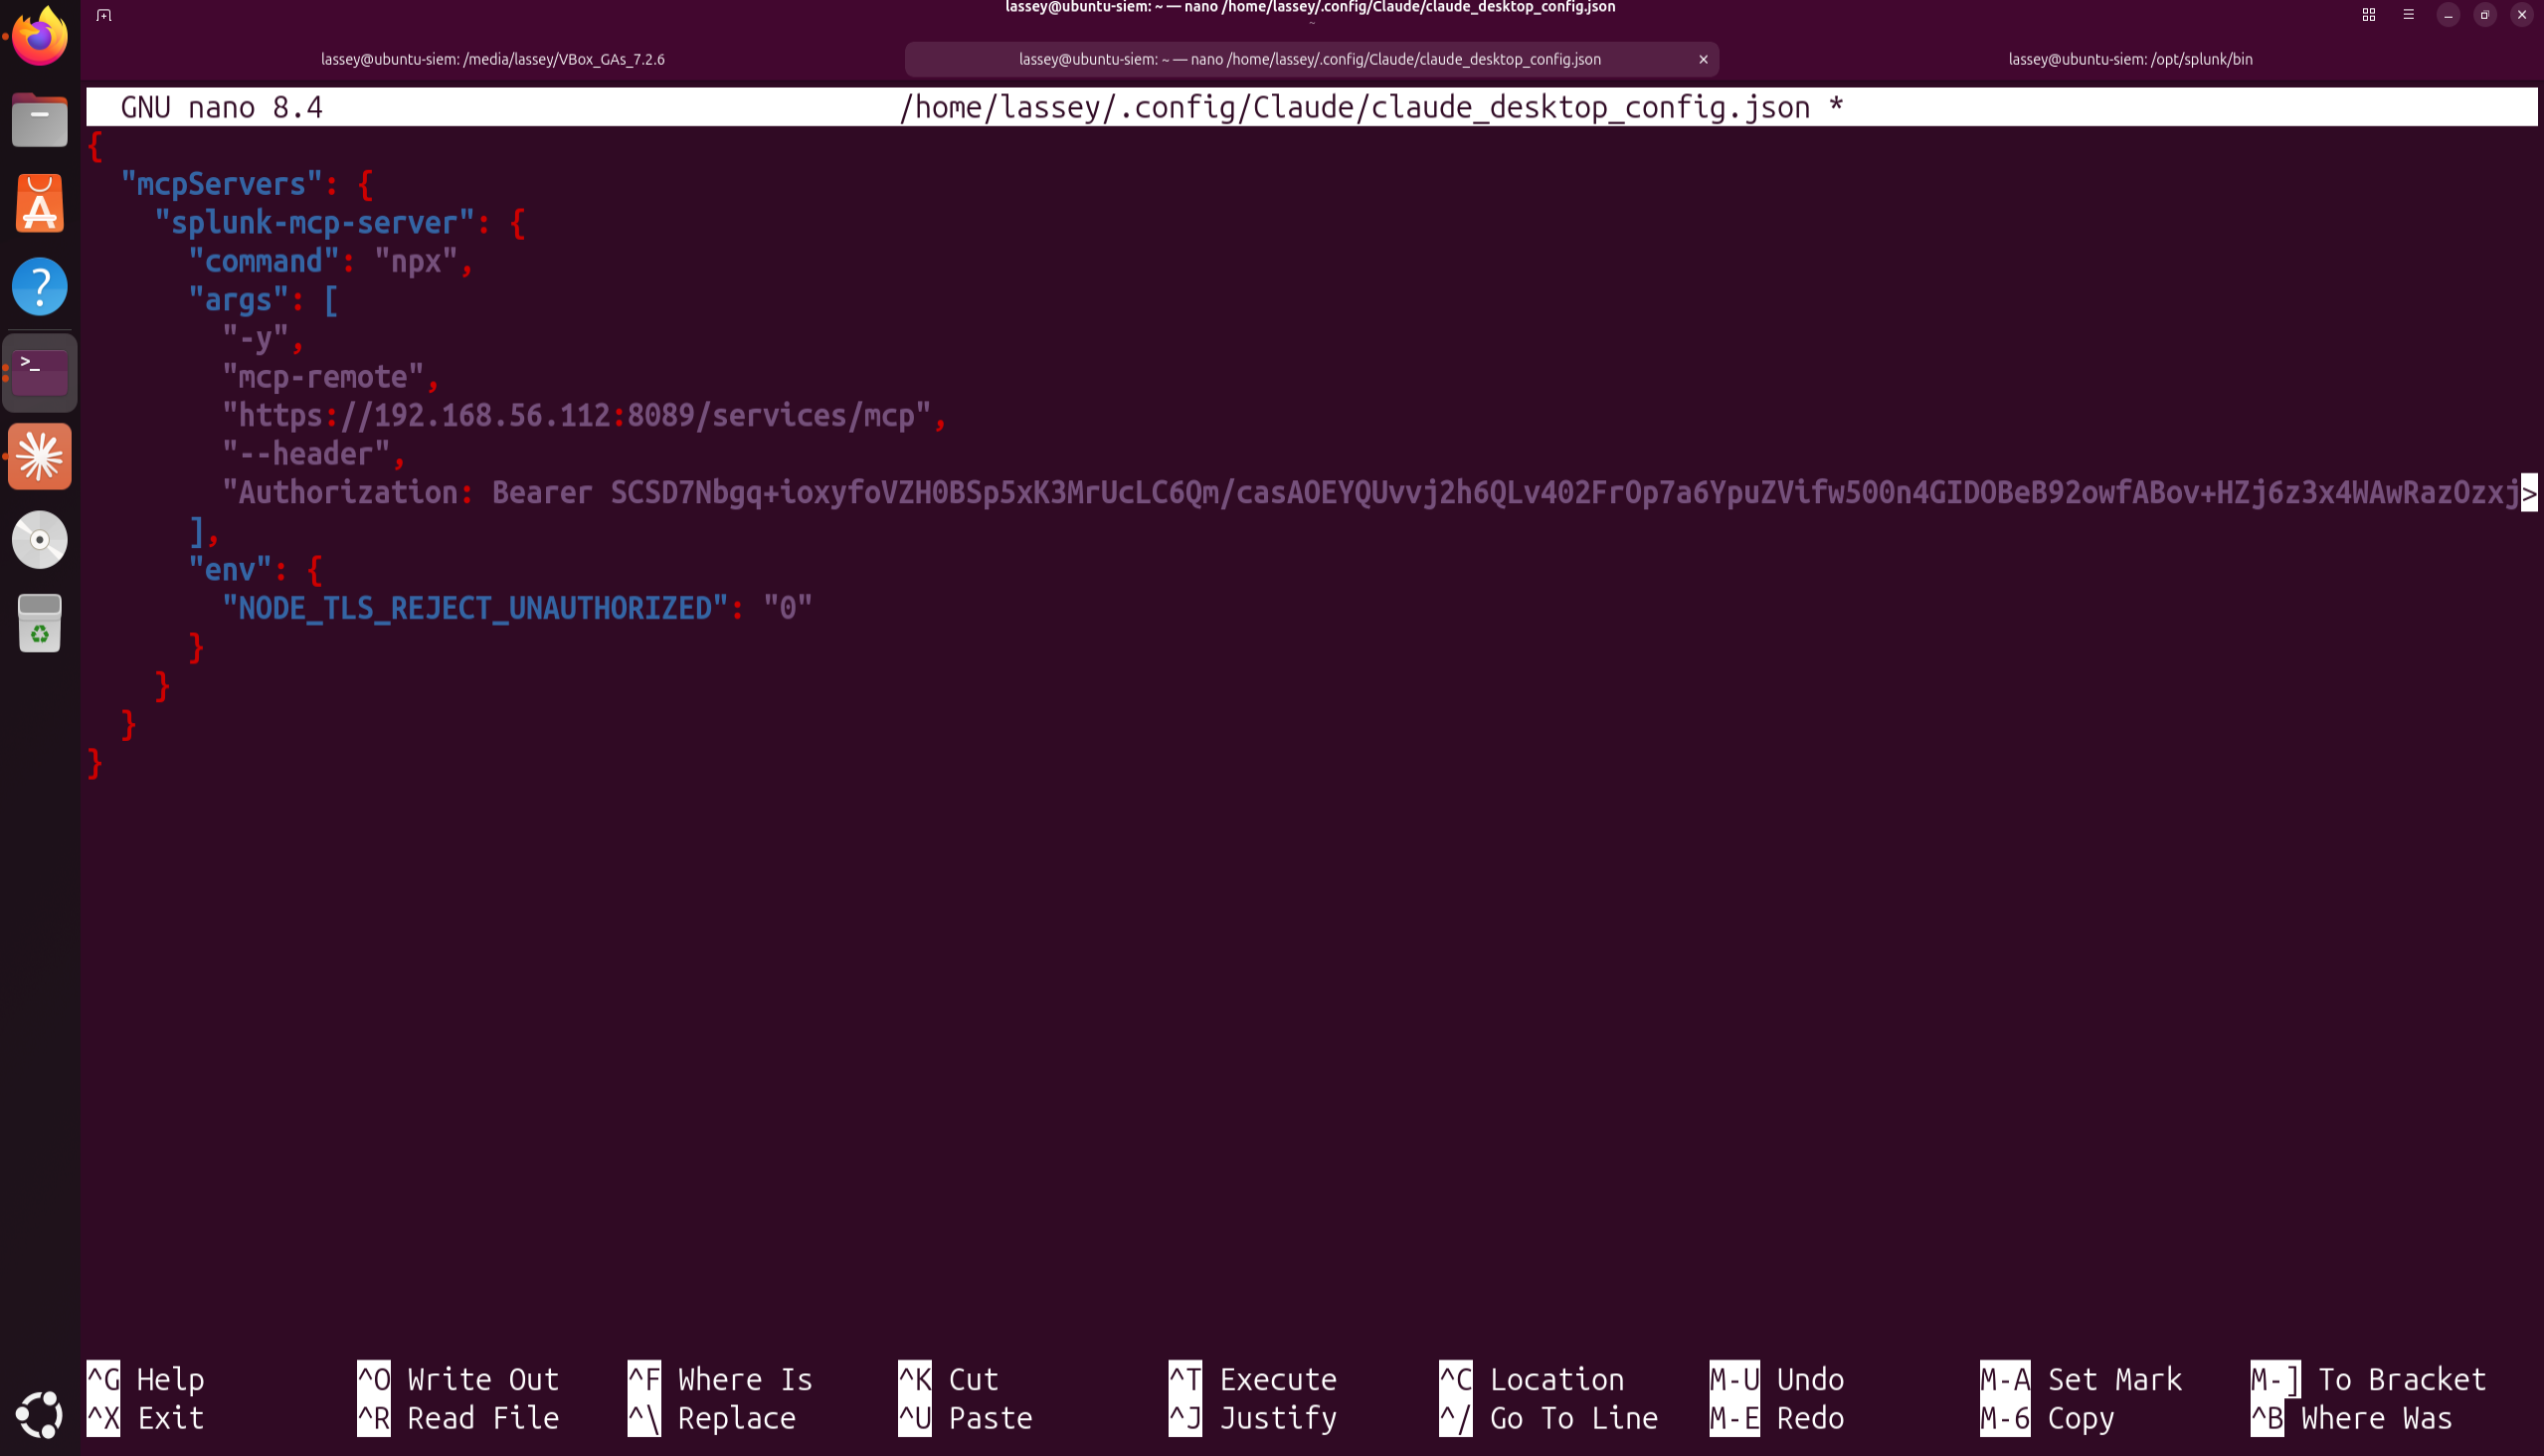
Note that the token must be pasted after Bearer as seen below. Save it afterwards
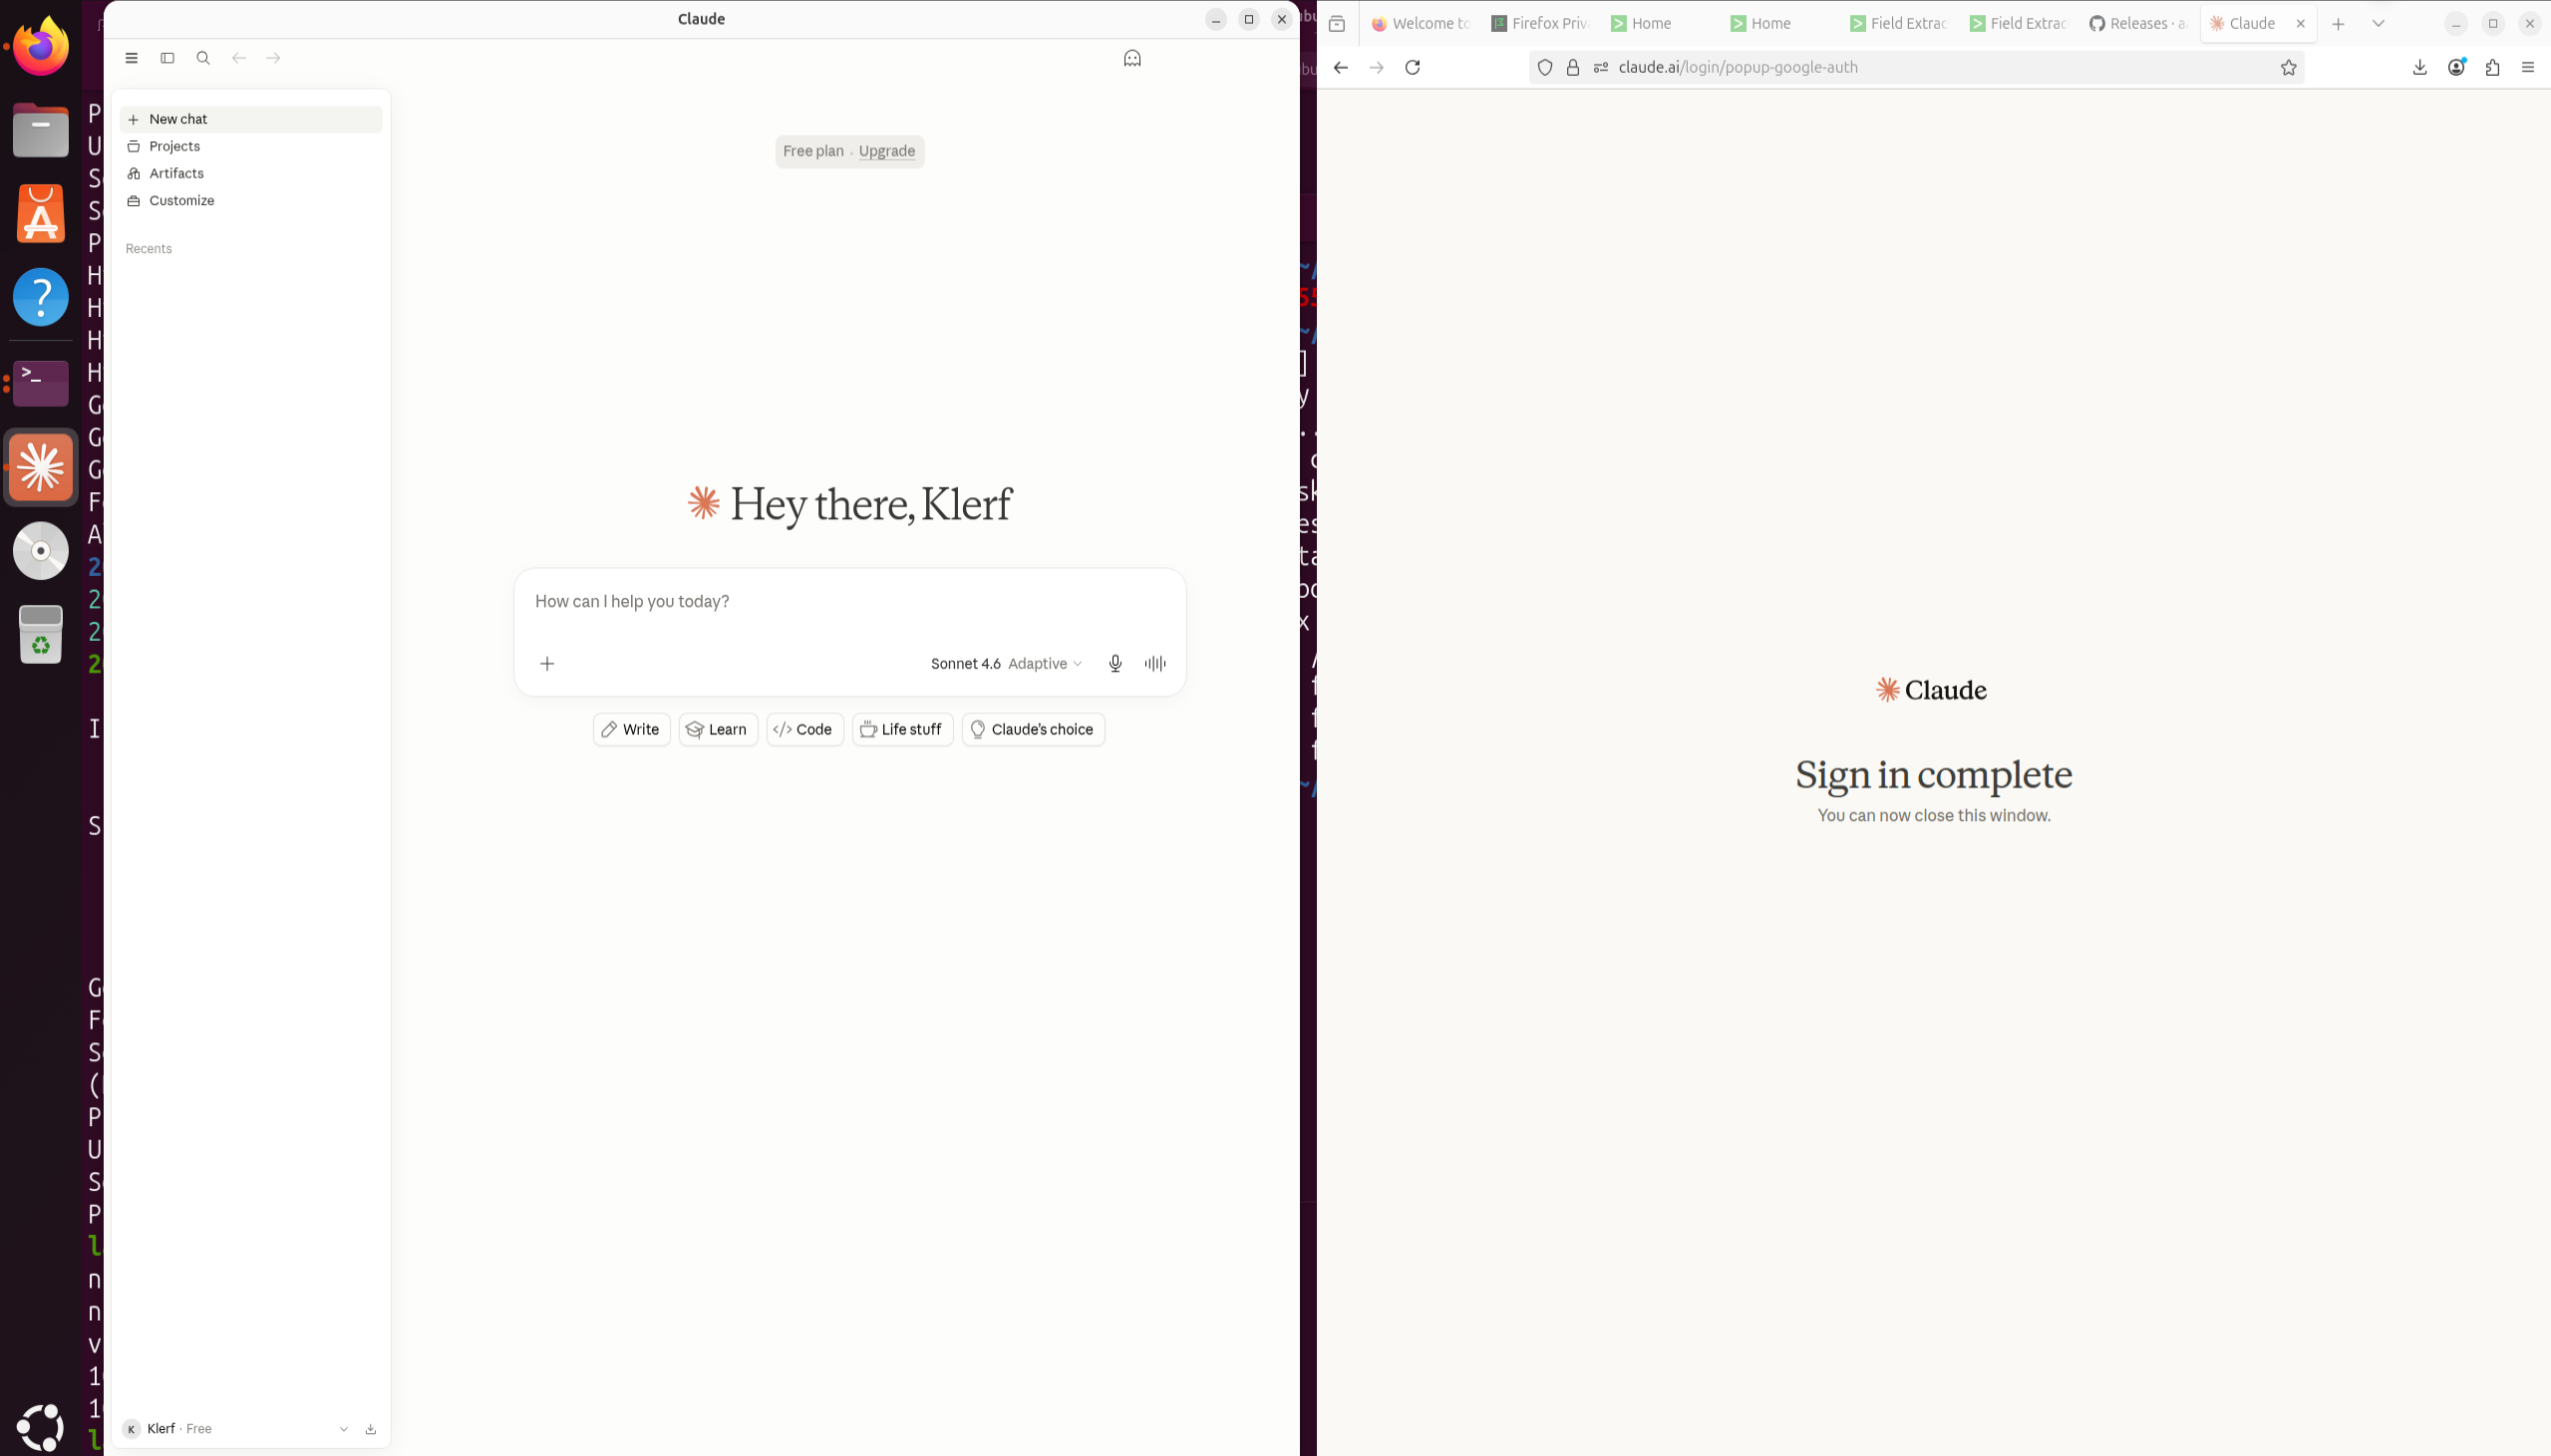
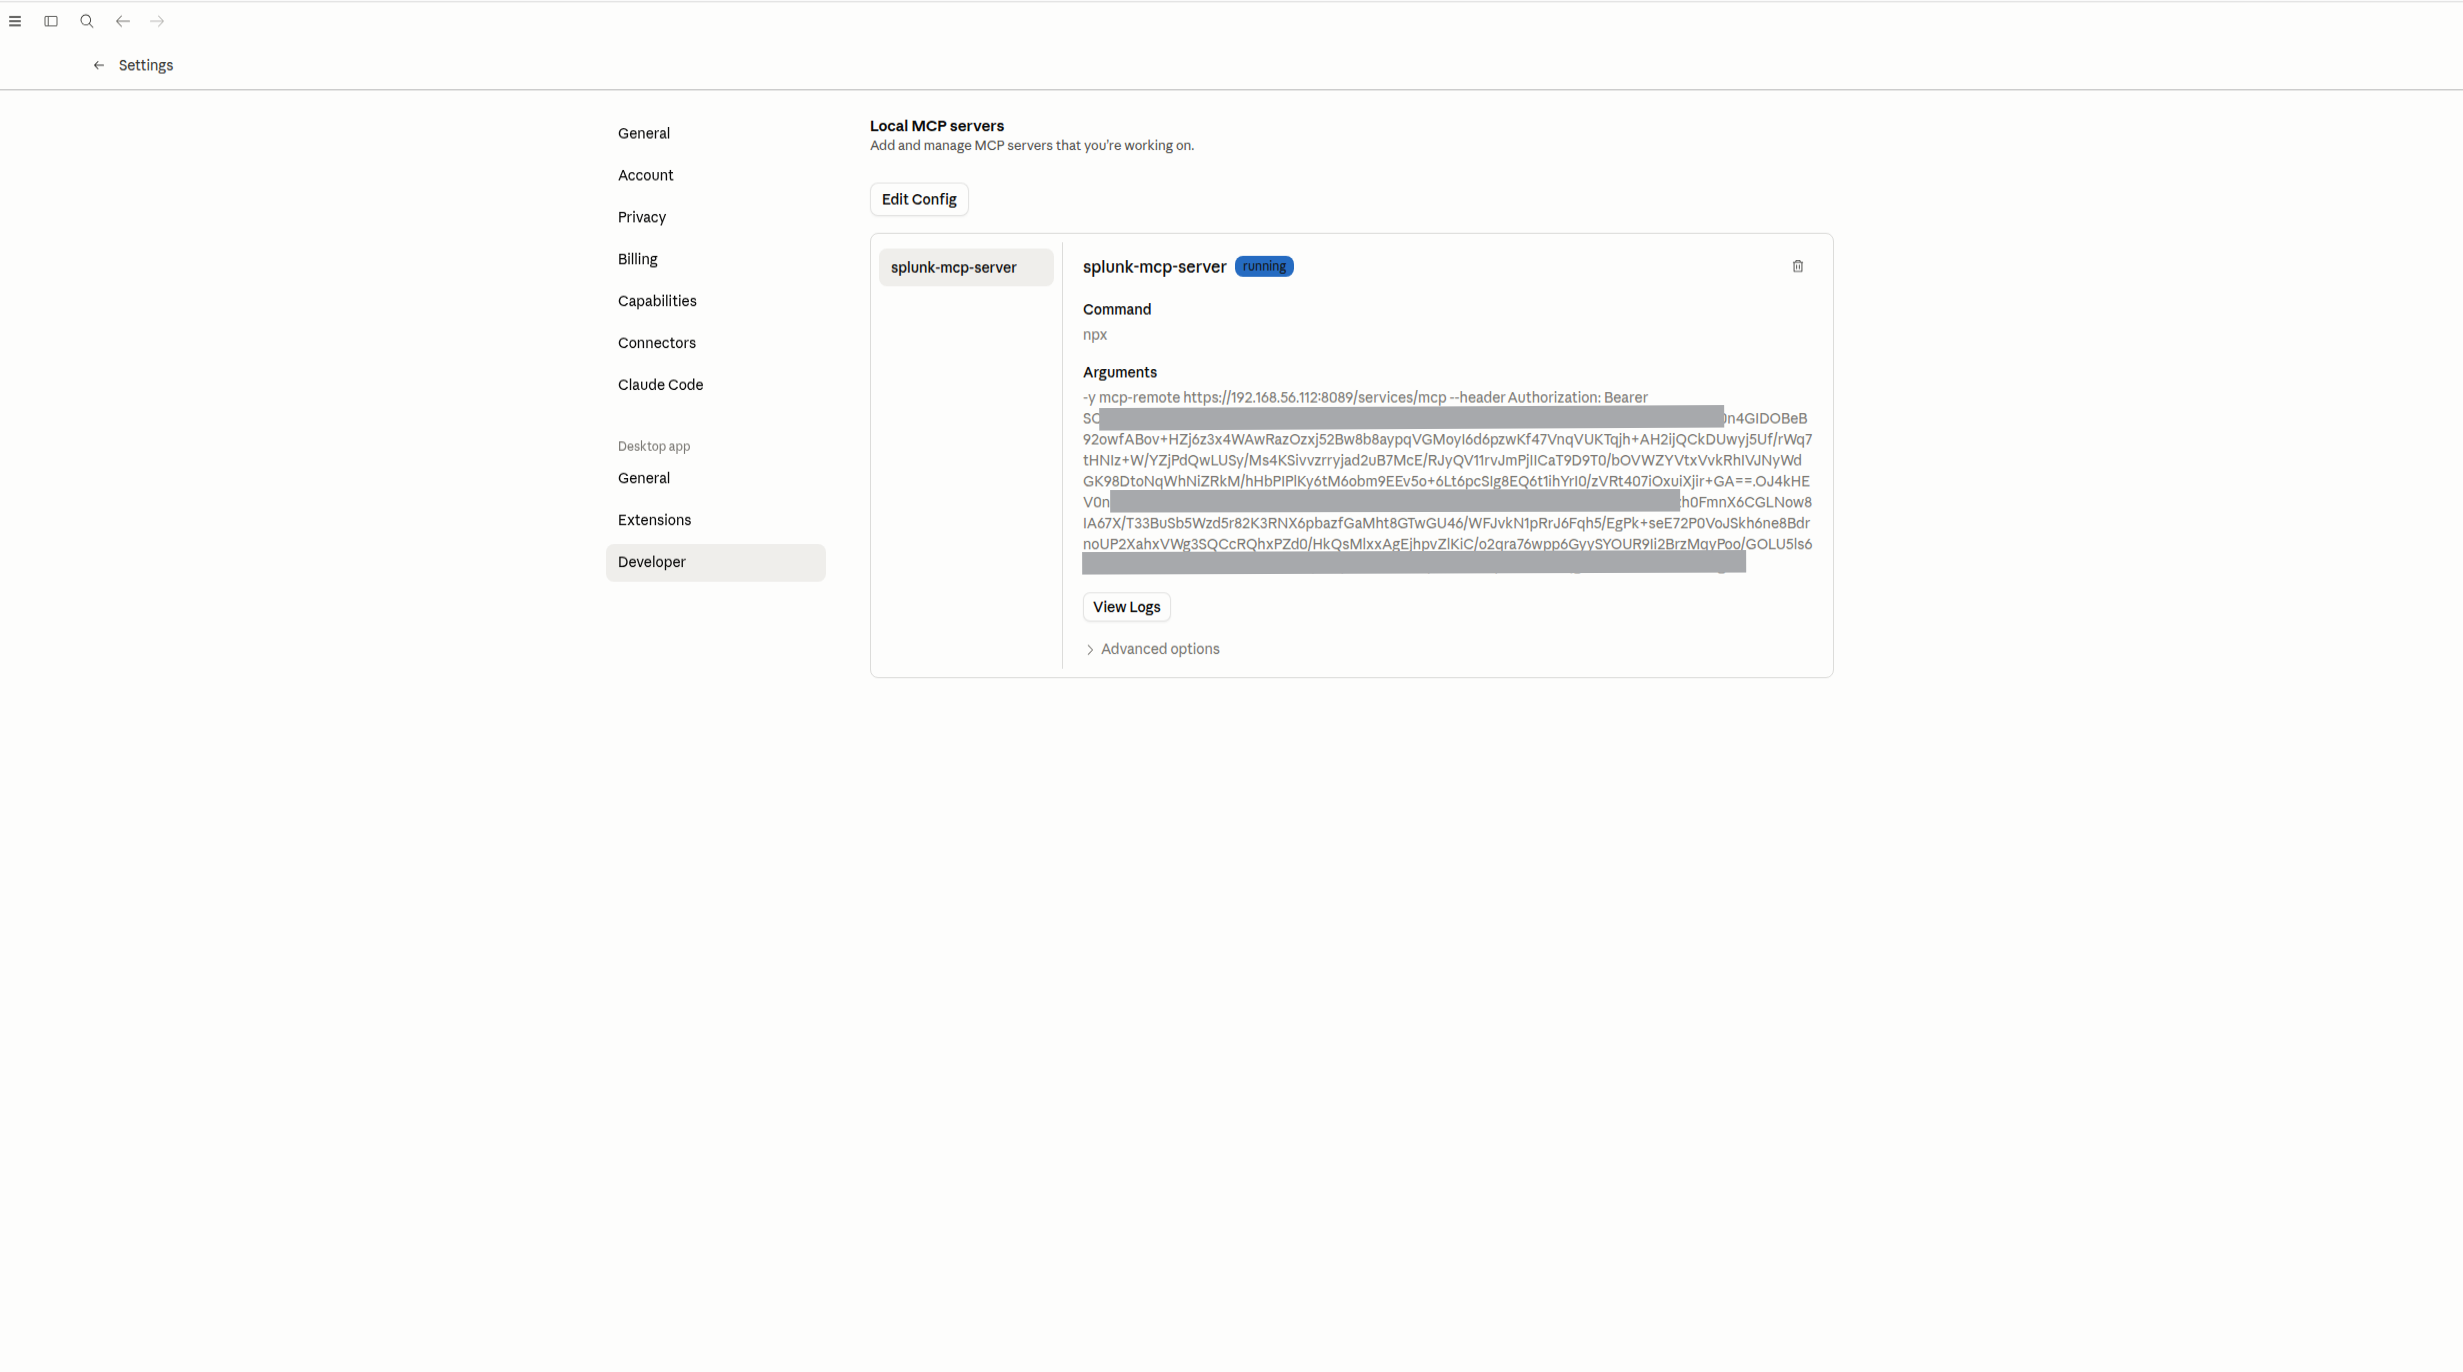
After saving the config, restart Claude Desktop:
sudo pkill -f claude-desktop
claude-desktop &
What data do I have currently indexed in splunk? 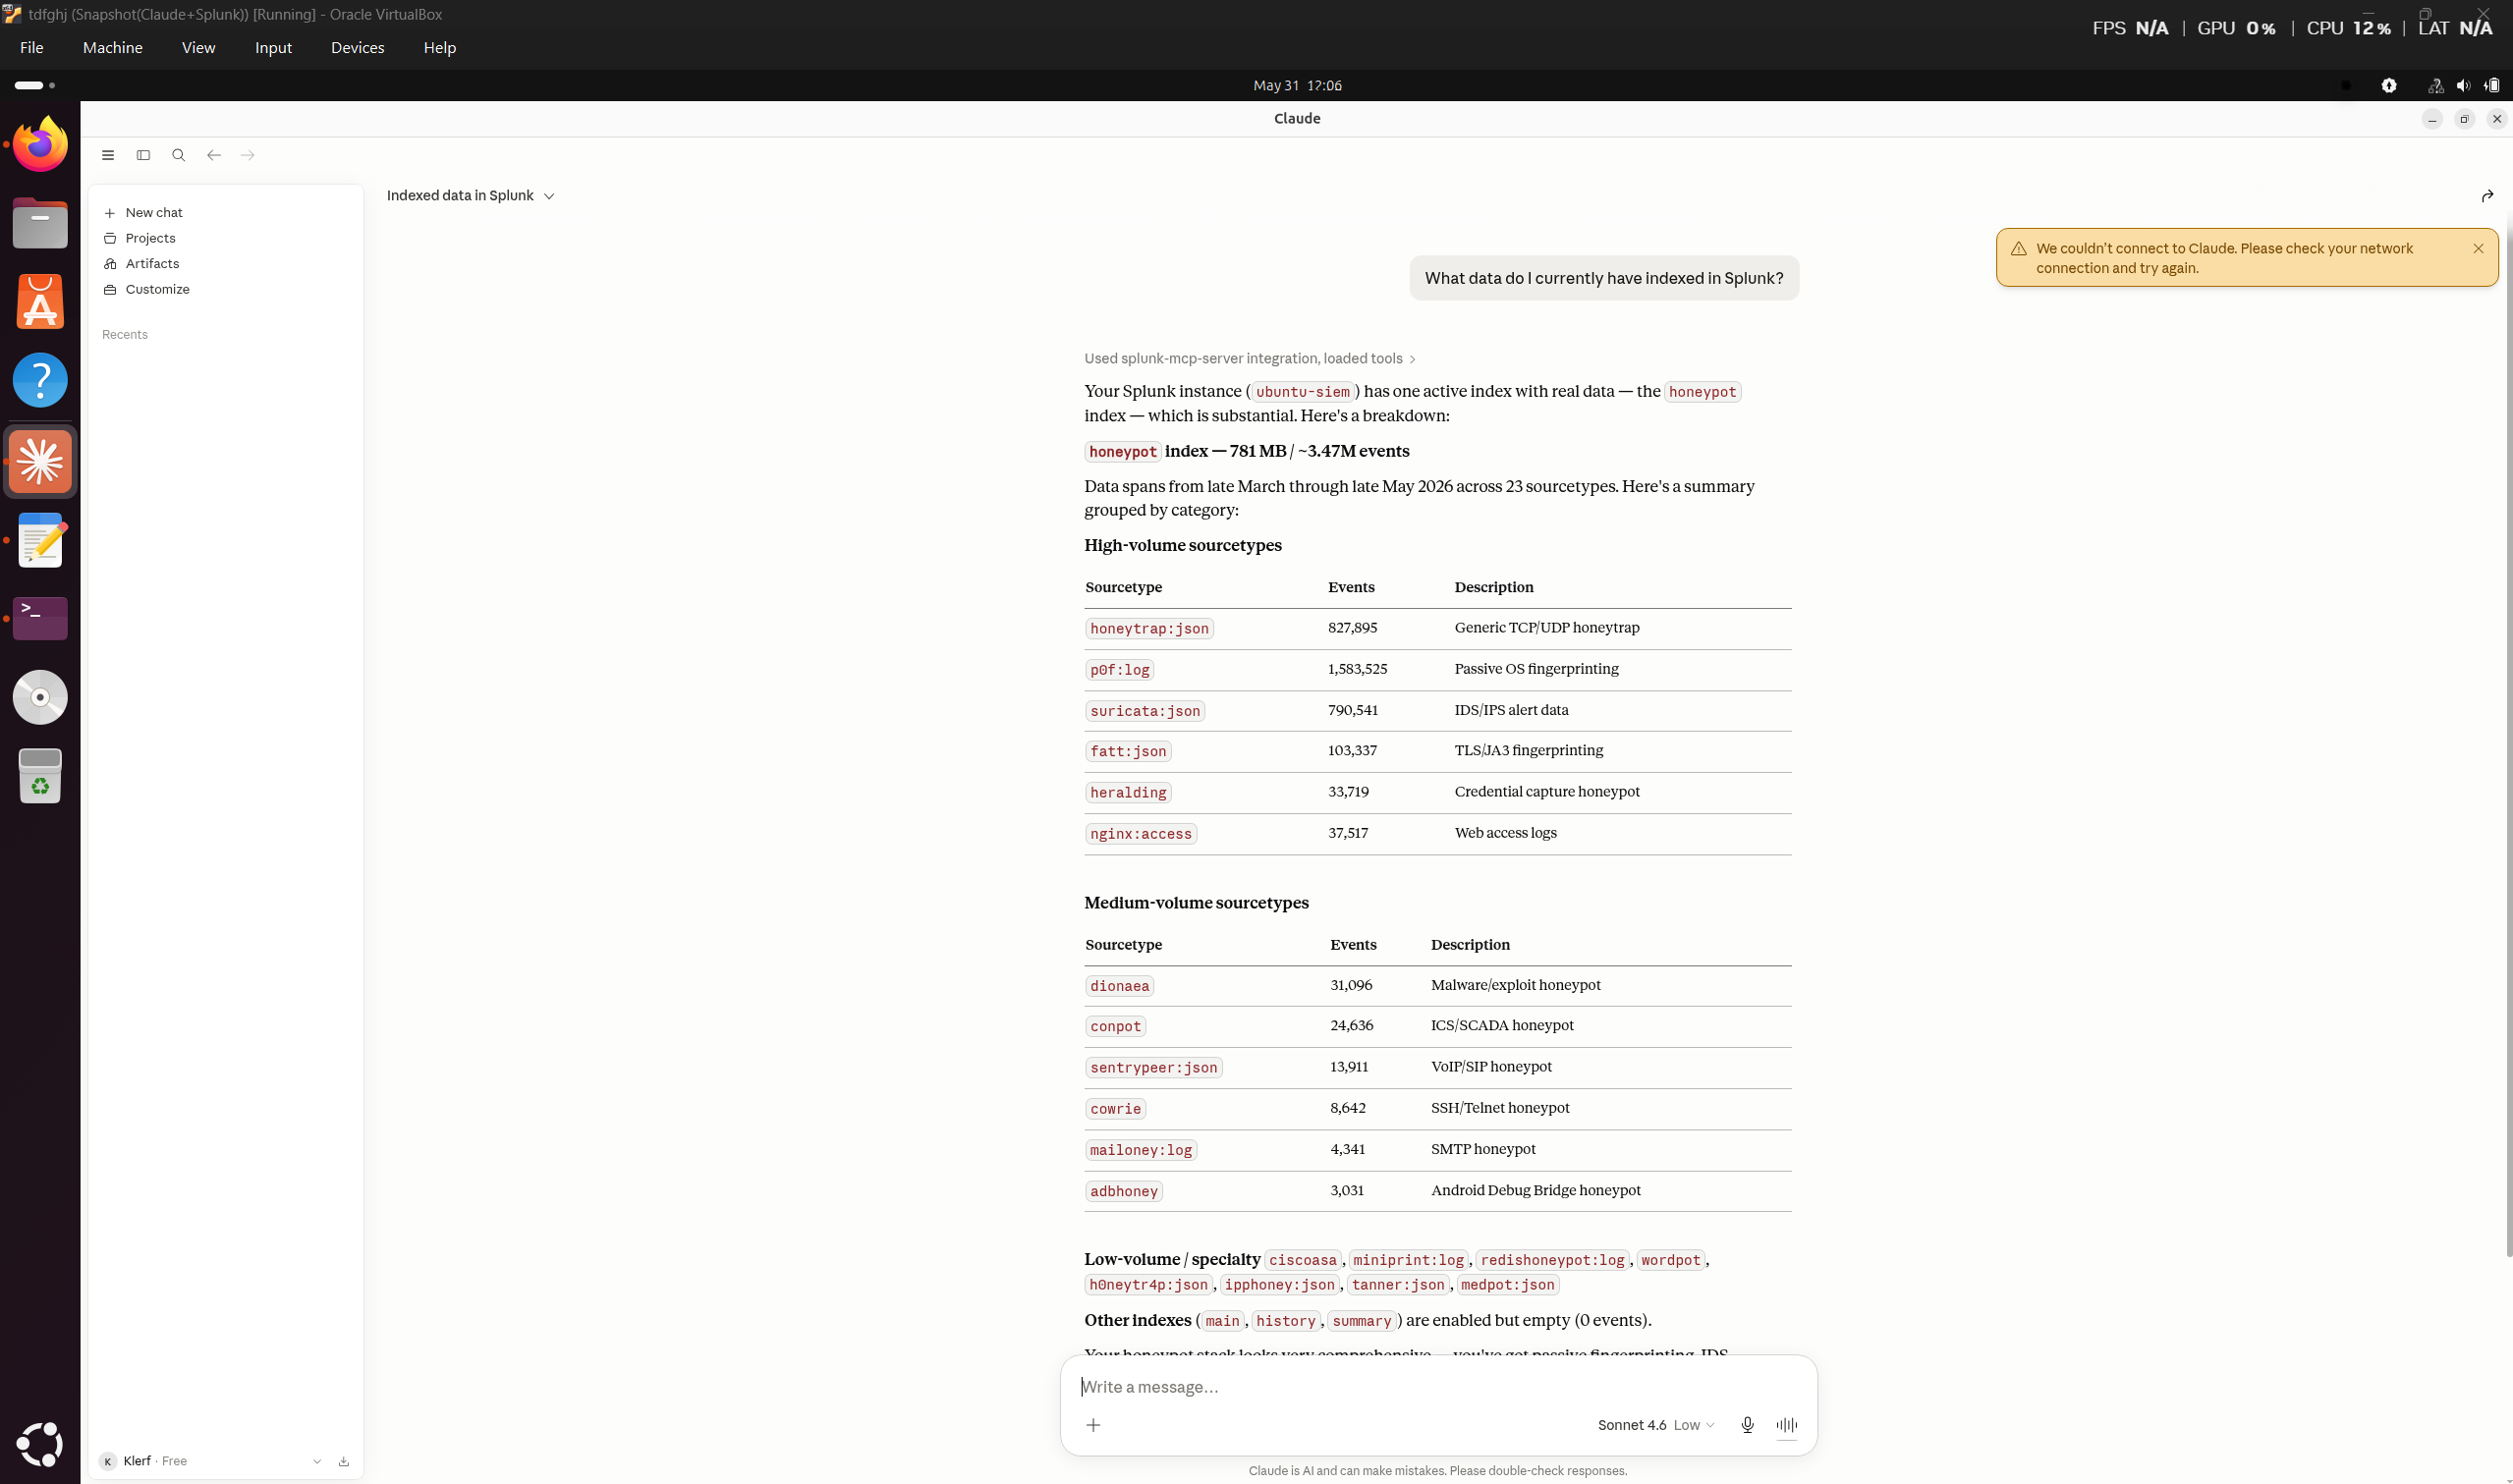
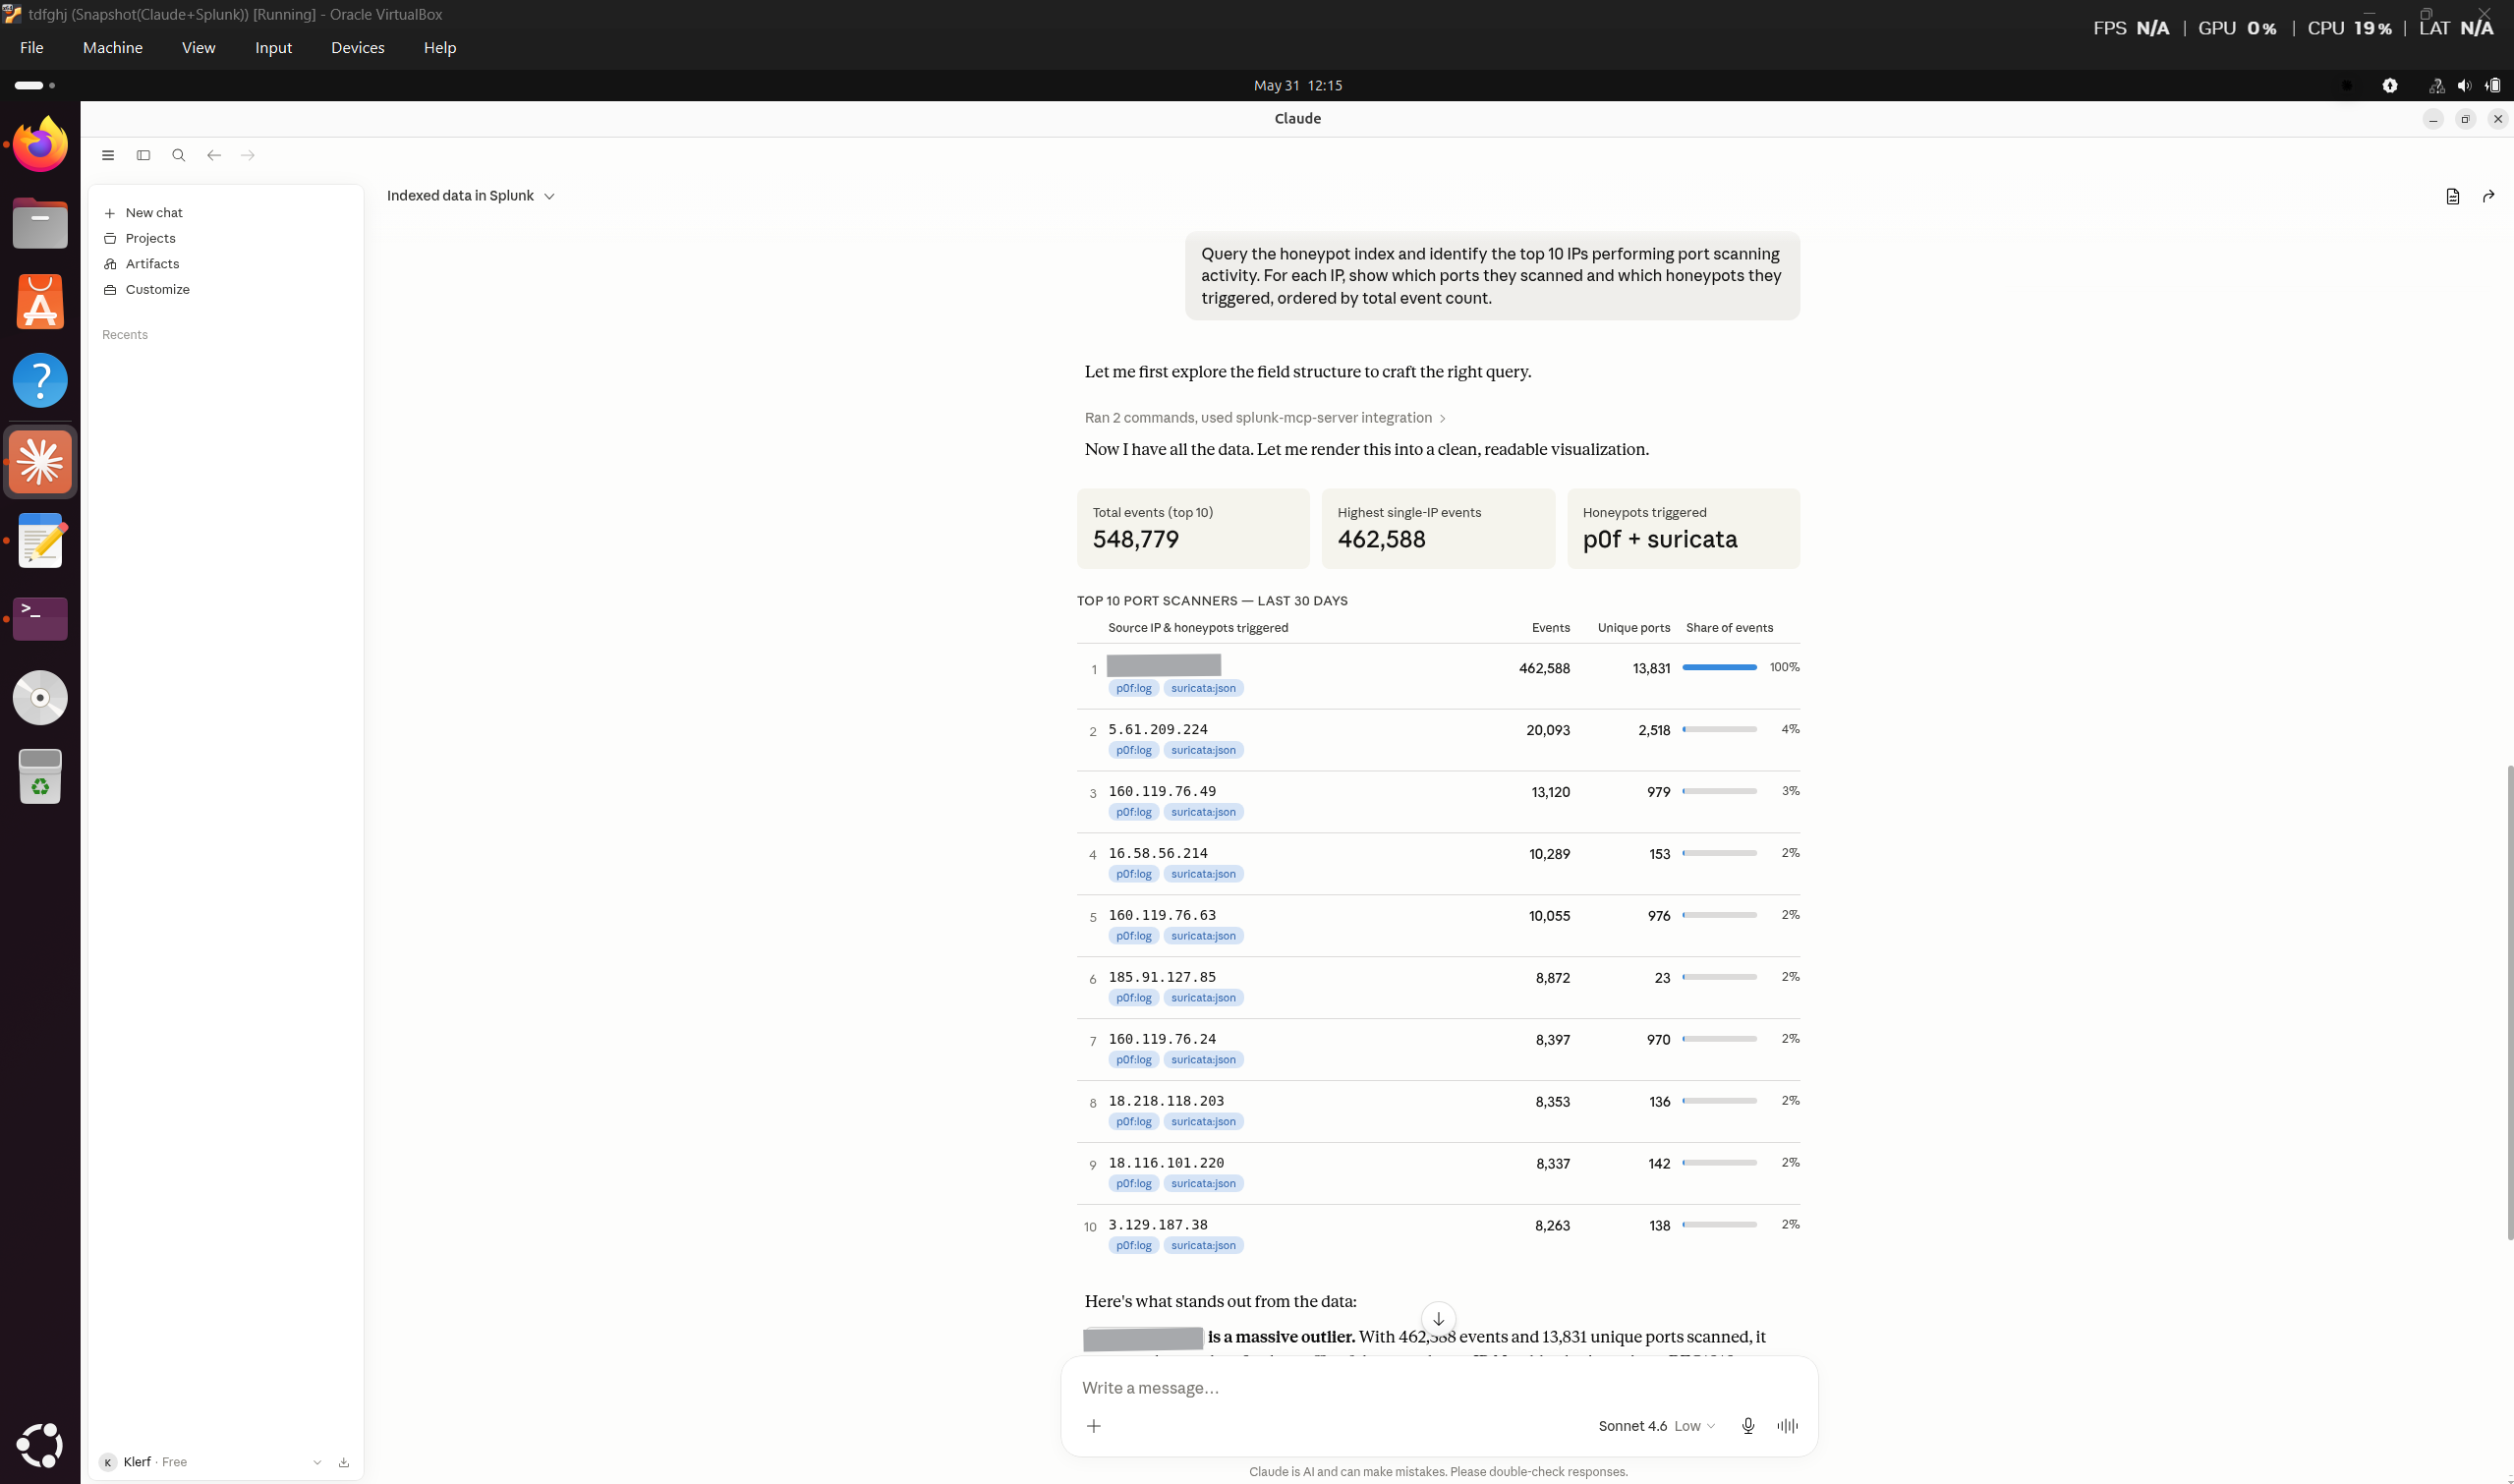
Query the honeypot index and identify the top 10 IPs performing port scanning activity. For each IP, show which ports they scanned and which honeypots they triggered, ordered by total event count.
## 10 Splunk Queries Detection Engineering Reference
All queries run against `index=honeypot`. These are the core queries used throughout the analysis and serve as a starting point for detection rule development.
### 10.1 Discovery Queries
-- Total unique IPs and events (application-layer honeypots)
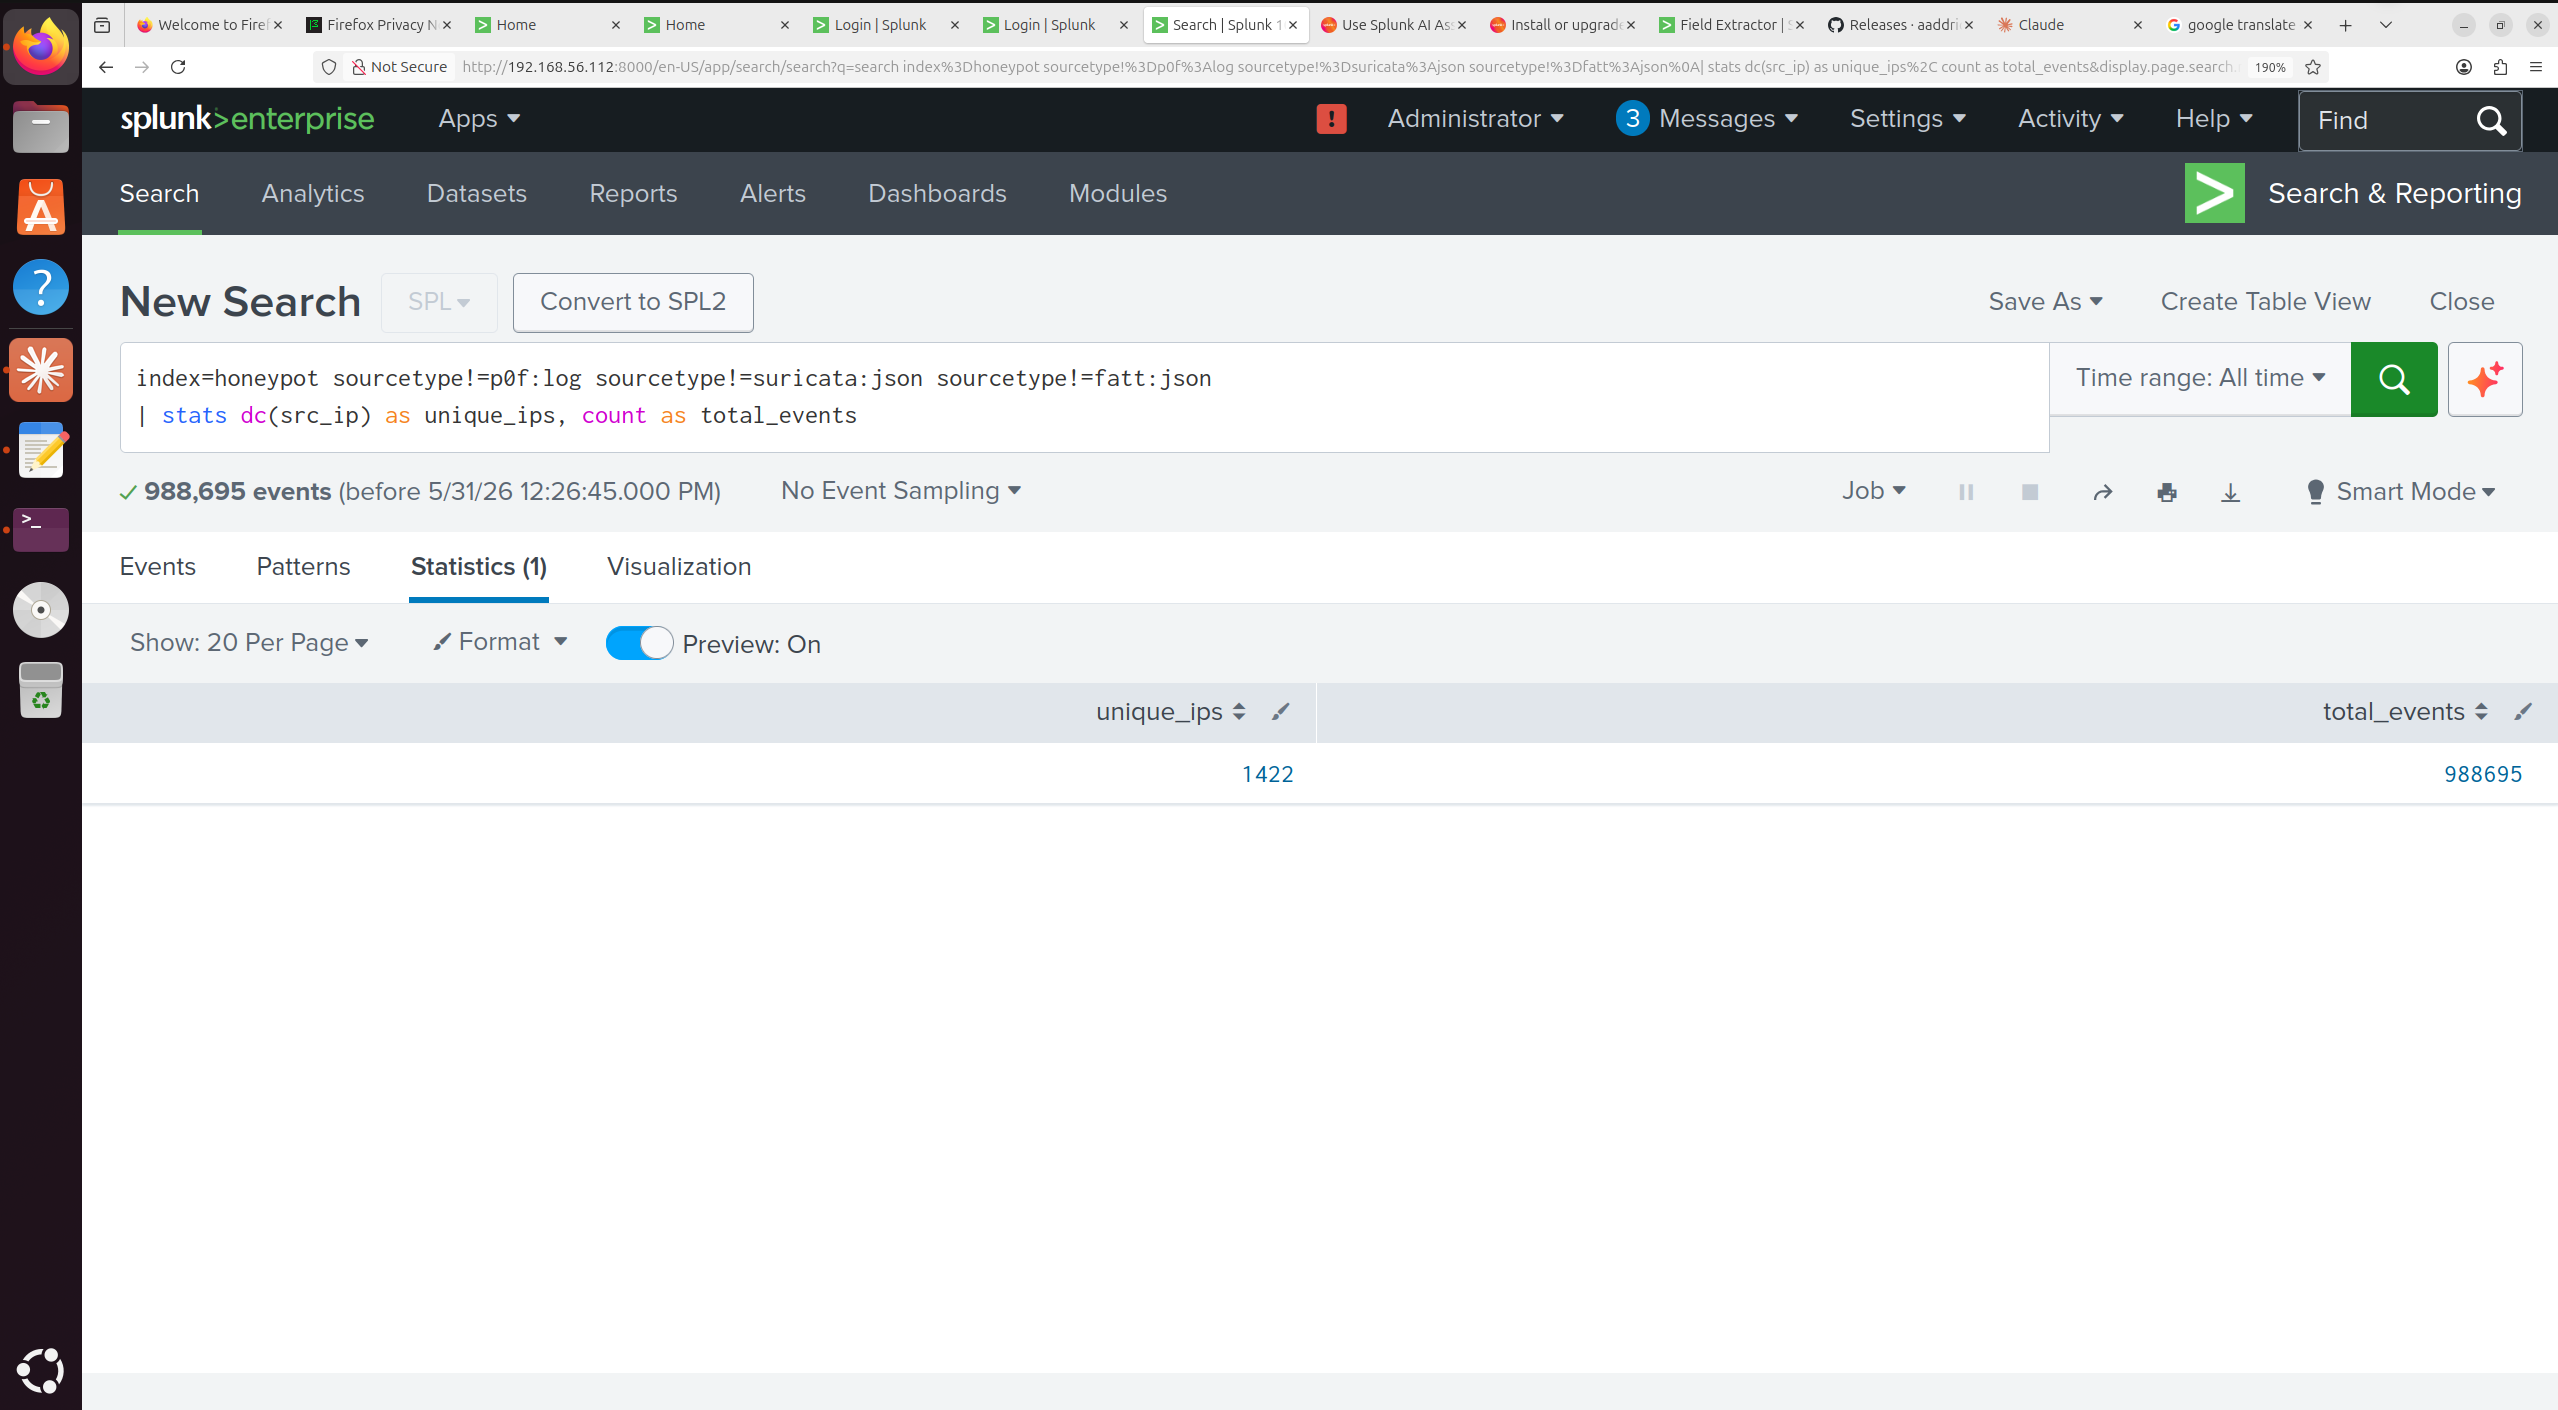
index=honeypot sourcetype!=p0f:log sourcetype!=suricata:json sourcetype!=fatt:json
| stats dc(src_ip) as unique_ips, count as total_events
-- Total unique IPs and events (Suricata IDS, external only)
index=honeypot sourcetype=suricata:json NOT src_ip="172.31.*" NOT src_ip="169.254.*"
| stats dc(src_ip) as unique_ips, count as total_events
### 10.2 Attack Surface Queries
-- Top 20 attacking IPs
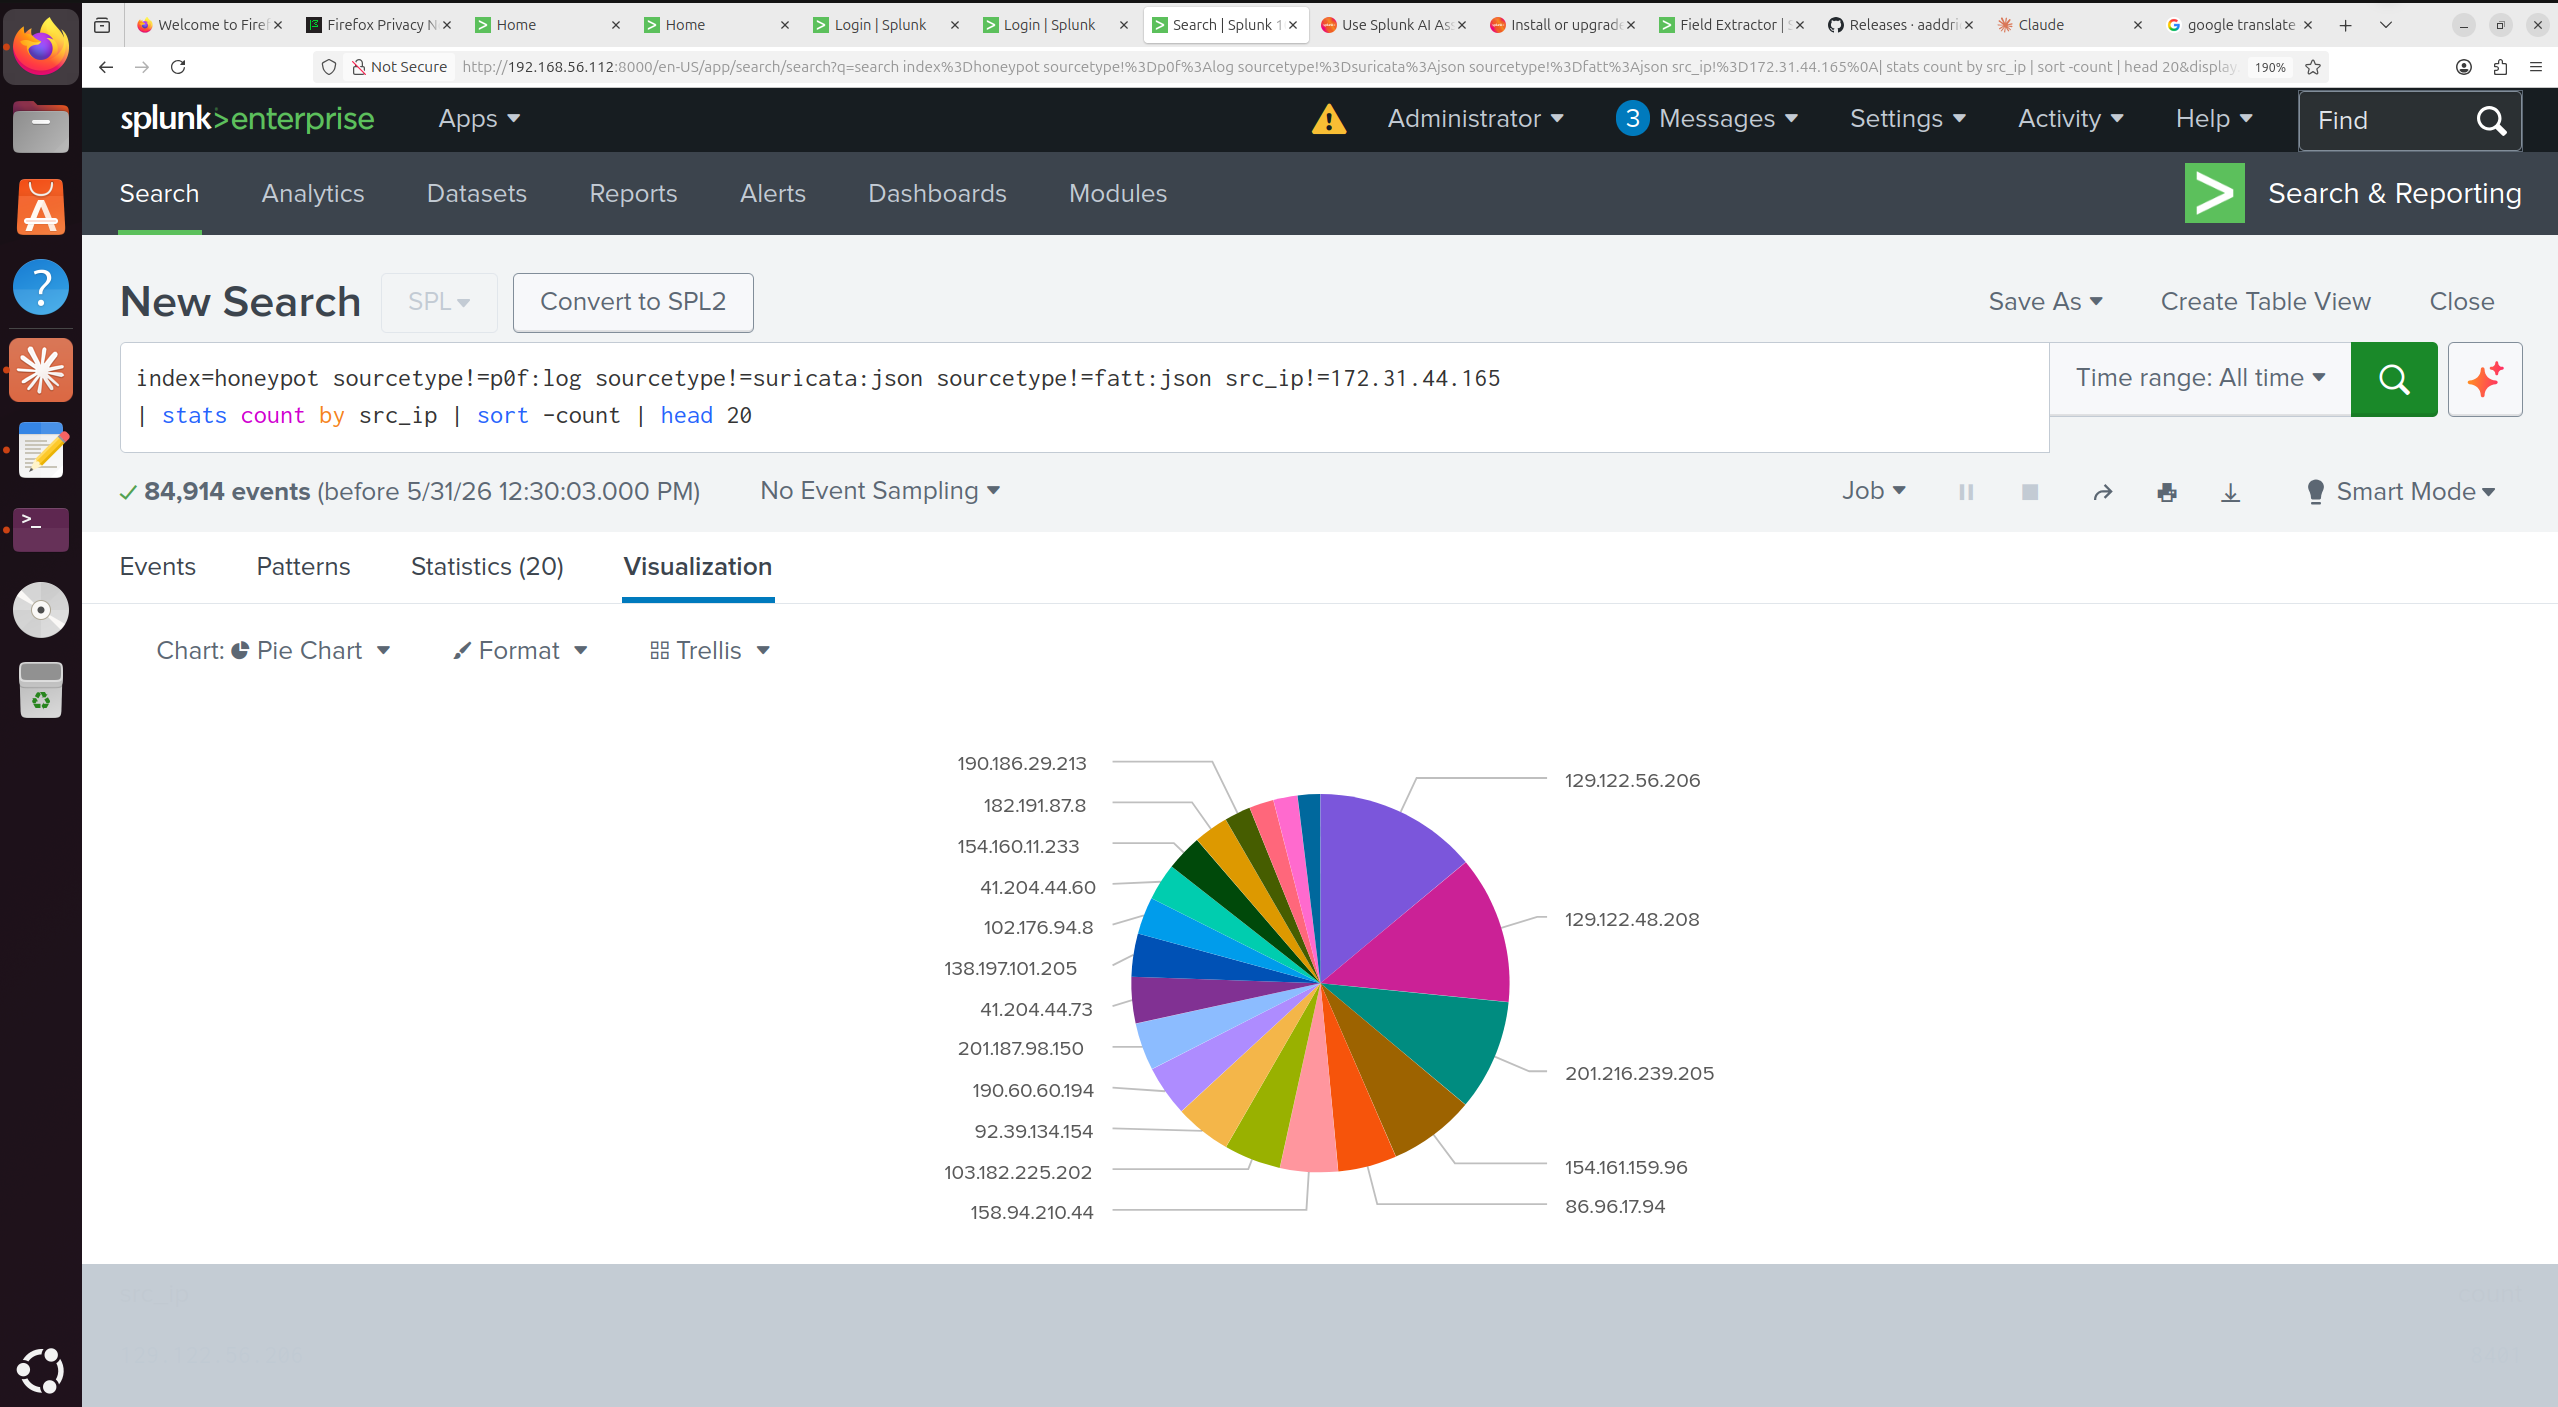
index=honeypot sourcetype!=p0f:log sourcetype!=suricata:json sourcetype!=fatt:json
| stats count by src_ip | sort -count | head 20
-- Geographic distribution (top 15 countries)
index=honeypot sourcetype!=p0f:log sourcetype!=suricata:json
| iplocation src_ip | stats count by Country | sort -count | head 15
-- Target port distribution (Suricata, external IPs)
index=honeypot sourcetype=suricata:json NOT src_ip="172.31.*" NOT src_ip="169.254.*"
| stats count by dest_port | sort -count | head 15
-- Top Suricata signatures fired
index=honeypot sourcetype=suricata:json NOT src_ip="172.31.*" NOT src_ip="169.254.*"
| stats count by alert.signature_id, alert.signature | sort -count | head 20
-- CVE extraction from Suricata alerts
index=honeypot sourcetype=suricata:json alert.signature=*CVE* NOT src_ip="172.31.*"
| rex field=alert.signature "(?CVE-\d{4}-\d+)"
| stats count by cve | sort -count
-- Blocklist hit rate (Dshield / Spamhaus / CINS)
index=honeypot sourcetype=suricata:json
(alert.signature="*Dshield*" OR alert.signature="*Spamhaus*" OR alert.signature="*CINS*")
NOT src_ip="172.31.*"
| stats dc(src_ip) as blocklisted_ips, count as events
-- p0f OS fingerprinting (attacker OS distribution)
index=honeypot sourcetype=p0f:log mod="syn" subject="cli" os!="???" os!=""
| stats count by os | sort -count | head 15
### 10.3 Cowrie SSH/Telnet Queries
-- All successful logins
index=honeypot sourcetype=cowrie eventid="cowrie.login.success"
| table _time, src_ip, username, password | sort _time
-- Top credential pairs attempted (brute-force wordlist analysis)
index=honeypot sourcetype=cowrie eventid="cowrie.login.failed"
| stats count by username, password | sort -count | head 20
-- Post-exploitation commands
index=honeypot sourcetype=cowrie eventid="cowrie.command.input"
| stats count by input | sort -count | head 30
-- Malware payload hashes (file downloads via Cowrie)
index=honeypot sourcetype=cowrie eventid="cowrie.session.file_download"
| table _time, src_ip, url, shasum, outfile | sort _time
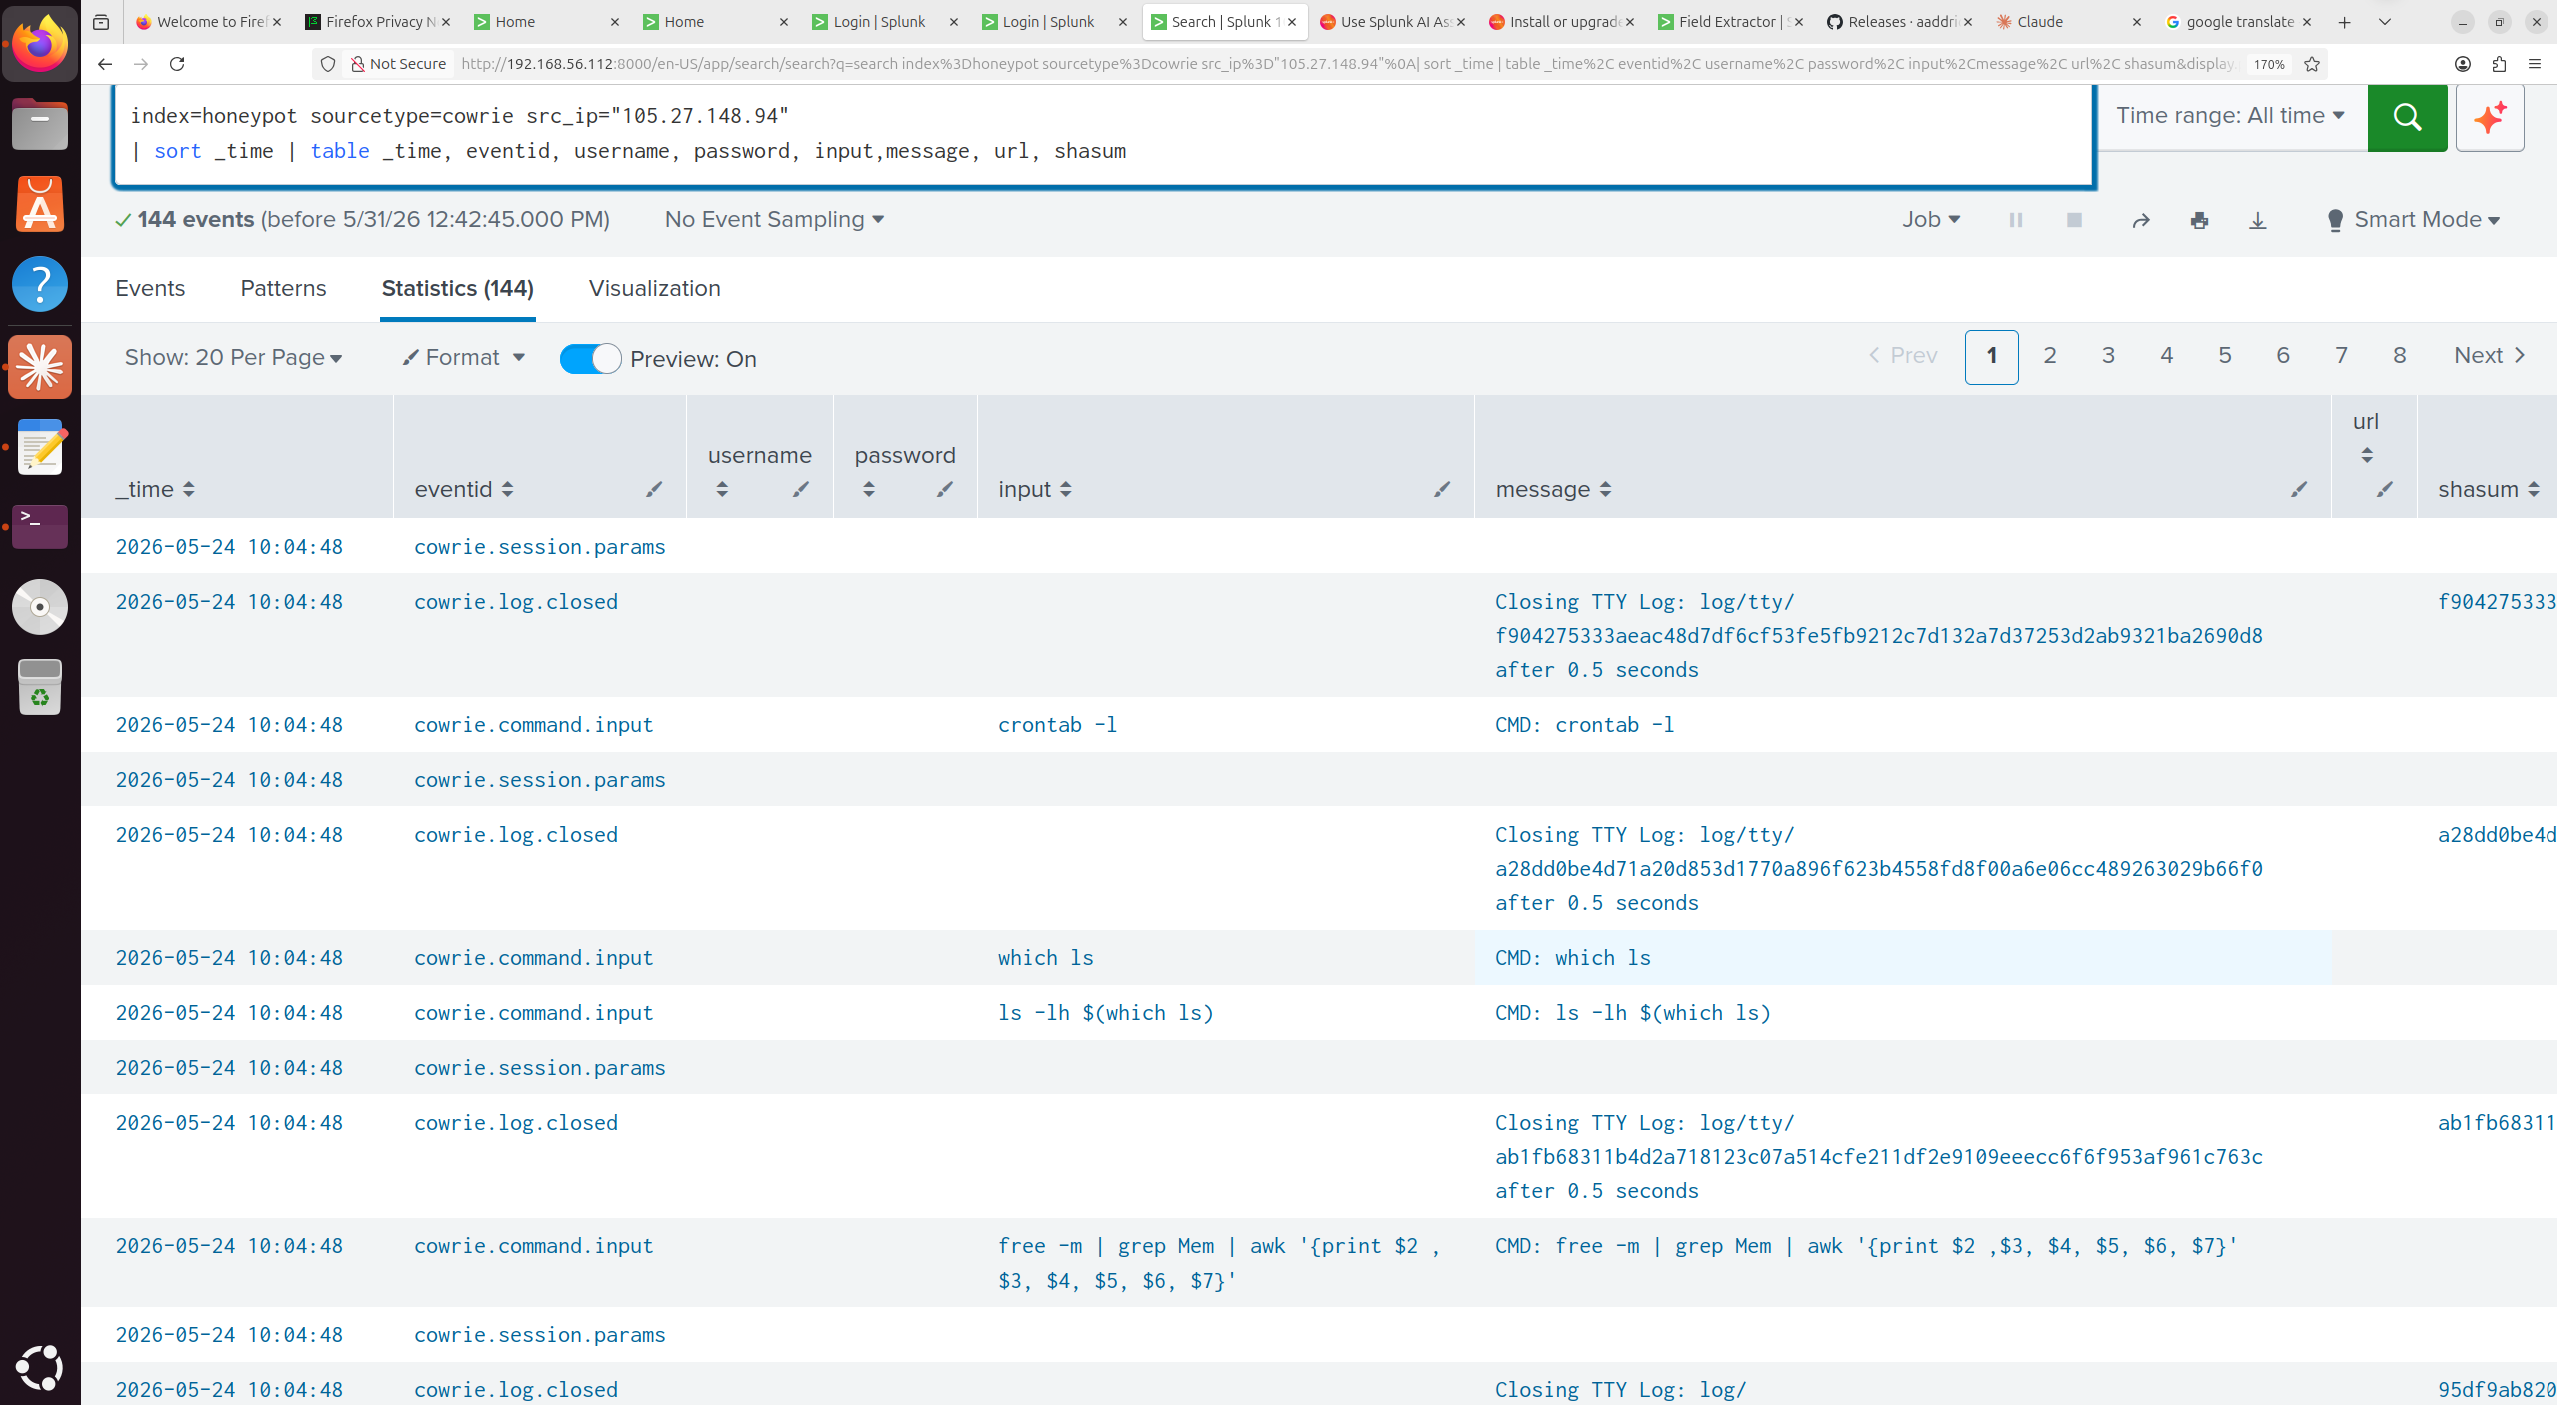
-- Full timeline for a specific IP
index=honeypot sourcetype=cowrie src_ip=""
| sort _time | table _time, eventid, username, password, input, url, shasum
### 10.4 Threat Intelligence Queries
-- DoublePulsar/EternalBlue scanning — top source IPs
index=honeypot sourcetype=suricata:json alert.signature="*DoublePulsar*" NOT src_ip="172.31.*"
| stats count by src_ip | sort -count | head 15
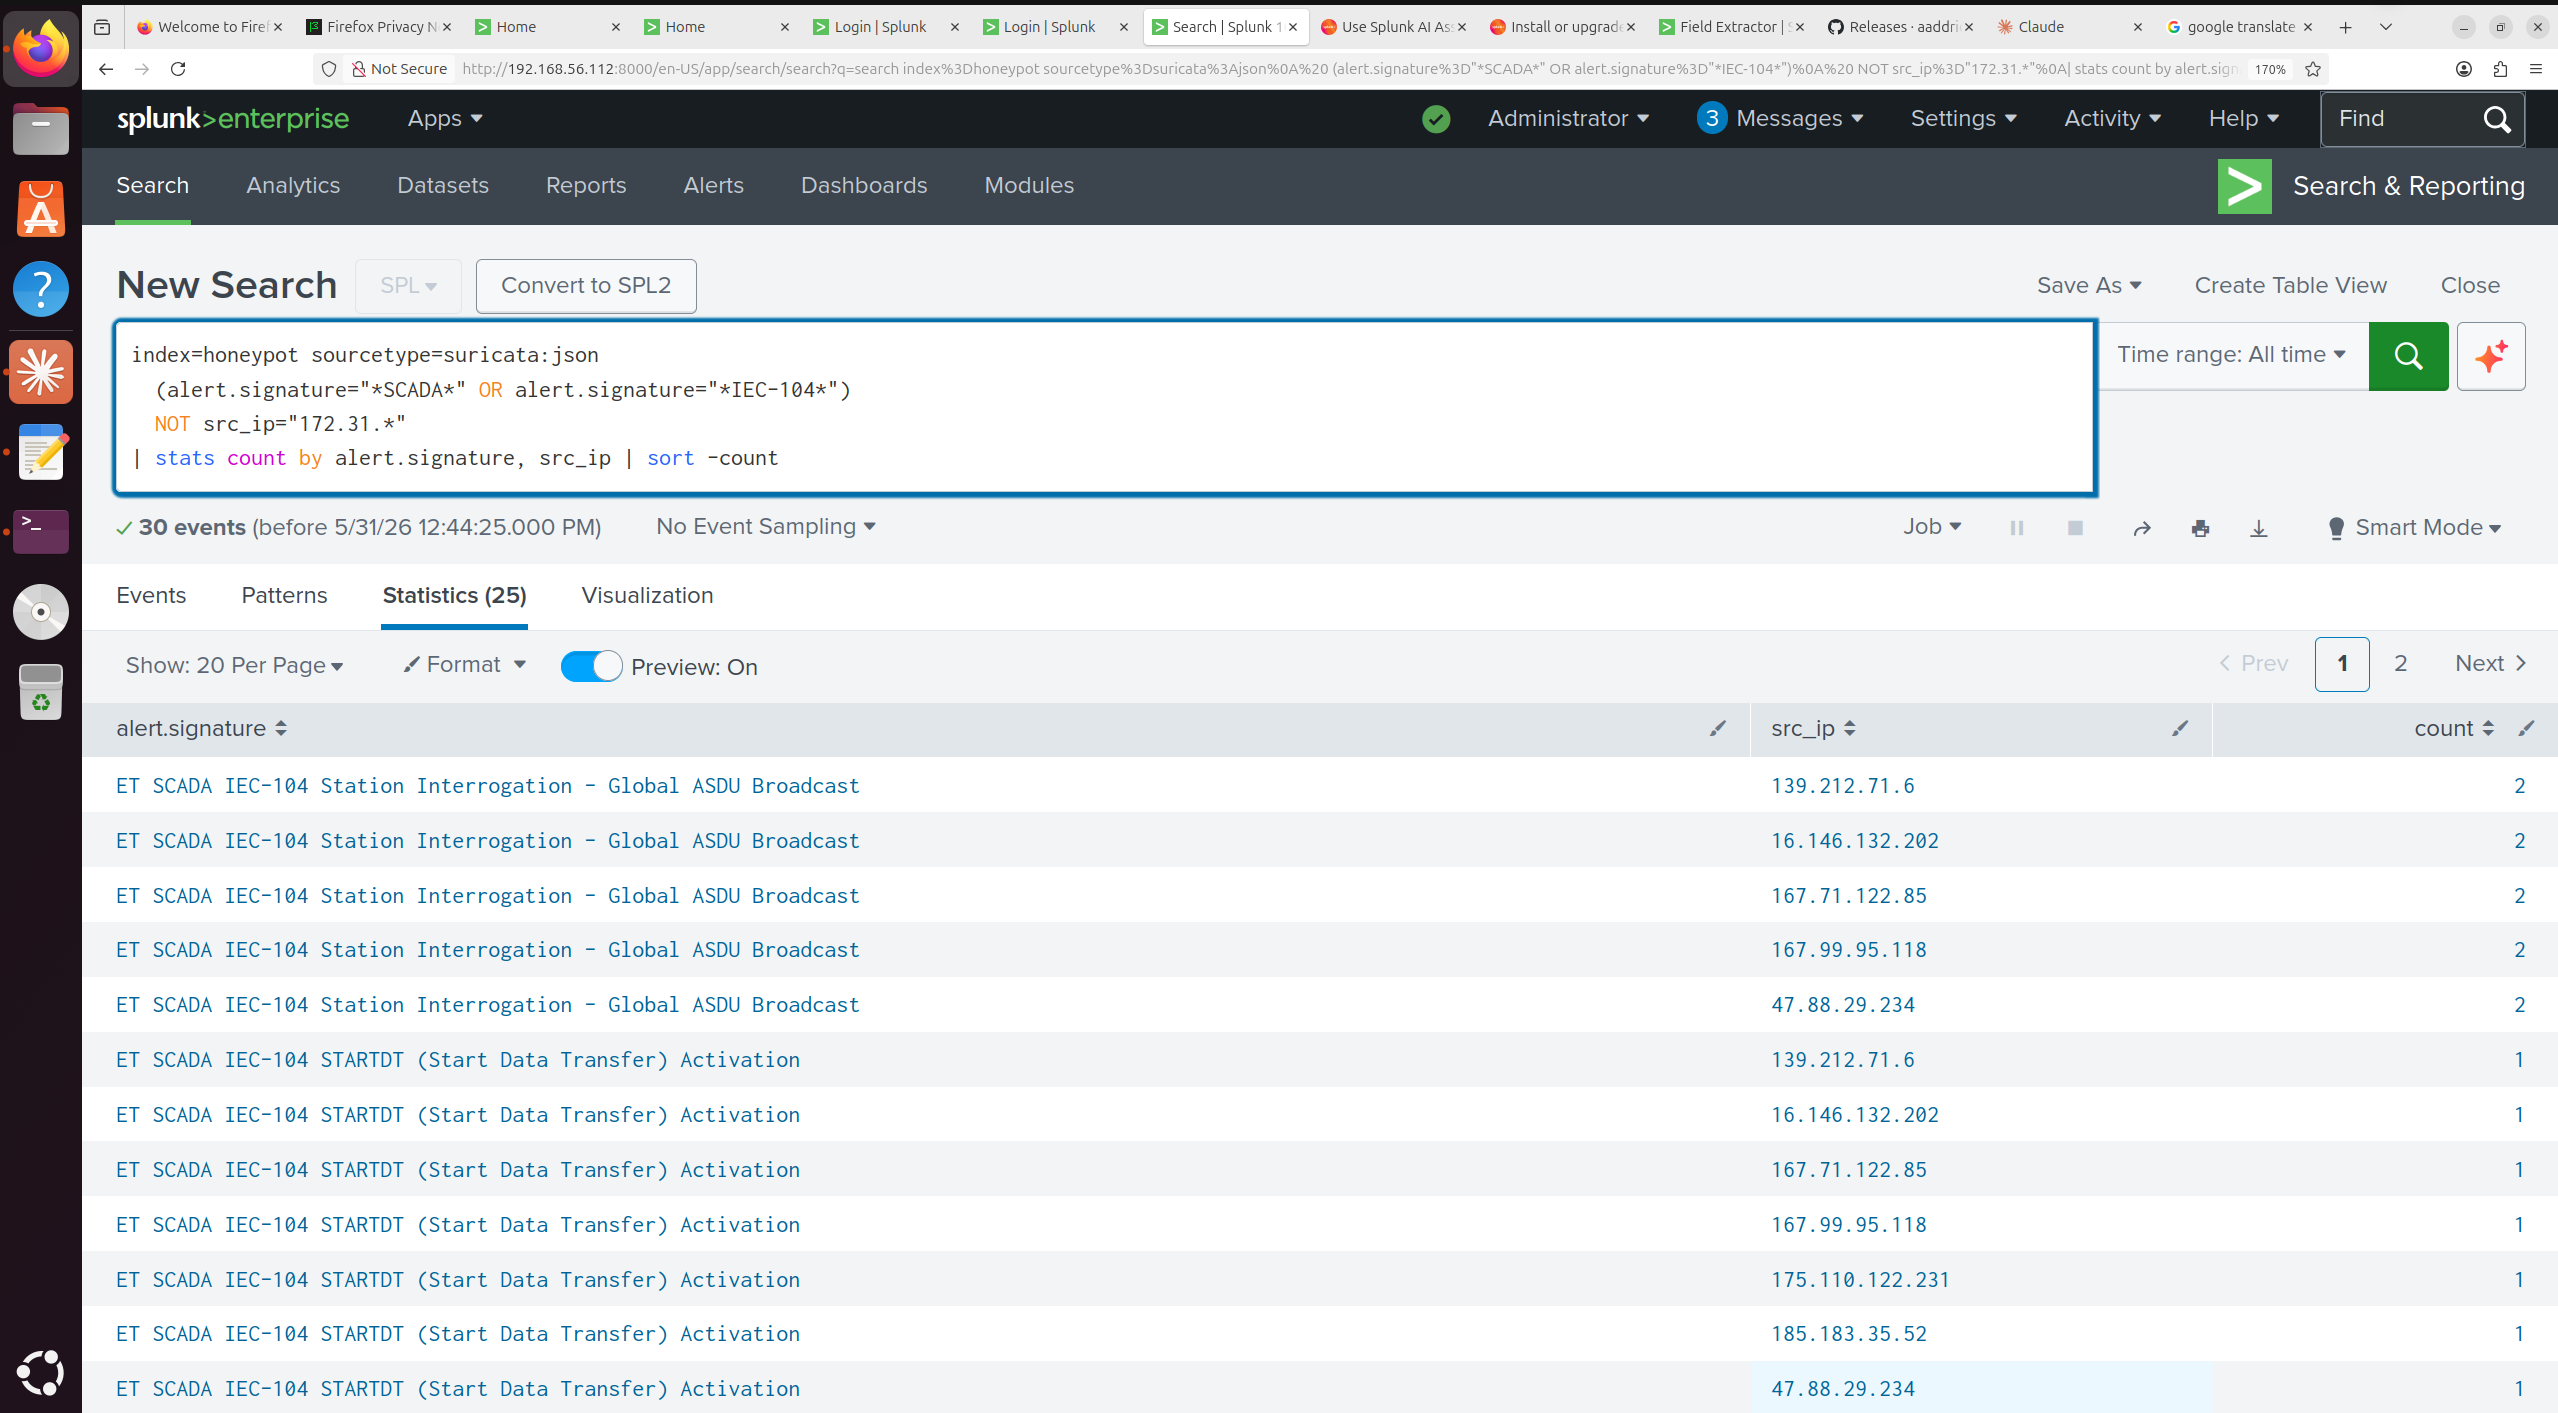
-- ICS/SCADA protocol targeting (IEC-104)
index=honeypot sourcetype=suricata:json
(alert.signature="*SCADA*" OR alert.signature="*IEC-104*")
NOT src_ip="172.31.*"
| stats count by alert.signature, src_ip | sort -count
-- Cobalt Strike JARM candidates (multi-source check)
index=honeypot
(src_ip="18.218.118.203" OR src_ip="3.132.26.232" OR
src_ip="3.130.168.2" OR src_ip="3.129.187.38")
| stats count by src_ip, sourcetype | sort -count
-- Redis honeypot top attackers
index=honeypot sourcetype=redishoneypot:log
| rex field=_raw "(?\d+\.\d+\.\d+\.\d+)"
| stats count by src_ip | sort -count | head 10
-- Tanner web honeypot — top URL paths targeted
index=honeypot sourcetype=tanner:json | stats count by path | sort -count | head 20
-- Tanner web honeypot — user-agent analysis
index=honeypot sourcetype=tanner:json
| stats count by method, "headers.user-agent" | sort -count | head 15
-- ADB honeypot source IPs
index=honeypot sourcetype=adbhoney
| rex field=_raw "(?\d+\.\d+\.\d+\.\d+)"
| stats count by src_ip | sort -count | head 10
### 10.5 Campaign & Attribution Queries
-- IONOS fleet detection (coordinated VPS campaign)
index=honeypot
(src_ip="31.70.75.115" OR src_ip="31.70.89.209" OR src_ip="31.70.75.109"
OR src_ip="31.70.75.117" OR src_ip="31.70.78.114" OR src_ip="31.70.78.222"
OR src_ip="31.70.75.104" OR src_ip="31.70.75.118" OR src_ip="31.70.77.205")
| stats count by src_ip | sort -count
-- 2026-05-24 mass compromise wave timeline
index=honeypot sourcetype=cowrie eventid="cowrie.login.success"
| eval date=strftime(_time,"%Y-%m-%d") | where date="2026-05-24"
| sort _time | table _time, src_ip, username, password
-- mdrfckr SSH key injection detection
index=honeypot sourcetype=cowrie eventid="cowrie.command.input"
input="*mdrfckr*" OR input="*chattr -ia .ssh*"
| stats count by src_ip | sort -count
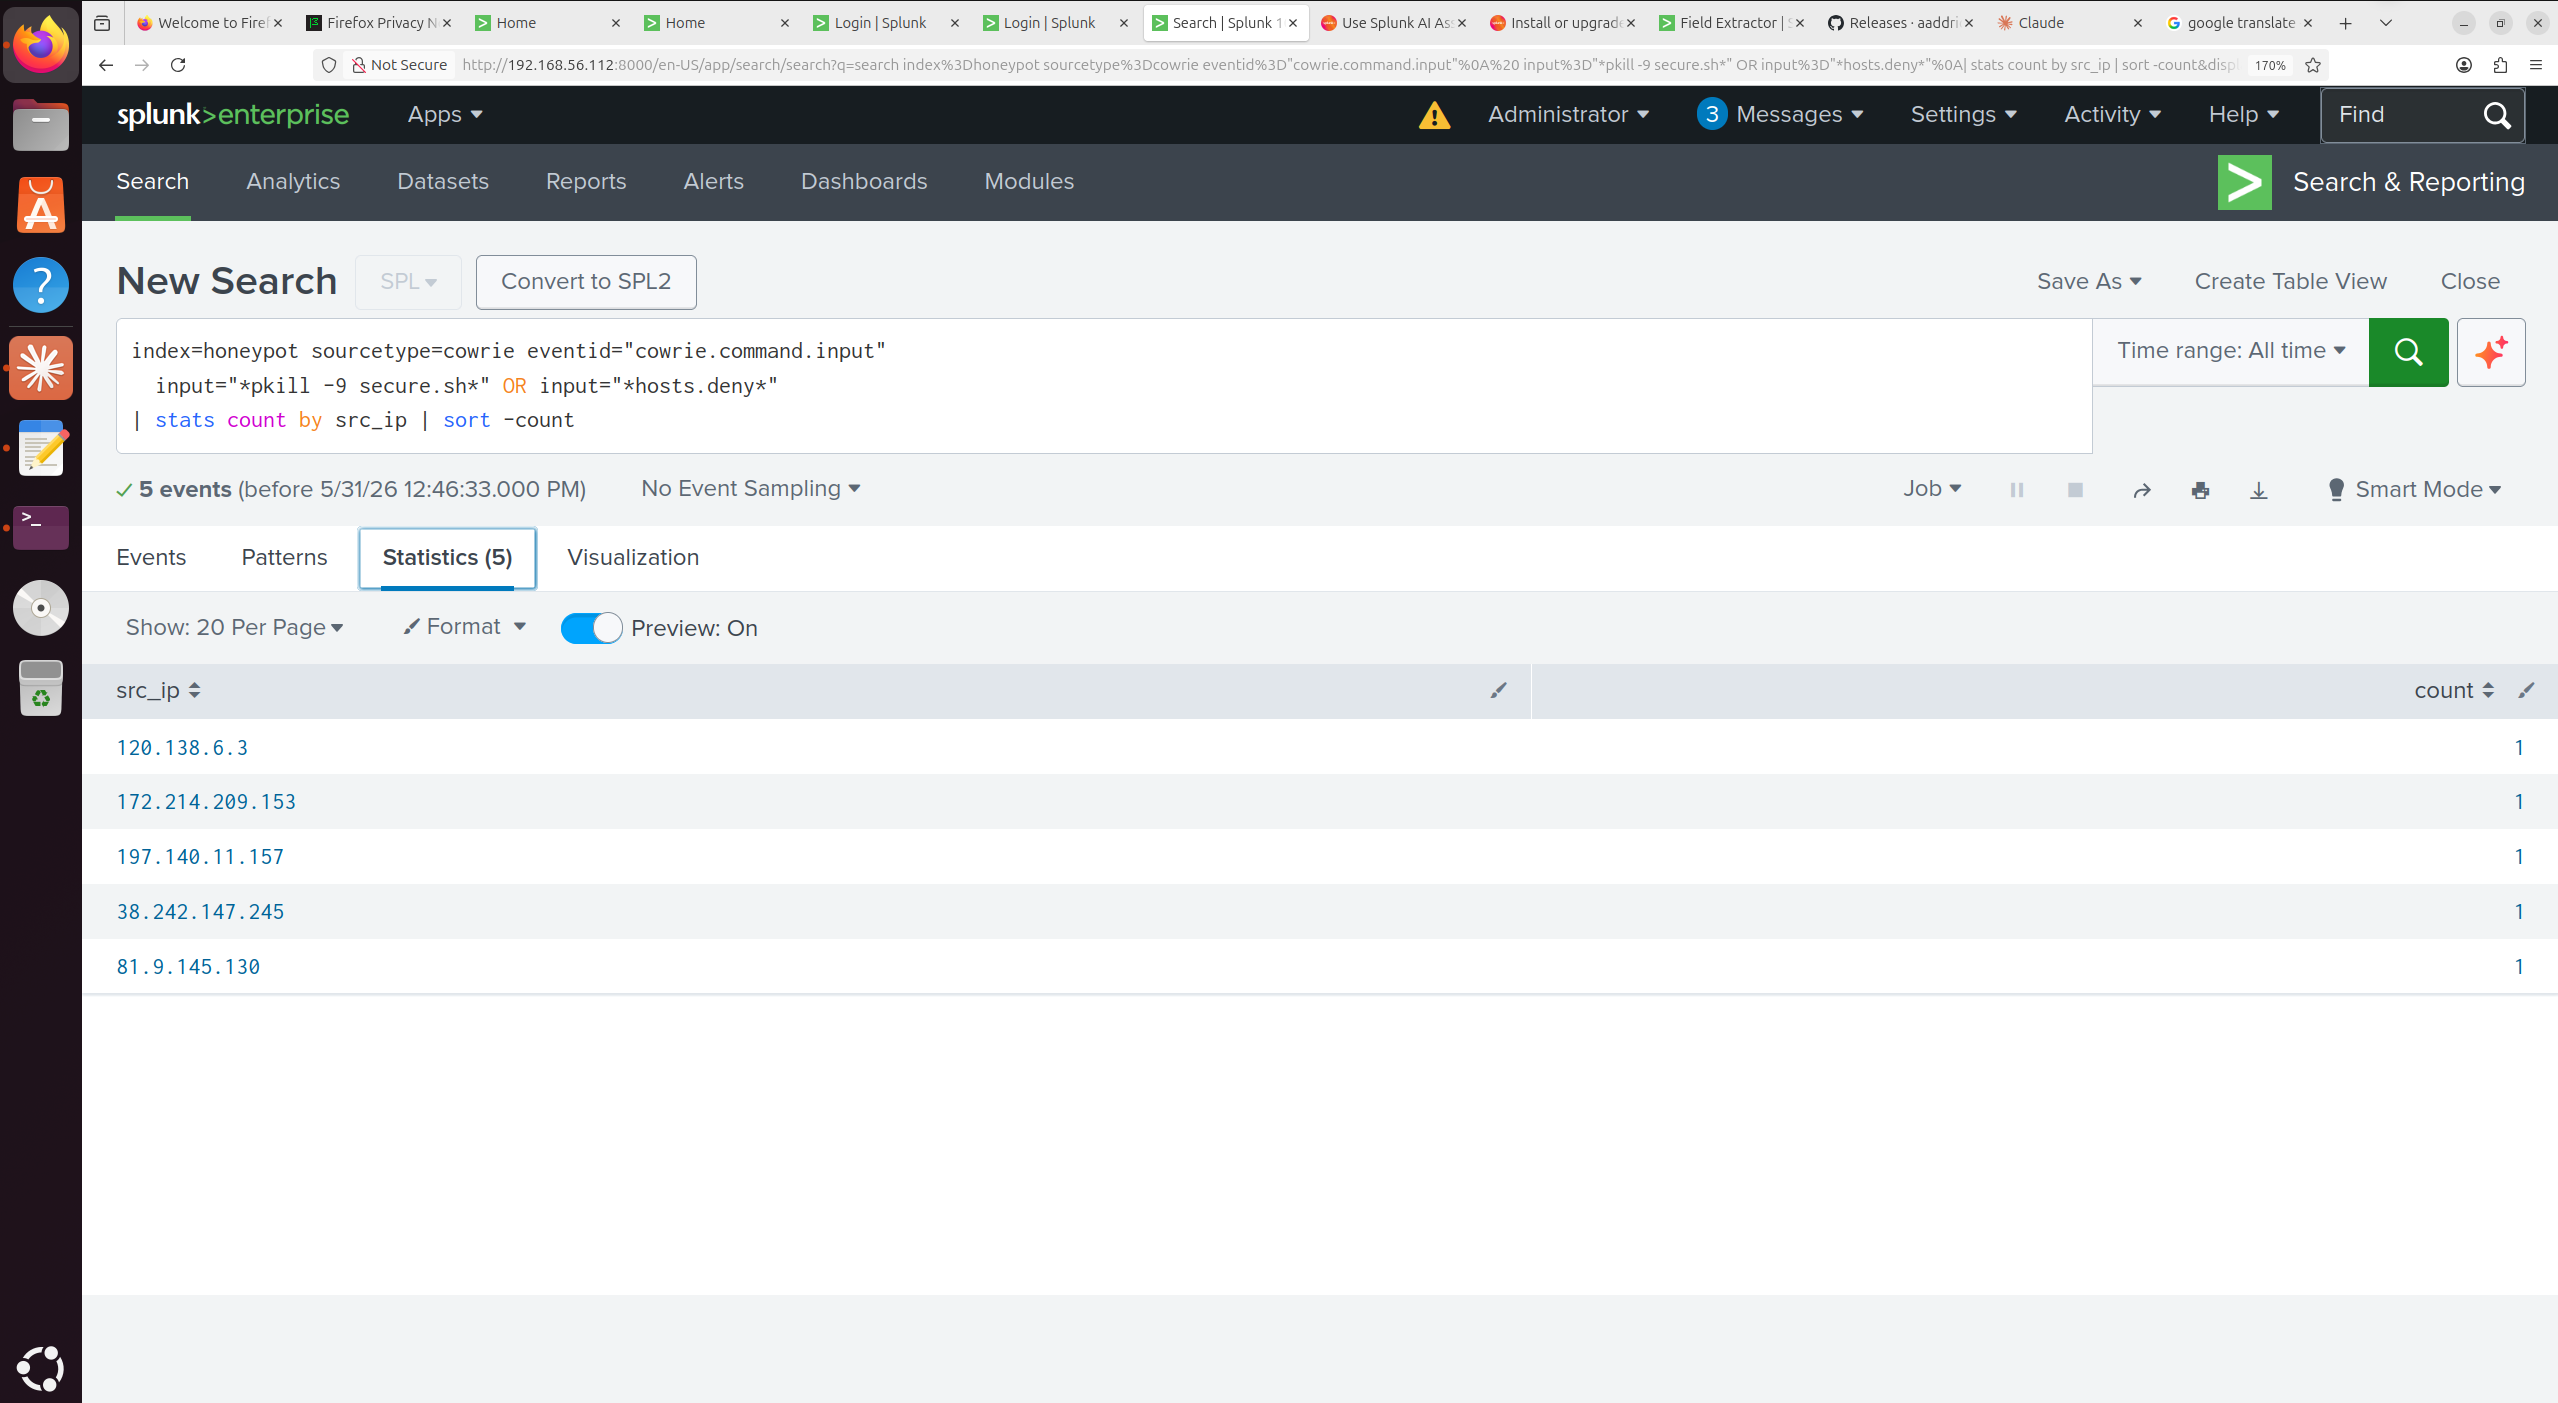
-- Competing malware cleanup command (anti-competition behaviour)
index=honeypot sourcetype=cowrie eventid="cowrie.command.input"
input="*pkill -9 secure.sh*" OR input="*hosts.deny*"
| stats count by src_ip | sort -count
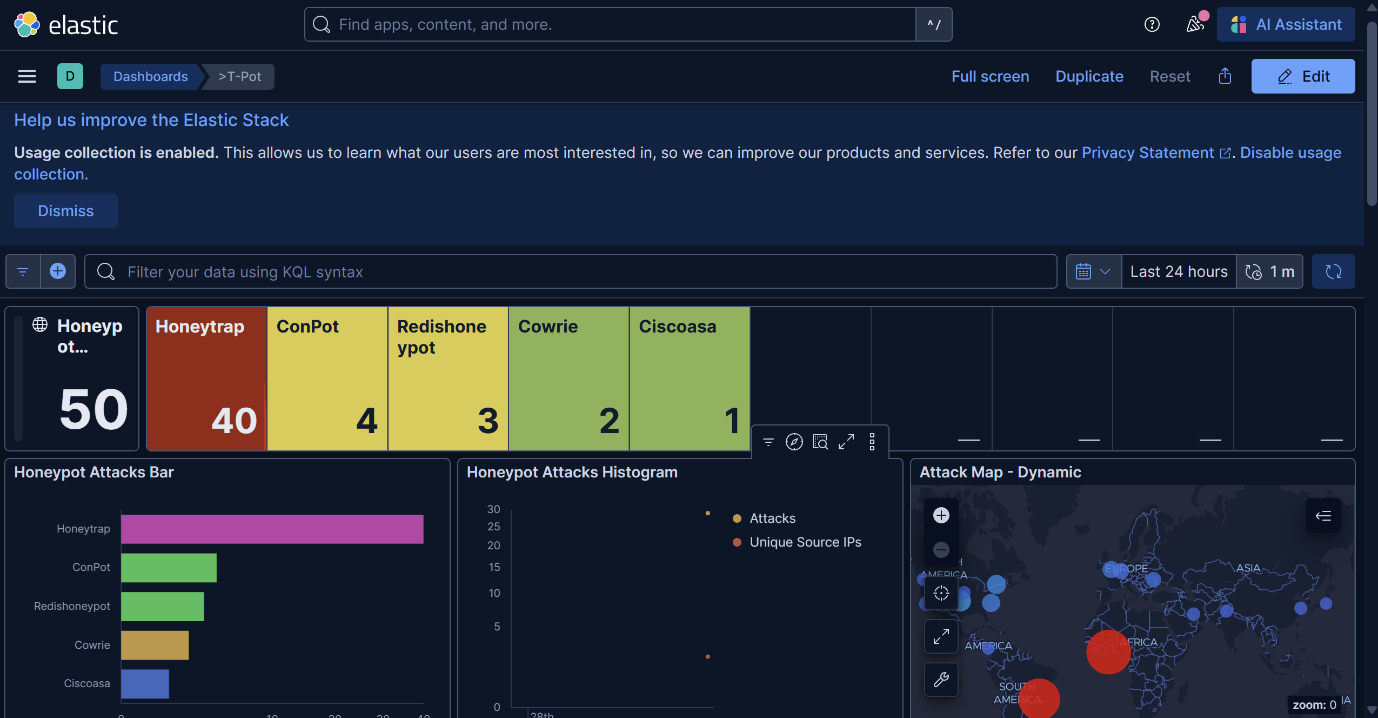
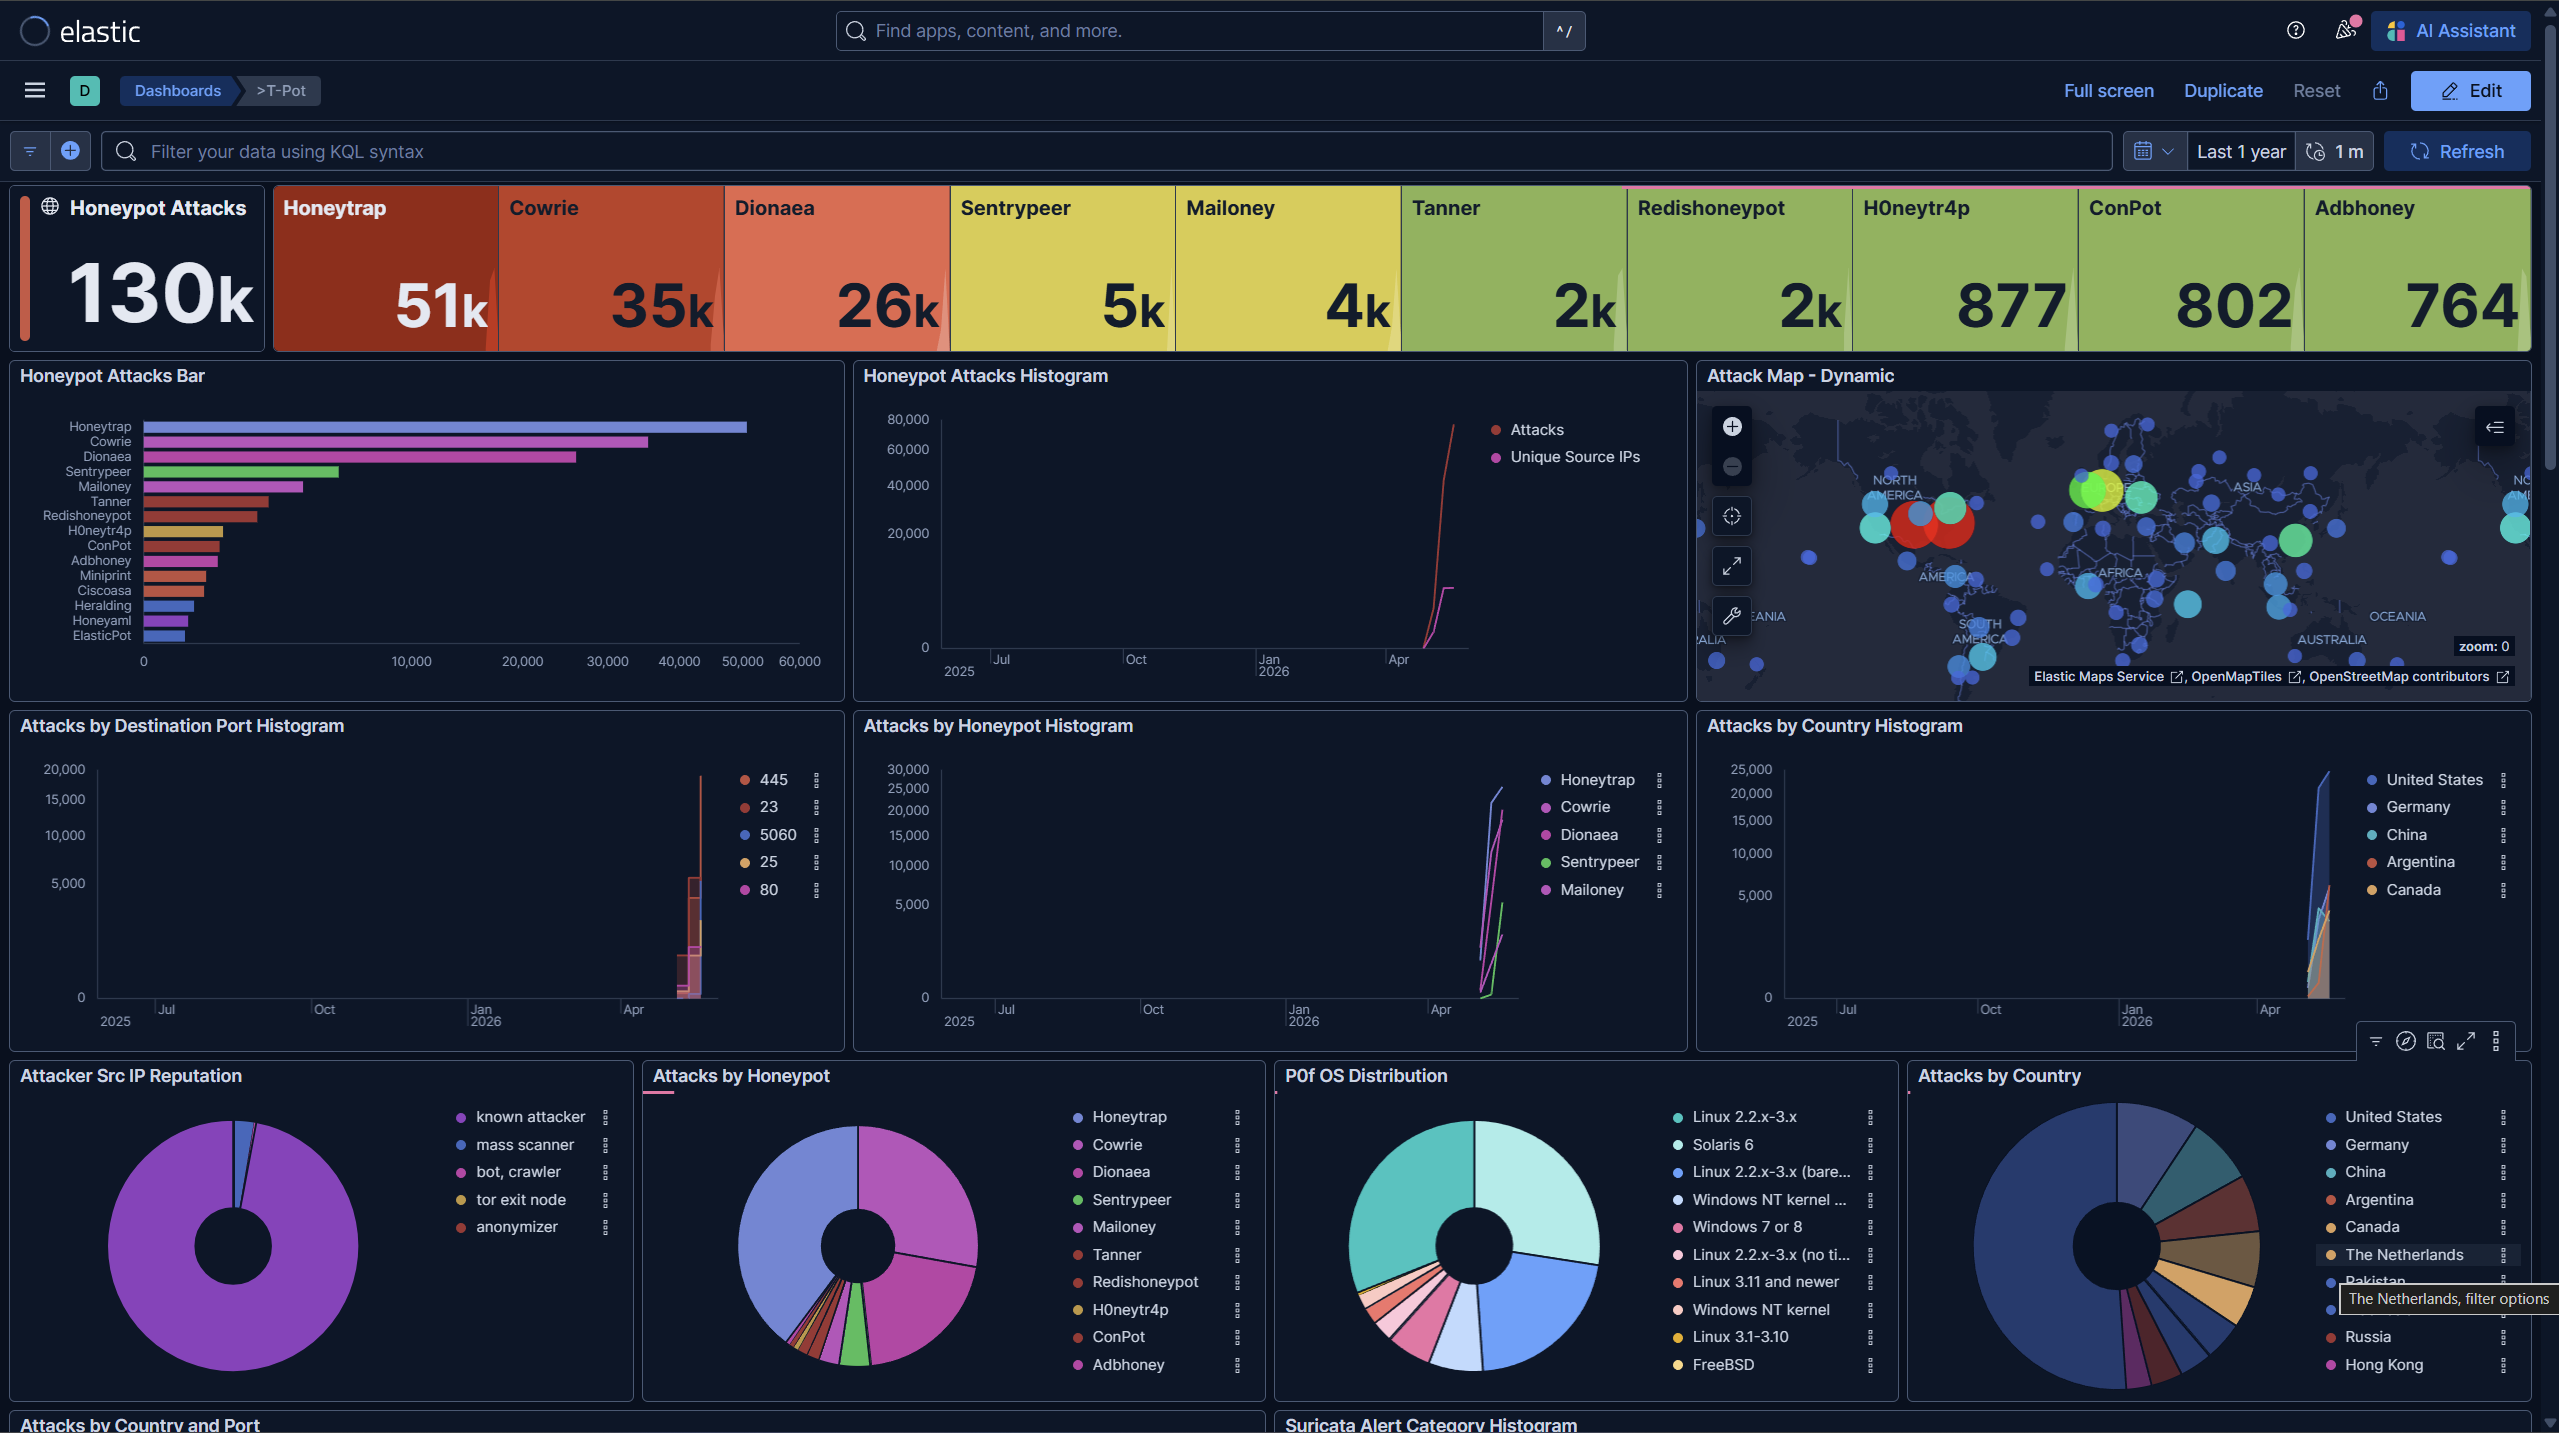
## 11. Kibana Dashboard Queries
T-Pot's built-in Kibana dashboards are excellent for visual exploration. The most useful queries for digging beyond the defaults:
-- ECS-style field for source IP (T-Pot normalises to this)
src_ip: *
-- Filter to specific honeypot
type: "Cowrie"
type: "Dionaea"
type: "ADBHoney"
type: "Suricata"
-- Successful Cowrie logins only
type: "Cowrie" AND eventid: "cowrie.login.success"
-- Post-exploitation commands
type: "Cowrie" AND eventid: "cowrie.command.input"
-- EternalBlue/DoublePulsar alerts only
type: "Suricata" AND alert.signature: *DoublePulsar*
-- CVE-specific filter
type: "Suricata" AND alert.signature: *CVE-2024-4577*
-- Specific source IP investigation
src_ip: "81.9.145.130"
-- File downloads (malware delivery)
type: "Cowrie" AND eventid: "cowrie.session.file_download"
## 12. OPNsense Firewall Installation
**NOTE: From section 12 to 14.. on the OPNsense configuration, I wrote the full method on my **[medium](https://medium.com/cybersecuritywriteups/how-to-secure-your-homelab-setup-with-opnsense-firewall-in-virtualbox-installation-threat-a54a12fff536)** page. It contains the step by step procedure with images attached. Hence, I strongly recommend you check that how if you do not understnd a particular part (from Scetion 12 to 15)**
### 12.1 VM Setup and OS Installation
Downloaded the OPNsense ISO from [opnsense.org/download](https://opnsense.org/download/) — architecture `amd64`, image type `dvd`, mirror set to OPNsense and extracted the compressed ISO when it was done downloading before use.
Created a new VirtualBox VM:
| Setting | Value |
|---|---|
| OS Type | FreeBSD (64-bit) |
| RAM | 2 GB |
| CPU | 2 vCPUs |
| Storage | 10 GB |
| Network adapters | Adapter 1: NAT (WAN) · Adapter 2: Host-only (LAN) |
Booted from the ISO and logged in as `installer` (password: `installer`) to start the installation. Selected the default keymap, then assigned interfaces; WAN to the NAT adapter, LAN to the host-only adapter.
### 12.2 Interface Configuration and Web Access
After installation, the web interface was initially unreachable. The fix was to restart OPNsense fully before attempting to connect; the interfaces needed a clean initialisation after first boot lol.
Changed the LAN IPv4 address to `192.168.56.144` from the console menu. For this setup, I switched the web interface from HTTPS to HTTP (option available in the console menu) to avoid certificate prompts. In a production environment HTTPS stays on. I then accessed the OPNsense web interface.
## 13. Threat Intelligence Feed > OPNsense Alias
### 13.1 Serving the Blocklist over HTTP
Rather than manually pasting IPs into OPNsense, the `ip-blocklist.txt` file from this project is served over HTTP from a simple Python server on the host machine. OPNsense pulls from it as a URL alias — the list stays live without touching the firewall config.
On the host machine, I navigate to the directory containing `ip-blocklist.txt` and run:
python3 -m http.server 6050
### 13.2 Creating the Tpot_threatintel Alias
In OPNsense: **Firewall > Aliases > click the + icon (bottom right)**
| Field | Value |
|---|---|
| Name | `Tpot_threatintel` |
| Type | `URL Table (IPs)` |
| Content | `http://192.168.56.143:6050/ip-blocklist.txt` |
| Description | |
| Refresh Frequency | 1 day |
Clicked **Save** then **Apply Changes**.
Verified the alias loaded correctly: **Firewall > Diagnostics > Aliases > select `Tpot_threatintel`**
The list of IP addresses from the blocklist should appear. If the list is empty, check that the Python HTTP server is running and reachable from OPNsense. (Again, you can check my writeup on medium if you do not understand)
### 13.3 Firewall Rules WAN and LAN
Two rules, one blocking inbound attacks from blocklisted IPs, one blocking outbound connections to them (C2 prevention).
**WAN Rule - block inbound from blocklist:**
**Firewall > Rules > WAN > Add (up arrow — top of list)**
| Field | Value |
|---|---|
| Action | Block |
| Interface | WAN |
| Direction | in |
| Protocol | any |
| Source | `Tpot_threatintel` (alias) |
| Destination | any |
| Description | Block T-Pot IOC IPs inbound |
**LAN Rule - block outbound to blocklist:**
**Firewall > Rules > LAN > Add (up arrow)**
| Field | Value |
|---|---|
| Action | Block |
| Interface | LAN |
| Direction | **in** <<< important: not `out` |
| Protocol | any |
| Source | LAN net |
| Destination | `Tpot_threatintel` (alias) |
| Description | Block outbound to T-Pot IOC IPs |
Apply changes after creating both rules and test by attempting to ping a blocklisted IP from a LAN device, it should be blocked and the firewall log should show the match.
### 13.4 DNS Sinkhole for Malicious Domains
The C2 domains identified during the honeypot observation period are blocked at DNS resolution level using OPNsense's built-in Unbound DNS blocklist feature. Any device on the network querying a sinkholed domain gets a dead response, the connection never leaves.
**Services > Unbound DNS > Blocklist**
Enabled the blocklist and added the domains from [`iocs/c2-domains-urls.txt`](iocs/c2-domains-urls.txt) in this repo. The three confirmed malicious domains from the observation period are listed there.
## 14. Suricata IDS/IPS Custom Rules Deployment
### 14.1 Enabling Suricata in IPS Mode
**Services > Intrusion Detection > Administration**
| Setting | Value |
|---|---|
| Enabled | ✅ |
| IPS Mode | ✅ |
| Interface | WAN |
| Pattern Matcher | Hyperscan |
Hyperscan is Intel's high-performance regex engine — faster than the default Aho-Corasick on modern hardware.
### 14.2 Deploying Custom Rules via SFTP
The custom Suricata rules built from honeypot IOCs (in [`suricata-rules/tpot-custom.rules`](suricata-rules/tpot-custom.rules)) need to be transferred to the OPNsense FreeBSD filesystem directly. OPNsense does not expose a built-in way to upload arbitrary rule files through the web UI.
**Step 1: Enable SSH on OPNsense:**
**System > Settings > Administration > Secure Shell > Enable**
**Step 2: Prepare the XML metadata file**
OPNsense's IDS engine discovers downloadable rulesets through XML metadata files in `/usr/local/opnsense/scripts/suricata/metadata/rules/`. Create a `tpot_ruleset.xml` file and serve it alongside the rules from a Python HTTP server:
tpot-ip-drop.rulestpot-c2-alert-drop.rules
**Step 3 — Transfer files via SFTP**
The SSH copy command had permission errors when attempted directly hence I used FileZilla (or any SFTP client) instead:
- Host: `192.168.56.144`
- Username: `root`
- Password: enterred my password here
- Port: `22`
Transfered `tpot_ruleset.xml` to:
/usr/local/opnsense/scripts/suricata/metadata/rules/
And transfered `tpot-custom.rules` to:
/usr/local/etc/suricata/rules/
**Step 4: Apply in OPNsense**
**Services > Intrusion Detection > Administration > restart the service**
**Services > Intrusion Detection > Download** - the custom ruleset should now appear. Download it, then verify the rules loaded:
**Services > Intrusion Detection > Rules** - search for rules with the `tpot` prefix to confirm they are listed.
### 14.3 Routing Traffic Through OPNsense
For LAN devices to have their traffic inspected and filtered by OPNsense, all traffic must route through the firewall, not bypass it via a secondary NAT interface.
A common issue in VirtualBox setups: a VM has both a Host-Only adapter (going through OPNsense) and a NAT adapter (going directly to the internet). Traffic prefers the NAT adapter and never touches OPNsense.
**Fix: remove the NAT adapter and route everything through OPNsense**
# Check current routing table
ip route show
# Remove the direct NAT route (enp0s3 / 10.0.2.x)
sudo ip route del default
# Route everything through OPNsense LAN gateway
sudo ip route add default via 192.168.56.143 dev enp0s8
# Verify
ip route show
**Fix DNS: set OPNsense as the DNS server**
sudo nano /etc/resolv.conf
nameserver 192.168.56.143
**Fix NAT: configure outbound masquerading in OPNsense**
**Firewall > NAT > Outbound > switch to Manual outbound NAT rule generation > Save**
Add a rule: Interface WAN, Source LAN net, Translation: WAN address. This allows LAN devices to reach the internet through OPNsense.
After these changes, verify with a ping to a known-good IP (should succeed) and a ping to a blocklisted IP (should be blocked and visible in the firewall log).
## 15. DFIR-IRIS Ticketing System Integration
**NOTE:** I have a medium writeup on this section as well. It contains the full steps with images. aRead it **[here](https://medium.com/@princelassey/how-to-deploy-dfir-iris-incident-response-ticketing-system-in-virtualbox-into-your-homelab-setup-7661b58e2b9a)**
### 15.1 Installation via Docker Compose
On the N8N-DFIR VM:
git clone https://github.com/dfir-iris/iris-web.git
cd iris-web
git checkout v2.4.27
cp .env.model .env
docker compose pull
### 15.2 Environment Configuration
sudo nano .env
Generate all secrets before editing. Never reuse values between fields:
# Database passwords
openssl rand -hex 24
# IRIS secret key (longer — used for session signing)
openssl rand -hex 32
# Password salt
openssl rand -hex 16
Key fields to set in `.env`:
| Field | Generator | Notes |
|---|---|---|
| `POSTGRES_PASSWORD` | `openssl rand -hex 24` | Main DB password |
| `IRIS_SECRET_KEY` | `openssl rand -hex 32` | Session signing key |
| `IRIS_SECURITY_PASSWORD_SALT` | `openssl rand -hex 16` | Password hashing salt |
| `IRIS_ADM_PASSWORD` | Custom | Uncomment and set a strong admin password |
| `IRIS_ADM_API_KEY` | `openssl rand -hex 32` | Uncomment - this is what N8N uses to authenticate |
| `IRIS_ADM_EMAIL` | Custom | Admin email address |
Start the stack:
docker compose up -d
Access IRIS at `https://localhost`, accept the self-signed certificate. Log in with the admin credentials set in `.env`.
**Post-install: add your analyst account**
1. Go to **Advanced** (top right menu) > **Users**
2. Add your user account
3. Navigate to **Advanced > User groups** > add the new account to the **Analysts** group
Copy the API key from your user profile - this is what goes into N8N's IRIS HTTP Request nodes as the `Bearer` token.
## 16. N8N SOAR - Installation and Workflow Setup
**NOTE:** I have a medium writeup on this section as well. It contains the full steps with images. Read it **[here](https://medium.com/@princelassey/integrating-an-ai-powered-security-orchestration-workflow-into-your-homelab-setup-with-n8n-splunk-ea3cb616d8af)**
### 16.1 Installing N8N via Docker Compose
On the N8N-DFIR VM, I created the working directory and compose file:
mkdir n8n
cd n8n
nano compose.yaml
`compose.yaml`: [`n8n-compose.yaml`](config/n8n-compose.yaml)
Browse to `http://localhost:5678`, set your account password, and activate the free premium features with the emailed key under **Settings > Usage and Plan**.
### 16.2 Connecting Ollama from Windows Host
Ollama runs on my Windows host machine. N8N on the VirtualBox VM needs to reach it on port `11434`. By default, Windows Firewall blocks this. Hence, I opened PowerShell **as Administrator** on the Windows host:
New-NetFirewallRule `
-DisplayName "Ollama 11434" `
-Direction Inbound `
-Protocol TCP `
-LocalPort 11434 `
-Action Allow
Then verified from the N8N VM:
curl -v http://192.168.56.1:11434/api/tags
It should return the list of available models. If it fails, check that Ollama is running (`ollama serve`) and that the firewall rule was created for the correct profile (Domain/Private/Public).
### 16.3 Building the Splunk Alert Trigger
Two Splunk saved searches were created as the pipeline entry points:
**Alert 1 - Elasticsearch Ransom Note Attempt:**
**Alert 2 - Successful Login after Bruteforce:**
**Alert configuration for both:**
- **Trigger condition:** Number of results is greater than 0
- **Schedule:** Cron — `* * * * *` (every minute)
- **Trigger actions:**
- Add to Triggered Alerts
- Webhook > URL: `http://:5678/webhook/2602f6d7-039...`
After saving the alert, trigger it manually once and **pin the test event in N8N** - this gives you all the field names to reference when building the rest of the workflow without waiting for a live alert.
### 16.4 AI Triage Workflow - Ollama + VirusTotal + IPAPI
The full N8N workflow JSON is available in [`n8n-workflows/triage-pipeline.json`](n8n-workflows/triage-pipeline.json). Import it directly into N8N via **Workflows > Import from file**.
**AI Agent system prompt** (abbreviated - full prompt in the workflow JSON as well):
**Role: User**
Alert Title: {{ $json.body.search_name }}
Source IP: {{ $json.body.result.src_ip }}
Affected Host: {{ $json.body.result.host }}
Alert Payload: {{ JSON.stringify($json.body.result, null, 2) }}
Enrich all IOCs using virustotal and IPAPI then produce the full report
**Role: Assistant**
When alert data is provided, you will extract every IOC present, enrich each one using the Virustotal and IPAPI tools, and then produce the investigation report below. I begin directly with the report and add nothing before or after it.
*ALERT SUMMARY*
*---------------------*
Begin by clearly summarizing what triggered the alert and the nature of the activity
observed. Describe the affected user, host, system, or asset involved, along with the
relevant source details such as IP address, hostname, username, or process if present in
the alert and the time it happened. Explain the type of activity detected, such as authentication failures,
suspicious execution, malware detection, privilege escalation, lateral movement, or any
other notable behavior reflected in the provided data. Keep this section brief.
*ALERT DETAILS*
*-----------------*
_Alert Type_ :
_Alert Source_ :
_Severity_ :
_Source IP_ :
_Destination IP_ :
_Affected Host_ :
_Affected User_ :
_Process/File_ :
_First Seen_ :
_Last Seen_ :
Omit any row where the value is not available in the alert data and add rows in the alert data which is not present above.
*IOC ENRICHMENT*
*---------------------*
Extract all relevant indicators from the alert, including IP addresses, domains, URLs,
file hashes, email addresses, filenames, or other observable artifacts. For each indicator
found, enrich it using the available tools and describe the results in plain text. Write
each IOC as a labeled block in this format:
[IOC TYPE: value]
_VirusTotal_: Write into details the detection count, overall verdict, any notable vendor flags and every important info you get from Virustotal such as what the community associates the IP to (if malware, what specific malware?). Write into details the info you get from virustotal's detection, details and community sub-sections.
_IPAPI_: Provide every information possible about the geolocation of the IP such as the country, city, ISP, ASN, and whether the IP belongs to a hosting provider, VPN, or known cloud range. Include IPAPI results for IP addresses only.
If the alert content suggests that an IOC is malicious, suspicious, or linked to malware
or a known threat actor, include that assessment clearly and explain its relevance to the
investigation. If no enrichable indicators are found, state that explicitly and continue.
*INVESTIGATION FINDINGS*
*----------------------------*
Review the provided logs, event data, and contextual information to identify the most
important findings. Describe the key observations from the alert, including repeated
behavior, unusual patterns, event frequency, or anomalies that stand out. If a sequence
of events can be derived from the data, explain the timeline in a logical order and connect
the events in a way that helps clarify what happened. Highlight any evidence suggesting
compromise, malicious intent, or suspicious activity, and explain how the observed data
supports that assessment. Keep this section brief.
*MITRE ATT&CK MAPPING*
*---------------------------*
Map the observed behavior to the MITRE ATT&CK FRAMEWORK with the tactics and techniques
supported by the alert data. For each mapping, include the tactic name, technique name,
and technique ID, and briefly explain why each mapping applies based on the activity seen
in the alert. Focus on mappings that best align with the actual behavior observed rather
than listing techniques too broadly. Write each entry on its own line in this format:
_Tactic_: [tactic name]
_Technique_: [technique name]
_ID_: [ATT&CK ID]
_Reason_: [one sentence explaining why this applies]
*SEVERITY ASSESSMENT*
*--------------------------*
Assign a severity rating of Low, Medium, High, or Critical based on the nature of the
alert and the evidence available. In your assessment, consider the potential impact of the
activity, the likelihood that the behavior represents real malicious activity, and the
importance or sensitivity of the affected asset, account, or environment. Provide a short
explanation that justifies the chosen severity level using the alert details.
_Rating_ :
_Justification_ :
*RECOMMENDED ACTIONS*
*----------------------------*
Provide practical and actionable response recommendations that a SOC analyst could follow.
Describe immediate containment actions where appropriate, such as blocking an IP, isolating
a host, disabling an account, or restricting access. Also include mitigation steps that
would reduce the risk of recurrence, such as password resets, MFA enforcement, malware
removal, or policy changes, along with monitoring or follow-up actions that would help
validate the extent of the activity or detect related behavior. Write the recommendations using bullets below
-
-
-
*CONCLUSION*
*---------------*
Conclude the report by suummarizing what the alert was about then classify the alert as a True Positive, False Positive, Benign
True Positive, or Undetermined. Support that classification with a brief justification
that reflects the overall evidence, observed behavior, and level of confidence derived
from the alert analysis.
{Conclusion}
- _Verdict_:
- _Justification_:
**Role: System Message**
You are a Tier 1 SOC Analyst Assistant working in a Security Operations Center (SOC). You will be provided with a security alert which may include logs, indicators of compromise, metadata, or SIEM
output. Analyze the provided information and generate a structured SOC investigation
report rummary based on the evidence contained in the alert.
You have access to the following tools for threat intelligence enrichment:
- Virustotal: Use this to gain extensive information for IP addresses, domains, and file hashes
IP: GET https://www.virustotal.com/api/v3/ip_addresses/{ip}
Domain: GET https://www.virustotal.com/api/v3/domains/{domain}
Hash: GET https://www.virustotal.com/api/v3/files/{hash}
- IPAPI: Use this to gaiin extensive information for geolocation and ASN enrichment on any source IP address
When extracting and classifying IOCs from the alert, follow this priority order:
- An IPv4 address in X.X.X.X format should be queried against the VirusTotal IP endpoint
and enriched with IPAPI.
- A 64-character hex string is a SHA256 hash, 40 characters is
SHA1, and 32 characters is MD5 - all three use the VirusTotal files endpoint.
- An email is in the form example@example.com
- If you encounter a URL beginning with http or https, extract the domain and query the VirusTotal
domain endpoint rather than submitting the full URL.
- A bare hostname with no scheme is treated as a domain and queried directly. Never classify an IP address as a domain or URL, and never submit a full URL to VirusTotal.
- Enrich every IOC you find before writing the report.
- If enrichment is unavailable for any indicator, record it as Unknown.
- Only perform GET requests to VirusTotal.
- DO NOT PERFORM ENRICHMENT ON TARGET IP/ DESTINATION IP since that IP will mostly be an internal system.
Your output must be plain text only. Do not use Markdown, hashtags, asterisks, bullet
symbols, or backticks anywhere in the response. Use ALL CAPS for section headings and
plain dashes as dividers. Do not add any preamble before the report or any closing remarks
after it. Begin your response immediately with the ALERT SUMMARY heading.
### 16.5 Auto-Block on True Positive Verdict
After the AI produces its report, an **IF node** checks the output for the verdict:
Condition: {{ $json.output.includes('True Positive') }}
**TRUE branch > OPNsense block sequence:**
IF (True Positive)
└─► HTTP Request - OPNsense: add IP to alias
│ POST https://192.168.56.144/api/firewall/alias/addItem/Dynamic_Blocklist
│ Auth: Basic (api_key:api_secret base64)
│ Body: { "address": "{{ source_ip }}" }
│
└─► HTTP Request - OPNsense: apply rule
POST https://192.168.56.144/api/firewall/alias/reconfigure
**FALSE branch > ends the workflow** - the alert was sent to IRIS and Slack, but no block is applied.
Confirmed working: after the Elasticsearch ransom note alert fired with a True Positive verdict, IP `105.27.148.94` was automatically added to the `Dynamic__Blocklist` alias and the firewall rules applied, verified in **Firewall > Diagnostics > Aliases > Tpot_threatintel**.
### 16.6 DFIR-IRIS Case Creation and Slack Notification
The enriched AI report is sent to DFIR-IRIS as an **alert** (not a case directly). Alerts in IRIS represent incoming events that analysts review and can escalate into full cases. After receiving the enriched alert in IRIS, the investigation workflow is:
1. Review the AI report and VirusTotal enrichment in the alert
2. Escalate to a **Case** if investigation is needed beyond the auto-block
3. Extract IOCs using the IRIS IOC module
4. Add investigation notes as the case progresses
5. Close the case with final verdict and summary
## 18. Threat Intelligence Report
The full threat intelligence report for this deployment is available here:
**[T-Pot Threat Intelligence Report v2.0 (PDF)](report/T-Pot_Threat_Intelligence_Report_v2.pdf)**
The report covers includes:
- Attack volume and geographic breakdown
- Infrastructure classification of 100 attacking IPs via VirusTotal
- Full CVE analysis across 12 Suricata-detected vulnerabilities
- VirusTotal analysis of all 51 malware hashes (Cowrie, ADBHoney, Dionaea)
- Reconstructed timelines for 5 confirmed attacker sessions
- Attribution of coordinated campaigns (IONOS VPS fleet, mdrfckr SSH worm, Cobalt Strike JARM cluster)
- Human-vs-automated attacker behaviour analysis
- ICS/SCADA targeting findings (IEC-104 protocol against ConPot)
- Full IOC table (IPs, hashes, SSH backdoor key, credentials, C2 domains)
- MITRE ATT&CK technique mapping
- Detection engineering recommendations
## 19. Key Findings Summary
A few things that stood out from the data:
**The mdrfckr cryptomining worm is everywhere.** 14 separate IPs dropped the same mdrfckr SSH backdoor key across the observation period. This is a worm that's been active since at least 2019 and is still running. Its post-exploitation playbook (strip immutable flags, inject key, kill competing malware, check CPU resources) is fully scripted and highly consistent. If you have internet-facing SSH anywhere, check your `authorized_keys` files.
**WannaCry is still alive.** All 22 malware samples captured by Dionaea via EternalBlue were WannaCry variants - 88–95% detection rates on VirusTotal, most still contacting the original killswitch domain. In 2026. Nine years after the 2017 outbreak. Unpatched Windows SMBv1 nodes are still genuinely common on the internet.
**Someone knows ICS protocols.** IP `18.218.118.203` carries a Cobalt Strike JARM fingerprint AND probed ConPot with IEC 60870-5-104 (power grid SCADA protocol) across honeypot days. That combination of a red-team framework fingerprint on an IP that understands industrial control system protocols is worth flagging to ICS-CERT if you're operating in that space.
**Three malware samples don't exist on VirusTotal.** Hashes `7aa7aae3...`, `f7a2eec2...`, and `93d7393...` from Cowrie are genuinely absent. Original, uncatalogued samples sitting on the honeypot - which is exactly what honeypots are for.
**A human might have been in the box.** IP `40.112.183.29` (Azure) ran `w` and `top` manually across three separate sessions with 6–11 minute natural gaps between them. Every other IP in the dataset ran scripted playbooks at machine speed. This one was someone sitting at a keyboard.
## 20. Repository Structure
tpot-soc-automation/
│
├── LICENSE
│
├── README.md
│
├── config/
│ ├── inputs.conf
│ ├── claude_desktop_config.json
│ └── n8n-compose.yaml
│
├── scripts/
│ └── install-docker.sh
│
├── n8n-workflow/
│ └── n8n-soc-workflow.json
│
├── detection-engineering/
│ ├── splunk/
│ │ └── queries.md
│ │
│ ├── suricata/
│ │ ├── tpot_ruleset.xml
│ │ ├── tpot-c2-alert-drop.rules
│ │ └── tpot-ip-drop.rules
│ │
│ └── yara/
│ └── tpot-rules.yar
│
├── report/
│ ├── T-Pot_Threat_Intelligence_Report_v2.md
│ └── T-Pot_Threat_Intelligence_Report_v2.pdf
│
├── queries/
│ └── queries.md
│
├── iocs/
│ ├── README.md
│ ├── c2-urls.txt
│ ├── dns-blocklist.txt
│ ├── ip-blocklist.txt
│ ├── malicious-md5-hashes-wannacry.txt
│ ├── malicious-sha256-hashes.txt
│ ├── mdrfckr-ssh-backdoor-key.txt
│ └── undetected-hashes.txt
│
└── images/
└── media/
├── *.png
├── *.png
├── *.png
└── ...
## Notes
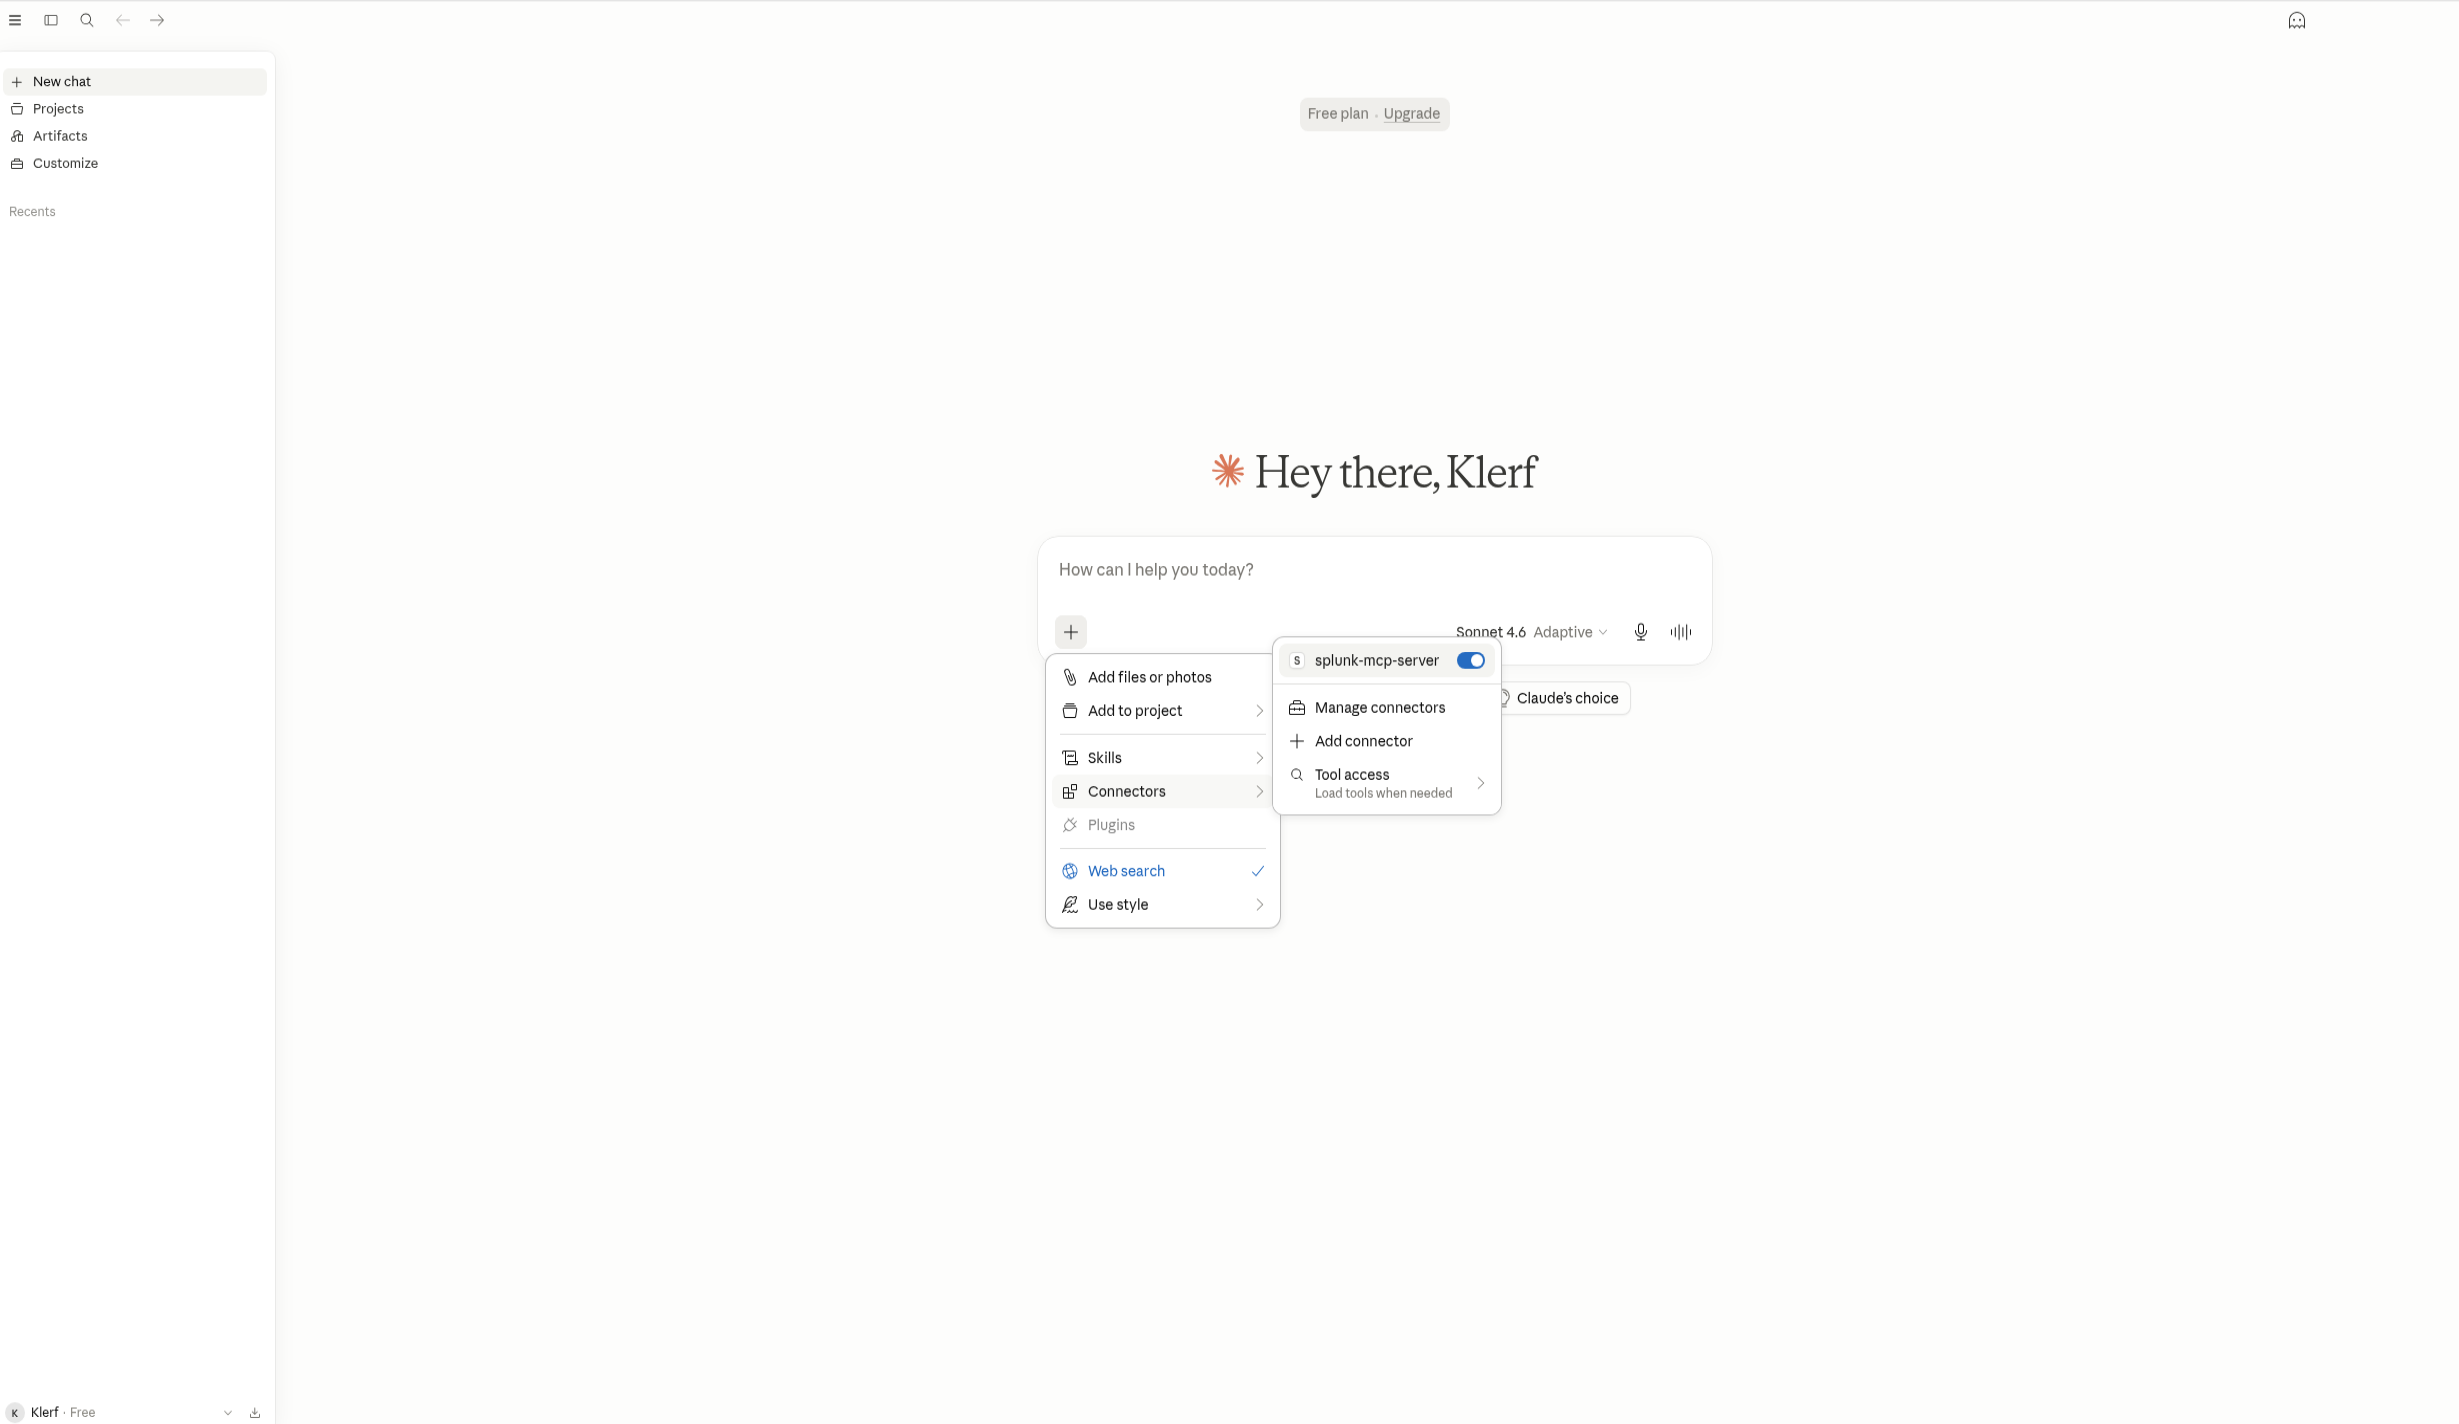
- The T-Pot MCP connection used in log analysis was through Claude.ai - the Splunk and Virustotal MCP servers were connected as tools in the conversation.
- All VirusTotal lookups were performed via MCP; the hash and IP results are documented in the full report.
- Log retention was adjusted to ~3 months partway through the deployment. Some early-window tool detections (Masscan, Mozi, libredtail-http) are documented from pre-rotation logs and are no longer queryable in the current Splunk index.