Surge77/fraud-detection-engine
GitHub: Surge77/fraud-detection-engine
基于 Java 21 和 Spring Boot 构建的实时交易欺诈检测引擎,通过规则匹配、频率检查与加权评分在 200ms 内决定交易放行或拦截。
Stars: 0 | Forks: 0
# 欺诈检测引擎
实时交易欺诈检测引擎 —— 一个 **规则 + 速度 + 加权评分的 pipeline,
能在 200ms 内决定 PASS/BLOCK**。这与支付处理商用于在毫秒内批准或拦截交易的系统属于同一类系统。
构建时首要考虑生产环境需求:幂等性、异步解耦、可观测性、整洁的六边形架构,以及从纯单元测试到 Testcontainers 集成测试的测试金字塔。
[](https://github.com/Surge77/fraud-detection-engine/actions/workflows/ci.yml)
[](https://openjdk.org/projects/jdk/21/)
[](https://spring.io/projects/spring-boot)
[](LICENSE)
## 架构
六边形架构(ports & adapters)。领域 pipeline 具有**零框架依赖**,并且无需基础设施即可完全进行单元测试。
```
┌────────────┐ 202 Accepted
client ─POST─▶│ REST │──────────────────────▶ caller polls GET /{id}
│ Controller │
└─────┬──────┘
│ publish
┌─────▼───────────────┐
│ Kafka │ transactions.incoming (3 partitions)
└─────┬───────────────┘
│ consume (manual ack, idempotent)
┌──────────────▼───────────────────────────────────────┐
│ Fraud pipeline (domain — pure Java) │
│ │
│ RulesEngine ─▶ VelocityChecker ─▶ RiskScorer ─▶ DecisionEngine
│ (blacklist, (Redis INCR+TTL) (weighted) (threshold)
│ limit, geo) │
└───────┬──────────────────┬───────────────┬───────────┘
│ audit │ if BLOCK │ if BLOCK
┌─────▼─────┐ ┌──────▼──────┐ ┌────▼──────────┐
│ PostgreSQL│ │ Kafka │ │ WebSocket │
│ audit_log │ │ .flagged │ │ /topic/... │
└───────────┘ └─────────────┘ └───────────────┘
```
层级划分:`api` → `application` → `domain` (model · pipeline · ports · exception) ← `infrastructure`
(kafka · redis · persistence · websocket) · `batch` · `config`。
## 评分模型
| 信号 | 权重 |
|---|---|
| 黑名单商户 | 40 |
| 高频操作 (>10 tx / 5 min) | 30 |
| 金额超出每日限额 | 20 |
| 高风险地区 | 10 |
评分为触发的权重总和,并限制在 100 以内。**Score ≥ 75 → BLOCK**,否则为 PASS。
权重和阈值已外置到 `application.yml` 中 —— 无需部署代码即可进行调整。
## 技术栈
| 层级 | 技术 |
|---|---|
| 语言 / 框架 | Java 21, Spring Boot 3.3 |
| 消息传递 | Apache Kafka (Spring Kafka) |
| 缓存 / 速度 | Redis 7 (Lettuce) |
| 数据库 | PostgreSQL 15 (Spring Data JPA + Flyway) |
| 批处理 | Spring Batch 5 |
| 实时推送 | WebSocket + STOMP |
| API 文档 | SpringDoc OpenAPI (Swagger UI) |
| 可观测性 | Micrometer + Prometheus + Grafana |
| 测试 | JUnit 5, Mockito, Testcontainers |
| 构建 / 运行时 | Maven, Docker Compose |
## 快速开始
### 前置条件
- JDK 21, Maven 3.9+, Docker + Docker Compose。
### 运行技术栈
```
docker compose up -d # Postgres, Redis, Kafka, Kafka UI, RedisInsight
mvn spring-boot:run # starts the app on :8080 (local profile)
```
### 试用
```
curl -X POST http://localhost:8080/api/v1/transactions \
-H "Content-Type: application/json" \
-d '{
"transactionId": "11111111-1111-1111-1111-111111111111",
"accountId": "acc_001",
"amount": 100.00,
"currency": "USD",
"merchantId": "merch_999",
"merchantName": "Clean Store",
"location": "United States",
"timestamp": "2026-05-30T12:00:00Z"
}'
```
- Swagger UI: `http://localhost:8080/swagger-ui.html`
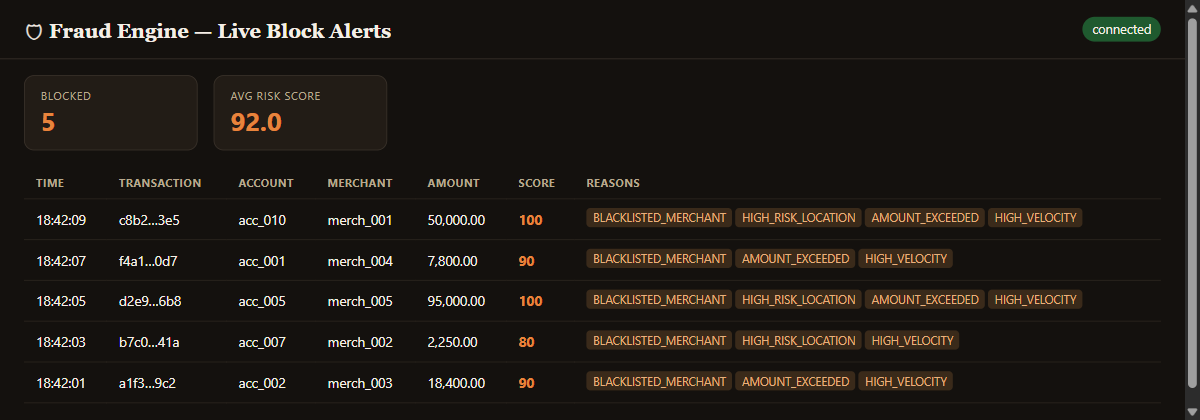
- 实时拦截看板: `http://localhost:8080/dashboard.html`
- Kafka UI: `http://localhost:8081`
- RedisInsight: `http://localhost:5540`
- Prometheus metrics: `http://localhost:8080/actuator/prometheus`
### 查看实际运行中的 BLOCK
打开看板 (`/dashboard.html`),然后触发一笔会触发三个信号的交易 ——
黑名单商户 + 高风险地区 + 超出账户每日限额,然后重复操作超过频率窗口以增加 HIGH_VELOCITY:
```
for i in $(seq 1 11); do
curl -s -X POST http://localhost:8080/api/v1/transactions \
-H "Content-Type: application/json" \
-d "{\"transactionId\":\"$(uuidgen)\",\"accountId\":\"acc_010\",\"amount\":50000,\"currency\":\"USD\",\"merchantId\":\"merch_001\",\"merchantName\":\"Dodgy\",\"location\":\"Nigeria\",\"timestamp\":\"$(date -u +%Y-%m-%dT%H:%M:%SZ)\"}" > /dev/null
done
```
`acc_010` 的限额是 1,000,因此 50,000 超出了此限制;`merch_001` 已被列入黑名单;`Nigeria` 是高风险地区;
第 11 次请求触发频率规则 → 得分 100 → **BLOCK**。看板会在一秒内闪烁出新的一行,并且 `transactions.flagged` topic 会接收到该事件。
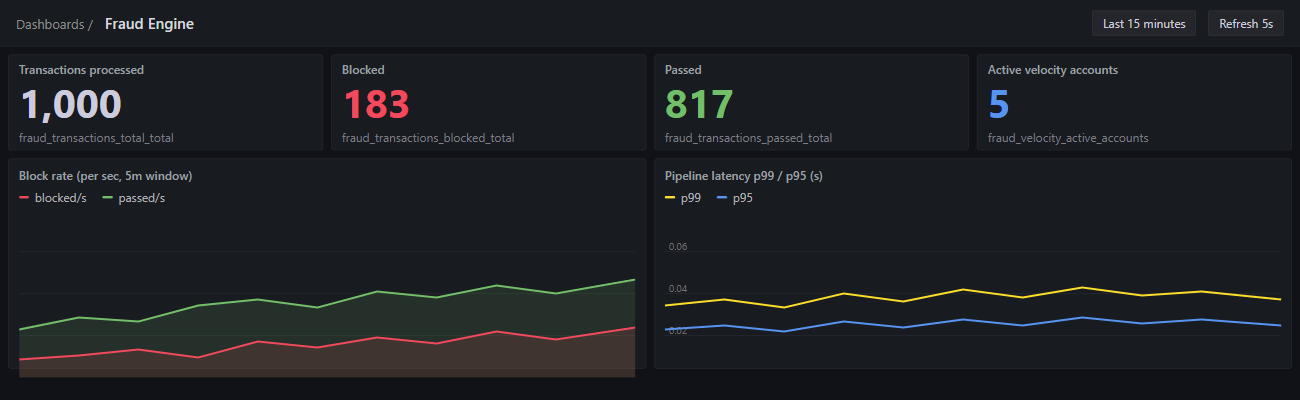
### 监控
```
docker compose -f docker-compose.monitoring.yml up -d
```
- Prometheus: `http://localhost:9090`
- Grafana: `http://localhost:3000` (admin/admin) —— **Fraud Engine** 看板
(拦截率、pipeline p99/p95、活跃的频率账户)会在启动时自动配置。
### 夜间报告(手动触发)
Admin endpoint 需要 `X-Admin-Token` header(`ADMIN_TOKEN` 环境变量,开发环境默认值为 `local-dev-admin-token`):
```
curl -X POST "http://localhost:8080/api/v1/admin/reports/trigger?date=2026-05-30" \
-H "X-Admin-Token: local-dev-admin-token"
curl "http://localhost:8080/api/v1/reports?date=2026-05-30"
```
### 测试
```
mvn test # unit tests + coverage gate (no Docker)
mvn verify # + Testcontainers integration tests (needs Docker)
```
覆盖率要求通过 JaCoCo 在核心 pipeline + 编排层达到 85% 的行覆盖率。
## 路线图
引擎是分阶段构建的;详情请参阅 [docs/ARCHITECTURE.md](docs/ARCHITECTURE.md)。
1. **基础** —— 接入 → 持久化管道 ✅
2. **规则引擎** —— 黑名单、每日限额、高风险地区 ✅
3. **频率 + 评分** —— Redis 频率、加权评分器、决策引擎 ✅
4. **Kafka** —— 完全异步 pipeline、幂等性、死信队列 topic ✅
5. **WebSocket 警报** —— 实时拦截警报看板 ✅
6. **Spring Batch** —— 每日欺诈摘要报告 ✅
7. **可观测性** —— Micrometer metrics、Prometheus、结构化 JSON 日志 ✅
8. **测试** —— 单元 + 集成 + 负载测试 (p99 < 200ms) ✅
## 许可证
[MIT](LICENSE)
标签:Spring Boot, TCP/UDP协议, 事件驱动架构, 反欺诈, 域名枚举, 实时计算, 搜索引擎查询, 测试用例, 自定义请求头, 请求拦截, 软件成分分析, 金融科技, 风控系统