LubnaShireenR/cybershield-cybersecurity-risk-intelligence-dashboard
GitHub: LubnaShireenR/cybershield-cybersecurity-risk-intelligence-dashboard
CyberShield 是一个基于 Python、SQL 和 Power BI 构建的网络安全风险情报仪表板,通过对网络攻击数据的清洗、分析和可视化,帮助安全团队洞察威胁态势并优化事件响应策略。
Stars: 1 | Forks: 0
# CyberShield – 网络安全风险情报仪表板
## 概述
CyberShield 是一款使用 **Python、SQL 和 Power BI** 开发的网络安全风险情报仪表板。该项目通过分析网络安全事件来识别攻击模式、监控风险级别、评估事件响应行动,并通过交互式可视化和高管级别的 KPI 提供可操作的洞察。
该仪表板旨在帮助安全分析师和决策者了解网络威胁、评估网络风险并改进事件管理策略。
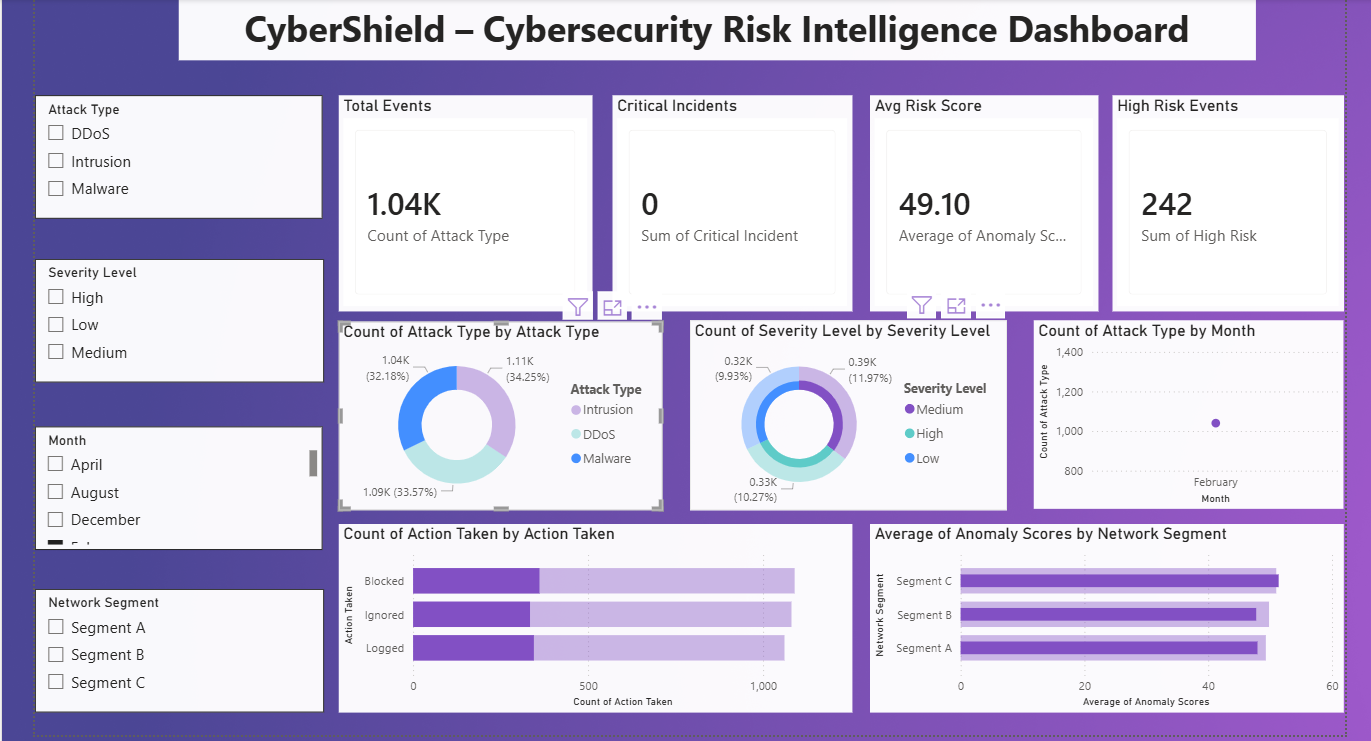
## 仪表板预览
 ---
## 目标
- 分析网络攻击趋势和模式。
- 监控攻击严重程度。
- 评估异常分数和网络风险。
- 评估事件响应的有效性。
- 构建用于网络安全情报的交互式仪表板。
## 关键绩效指标 (KPI)
- 总事件数
- 严重事件
- 平均风险评分
- 高风险事件
## 仪表板功能
### 攻击类型分析
- 网络攻击的分布情况。
- DDoS、Malware 和 Intrusion 事件的比较。
### 严重程度分析
- 按严重程度划分的事件明细。
- 高、中、低风险分类。
### 每月威胁趋势
- 随时间变化的网络事件分析。
- 识别攻击的波动和趋势。
### 事件响应分析
- 针对检测到的威胁采取的行动。
- Blocked(已阻止)、Ignored(已忽略)和 Logged(已记录)事件的比较。
### 网段风险评估
- 不同网段的平均异常分数。
- 识别高风险网络区域。
### 交互式筛选器
- 攻击类型
- 严重程度
- 月份
- 网段
## 工具与技术
- Python
- Pandas
- SQLite
- SQL
- Power BI
- Jupyter Notebook
## 项目工作流
### 1. 数据收集
导入并探索了网络攻击数据集。
### 2. 数据清洗
- 删除了重复项
- 处理了缺失值
- 标准化了数据格式
### 3. 特征工程
创建了额外的分析字段,包括:
- 年
- 月
- 日
- 小时
- 高风险指标
- 严重事件指标
### 4. SQL 分析
使用 SQL 查询进行了探索性分析,以识别:
- 攻击类型分布
- 严重程度分布
- 网段风险
- 事件响应模式
### 5. 仪表板开发
设计了一个包含 KPI、图表和切片器的交互式 Power BI 仪表板。
## 业务洞察
- 攻击类型分布在 DDoS、Malware 和 Intrusion 类别中。
- 中等严重程度的事件在总事件中占有很大比例。
- 某些网段表现出较高的平均异常分数。
- 事件响应行动有助于识别运营安全的有效性。
- 交互式过滤实现了对网络威胁的针对性调查。
## 未来展望
- 实时威胁监控集成。
- 威胁情报源连接。
- 使用机器学习进行预测性风险建模。
- 高级事件预测。
- SOC(安全运营中心)绩效分析。
## 作者
**Lubna Shireen R**
## 许可证
该项目基于 MIT License 授权。
---
## 目标
- 分析网络攻击趋势和模式。
- 监控攻击严重程度。
- 评估异常分数和网络风险。
- 评估事件响应的有效性。
- 构建用于网络安全情报的交互式仪表板。
## 关键绩效指标 (KPI)
- 总事件数
- 严重事件
- 平均风险评分
- 高风险事件
## 仪表板功能
### 攻击类型分析
- 网络攻击的分布情况。
- DDoS、Malware 和 Intrusion 事件的比较。
### 严重程度分析
- 按严重程度划分的事件明细。
- 高、中、低风险分类。
### 每月威胁趋势
- 随时间变化的网络事件分析。
- 识别攻击的波动和趋势。
### 事件响应分析
- 针对检测到的威胁采取的行动。
- Blocked(已阻止)、Ignored(已忽略)和 Logged(已记录)事件的比较。
### 网段风险评估
- 不同网段的平均异常分数。
- 识别高风险网络区域。
### 交互式筛选器
- 攻击类型
- 严重程度
- 月份
- 网段
## 工具与技术
- Python
- Pandas
- SQLite
- SQL
- Power BI
- Jupyter Notebook
## 项目工作流
### 1. 数据收集
导入并探索了网络攻击数据集。
### 2. 数据清洗
- 删除了重复项
- 处理了缺失值
- 标准化了数据格式
### 3. 特征工程
创建了额外的分析字段,包括:
- 年
- 月
- 日
- 小时
- 高风险指标
- 严重事件指标
### 4. SQL 分析
使用 SQL 查询进行了探索性分析,以识别:
- 攻击类型分布
- 严重程度分布
- 网段风险
- 事件响应模式
### 5. 仪表板开发
设计了一个包含 KPI、图表和切片器的交互式 Power BI 仪表板。
## 业务洞察
- 攻击类型分布在 DDoS、Malware 和 Intrusion 类别中。
- 中等严重程度的事件在总事件中占有很大比例。
- 某些网段表现出较高的平均异常分数。
- 事件响应行动有助于识别运营安全的有效性。
- 交互式过滤实现了对网络威胁的针对性调查。
## 未来展望
- 实时威胁监控集成。
- 威胁情报源连接。
- 使用机器学习进行预测性风险建模。
- 高级事件预测。
- SOC(安全运营中心)绩效分析。
## 作者
**Lubna Shireen R**
## 许可证
该项目基于 MIT License 授权。标签:Mutation, NoSQL, Power BI, Python, SQL, 代码示例, 可视化, 多线程, 安全运营, 扫描框架, 数据分析, 无后门, 系统审计, 逆向工具