Shrikishan12/wazuh-sysmon-setup-guide
GitHub: Shrikishan12/wazuh-sysmon-setup-guide
一份初学者友好的分步指南,指导在 Ubuntu 上安装 Wazuh SIEM 并在 Windows 端配置 Sysmon 以实现 SOC 级安全监控。
Stars: 2 | Forks: 0
一份面向初学者的完整指南:在 Ubuntu 上安装 Wazuh SIEM 服务器,并在 Windows agent 上配置 Sysmon,以实现 SOC 级别的安全监控。
## 目录
- [第一部分 — Wazuh 服务器设置](#part-1--wazuh-server-setup-ubuntu)
- [什么是 Wazuh?](#what-is-wazuh)
- [前置条件](#prerequisites)
- [步骤 1:检查操作系统版本](#step-1-check-your-os-version)
- [步骤 2:更新系统](#step-2-update-the-system-and-free-port-443)
- [步骤 3:设置服务器主机名](#step-3-set-the-server-hostname-optional)
- [步骤 4:检查可用内存](#step-4-check-available-ram)
- [步骤 5:配置防火墙](#step-5-configure-firewall-ports)
- [步骤 6:安装必要的软件包](#step-6-install-required-packages)
- [步骤 7:下载安装程序](#step-7-download-the-wazuh-installer-script)
- [步骤 8:运行安装](#step-8-run-the-all-in-one-wazuh-installation)
- [步骤 9:找回管理员密码](#step-9-recover-the-admin-password-if-you-missed-it)
- [步骤 10:验证服务](#step-10-verify-all-services-are-running)
- [步骤 11:访问 Dashboard](#step-11-access-the-wazuh-dashboard)
- [步骤 12:调整 JVM Heap](#step-12-tune-jvm-heap-for-low-ram-servers-if-needed)
- [步骤 13:注册 Windows Agent](#step-13-enroll-a-wazuh-agent-windows)
- [步骤 14:注册 Linux Agent](#step-14-enroll-a-wazuh-agent-linux)
- [故障排除](#troubleshooting)
- [第二部分 — 在 Windows 上设置 Sysmon](#part-2--sysmon-setup-on-windows)
- [什么是 Sysmon?](#what-is-sysmon-and-why-do-you-need-it)
- [步骤 1:下载 Sysmon](#step-1-download-sysmon)
- [步骤 2:下载配置文件](#step-2-download-a-sysmon-configuration-file)
- [步骤 3:整理文件](#step-3-organize-the-files)
- [步骤 4:安装 Sysmon](#step-4-install-sysmon)
- [步骤 5:验证 Sysmon](#step-5-verify-sysmon-is-running)
- [步骤 6:验证日志](#step-6-verify-sysmon-logs-are-being-generated)
- [步骤 7:生成测试事件](#step-7-generate-a-test-event)
- [步骤 8:确认 Wazuh Agent](#step-8-confirm-the-wazuh-agent-is-installed)
- [步骤 9:配置 Agent 以读取 Sysmon](#step-9-configure-the-wazuh-agent-to-read-sysmon-logs)
- [步骤 10:重启 Wazuh Agent](#step-10-restart-the-wazuh-agent)
- [步骤 11:在 Dashboard 中验证](#step-11-verify-sysmon-events-are-arriving-in-the-dashboard)
## 第一部分 — Wazuh 服务器设置 (Ubuntu)
### 什么是 Wazuh?
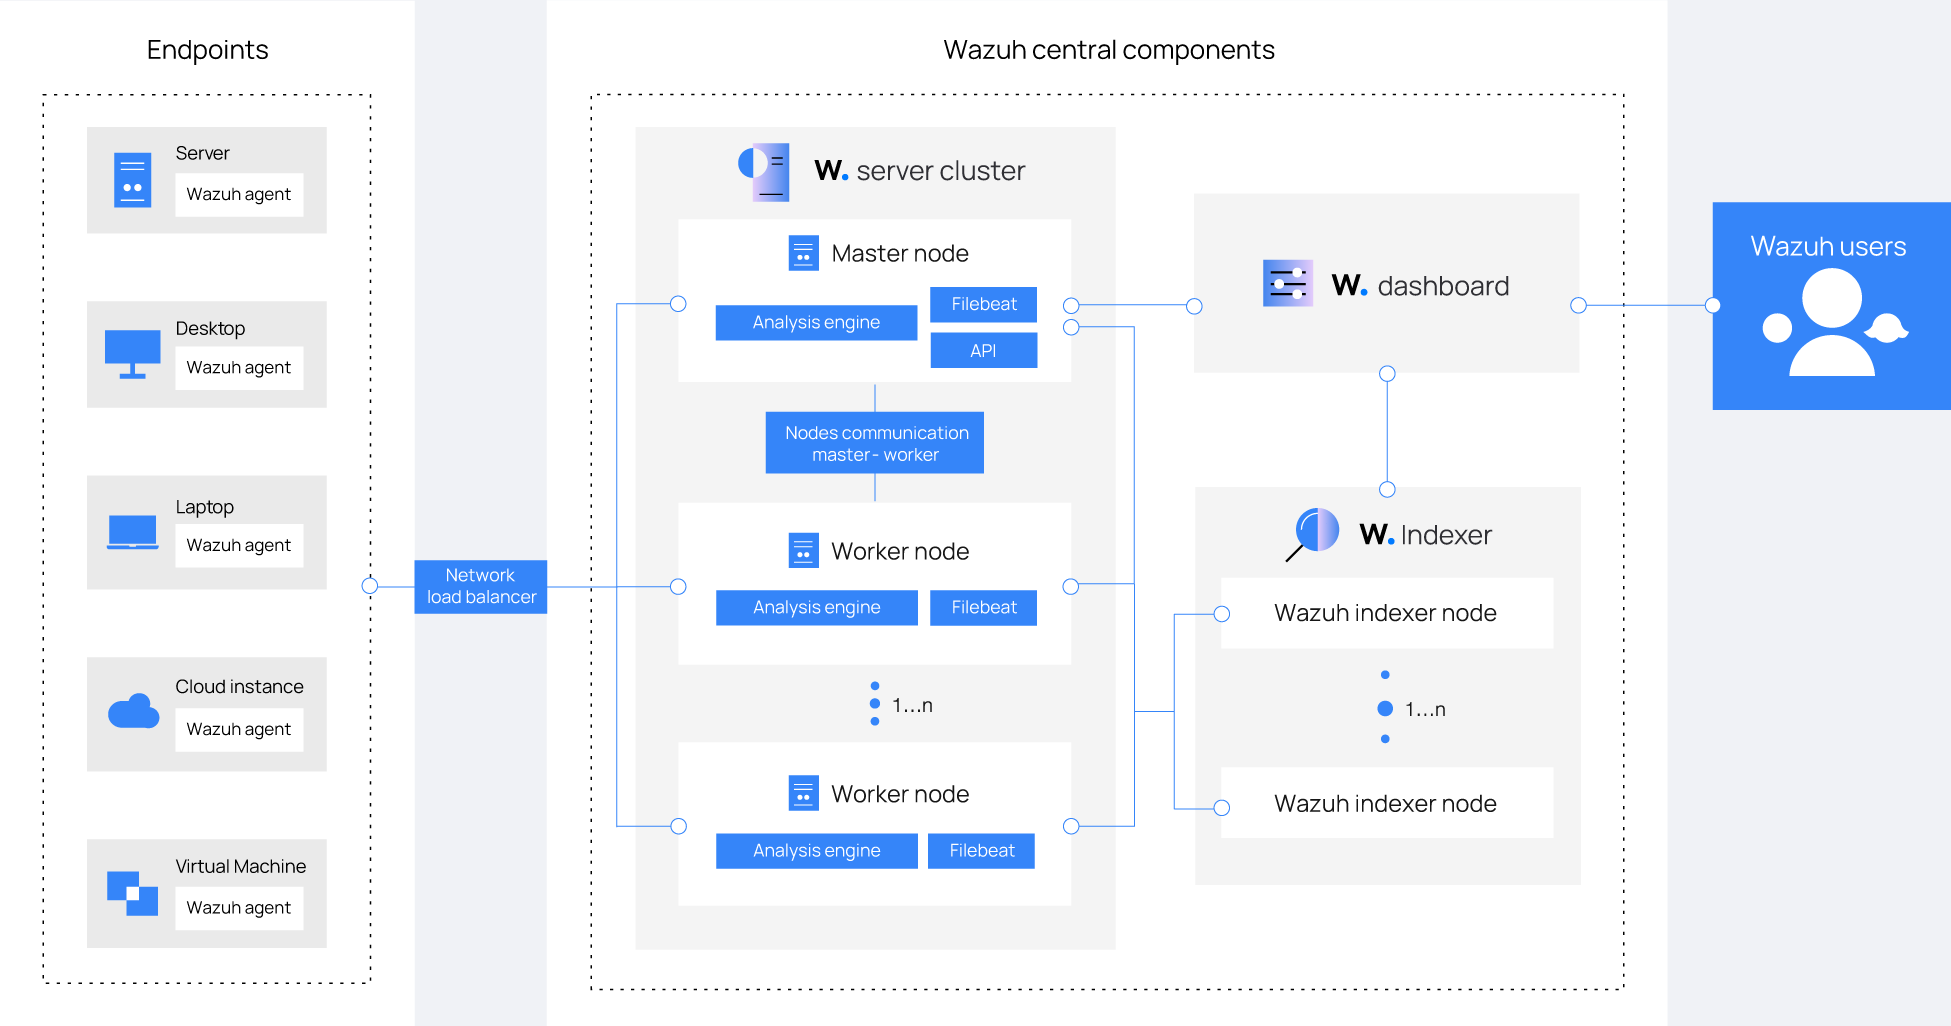
Wazuh 是一个免费的开源安全平台,它结合了:
- **Endpoint 保护** — 监控 Windows、Linux 和 macOS 机器
- **SIEM** — 安全信息和事件管理
- **日志分析** — 收集并解析来自所有 agent 的日志
- **文件完整性监控** — 检测未经授权的文件更改
- **漏洞检测** — 标记已注册机器上已知的 CVE
在本指南结束时,您将拥有:
| 组件 | 端口 | 用途 |
|---|---|---|
| Wazuh Manager | 1514 | 监听 agent 事件 |
| Wazuh Indexer (OpenSearch) | 9200 | 存储所有警报 |
| Filebeat | — | 将警报转发给 indexer |
| Wazuh Dashboard | 443 | Web UI (HTTPS) |
### 前置条件
**硬件要求(官方):**
| 组件 | 最低 RAM | 最低 CPU | 推荐 RAM | 推荐 CPU |
|---|---|---|---|---|
| Wazuh 服务器 (all-in-one) | 2 GB | 2 核心 | 4 GB | 8 核心 |
**每个 agent 的磁盘空间(保留 90 天警报):**
- 服务器:每个 agent 约 0.1 GB
- 工作站:每个 agent 约 0.04 GB
- 网络设备:每个 agent 约 0.2 GB
**官方支持的操作系统:**
| 操作系统 | 支持版本 |
|---|---|
| Ubuntu | 16.04, 18.04, 20.04, 22.04, 24.04 |
| Red Hat Enterprise Linux (RHEL) | 7, 8, 9, 10 |
| CentOS Stream | 10 |
| Amazon Linux | Amazon Linux 2, Amazon Linux 2023 |
**所需端口 — 必须空闲且可访问:**
| 端口 | 协议 | 用途 |
|---|---|---|
| 443 | TCP | Wazuh Dashboard (HTTPS) |
| 1514 | TCP/UDP | Agent 事件通信 |
| 1515 | TCP | Agent 自动注册 |
| 9200 | TCP | Wazuh Indexer REST API (仅限 localhost) |
| 55000 | TCP | Wazuh Manager REST API |
### 步骤 1:检查您的操作系统版本
确认您的服务器正在运行受支持的操作系统版本。
```
lsb_release -a
```
预期输出(Ubuntu 22.04 示例):
```
No LSB modules are available.
Distributor ID: Ubuntu
Description: Ubuntu 22.04.4 LTS
Release: 22.04
Codename: jammy
```
### 步骤 2:更新系统并释放 443 端口
更新您的系统以获取最新的安全补丁,并确保正确解析软件包依赖项。
```
sudo apt update && sudo apt upgrade -y
```
检查 443 端口是否已被使用:
```
sudo ss -tlnp | grep ':443'
```
如果在输出中看到 `apache2`、`nginx` 或 `caddy`,请停止它们:
```
sudo systemctl stop apache2 nginx 2>/dev/null
sudo systemctl disable apache2 nginx 2>/dev/null
```
### 步骤 3:设置服务器主机名(可选)
设置适当的主机名可以让你在日志和仪表板中更容易地识别你的服务器。
```
sudo hostnamectl set-hostname wazuh-server
```
验证:
```
hostname
```
预期输出:
```
wazuh-server
```
### 步骤 4:检查可用 RAM
```
free -h
```
预期输出示例:
```
total used free
Mem: 7.8Gi 1.2Gi 6.6Gi
```
| 可用 RAM | 状态 | 备注 |
|---|---|---|
| 少于 2 GB | 不受支持 | Indexer 将无法启动 |
| 2–4 GB | 最低要求 | 安装后调整 JVM heap(步骤 12) |
| 4 GB 或更多 | 推荐 | 适用于生产环境 |
### 步骤 5:配置防火墙端口
#### 针对练习 / 实验环境
最简单的方法是完全禁用 UFW:
```
sudo ufw disable
```
验证它是否已关闭:
```
sudo ufw status
```
预期输出:
```
Status: inactive
```
现在所有端口均已开放,Wazuh 无需任何防火墙配置即可运行。
#### 针对 AWS EC2(练习设置)
将您的 Security Group 入站规则设置为 **所有流量 → 源:任何位置 (0.0.0.0/0)**。
```
AWS Console → EC2 → Security Groups → Your Instance's Security Group
→ Inbound Rules → Edit → Add Rule
→ Type: All traffic
→ Source: Anywhere IPv4 (0.0.0.0/0)
→ Save
```
### 步骤 6:安装必需的软件包
```
sudo apt install -y curl unzip wget
```
### 步骤 7:下载 Wazuh 安装脚本
Wazuh 提供了一个官方的 `wazuh-install.sh` 脚本,它可以自动完成所有操作:APT 仓库设置、软件包安装、TLS 证书生成、服务启动以及安全索引引导。
```
cd /root
curl -sO https://packages.wazuh.com/4.14/wazuh-install.sh
```
验证文件是否已下载:
```
ls -lh wazuh-install.sh
```
预期输出:
```
-rw-r--r-- 1 root root 195K Apr 18 22:45 wazuh-install.sh
```
### 步骤 8:运行 All-in-One Wazuh 安装
`-a` 标志将在此单个主机上安装所有四个组件:Wazuh Manager、Wazuh Indexer、Filebeat 和 Wazuh Dashboard。
```
sudo bash wazuh-install.sh -a 2>&1 | tee /tmp/wazuh-install.log
```
安装需要 **10–15 分钟**。请勿中断或关闭终端。
成功完成后,您将看到:
```
INFO: --- Summary ---
INFO: You can access the web interface https://
User: admin
Password:
INFO: Installation finished.
```
### 步骤 9:找回管理员密码(如果您错过了)
**选项 1 — 单条命令(最快):**
```
sudo tar -O -xvf wazuh-install-files.tar wazuh-install-files/wazuh-passwords.txt
```
**选项 2 — 先解压到文件夹,然后阅读:**
```
sudo tar -xf /root/wazuh-install-files.tar -C /tmp/
sudo head -10 /tmp/wazuh-install-files/wazuh-passwords.txt
```
查找 `admin` 条目:
```
# Web 界面和 Wazuh indexer 的管理员用户
indexer_username: 'admin'
indexer_password: 'YourGeneratedPasswordHere'
```
### 步骤 10:验证所有服务是否正在运行
```
sudo systemctl is-active wazuh-manager wazuh-indexer wazuh-dashboard filebeat
```
预期输出 — 这四个服务都应显示为 `active`:
```
active
active
active
active
```
验证端口是否正在监听:
```
sudo ss -tlnp | grep -E ':443|:1514|:55000|:9200'
```
### 步骤 11:访问 Wazuh Dashboard
打开浏览器并转到:
```
https://:443
```
登录信息:
- **用户名:** `admin`
- **密码:** 步骤 8 或 9 中生成的密码
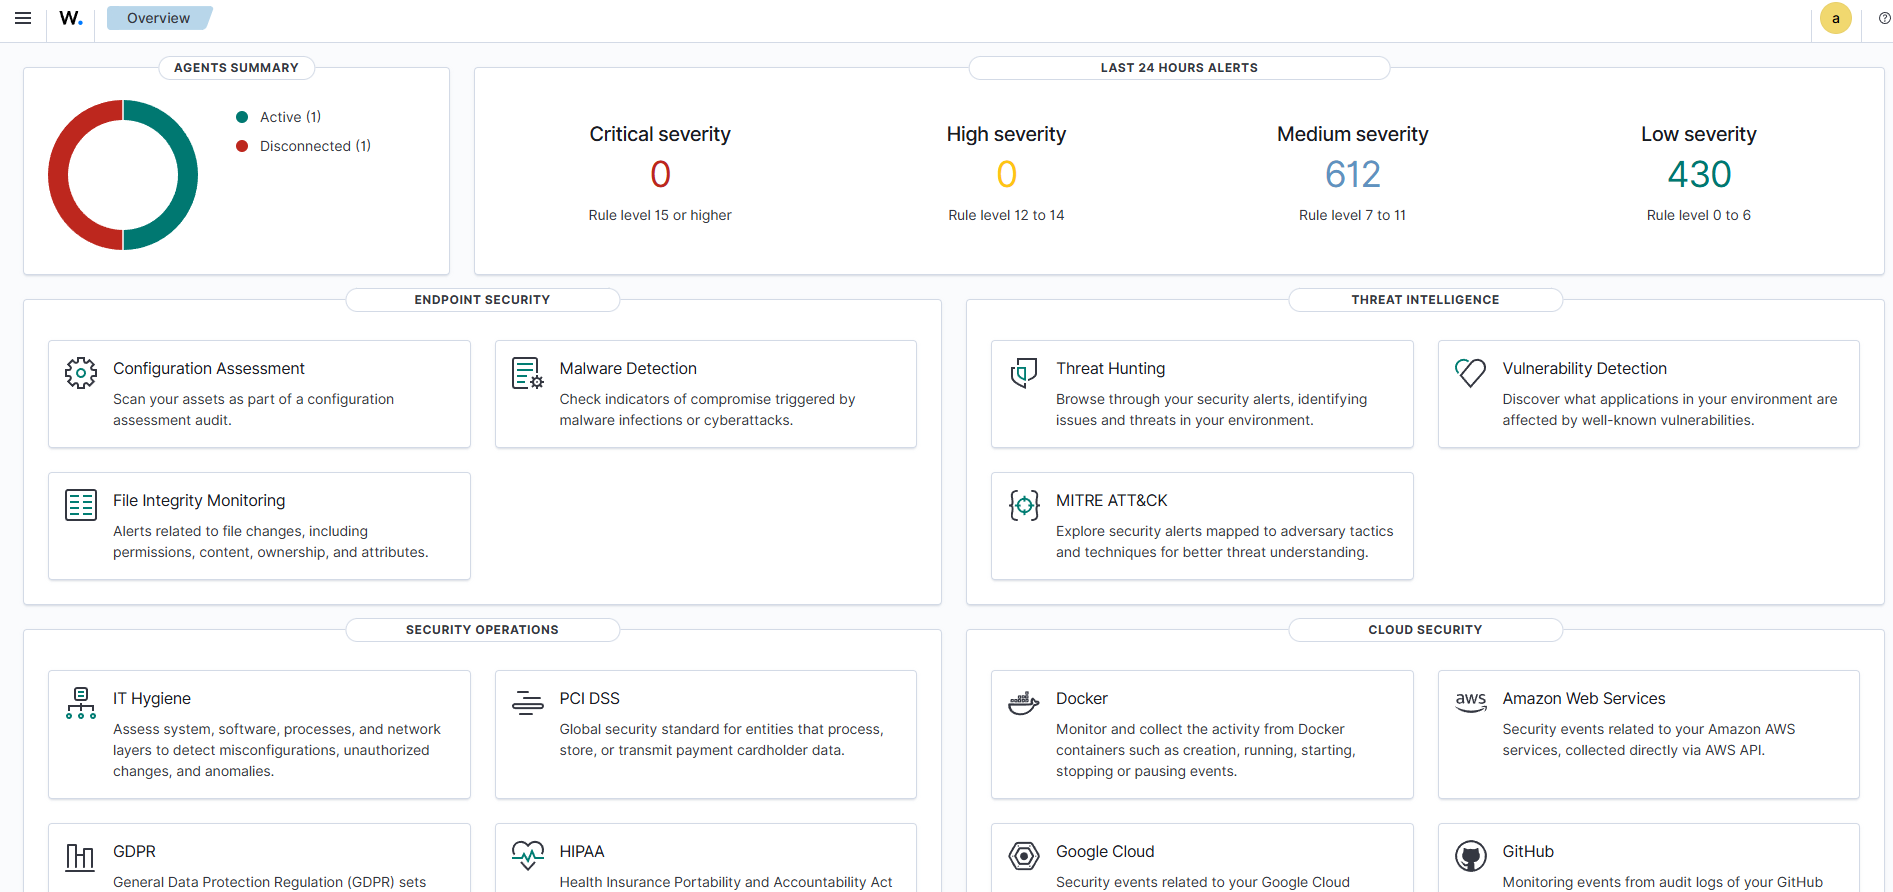
登录后,您将进入 Wazuh 概览仪表板。在注册第一个 agent 之前,它将显示空面板。
**首次登录后更改管理员密码(如果需要):**
转到:`Security → Internal Users → admin → Edit → Set new password`
或通过 CLI:
```
sudo /usr/share/wazuh-indexer/plugins/opensearch-security/tools/wazuh-passwords-tool.sh \
-u admin -p 'YourNewStrongPassword@2026'
```
### 步骤 12:为低内存服务器调整 JVM Heap(如果需要)
安装程序默认将 indexer 的 JVM heap 设置为 4 GB。在内存刚好为 4 GB 的服务器上,这几乎不会给操作系统留下任何内存。
```
sudo nano /etc/wazuh-indexer/jvm.options
```
找到 `-Xms` 和 `-Xmx` 行,并将它们设置为总内存的一半:
| 服务器 RAM | 推荐的 Heap 设置 |
|---|---|
| 4 GB | `-Xms1g` 和 `-Xmx1g` |
| 8 GB | `-Xms4g` 和 `-Xmx4g`(默认) |
| 16 GB+ | `-Xms8g` 和 `-Xmx8g` |
编辑后重启 indexer:
```
sudo systemctl restart wazuh-indexer
sudo systemctl status wazuh-indexer --no-pager | head -6
```
### 步骤 13:注册 Wazuh Agent (Windows)
在 **Wazuh Dashboard** 上,转到 **Agent Summary → Deploy New Agent**。
选择:
- 操作系统:**Windows**
- 服务器地址:您的 Wazuh 服务器 IP(例如 `192.168.1.50`)
- Agent 名称:可选(例如 `Windows-PC1`)
复制生成的 PowerShell 命令,并在 Windows 计算机上以 **管理员** 身份运行。
模板命令(替换 IP):
```
Invoke-WebRequest -Uri https://packages.wazuh.com/4.x/windows/wazuh-agent-4.14.0-1.msi -OutFile $env:TEMP\wazuh-agent.msi
msiexec.exe /i $env:TEMP\wazuh-agent.msi /q WAZUH_MANAGER='' WAZUH_AGENT_NAME='Windows-PC1'
NET START WazuhSvc
```
该 agent 应在 1–2 分钟内在仪表板中显示为绿色的 **Active** 状态。
### 步骤 14:注册 Wazuh Agent (Linux)
在 **Wazuh Dashboard** 上,转到 **Agent Summary → Deploy New Agent**。
选择:
- 操作系统:针对 Ubuntu/Debian 选择 **Linux (DEB)**,或针对 RHEL/CentOS 选择 **Linux (RPM)**
- 服务器地址:您的 Wazuh 服务器 IP
- Agent 名称:可选(例如 `Ubuntu-PC1`)
复制生成的命令,并在 Linux 计算机上以 **root 或 sudo** 权限运行。
生成命令示例(Ubuntu/Debian):
```
curl -s https://packages.wazuh.com/key/GPG-KEY-WAZUH | gpg --no-default-keyring --keyring gnupg-ring:/usr/share/keyrings/wazuh.gpg --import
chmod 644 /usr/share/keyrings/wazuh.gpg
echo "deb [signed-by=/usr/share/keyrings/wazuh.gpg] https://packages.wazuh.com/4.x/apt/ stable main" | tee /etc/apt/sources.list.d/wazuh.list
apt-get update
WAZUH_MANAGER="" apt-get install wazuh-agent
systemctl daemon-reload
systemctl enable wazuh-agent
systemctl start wazuh-agent
```
确认 agent 正在运行:
```
sudo systemctl status wazuh-agent --no-pager | head -6
```
预期输出:
```
● wazuh-agent.service - Wazuh agent
Loaded: loaded
Active: active (running)
```
### 故障排除
| 问题 | 原因 | 解决方案 |
|---|---|---|
| 安装后 Dashboard 无法加载 | 443 端口被 Apache/Nginx 阻止 | `sudo systemctl stop apache2 nginx`,然后运行 `sudo systemctl restart wazuh-dashboard` |
| 安装程序失败并提示 "no space left on device" | 导入漏洞数据库期间磁盘已满 | 确保至少有 50 GB 的可用磁盘空间,然后重新安装 |
| Dashboard 显示 "server is not ready" (503) | Indexer 仍在启动中 | 等待 60 秒;验证:`systemctl status wazuh-indexer` |
| Wazuh indexer 无法启动 | RAM 过低 — JVM heap 太大 | 在 `/etc/wazuh-indexer/jvm.options` 中调整 JVM heap(步骤 12) |
| Agent 显示为已断开连接 | 1514/1515 端口被阻止 | 在服务器防火墙和云安全组中开放端口 |
| 重启后服务未激活 | 服务未设置为自动启动 | `sudo systemctl enable wazuh-manager wazuh-indexer wazuh-dashboard filebeat` |
**卸载 Wazuh(如果需要):**
```
sudo bash wazuh-install.sh -u
sudo rm -rf /var/ossec /var/lib/wazuh-indexer /etc/wazuh-indexer \
/var/log/wazuh-indexer /var/lib/wazuh-dashboard /etc/wazuh-dashboard \
/etc/filebeat /var/lib/filebeat /root/wazuh-install-files.tar
```
## 第二部分 — 在 Windows 上设置 Sysmon
### 什么是 Sysmon,为什么你需要它?
**Sysmon (System Monitor)** 是来自 **Microsoft Sysinternals** 的轻量级 Windows 系统服务。它将详细的系统活动记录到 Windows 事件日志中 — 远超 Windows 默认记录的范围。
**默认 Windows 日志记录的问题:**
默认日志会告诉你发生了什么,但并不是全貌。你可能看到启动了一个进程,但看不到它建立了什么网络连接,或者是哪个父进程启动了它。
**Sysmon 添加的内容:**
| 事件类型 | 它捕获的内容 | 为什么重要 |
|---|---|---|
| 进程创建 (Event ID 1) | 启动的每个进程及其完整的命令和父进程信息 | 检测恶意软件执行 |
| 网络连接 (Event ID 3) | 带有进程名称的出站/入站连接 | 检测 C2 流量 |
| 文件创建 (Event ID 11) | 写入磁盘的新文件 | 检测勒索软件 |
| 注册表更改 (Event ID 12/13) | 注册表键修改 | 检测持久化 |
| 镜像加载 (Event ID 7) | 加载到进程中的 DLL 和驱动程序 | 检测恶意 DLL 注入 |
### 要求
| 要求 | 详情 |
|---|---|
| 操作系统 | Windows 8.1 / Windows Server 2012 R2 或更高版本 |
| 架构 | 64 位(使用 `Sysmon64.exe`)或 32 位(使用 `Sysmon.exe`) |
| 权限 | 本地管理员或 Domain Admin |
| Wazuh Agent | 必须已经安装(见第一部分,步骤 13) |
### 步骤 1:下载 Sysmon
从 Microsoft Sysinternals 下载:
[https://learn.microsoft.com/en-us/sysinternals/downloads/sysmon](https://learn.microsoft.com/en-us/sysinternals/downloads/sysmon)
解压 ZIP 文件:
| 文件 | 用途 |
|---|---|
| `Sysmon64.exe` | 64 位 Windows(大多数现代系统) |
| `Sysmon.exe` | 仅限 32 位 Windows |
| `Sysmon64a.exe` | 仅限 ARM64 系统 |
### 步骤 2:下载 Sysmon 配置文件
没有配置文件的 Sysmon 捕获的内容非常少。请使用来自 SwiftOnSecurity 且备受信任的社区配置:
[https://github.com/SwiftOnSecurity/sysmon-config](https://github.com/SwiftOnSecurity/sysmon-config)
下载:`sysmonconfig-export.xml`
### 步骤 3:整理文件
```
C:\Sysmon\
├── Sysmon64.exe
└── sysmonconfig-export.xml
```
### 步骤 4:安装 Sysmon
以管理员身份打开 **命令提示符**(右键单击 → 以管理员身份运行)。
```
cd C:\Sysmon
Sysmon64.exe -accepteula -i sysmonconfig-export.xml
```
预期输出:
```
System Monitor v15.x - System activity monitor
...
Sysmon installed.
SysmonDrv installed.
SysmonDrv started.
Sysmon started.
```
### 步骤 5:验证 Sysmon 是否正在运行
```
sc query Sysmon64
```
预期输出:
```
SERVICE_NAME: Sysmon64
TYPE : 1 KERNEL_DRIVER
STATE : 4 RUNNING
```
### 步骤 6:验证是否正在生成 Sysmon 日志
打开 **事件查看器** (`eventvwr.msc`) 并导航到:
```
Applications and Services Logs
└── Microsoft
└── Windows
└── Sysmon
└── Operational
```
您应该会立即看到有事件正在填充。
查找:
- **Event ID 1** — 进程创建(启动的每个程序)
- **Event ID 3** — 网络连接(每个出站连接)
### 步骤 7:生成测试事件
```
notepad.exe
```
返回事件查看器 → Sysmon → Operational。查找一个新的 **Event ID 1**,显示:
```
Image: C:\Windows\System32\notepad.exe
CommandLine: notepad.exe
ParentImage: C:\Windows\System32\cmd.exe
```
这确认了 Sysmon 正在捕获带有完整父/子详细信息的进程启动情况。
### 步骤 8:确认已安装 Wazuh Agent
```
sc query WazuhSvc
```
预期输出:
```
STATE : 4 RUNNING
```
如果尚未安装,请返回第一部分,步骤 13。
### 步骤 9:配置 Wazuh Agent 以读取 Sysmon 日志
以管理员身份在 **记事本** 中打开 Wazuh agent 配置文件:
```
C:\Program Files (x86)\ossec-agent\ossec.conf
```
在 `` 之前添加此块:
```
Microsoft-Windows-Sysmon/Operational
eventchannel
```
保存并关闭文件。
### 步骤 10:重启 Wazuh Agent
```
NET STOP WazuhSvc
NET START WazuhSvc
```
或通过 `services.msc`:找到 **Wazuh** → 右键单击 → **重新启动**。
### 步骤 11:验证 Sysmon 事件是否已到达 Dashboard
转到您的 Wazuh Dashboard:
```
https://:443
```
导航到:**Agents → [您的 Windows Agent] → Threat Hunting**
| 检查项 | 预期结果 |
|---|---|
| Windows agent 状态 | Active(绿色) |
| Threat Hunting 中的 Sysmon 警报 | 可以看到带有 Sysmon 规则组的事件 |
| Event ID 1(进程创建)可见 | 显示进程名称、用户、父进程 |
## 下一步做什么
- 在您的域中所有的 Windows 和 Linux 机器上添加更多 agent
- 在 `/var/ossec/etc/rules/local_rules.xml` 下配置自定义警报规则
- 探索仪表板模块:Threat Hunting、Vulnerability Detection、MITRE ATT&CK、文件完整性监控
- 通过 GPO 在所有域计算机上部署 Sysmon 以进行自动监控
- 查阅官方文档:[documentation.wazuh.com](https://documentation.wazuh.com)
## 参考
- [Wazuh 官方文档](https://documentation.wazuh.com/current/installation-guide/wazuh-server/index.html)
- [Wazuh 快速入门指南](https://documentation.wazuh.com/current/quickstart.html)
- [Microsoft Sysmon 下载](https://learn.microsoft.com/en-us/sysinternals/downloads/sysmon)
- [SwiftOnSecurity Sysmon 配置](https://github.com/SwiftOnSecurity/sysmon-config)
- [Wazuh GitHub 仓库](https://github.com/wazuh/wazuh)
## 许可证
本项目采用 [MIT 许可证](LICENSE) 授权。
© 2026 Shrikishan — 免费(可自由)使用、分享和改编,但需注明出处。
生产环境 UFW 配置(点击展开)
sudo ufw allow 22/tcp

sudo ufw allow 443/tcp

sudo ufw allow 1514/tcp

sudo ufw allow 1514/udp

sudo ufw allow 1515/tcp

sudo ufw allow 55000/tcp

sudo ufw reload
标签:PB级数据处理, Sysmon, Wazuh, 安全运维, 安装指南