Yashwanth-raj555/AI-Powered-Indian-Cybercrime-Threat-Intelligence-Analytics-Platform
GitHub: Yashwanth-raj555/AI-Powered-Indian-Cybercrime-Threat-Intelligence-Analytics-Platform
一个基于 Python、SQL Server 和 Power BI 构建的数据分析项目,通过对 1,200 起印度网络犯罪案件进行清洗、分析和可视化,揭示攻击趋势、财务损失与高风险区域。
Stars: 1 | Forks: 0
# AI 驱动的印度网络犯罪与威胁情报分析平台
## 网络安全分析
这是一个使用 Python、SQL Server、Power BI 和 Streamlit AI Assistant 构建的端到端网络犯罪与威胁情报分析项目,旨在分析印度的网络犯罪事件、财务损失、高风险攻击类型、城市级风险以及特定行业的漏洞。
# 仪表板预览
# 项目概述
AI 驱动的印度网络犯罪与威胁情报分析平台将原始网络犯罪事件数据转化为有意义的威胁情报。
该项目分析了印度各地的 1,200 起网络犯罪案件,并帮助识别:
* 网络犯罪趋势
* 财务损失模式
* 高风险攻击类型
* 城市级网络犯罪影响
* 特定行业威胁暴露情况
* 高价值网络攻击
* AI 驱动的网络安全洞察
该项目遵循完整的数据分析工作流,从原始数据清理到 SQL 分析、Power BI 仪表板展示以及 AI 助手集成。
# 业务问题
如何有效地分析印度的网络犯罪数据,以了解网络攻击模式、财务损失、高风险威胁和行业级漏洞?
该项目有助于回答:
* 哪种网络攻击类型造成的财务损失最高?
* 哪些城市受网络犯罪影响最大?
* 哪些行业面临的网络威胁最高?
* 哪些年份的网络犯罪损失最高?
* 哪些攻击被归类为高风险?
* 用户如何就网络犯罪数据集提出基于 AI 的问题?
# 数据集信息
| 属性 | 详细信息 |
| -------------- | ------------------------------------------ |
| 数据集类型 | 网络安全 / 网络犯罪数据集 |
| 数据集性质 | 结构化表格数据集 |
| 数据集层级 | 网络犯罪事件级别 |
| 总记录数 | 1,200 起网络犯罪案件 |
| 主要目标 | 网络犯罪趋势、风险和财务损失分析 |
# 数据字典
| 列名 | 描述 |
| -------------------- | --------------------------------------------------- |
| year | 网络犯罪案件发生的年份 |
| day | 日期(月份中的第几天) |
| amount_lost_inr | 财务损失金额(以印度卢比计) |
| incident_type | 网络攻击类型,如勒索软件或网络钓鱼 |
| city | 记录案件的印度城市 |
| category | 受影响的行业/类别 |
| amount_lost_category | 低、中或高财务损失组 |
| is_high_value_attack | 用于标识高风险/高价值攻击的二进制指标 |
| day_range | 月初、月中或月末划分 |
| case_date | 用于分析的生成日期字段 |
# 使用的技术和工具
| 工具 | 用途 |
| ---------------- | ------------------------- |
| Python | 数据清洗与探索性数据分析 (EDA) |
| Pandas | 数据预处理 |
| NumPy | 数值操作 |
| SQL Server | 威胁情报分析 |
| Power BI | 仪表板可视化 |
| Streamlit | AI 助手界面 |
| Jupyter Notebook | 数据清洗工作流 |
# 项目工作流
```
Raw Cybercrime CSV Dataset
↓
Python Data Cleaning & Feature Engineering
↓
SQL Server Threat Intelligence Analysis
↓
Power BI Cybercrime Analytics Dashboard
↓
Streamlit AI Assistant
↓
Cybercrime Intelligence Platform
```
# Python 数据清洗 Pipeline
使用 Python 和 Pandas 对网络犯罪数据集进行了清洗和准备。
### 清洗步骤
* 导入网络犯罪 CSV 数据集
* 检查数据集的形状、列和数据类型
* 规范化列名
* 删除重复记录
* 清理文本列
* 修复拼写和类别问题
* 转换数据类型
* 处理缺失值
* 使用 IQR 方法控制异常值
* 创建新的分析特征
* 导出最终清洗后的数据集
### 特征工程
创建的新字段:
* `amount_lost_category`
* `is_high_value_attack`
* `day_range`
* `case_date`
最终清洗后的数据集:
* 1,200 行
* 10 列
* 零缺失值
* 零重复记录
# SQL Server 威胁情报分析
使用 SQL Server 从清洗后的数据集中生成结构化的网络犯罪情报。
### SQL 分析领域
* 网络犯罪案件总数
* 财务损失执行摘要
* 年度网络犯罪趋势
* 攻击类型风险分析
* 城市级网络犯罪风险
* 特定行业网络威胁分析
* 高风险网络攻击检测
* 月度网络犯罪模式
* 财务损失最高的案件
* 财务损失的同比增长
### 关键 SQL 洞察
* 案件总数:1,200
* 总财务损失:₹27.78 Cr
* 高风险案件:300
* 最高单次损失:₹4,99,946
* 损失最高的攻击类型:Ransomware
* 最高风险城市:Delhi
* 高影响行业:社交媒体、企业、金融
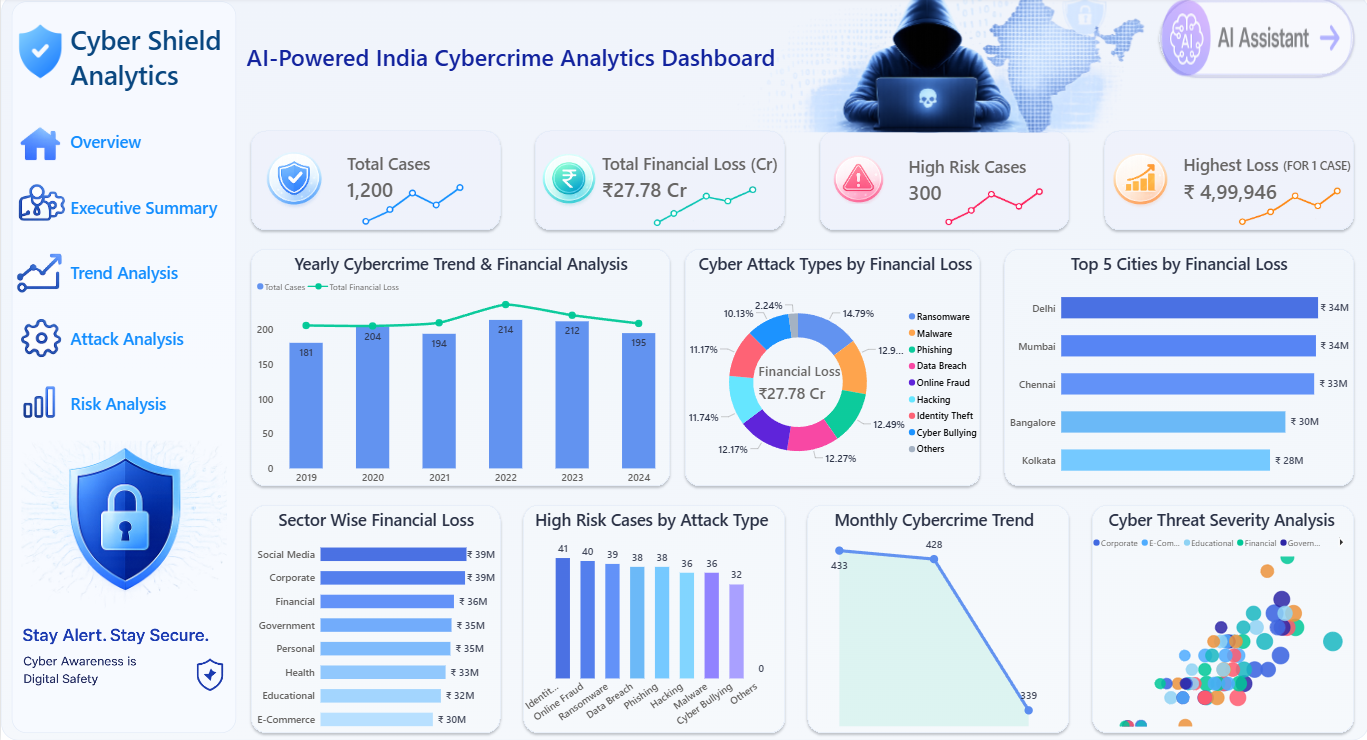
# Power BI 仪表板功能
Power BI 仪表板采用了网络情报主题进行设计。
### 仪表板 KPI
* 案件总数
* 总财务损失
* 高风险案件
* 最高单次损失
### 仪表板可视化
* 年度网络犯罪趋势与财务分析
* 按财务损失划分的网络攻击类型
* 按财务损失排名的前 5 个城市
* 按行业划分的财务损失
* 按攻击类型划分的高风险案件
* 月度网络犯罪趋势
* 网络威胁严重性分析
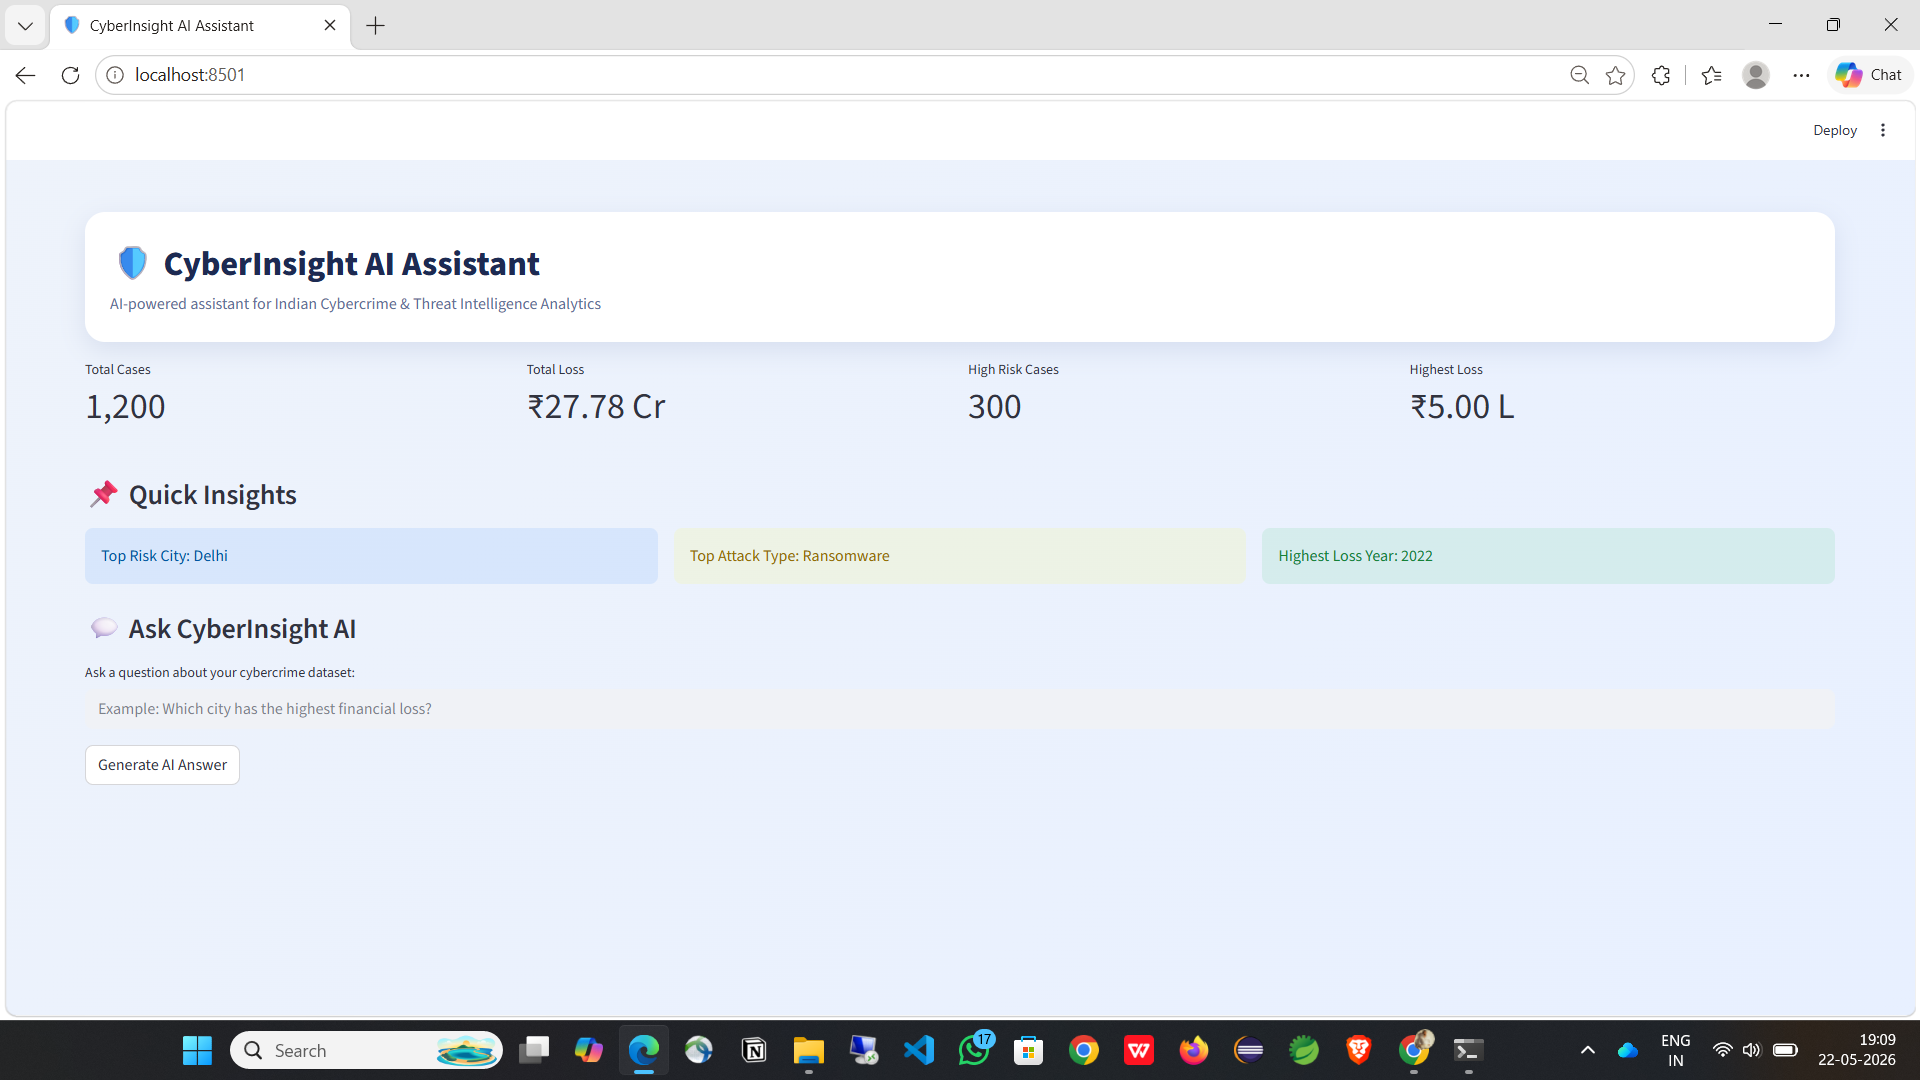
# AI 助手说明
该项目包含一个 AI 驱动的助手,名为 **CyberInsight AI Assistant**。
该 AI 助手使用 Streamlit 构建,作为网络犯罪分析项目的交互式问答层。
## AI 助手功能
* 使用自然语言输入理解与网络犯罪相关的问题
* 从网络犯罪分析数据中提供智能洞察
* 识别高风险攻击模式和网络威胁趋势
* 通过 AI 支持交互式网络安全情报分析
* 显示快速洞察,如最高风险城市、最高攻击类型和损失最高的年份
* 允许用户提出与网络犯罪相关的问题
* 帮助用户理解数据集,而无需手动阅读每个图表
* 可以使用 Gemini、Groq、OpenRouter 或基于本地 Pandas 的响应进行扩展
## AI 助手
# 关键发现
* Ransomware 造成了最高的财务损失
* Delhi、Mumbai 和 Chennai 是风险最高的城市之一
* 社交媒体和企业行业显示出重大的财务影响
* 2022 年的财务损失最高
* 月初和月中时期显示出较高的网络犯罪活动
* AI 助手通过添加交互式洞察层提升了该项目
# 仓库结构
```
AI-Powered-Indian-Cybercrime-Analytics/
│
├── dataset/
│ └── cybersecurity_cases_india_combined.csv
│
├── notebook/
│ └── cybercrime_data_cleaning_pipeline.ipynb
│
├── sql_queries/
│ └── cybercrime_analytics_Insights.sql
│
├── powerbi_dashboard/
│ └── AI Cybercrime Threat Intelligence Dashboard.pbix
│
├── report/
│ └── Report_AI_Cybercrime_Project_Report.pdf
│
├── presentation/
│ └── AI-Powered-Indian-Cybercrime-and-Threat-Intelligence-Analytics-Platform.pdf
│
├── screenshots/
│ ├── Ai_powered_india_cybercrime_analytics_dashboard.png
│ └── cyberinsight_ai_assistant.png
│
├── README.md
├── LICENSE
└── .gitignore
```
# 未来展望
* 实时网络犯罪数据源
* 基于 Machine Learning 的攻击预测
* 针对高损失案件的异常检测
* 威胁情报 API 集成
* 自然语言 SQL 生成
* Streamlit AI Assistant 的在线部署
* Power BI Web 集成
# 免责声明
该项目仅出于教育和作品集目的创建。本项目使用的数据集仅用于分析、学习和网络安全意识演示。
# 作者
## Miryala Yashwanth
* Python
* SQL Server
* Power BI
* Streamlit
* 数据分析
* 网络安全分析
标签:Kubernetes, NoSQL, Power BI, Python, SQL Server, Streamlit, 代码示例, 商业智能, 威胁情报, 开发者工具, 数据分析, 无后门, 访问控制, 逆向工具