emrecaglaryildiz/3cY-S3c-Center
GitHub: emrecaglaryildiz/3cY-S3c-Center
一个基于浏览器的全球网络威胁情报OSINT仪表盘,整合Shodan、IPWhoIs、VirusTotal等公开API,提供实时威胁地图可视化和CVE监控。
Stars: 0 | Forks: 0
# 3cY-S3c-Center
3cY-S3c-Center OSINT 仪表盘
# 3cY-S3C | 全球网络威胁情报仪表盘
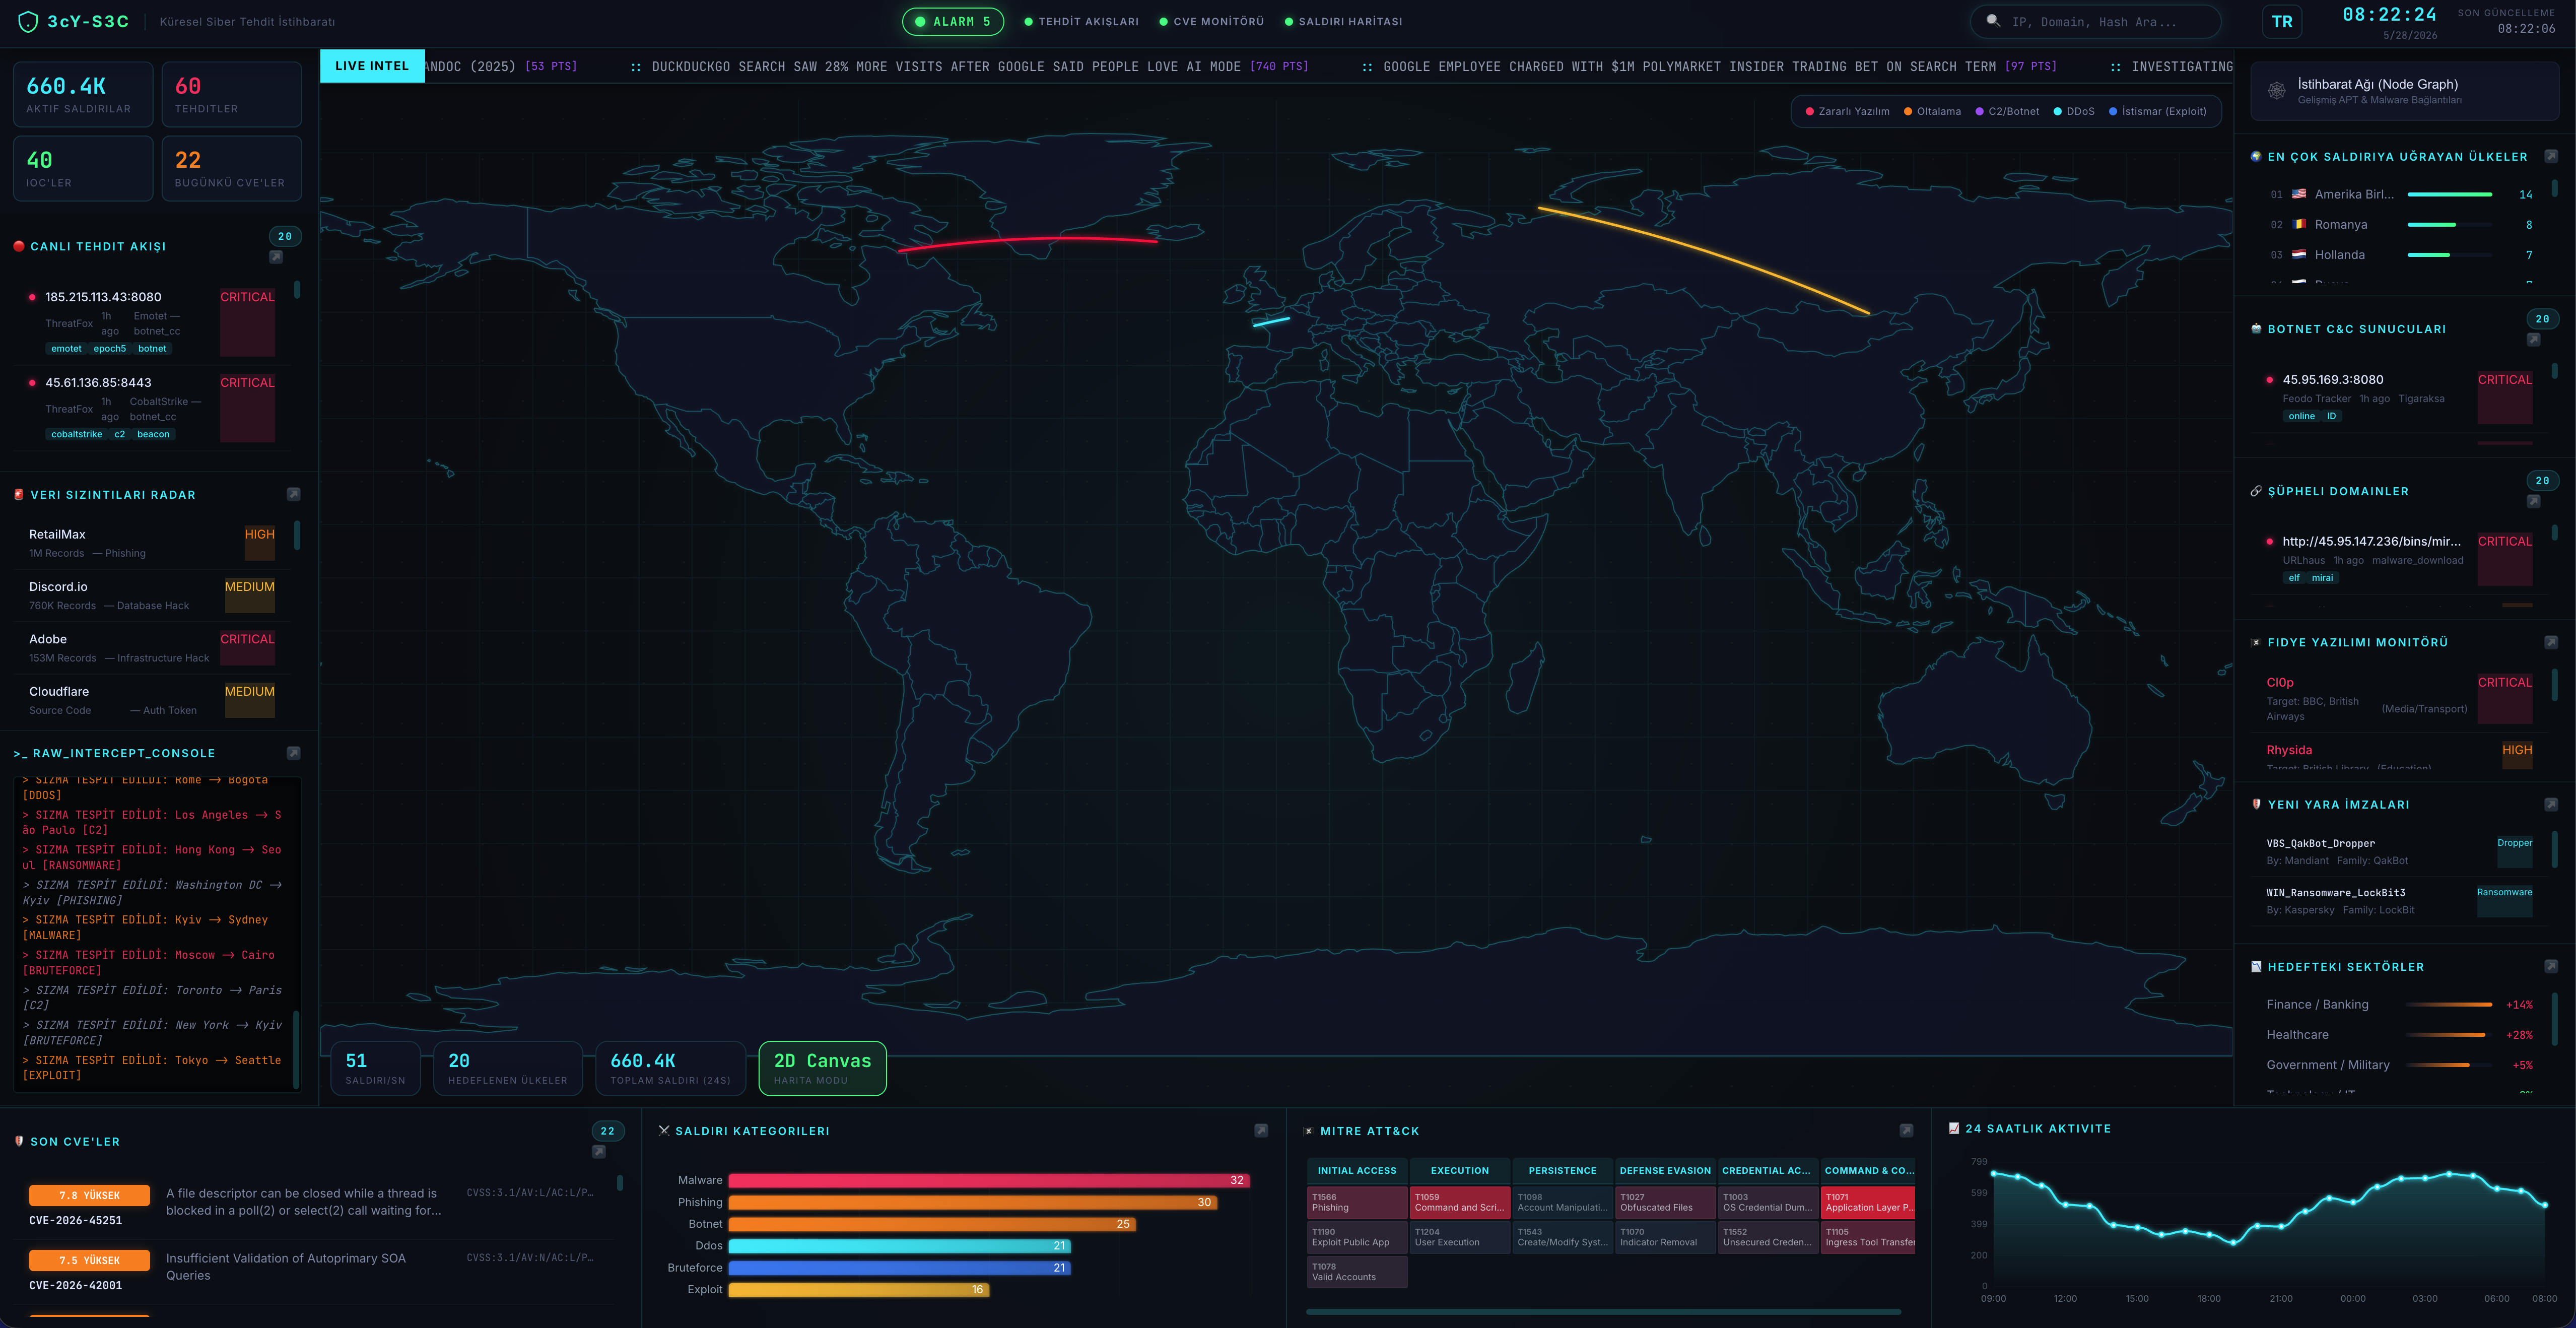
**3cY-S3C** 是一个高交互性、基于浏览器的网络安全运营中心 (SOC) 仪表盘。它将全球网络威胁可视化,监控实时的 CVE 订阅源,执行实时的 OSINT(开源情报)查询,并以其暗黑赛博朋克风格的 UI 提供一种黑客电影般的视觉体验。
3cY-S3C 仪表盘界面
截图 -1(2D 地图和 TR 语言)
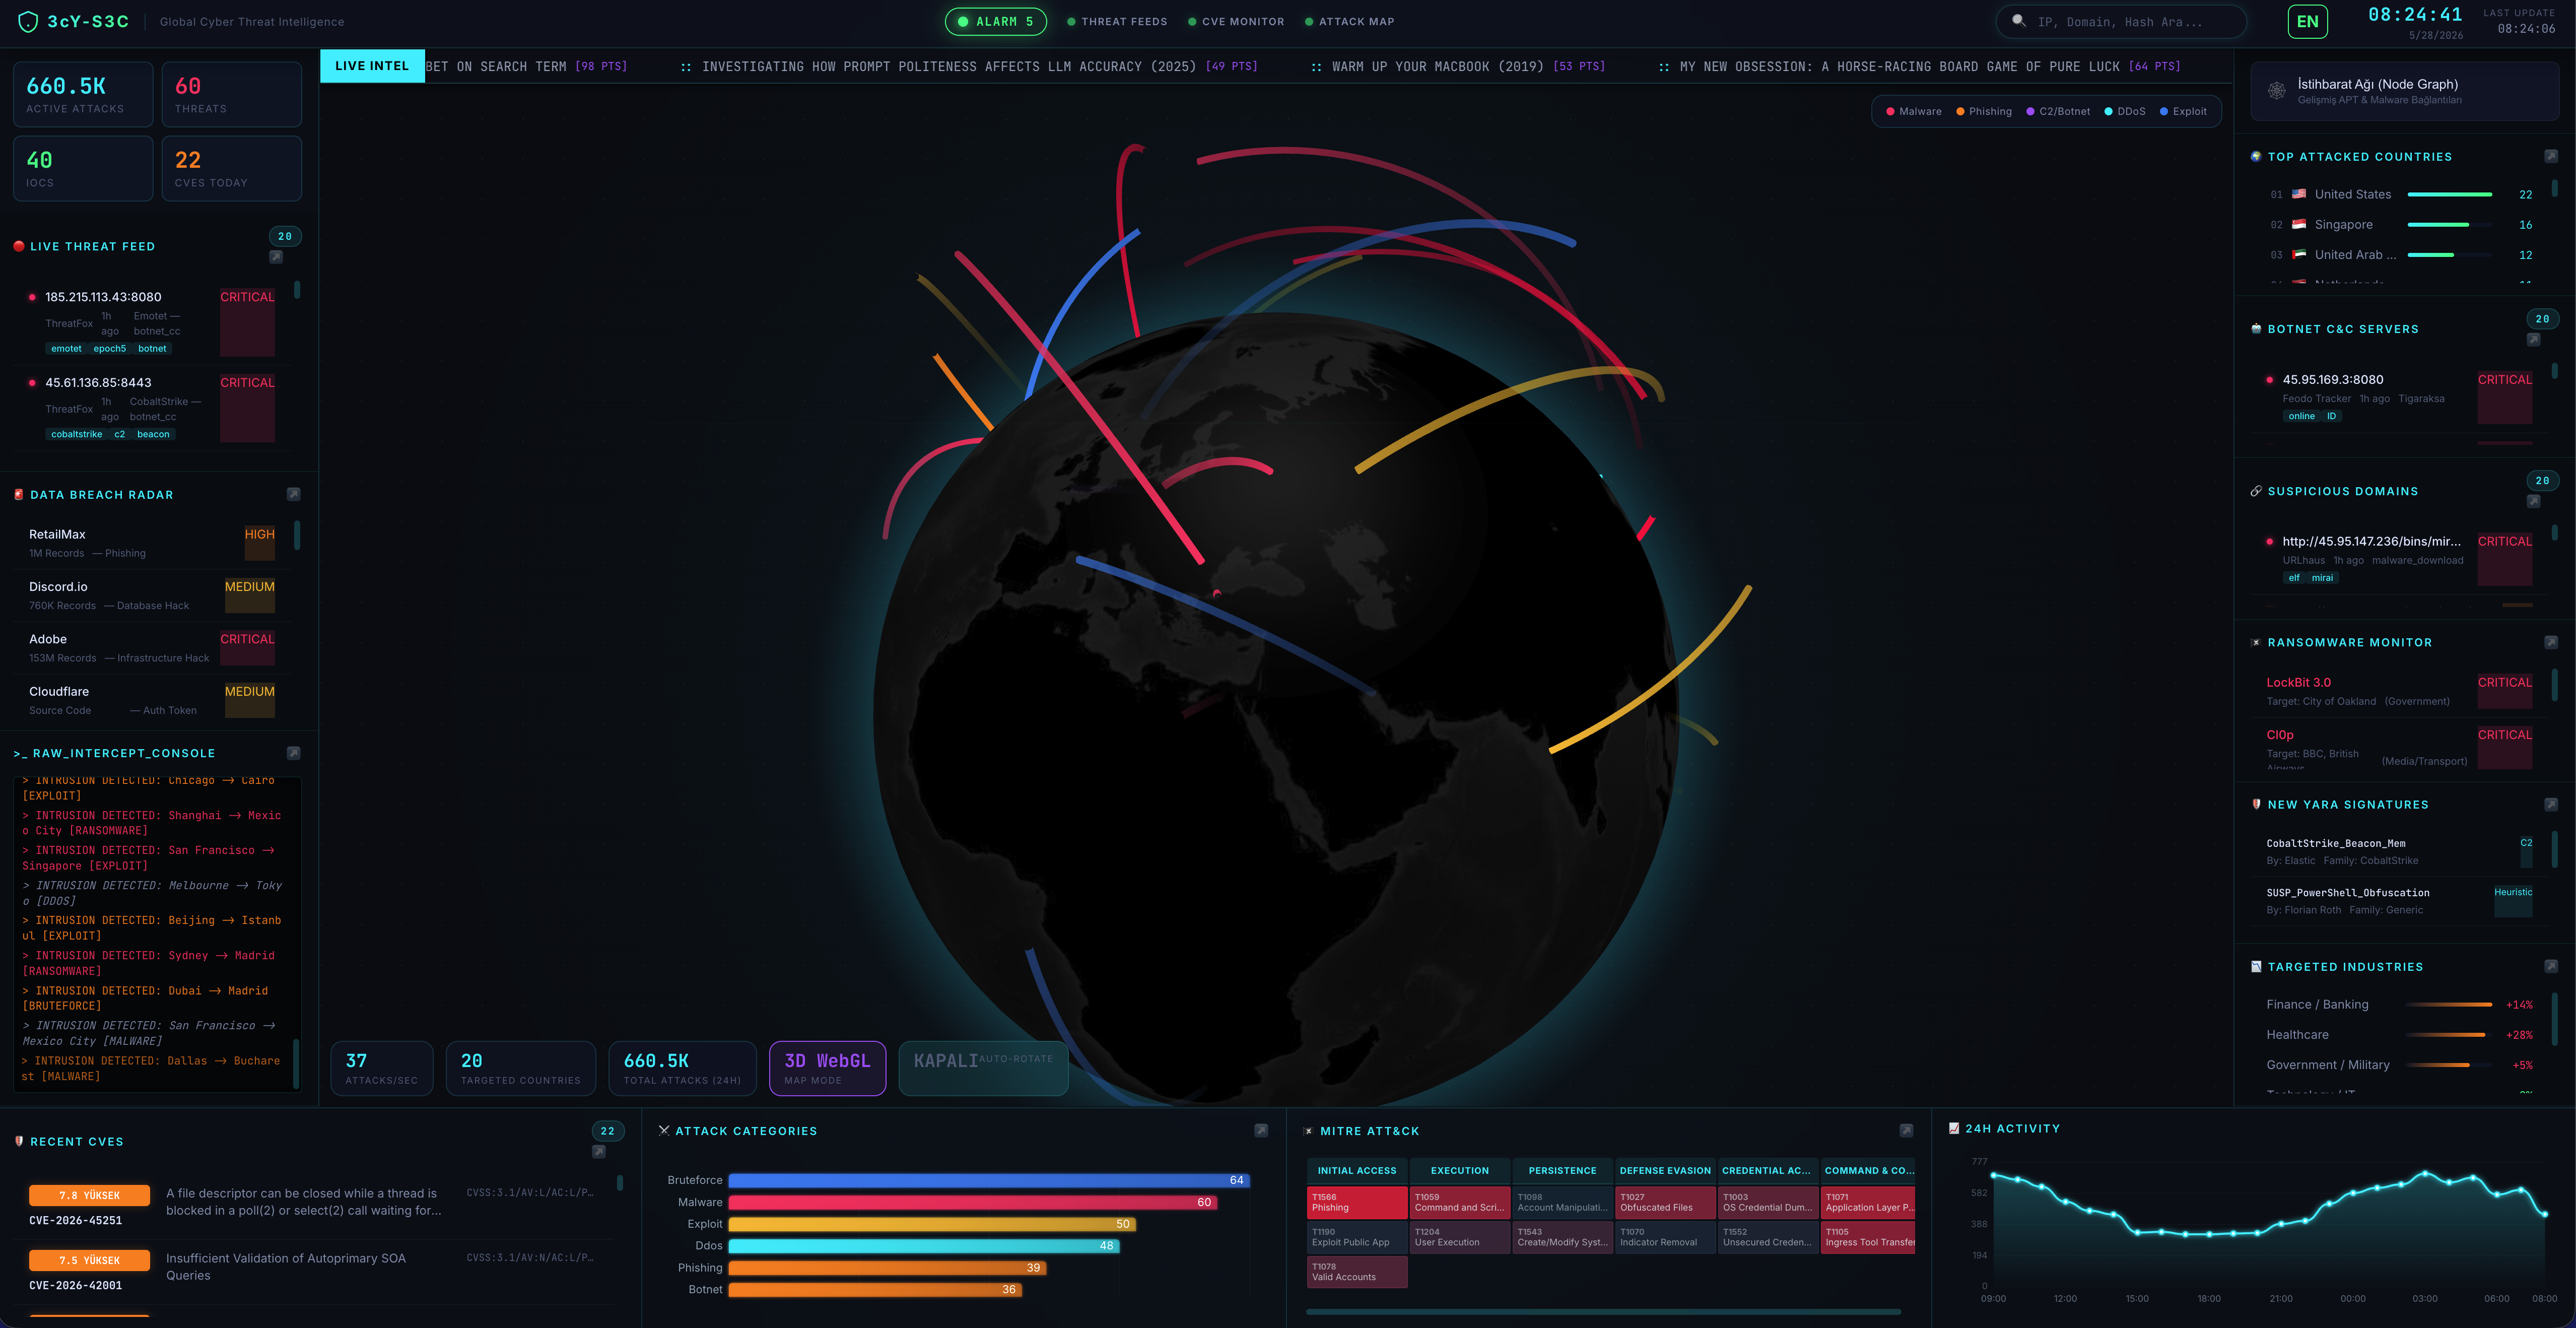
 截图 -2(3D 地图和 EN 语言)
 ## 🚀 功能
- **交互式威胁地图 (2D & 3D):** 可视化全球范围内正在发生的实时和模拟网络攻击。可以在 3D WebGL 地球仪和高性能的 2D Canvas 地图之间进行切换。
- **实时 OSINT 搜索模块:** 直接在仪表盘上查询任何 IP 地址或域名。即时从以下来源获取真实数据:
- **Shodan (InternetDB):** 开放端口、漏洞和主机名。
- **IPWhoIs:** 地理位置数据、ASN 和 ISP 详情。
- **NetworkCalc:** WHOIS 记录和域名注册信息。
- **VirusTotal 集成:** 一键点击霓虹风格的按钮,在 VirusTotal 上分析查询的目标。
- **Hacker News 实时滚动条:** 实时滚动的新闻栏,从 Hacker News (Y Combinator) API 获取热门报道和评分。
- **威胁订阅源与 CVE 监控:** 显示最新的通用漏洞披露 (CVE) 和 CISA 已知被利用漏洞 (KEV)。
- **Matrix 风格终端:** 一个原始的拦截控制台,以复古终端格式打印实时系统日志和威胁情报数据。
- **沉浸式音效:** 为 UI 点击、警报和 OSINT 扫描提供交互式音效(可切换开关)。
## 🛠️ 技术栈
该项目完全使用客户端技术构建,这意味着它完全在浏览器中运行,无需后端:
- **HTML5 / CSS3 / JavaScript (ES6+)**
- **D3.js:** 用于高性能的 2D 雷达地图投影。
- **Globe.gl & Three.js:** 用于交互式的 3D WebGL 世界地图。
- **TopoJSON:** 用于渲染国家边界和地图地形。
- **Fetch API:** 用于集成公开的、无需密钥的 REST API(Shodan、IPWhoIs、Hacker News 等)。
## ⚙️ 安装与使用
由于这是一个静态的客户端 Web 应用程序,安装就像打开一个文件一样简单。
1. 克隆或将此代码库下载到您的本地计算机。
2. 在任何现代 Web 浏览器(Chrome、Firefox、Safari、Edge)中打开 `index.html`。
3. 仪表盘将自动初始化,获取最新的威胁情报,并开始攻击地图的可视化。
## 🕵️♂️ OSINT 搜索模块使用
1. 点击右上角的 🔍 图标(或在已配置的情况下按 `Ctrl+K` / `Cmd+K`)打开搜索栏。
2. 输入 IP 地址(例如 `8.8.8.8`)或域名(例如 `google.com`)。
3. 按 `Enter` 键。
4. 系统将模拟一次扫描,同时在后台从公开 API 获取真实数据。
5. 在弹窗中查看 WHOIS、GeoIP 和开放端口数据。
6. 点击霓虹风格的 **"Bu hedefi VirusTotal'da İncele"** 按钮以执行深度的威胁分析。
## 🎨 地图模式
您可以使用左下角的 "Harita Modu" 按钮在地图模式之间进行切换:
- **2D Canvas(默认):** 平面的战术雷达式地图。性能极高。
- **3D WebGL:** 真实的、可旋转的 3D 地球仪,显示全球攻击弧线。
## 🔒 使用的 API
该仪表盘依赖于以下公开的、免费使用的 API(无需 API 密钥):
- [Hacker News API](https://github.com/HackerNews/API) - 热门报道滚动条
- [InternetDB API (由 Shodan 提供)](https://internetdb.shodan.io/) - IP 端口和漏洞查询
- [IPWhoIs API](https://ipwhois.io/) - IP 地理位置
- [NetworkCalc API](https://networkcalc.com/) - WHOIS 查询
## 📜 许可证
此项目的创建仅用于教育目的、OSINT 研究和仪表盘美学设计。
*由 Emre Çağlar Yıldız 和 Antigravity AI 创建*
## 🚀 功能
- **交互式威胁地图 (2D & 3D):** 可视化全球范围内正在发生的实时和模拟网络攻击。可以在 3D WebGL 地球仪和高性能的 2D Canvas 地图之间进行切换。
- **实时 OSINT 搜索模块:** 直接在仪表盘上查询任何 IP 地址或域名。即时从以下来源获取真实数据:
- **Shodan (InternetDB):** 开放端口、漏洞和主机名。
- **IPWhoIs:** 地理位置数据、ASN 和 ISP 详情。
- **NetworkCalc:** WHOIS 记录和域名注册信息。
- **VirusTotal 集成:** 一键点击霓虹风格的按钮,在 VirusTotal 上分析查询的目标。
- **Hacker News 实时滚动条:** 实时滚动的新闻栏,从 Hacker News (Y Combinator) API 获取热门报道和评分。
- **威胁订阅源与 CVE 监控:** 显示最新的通用漏洞披露 (CVE) 和 CISA 已知被利用漏洞 (KEV)。
- **Matrix 风格终端:** 一个原始的拦截控制台,以复古终端格式打印实时系统日志和威胁情报数据。
- **沉浸式音效:** 为 UI 点击、警报和 OSINT 扫描提供交互式音效(可切换开关)。
## 🛠️ 技术栈
该项目完全使用客户端技术构建,这意味着它完全在浏览器中运行,无需后端:
- **HTML5 / CSS3 / JavaScript (ES6+)**
- **D3.js:** 用于高性能的 2D 雷达地图投影。
- **Globe.gl & Three.js:** 用于交互式的 3D WebGL 世界地图。
- **TopoJSON:** 用于渲染国家边界和地图地形。
- **Fetch API:** 用于集成公开的、无需密钥的 REST API(Shodan、IPWhoIs、Hacker News 等)。
## ⚙️ 安装与使用
由于这是一个静态的客户端 Web 应用程序,安装就像打开一个文件一样简单。
1. 克隆或将此代码库下载到您的本地计算机。
2. 在任何现代 Web 浏览器(Chrome、Firefox、Safari、Edge)中打开 `index.html`。
3. 仪表盘将自动初始化,获取最新的威胁情报,并开始攻击地图的可视化。
## 🕵️♂️ OSINT 搜索模块使用
1. 点击右上角的 🔍 图标(或在已配置的情况下按 `Ctrl+K` / `Cmd+K`)打开搜索栏。
2. 输入 IP 地址(例如 `8.8.8.8`)或域名(例如 `google.com`)。
3. 按 `Enter` 键。
4. 系统将模拟一次扫描,同时在后台从公开 API 获取真实数据。
5. 在弹窗中查看 WHOIS、GeoIP 和开放端口数据。
6. 点击霓虹风格的 **"Bu hedefi VirusTotal'da İncele"** 按钮以执行深度的威胁分析。
## 🎨 地图模式
您可以使用左下角的 "Harita Modu" 按钮在地图模式之间进行切换:
- **2D Canvas(默认):** 平面的战术雷达式地图。性能极高。
- **3D WebGL:** 真实的、可旋转的 3D 地球仪,显示全球攻击弧线。
## 🔒 使用的 API
该仪表盘依赖于以下公开的、免费使用的 API(无需 API 密钥):
- [Hacker News API](https://github.com/HackerNews/API) - 热门报道滚动条
- [InternetDB API (由 Shodan 提供)](https://internetdb.shodan.io/) - IP 端口和漏洞查询
- [IPWhoIs API](https://ipwhois.io/) - IP 地理位置
- [NetworkCalc API](https://networkcalc.com/) - WHOIS 查询
## 📜 许可证
此项目的创建仅用于教育目的、OSINT 研究和仪表盘美学设计。
*由 Emre Çağlar Yıldız 和 Antigravity AI 创建*
截图 -2(3D 地图和 EN 语言)
## 🚀 功能
- **交互式威胁地图 (2D & 3D):** 可视化全球范围内正在发生的实时和模拟网络攻击。可以在 3D WebGL 地球仪和高性能的 2D Canvas 地图之间进行切换。
- **实时 OSINT 搜索模块:** 直接在仪表盘上查询任何 IP 地址或域名。即时从以下来源获取真实数据:
- **Shodan (InternetDB):** 开放端口、漏洞和主机名。
- **IPWhoIs:** 地理位置数据、ASN 和 ISP 详情。
- **NetworkCalc:** WHOIS 记录和域名注册信息。
- **VirusTotal 集成:** 一键点击霓虹风格的按钮,在 VirusTotal 上分析查询的目标。
- **Hacker News 实时滚动条:** 实时滚动的新闻栏,从 Hacker News (Y Combinator) API 获取热门报道和评分。
- **威胁订阅源与 CVE 监控:** 显示最新的通用漏洞披露 (CVE) 和 CISA 已知被利用漏洞 (KEV)。
- **Matrix 风格终端:** 一个原始的拦截控制台,以复古终端格式打印实时系统日志和威胁情报数据。
- **沉浸式音效:** 为 UI 点击、警报和 OSINT 扫描提供交互式音效(可切换开关)。
## 🛠️ 技术栈
该项目完全使用客户端技术构建,这意味着它完全在浏览器中运行,无需后端:
- **HTML5 / CSS3 / JavaScript (ES6+)**
- **D3.js:** 用于高性能的 2D 雷达地图投影。
- **Globe.gl & Three.js:** 用于交互式的 3D WebGL 世界地图。
- **TopoJSON:** 用于渲染国家边界和地图地形。
- **Fetch API:** 用于集成公开的、无需密钥的 REST API(Shodan、IPWhoIs、Hacker News 等)。
## ⚙️ 安装与使用
由于这是一个静态的客户端 Web 应用程序,安装就像打开一个文件一样简单。
1. 克隆或将此代码库下载到您的本地计算机。
2. 在任何现代 Web 浏览器(Chrome、Firefox、Safari、Edge)中打开 `index.html`。
3. 仪表盘将自动初始化,获取最新的威胁情报,并开始攻击地图的可视化。
## 🕵️♂️ OSINT 搜索模块使用
1. 点击右上角的 🔍 图标(或在已配置的情况下按 `Ctrl+K` / `Cmd+K`)打开搜索栏。
2. 输入 IP 地址(例如 `8.8.8.8`)或域名(例如 `google.com`)。
3. 按 `Enter` 键。
4. 系统将模拟一次扫描,同时在后台从公开 API 获取真实数据。
5. 在弹窗中查看 WHOIS、GeoIP 和开放端口数据。
6. 点击霓虹风格的 **"Bu hedefi VirusTotal'da İncele"** 按钮以执行深度的威胁分析。
## 🎨 地图模式
您可以使用左下角的 "Harita Modu" 按钮在地图模式之间进行切换:
- **2D Canvas(默认):** 平面的战术雷达式地图。性能极高。
- **3D WebGL:** 真实的、可旋转的 3D 地球仪,显示全球攻击弧线。
## 🔒 使用的 API
该仪表盘依赖于以下公开的、免费使用的 API(无需 API 密钥):
- [Hacker News API](https://github.com/HackerNews/API) - 热门报道滚动条
- [InternetDB API (由 Shodan 提供)](https://internetdb.shodan.io/) - IP 端口和漏洞查询
- [IPWhoIs API](https://ipwhois.io/) - IP 地理位置
- [NetworkCalc API](https://networkcalc.com/) - WHOIS 查询
## 📜 许可证
此项目的创建仅用于教育目的、OSINT 研究和仪表盘美学设计。
*由 Emre Çağlar Yıldız 和 Antigravity AI 创建*标签:ESC4, GitHub, HTTP/HTTPS抓包, OSINT, Web前端, 威胁情报, 安全运营中心, 实时处理, 开发者工具, 态势感知, 网络映射, 自定义脚本