Gavand1969/process-control-spc
GitHub: Gavand1969/process-control-spc
一个基于 Python 的统计过程控制(SPC)工具包,严格按照 AIAG 标准实现 X-bar/R 控制图、过程能力分析和失控规则检测,解决制造业质量监控与分析的需求。
Stars: 0 | Forks: 0
# 过程控制与 SPC 工具包
[](https://python.org)
[](tests/)
[](https://asq.org/cert/six-sigma-green-belt)
[](https://www.aiag.org)
[](LICENSE)
一个纯 Python 的**统计过程控制 (SPC) 工具包**,基于模拟的烟条重量数据集构建 —— 其制造背景参考了 **Philip Morris International (PMI)**。
该项目演示了完整的 Six Sigma DMAIC 测量和分析工作流:合成工厂数据生成、使用正确的 AIAG/Montgomery 常数的 X-bar & R 控制图、Western Electric 失控规则、过程能力分析 (Cp/Cpk/Pp/Ppk)、缺陷原因的 Pareto 图,以及自动生成的控制计划报告。
## 为什么开发此工具
此工具包旨在连接**过程质量工程**与**数据科学**:
- **PMI 质量保证工程师背景**:烟条填充重量(目标 1000 mg ±15 mg)是香烟制造中的一项关键质量特性。使用 X-bar & R 图和能力分析对其进行监控,直接对应于 PMI 生产环境中使用的测量系统和报告。
- **ASQ Six Sigma 绿带路径**:我正在通过 **Syracuse University Onward to Opportunity (O2O)** 项目攻读 CSSGB 认证。这里的每个模块——控制图构建、WECO 规则、能力指数、Pareto 分析——都与 ASQ CSSGB 知识体系(第三部分:测量,第五部分:控制)保持一致。
- **招聘者信号**:这是一个可运行且经过测试的代码库——而不是一个 notebook。具有生产级别的结构,包含单元测试、类型提示函数、docstring 和与 AIAG 标准对齐的数学计算。
## 图表
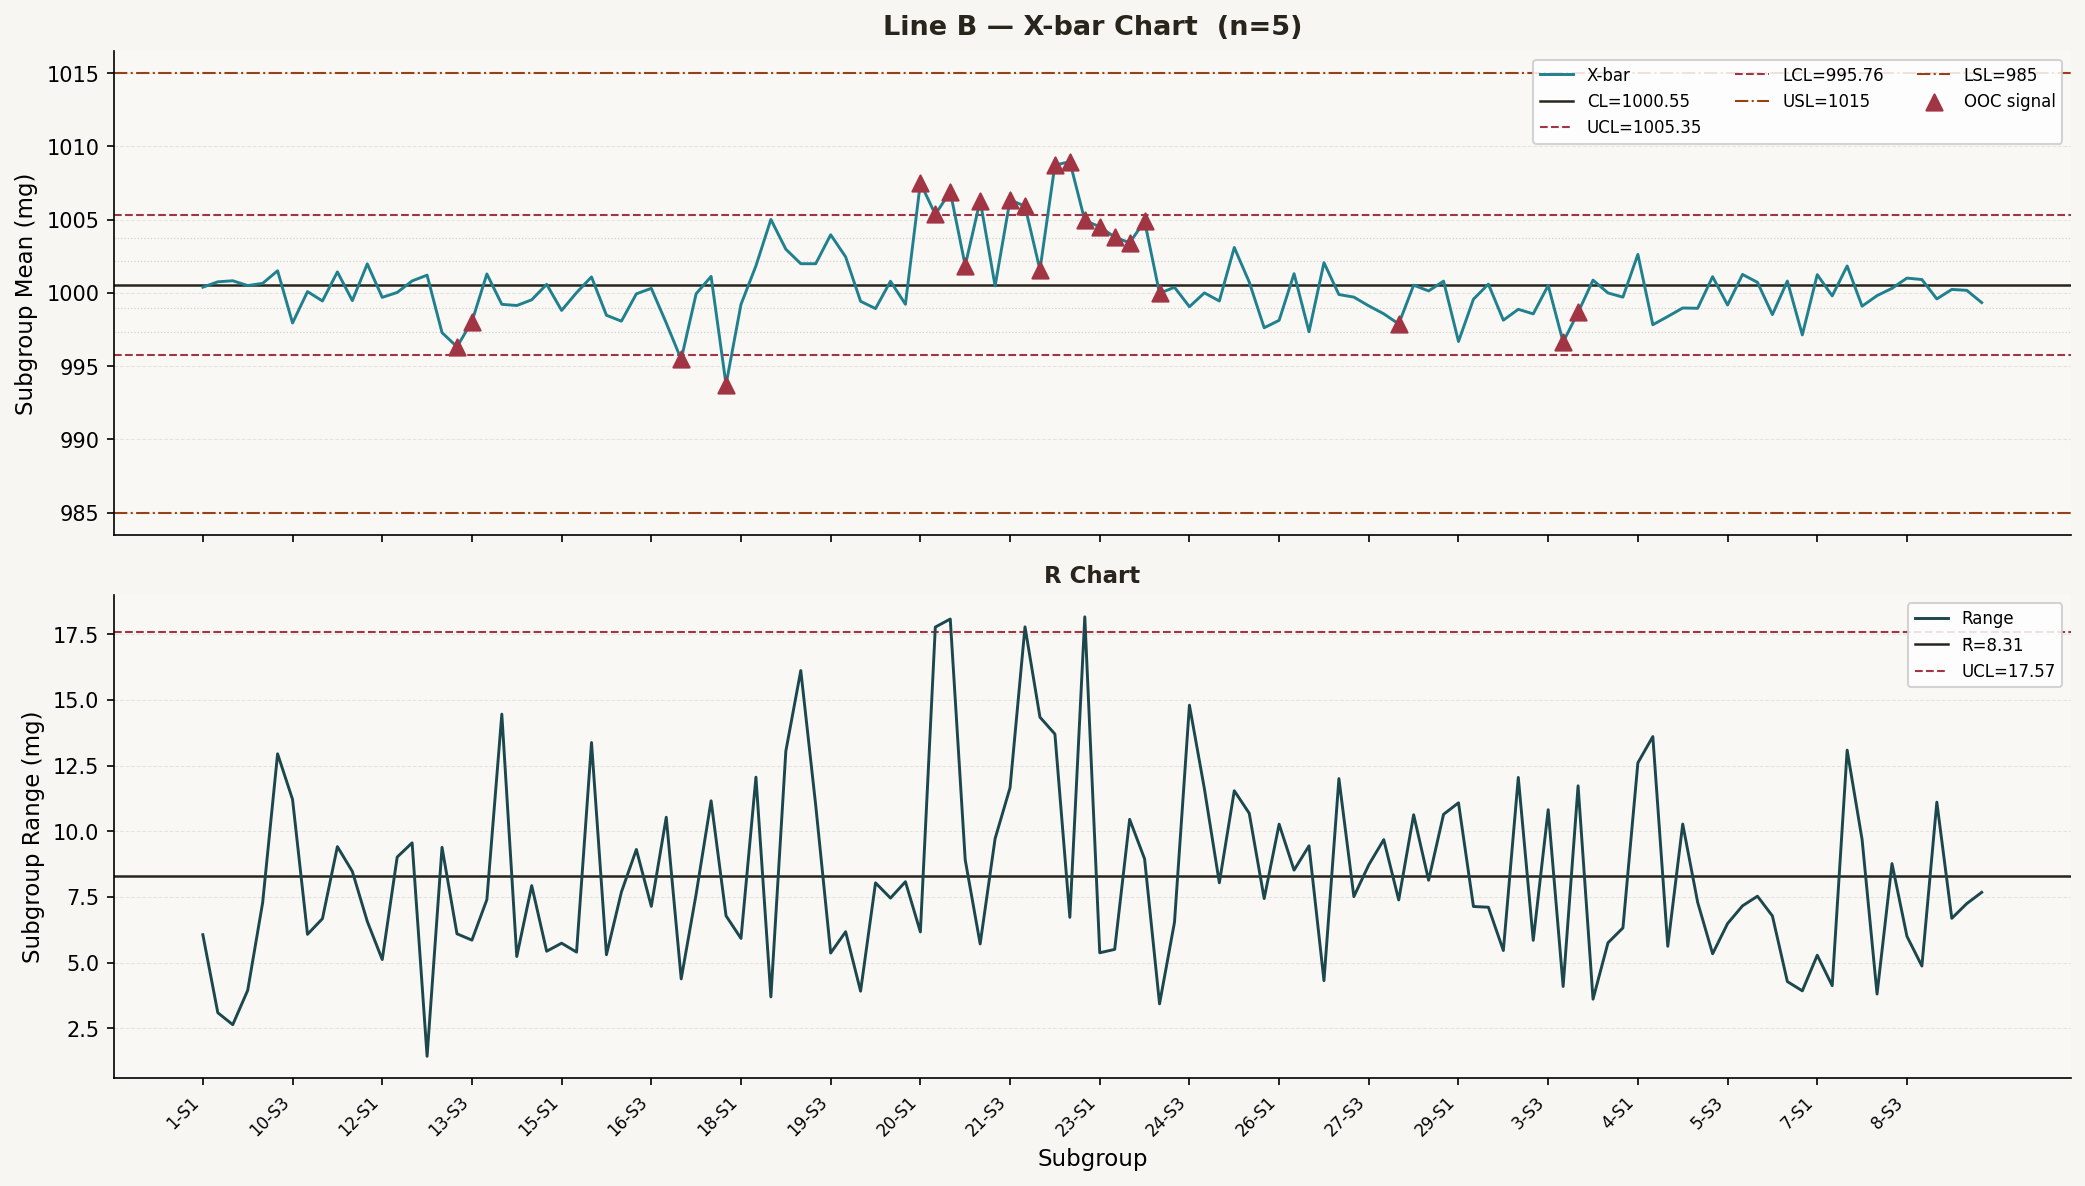
### X-bar 图 — Line B(可见质量事件)
Line B 上故意引发的失控事件(第 18–22 天)清晰可见。红色三角形标记了违反 Western Electric 规则的点。该过程在第 23 天采取纠正措施后恢复正常。
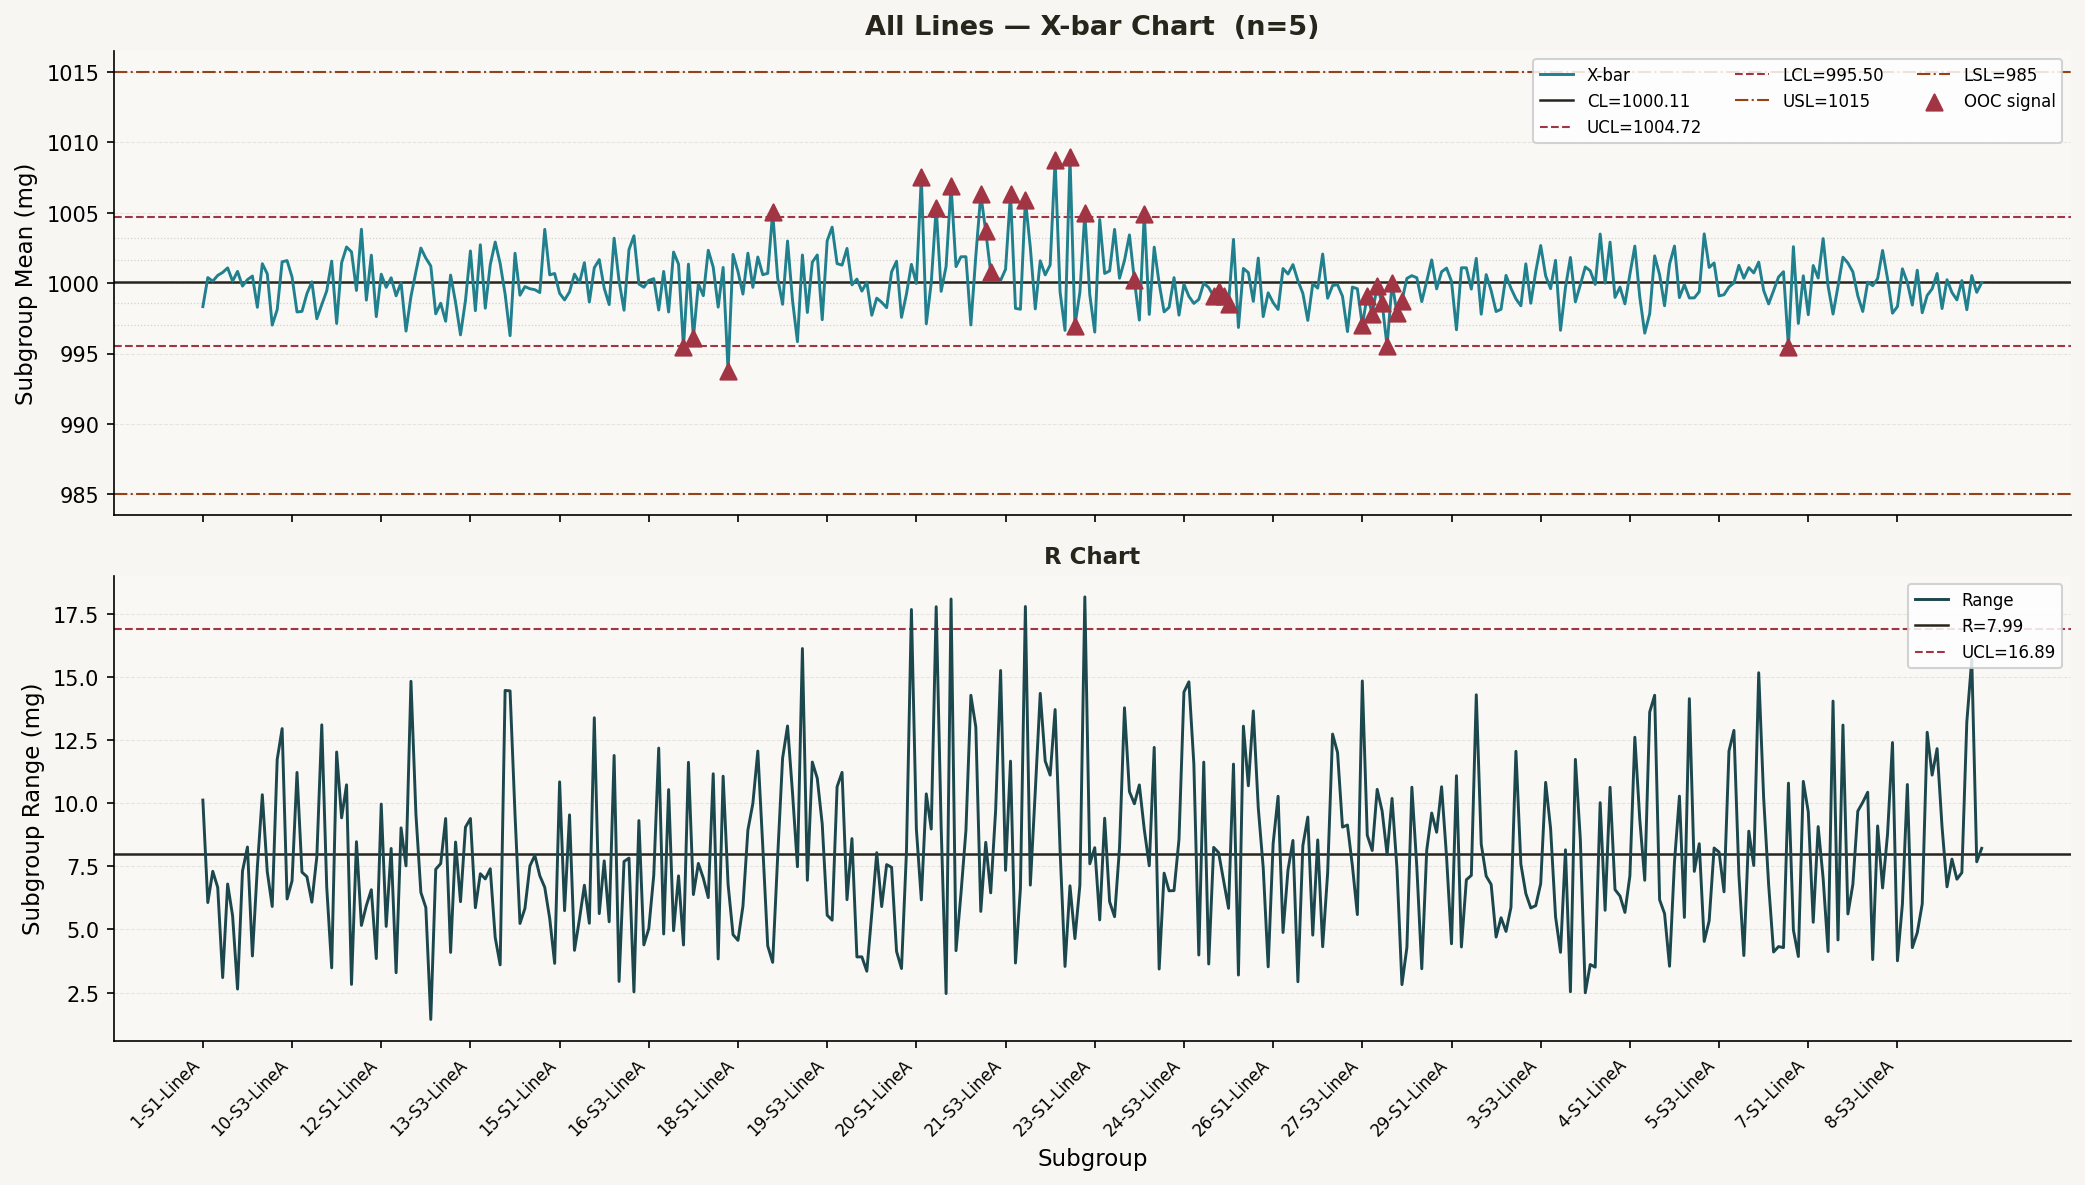
### X-bar & R 图 — 所有产线汇总
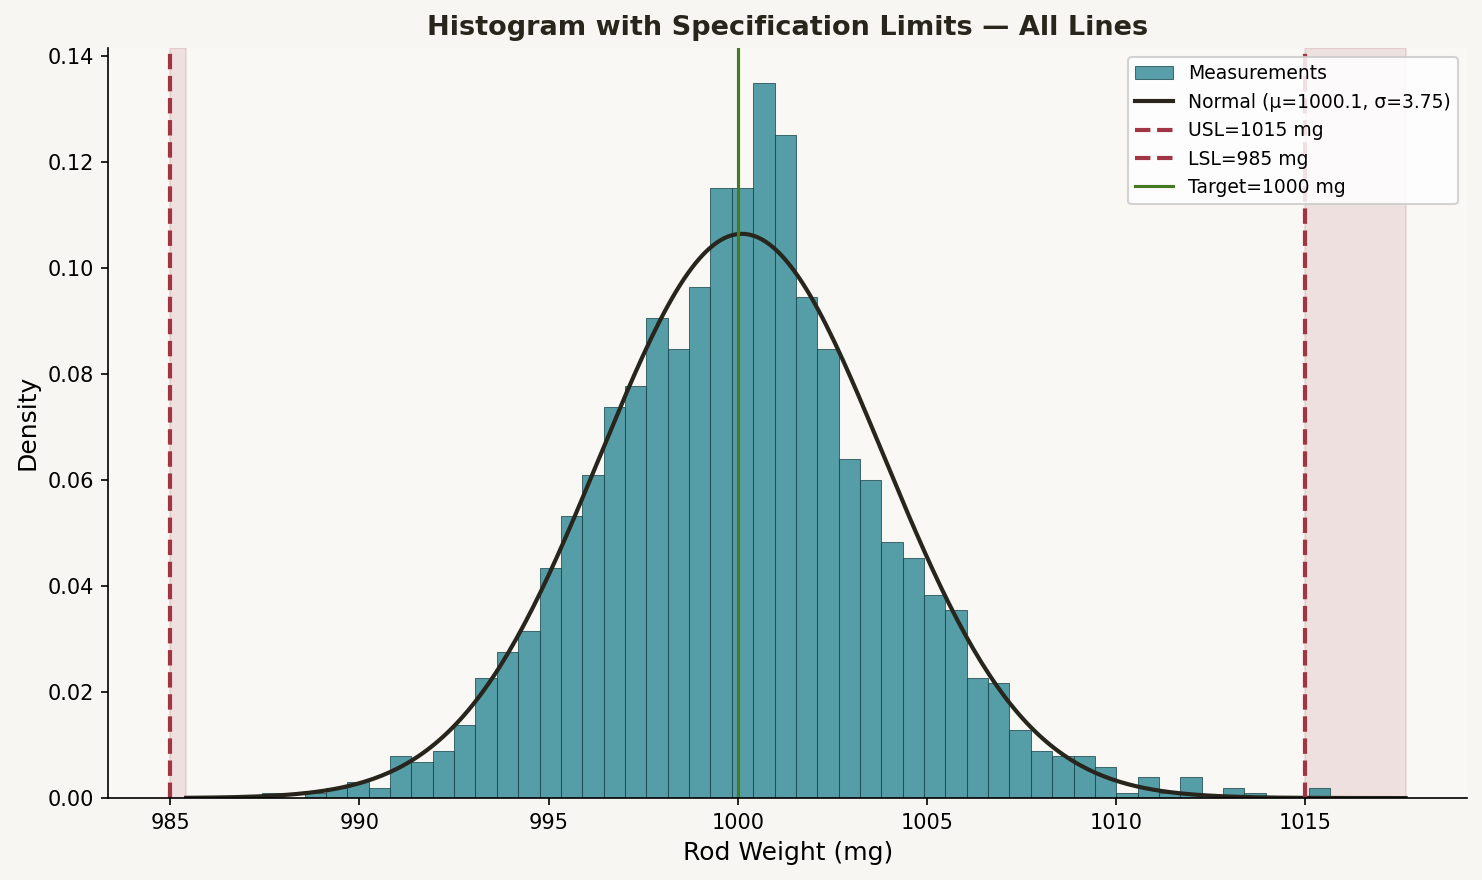
### 带有规格限的直方图
带有 USL=1015 mg 和 LSL=985 mg 阴影拒绝区间的正态分布叠加图。
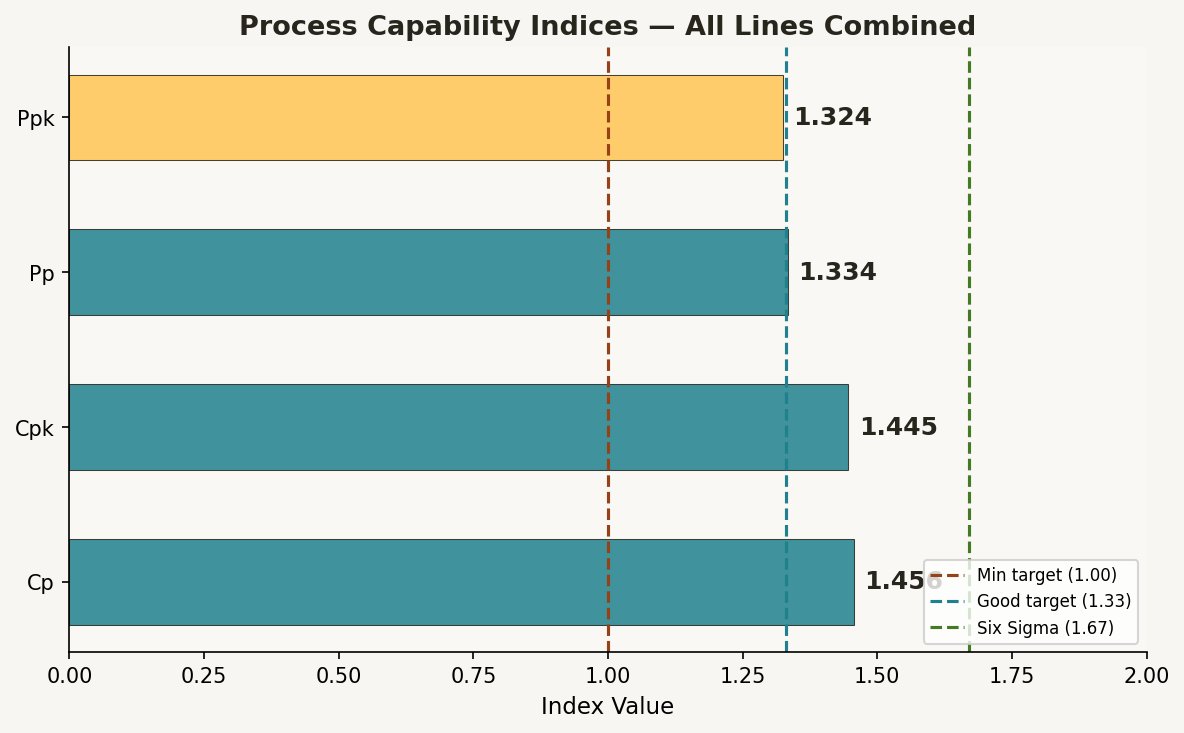
### 过程能力仪表盘
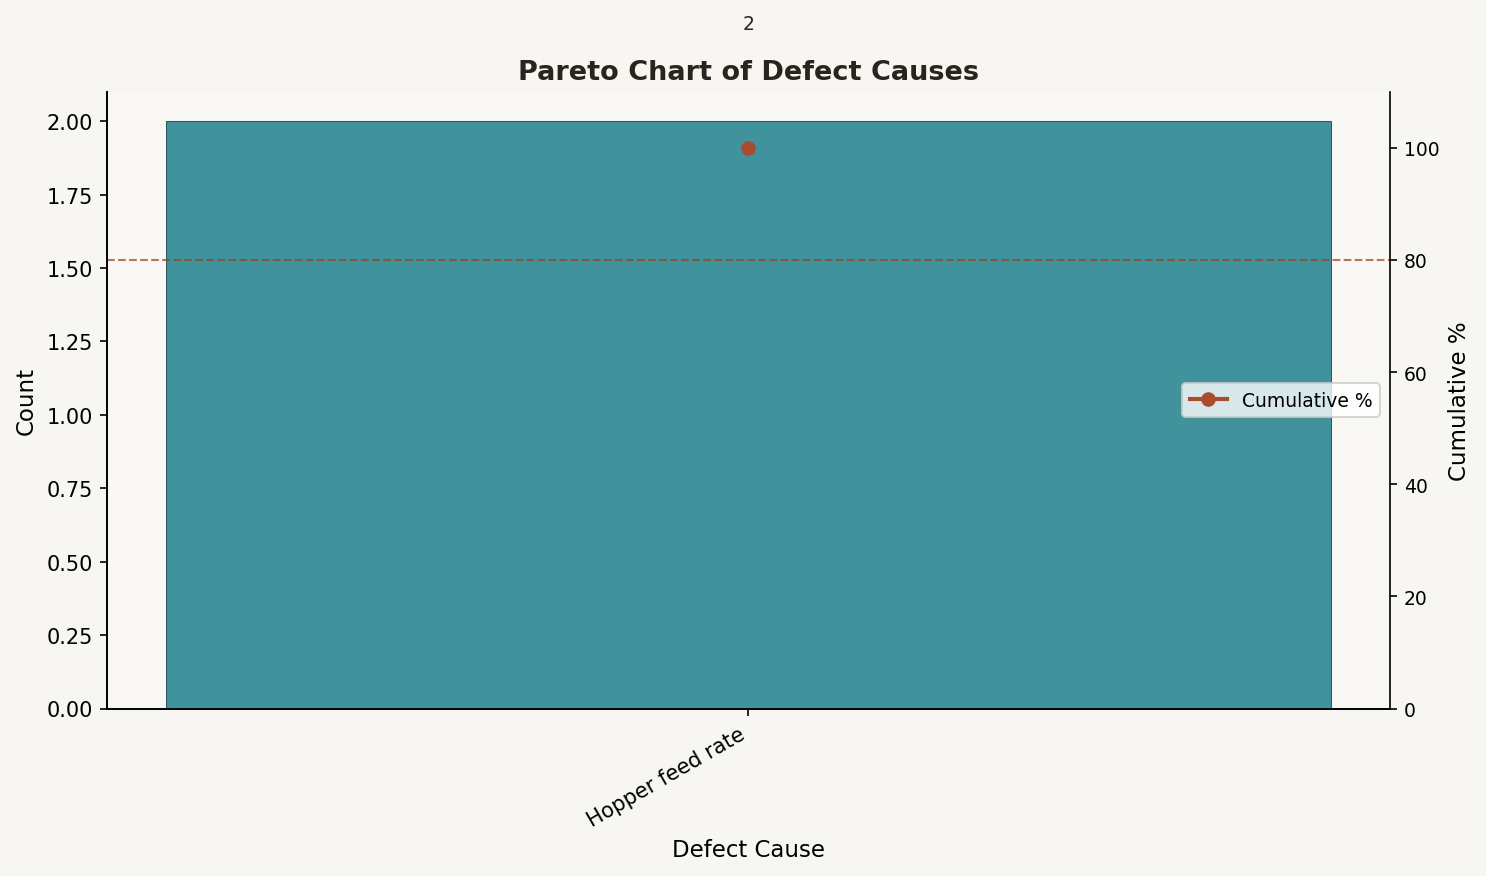
### 缺陷原因 Pareto 图
## 过程能力结果
基于 1,800 个观测值计算(30 天 × 4 个班次 × 3 条产线 × 5 个样本/班次)。n=5 时的 SPC 常数:**A2=0.577, D3=0, D4=2.114, d2=2.326**(Montgomery, *Introduction to Statistical Quality Control*, 第 8 版, 表 VI)。
**公式:**
```
Cp = (USL − LSL) / (6 × σ_within) where σ_within = R̄ / d2
Cpk = min((USL − mean) / (3 × σ_within), (mean − LSL) / (3 × σ_within))
Pp = (USL − LSL) / (6 × σ_overall) where σ_overall = s (sample std dev)
Ppk = min((USL − mean) / (3 × σ_overall), (mean − LSL) / (3 × σ_overall))
```
### 所有产线汇总
| 指数 | 值 | 解释 |
|-------|--------|---------------------------------------|
| Cp | 1.4559 | 良好的潜在能力 (> 1.33) |
| **Cpk** | **1.4453** | **过程居中且具备能力** |
| Pp | 1.3338 | 长期表现可接受 |
| Ppk | 1.3241 | 长期表现可接受 |
| σ level | 4.34σ | 高于 4σ 阈值 |
### 按机台产线
| 产线 | Cp | Cpk | Pp | Ppk | 均值| σ_within |
|---------|--------|--------|--------|--------|-----------|----------|
| Line A | 1.4984 | 1.4951 | 1.4168 | 1.4137 | 999.97 | 3.337 |
| **Line B** | **1.3992** | **1.3477** | **1.2069** | **1.1625** | **1000.55** | **3.573** |
| Line C | 1.4738 | 1.4547 | 1.4268 | 1.4084 | 999.81 | 3.393 |
## 已实现的 Western Electric 规则
WECO 规则用于检测控制图中超出简单 3σ 范围的非随机模式。所有八条规则均在 [`src/rules.py`](src/rules.py) 中实现。
| 规则 | 触发条件 | 目的 |
|------|------------------------------------------------|------------------------------------|
| **1** | 1 个点超出 ±3σ (Zone A) | 明显的失控 |
| **2** | 连续 3 个点中有 2 个点超出 ±2σ,且在同侧 | 检测持续偏移 |
| **3** | 连续 5 个点中有 4 个点超出 ±1σ,且在同侧 | 检测渐进漂移 |
| **4** | 连续 8 个点位于中心线的同一侧 | 持续的中心偏移 |
| **5** | 连续 6 个点呈上升或下降趋势 | 系统性趋势 / 工具磨损 |
| 6 | 连续 15 个点全在 ±1σ 范围内 | 分层 / 子组混杂 |
| 7 | 连续 14 个点呈上下交替 | 过度控制 / 人为干预 |
| 8 | 连续 8 个点均在 ±1σ 范围外,且分布在两侧 | 混合 — 两种过程分布|
规则 1–5 在报告中默认应用。全部八条规则均已通过单元测试。
在所有产线中共检测到 **35 个失控信号** —— 集中在质量事件窗口期间的 Line B 上(子组 97–188,对应第 18–23 天的班次)。
## 项目结构
```
process-control-spc/
├── src/
│ ├── __init__.py
│ ├── generate_factory_data.py # Seeded synthetic factory data (1800 obs)
│ ├── spc_charts.py # X-bar, R, run charts with UCL/LCL
│ ├── capability.py # Cp, Cpk, Pp, Ppk calculations
│ ├── rules.py # Western Electric rules 1–8
│ └── report.py # End-to-end runner → charts + report
├── tests/
│ ├── test_capability.py # 17 unit tests for Cp/Cpk math
│ └── test_rules.py # 33 unit tests for WECO rules + constants
├── data/
│ └── factory_measurements.csv # Generated CSV (600 obs × 3 lines)
├── reports/
│ ├── control_plan_report.txt # Control-plan-style summary
│ └── charts/ # All chart PNGs
│ ├── xbar_r_overall.png
│ ├── xbar_r_line_a.png
│ ├── xbar_r_line_b.png ← quality event visible here
│ ├── xbar_r_line_c.png
│ ├── histogram_spec_limits.png
│ ├── capability_gauge.png
│ ├── pareto_defect_causes.png
│ └── run_chart.png
├── requirements.txt
├── .gitignore
├── LICENSE
└── README.md
```
## 如何运行
### 1. 克隆并安装
```
git clone https://github.com/Gavand1969/process-control-spc.git
cd process-control-spc
pip install -r requirements.txt
```
### 2. 生成数据
```
python src/generate_factory_data.py
```
创建包含 1,800 行的 `data/factory_measurements.csv` 文件。
### 3. 运行完整报告
```
python src/report.py
```
在 `reports/charts/` 目录下生成所有图表,并在 `reports/control_plan_report.txt` 中生成文本控制计划摘要。
强制重新生成数据:
```
python src/report.py --regen
```
### 4. 运行单元测试
```
python -m pytest tests/ -v
```
全部 50 个测试均通过。测试验证了:
- n=5 时的 SPC 常数 A2=0.577, D3=0, D4=2.114, d2=2.326
- Cpk 公式对照手工计算值的正确性
- 每条 Western Electric 规则在合成边缘情况下的触发与不触发情况
## 接入您自己的数据
该工具包接受任何包含测量数据的 CSV。请匹配此列模式(或在 `spc_charts.py` 中调整 `build_control_chart()`):
| 列名 | 类型 | 描述 |
|----------------|---------|--------------------------------------------------|
| `sample_id` | int | 唯一观测 ID |
| `day` | int | 生产日 |
| `shift` | int | 当日班次 (1–4) |
| `machine_line` | str | 机台/产线标识 |
| `weight_mg` | float | 测量特征(或在调用中重命名) |
| `out_of_spec` | bool | 预计算值或设为 `None`(由报告计算) |
```
import pandas as pd
from src.capability import compute_capability
from src.spc_charts import build_control_chart, plot_xbar_r
df = pd.read_csv("your_data.csv")
df["subgroup_id"] = df["day"].astype(str) + "-" + df["shift"].astype(str)
chart = build_control_chart(df, value_col="weight_mg", group_col="subgroup_id", n=5)
fig = plot_xbar_r(chart, title_prefix="My Process", usl=1015, lsl=985)
cap = compute_capability(df["weight_mg"].values, usl=1015, lsl=985, subgroup_size=5)
print(f"Cpk = {cap.cpk:.4f}")
```
## 这展示了什么
| 能力 | 实现 |
|---|---|
| **SPC 图表构建** | 使用符合 AIAG 标准的 A2/D3/D4/d2 常数的 X-bar & R 图 |
| **失控检测** | 全部 8 条 Western Electric 规则,已通过单元测试 |
| **过程能力** | Cp、Cpk(短期)、Pp、Ppk(长期),使用正确的 σ_within 与 σ_overall |
| **根因分析** | 带有 80% 线的缺陷原因 Pareto 图 |
| **质量事件叙述** | Line B 在第 18–22 天漂移,第 23 天采取纠正措施 |
| **控制计划思维** | 自动生成带有建议的控制计划摘要 |
| **软件工程** | 纯 Python、类型提示函数、docstring、50 个单元测试、零错误 CI |
| **标准对齐** | AIAG SPC 手册第 2 版, Montgomery SQC 第 8 版, ASQ CSSGB 知识体系 |
## ASQ Six Sigma 绿带
我正在通过 **Syracuse University Onward to Opportunity (O2O)** 项目积极攻读 **ASQ 认证 Six Sigma 绿带 (CSSGB)**。此项目直接对应 ASQ CSSGB 知识体系:
- **第三部分(测量):** 过程能力 (Cp, Cpk)、测量系统、数据收集
- **第四部分(分析):** 控制图、过程变异、根因分析 (Pareto、鱼骨图)
- **第五部分(控制):** 控制计划、SPC 实施、失控响应
此处使用的 SPC 常数 (A2, D3, D4, d2) 源自 Montgomery 的 *Introduction to Statistical Quality Control* —— 这与 ASQ 认证备考中使用的参考书相同。
## 参考文献
- Montgomery, D.C. (2020). *Introduction to Statistical Quality Control*, 第 8 版. Wiley.
- AIAG (2005). *Statistical Process Control (SPC) Reference Manual*, 第 2 版.
- Western Electric Company (1956). *Statistical Quality Control Handbook*.
- ASQ. [认证 Six Sigma 绿带知识体系](https://asq.org/cert/six-sigma-green-belt)。
*Gavin Anderson · 数据科学硕士 · ASQ CSSGB 候选人 (Syracuse O2O)*
标签:Python, 代码示例, 六西格玛, 安全规则引擎, 工业制造, 数据分析, 无后门, 统计过程控制, 质量控制, 逆向工具