sanjanamahajan2001-sys/health-monitor-sre-engine
GitHub: sanjanamahajan2001-sys/health-monitor-sre-engine
一个使用 Go 编写的生产级 SRE 自动化引擎,将可观测性数据采集、ML 预测诊断、事件生命周期管理和自动化修复整合到统一的终端原生平台中。
Stars: 0 | Forks: 0
# 🛡️ Health-Monitor:企业级可观测性与 SRE 自动化平台
[](https://golang.org)
[](https://github.com/sanjana/health-monitor-sre-engine)
[](https://grafana.com)
[](#)
Health-Monitor 是一个生产级、高度自主的系统可观测性、事件响应自动化和站点可靠性工程 (SRE) 编排引擎,使用 Go 编写。专为分布式微服务集群(包括原生 EKS 集成)而设计,它将遥测数据收集、交互式诊断、机器学习启发式算法、免责事件生命周期和自动化运行手册生成整合到一个全系统级的代理中。
与标准的只读监控仪表板不同,Health-Monitor 弥合了主动检测与快速修复之间的差距,引入了终端原生的协作 SSH 会话、后台 ML 预测性异常预防以及沙盒可靠性训练模型。
## 📌 技术架构与数据流
Health-Monitor 采用模块化、高并发结构设计,旨在查询和关联来自 Prometheus、Loki 和 Tempo 的信号,将记录持久化到隔离的 SQLite 数据库中,并通知管理通道(PagerDuty、Slack)。
### 系统组件交互
```
graph TD
%% CLI & External Interfacing %%
subgraph Client_Interfaces [Client & Interface Layer]
A["Interactive TUI (Bubble Tea/Lipgloss)"]
B["CLI Executable (cmd/health-monitor)"]
C["Collaborative Guest TUI (SSH Port 9022 via Wish)"]
end
%% Daemon Webhooks & API %%
subgraph Daemons [Daemon & Webhook Services]
D["Alert Webhook Receiver (:8080/webhook)"]
E["Predictive ML Daemon (prevent start)"]
F["SLO Monitor Daemon (slo monitor)"]
end
%% Core Application Engine %%
subgraph Core_Engine [Core SRE Orchestration Engine]
G["Service Flow Discovery Engine"]
H["Incident Lifecycle Controller"]
I["ML Heuristics & Similarity Matcher"]
J["Dynamic Runbook Generator"]
K["Reliability Scorecard & Org Aggregator"]
L["Interactive Training Seeder & Guide"]
end
%% Integrations & Observability Backends %%
subgraph Backends [Enterprise Observability Stack]
M["Prometheus (Metrics / api/v1/series)"]
N["Loki (Error Logs & Patterns)"]
O["Tempo / Jaeger (Distributed Traces)"]
P["PagerDuty & Slack API (Alert Notifications)"]
Q["SQLite Caching Engine (Local Persistence)"]
end
%% Interface -> Daemon & Engine Mapping %%
A --> G & H & K & L
B --> G & H & K
C --> H & I & J
D --> H
E --> I & H
F --> K & D
%% Core Engine -> Integration Mapping %%
G --> M
H --> N & O & P & Q
I --> Q & N
J --> Q
K --> M & Q
L --> M & N
```
## 🛠️ 核心技术栈
* **系统核心**:**Go (Golang 1.22+)**,实现极致的并发、安全性和低资源开销。
* **终端界面**:**Bubble Tea (Charm CLI)**、**Lipgloss** 和 **Wish**,用于打造黑曜石主题、硬件加速且基于 SSH 隧道的多用户终端 UI。
* **可观测性平台**:原生 API 支持 **Prometheus**(指标摄取)、**Grafana Loki**(日志关联)、**Tempo & Jaeger**(链路分析)。
* **机器学习**:动态关键词分词器、语义相似度引擎和异常预测模型。
* **持久化**:内嵌 **SQLite 3**,用于超快速的本地事件缓存、运行手册追踪和遥测配置。
* **通知层**:**Slack Webhooks**、**PagerDuty API v2**、**SMTP 邮件服务器**和**自定义 Webhook 端点**。
* **编排与部署**:**Docker & Compose** 模板、**Kubernetes / EKS 清单**和 **Systemd** 后台守护进程文件。
## 📂 代码库映射与内部目录参考
为了提供绝对开发者级别的透明度,以下是一份详细的目录映射图,将 Health-Monitor 的包与其文件、底层组件和 Go 架构功能关联起来:
```
health-monitor/
├── cmd/
│ └── health-monitor/
│ └── main.go # Core Application Entry Point
├── internal/
│ ├── alert/ # AlertManager Daemon Endpoint
│ │ ├── auth.go # Bearer Token Webhook authentication
│ │ ├── server.go # HTTP API listener and routing logic
│ │ ├── secure_handler.go # Rate limiting and CORS safety policies
│ │ └── generator.go # Dynamically generated Alert payloads for validation
│ ├── analyse/ # Low-Level Diagnostic Collectors
│ │ ├── api_latency/ # API Response latency profiling and regression checks
│ │ ├── apm/ # mini-APM metric correlation logic
│ │ ├── disk/ # High-frequency disk utilization and I/O rates
│ │ ├── gpu/ # NVIDIA/SMI hardware metrics extraction
│ │ ├── infra/ # Kubernetes Cluster health and Node validations
│ │ ├── logs/ # Advanced Loki log analysis and Elastic aggregator
│ │ ├── prometheus/ # Adaptive metrics probing via /api/v1/series
│ │ ├── tracing/ # Tempo & Jaeger distributed traces extraction
│ │ ├── system/ # Host CPU core queues and memory states
│ │ └── zombies/ # Kernel zombie process trackers
│ ├── audit/ # Administrative Audit Recorder
│ │ ├── logger.go # Standardized secure JSON audit logs writer
│ │ └── types.go # Security event classification schemas
│ ├── checks/ # High-Level Orchestrated Health Scripts
│ │ ├── disk.go # Executable Disk limits validation script
│ │ ├── memory.go # Memory threshold checks coordinator
│ │ ├── zombies.go # Interactive zombie reaping and alerts
│ │ └── infra.go # K8s status query validation check
│ ├── config/ # Profile & Setting Lifecycle Manager
│ │ ├── config.go # YAML configuration loader and structures
│ │ ├── profile.go # Profile switcher and environment validator
│ │ ├── secrets.go # Token and password encryptor (0600 paths)
│ │ ├── watcher.go # Real-time config hot-reloading watcher
│ │ ├── wizard.go # Interactive console configuration onboarding
│ │ └── wizard_teams.go # Dynamic preset allocator for team sizes
│ ├── ml/ # Machine Learning Predictor Stack
│ │ ├── predictor_daemon.go # Background telemetry scan and pattern detector
│ │ ├── search.go # Text clustering and semantic vector parser
│ │ └── lifecycle_recorder.go # Anomaly timeline state persistence
│ ├── notify/ # Outbound Alert Dispatcher
│ │ ├── slack/ # Slack Rich Block formatters and retry pipelines
│ │ └── pagerduty/ # PagerDuty Event V2 payload compiler
│ ├── runbook/ # Automated Playbook Generators
│ │ ├── analyzer.go # Signature matcher mapping logs to incident patterns
│ │ ├── generator.go # Markdown step-by-step troubleshooter generator
│ │ └── store.go # Directory persistence and filesystem tracking
│ ├── scorecard/ # Reliability & SLA Grade Calculations
│ │ ├── service.go # Single service SLO and error budget statistics
│ │ └── tui.go # Org-level multi-profile aggregated scorecard TUI
│ ├── slo/ # Service Level Objective Monitor
│ │ ├── monitor_handler.go # Error budget burn calculator daemon
│ │ └── service.go # Real-time metric queries evaluator
│ └── tui/ # Obsidian Bubble Tea TUI
│ ├── interactive_tui.go # Multi-page responsive view event loop
│ ├── tui_datasource.go # Mock & real Prometheus state controller
│ └── tui_styles.go # Bespoke glassmorphism CSS-style layout tokens
```
## ⚡ 核心 CLI 命令与子命令参考
Health-Monitor 使用高度结构化的 CLI 层级来执行检查、管理事件、调用向导、查询遥测数据和部署守护进程。
### 1. 初始化与发现
#### 动态基础设施发现 (`--init`)
查询目标 EKS/K8s 环境,在 Prometheus 上执行动态 PromQL 扫描,验证有效的指标名称,并构建生产就绪的配置。
```
# EKS Clusters(必须在 sudo 环境中保留 AWS credentials)
sudo -E ./health-monitor --init --infra eks --kubeconfig ~/.kube/config --profile production-cluster
# 本地 Kubernetes 发现
sudo ./health-monitor --init --infra kubernetes --kubeconfig ~/.kube/config --profile staging-cluster
```
* **内部执行的具体操作**:
1. 探测 Prometheus 端点 `/api/v1/series` 以识别精确的上报指标。
2. 动态识别服务标识符(例如 `app`、`job`、`service`、`kubernetes_namespace`)。
3. 在 7 天的查询窗口内验证并计算基准指标。
4. 在 `/etc/health-monitor/` 内生成隔离的配置。
#### 交互式团队预设向导 (`--wizard-team`)
使用为特定团队规模设计的标准操作模型来引导构建结构化的 o11y 设置。
```
# 启动基于角色的 Interactive Setup Wizard
sudo ./health-monitor --wizard-team
# 非交互式预设 bootstrapper
sudo ./health-monitor --wizard-team --preset microservices --profile core-platform
```
* **可用预设**:
* `small-team` (1-5 名 SRE):专注于关键服务和基本告警推送。
* `medium-team` (5-15 名 SRE):映射标准依赖项、延迟百分位和多服务流转。
* `devops-team` / `sre-team`:自定义仪表板,映射容器工作负载、磁盘 I/O、错误预算和 P99 延迟衰退。
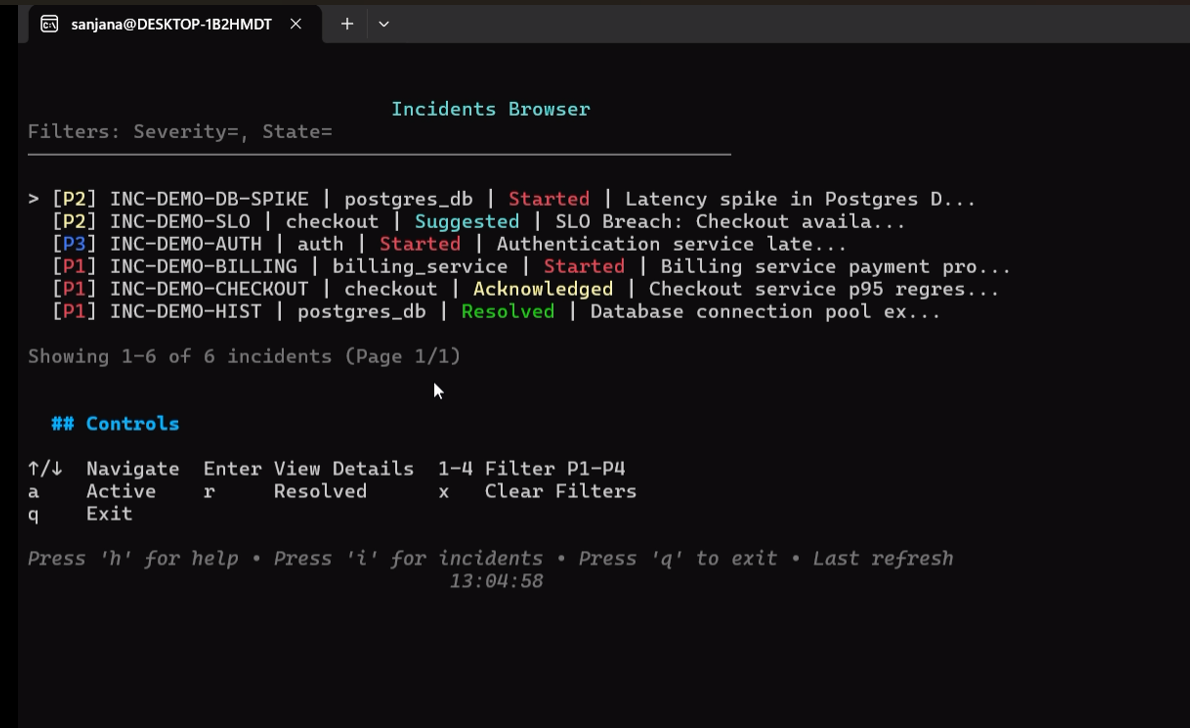
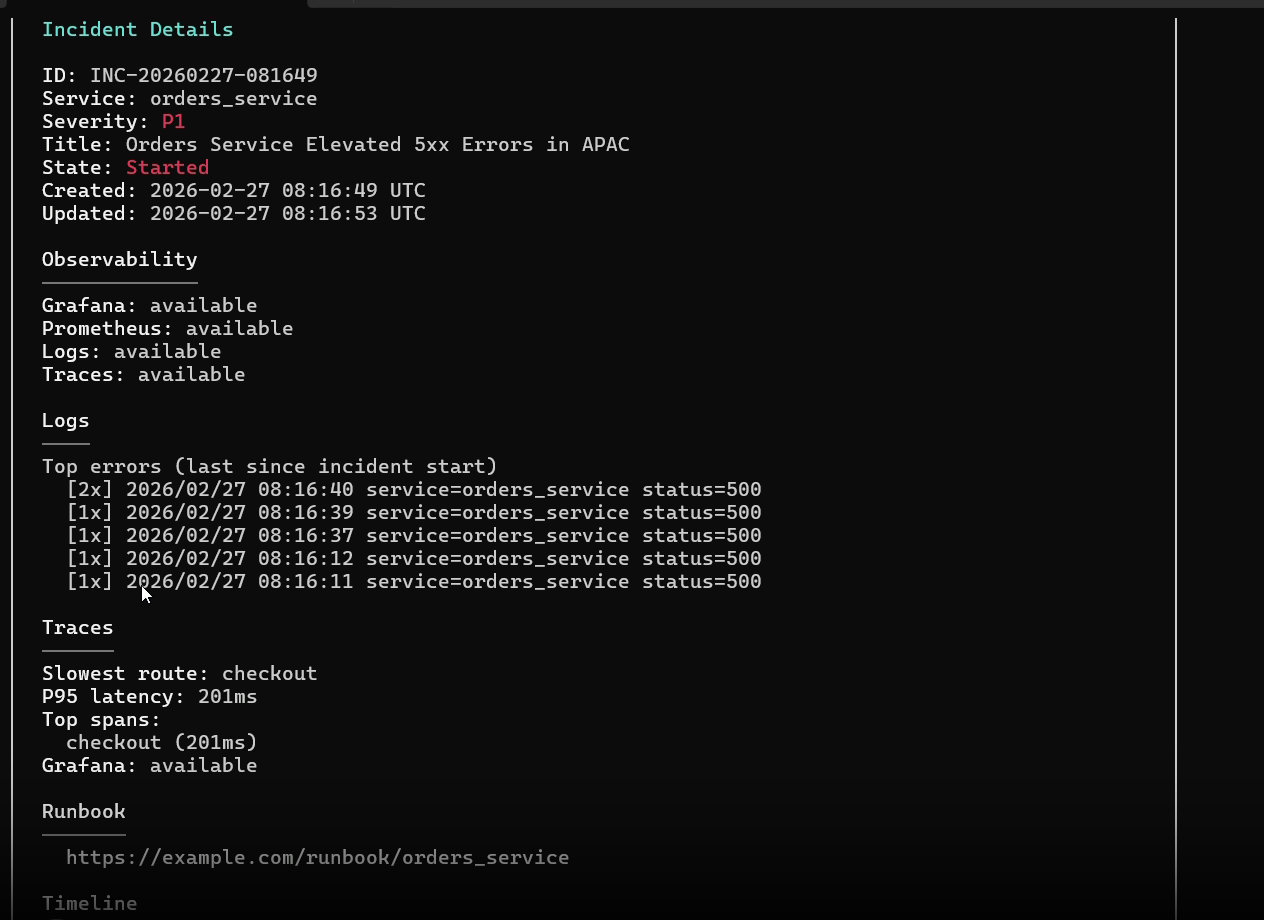
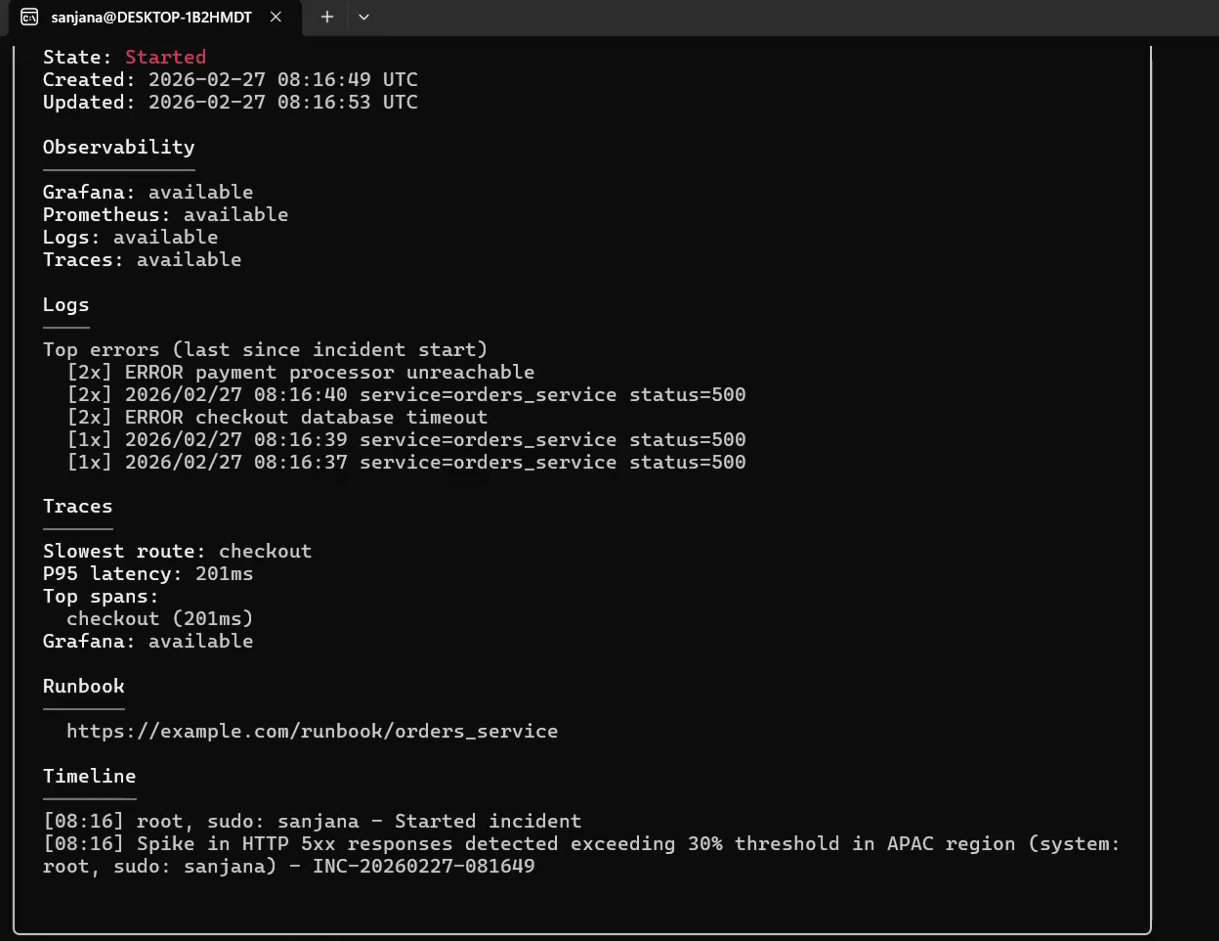
 ### 2. 事件管理生命周期
管理系统事件,关联诊断、日志事件,并生成 RCA 复盘。
```
# 通过自动 o11y correlation 手动启动事件
sudo health-monitor incident start \
--service billing_api \
--title "Payment Gateway Response Degradation" \
--severity P1 \
--description "95th percentile latency exceeded 2.5s"
# 列出具有活跃状态过滤器的故障事件
health-monitor incident list --state open --profile core-platform
# 执行包含 toil tracking 的交互式 15 字段 RCA Resolution
sudo health-monitor incident resolve \
--id INC-20260220-123456 \
--summary "Database connection pool scale-out complete" \
--root-cause "Connection pool exhaustion under heavy traffic spikes" \
--fix "Increased MaxOpenConns configuration and deployed pgBouncer proxy" \
--category dependency \
--component postgres_db \
--toil-minutes 45 \
--toil-category database_triage \
--downtime 12
# 生成全面的、无指责的 Markdown postmortem 报告
health-monitor incident postmortem --id INC-20260220-123456
```
### 2. 事件管理生命周期
管理系统事件,关联诊断、日志事件,并生成 RCA 复盘。
```
# 通过自动 o11y correlation 手动启动事件
sudo health-monitor incident start \
--service billing_api \
--title "Payment Gateway Response Degradation" \
--severity P1 \
--description "95th percentile latency exceeded 2.5s"
# 列出具有活跃状态过滤器的故障事件
health-monitor incident list --state open --profile core-platform
# 执行包含 toil tracking 的交互式 15 字段 RCA Resolution
sudo health-monitor incident resolve \
--id INC-20260220-123456 \
--summary "Database connection pool scale-out complete" \
--root-cause "Connection pool exhaustion under heavy traffic spikes" \
--fix "Increased MaxOpenConns configuration and deployed pgBouncer proxy" \
--category dependency \
--component postgres_db \
--toil-minutes 45 \
--toil-category database_triage \
--downtime 12
# 生成全面的、无指责的 Markdown postmortem 报告
health-monitor incident postmortem --id INC-20260220-123456
```
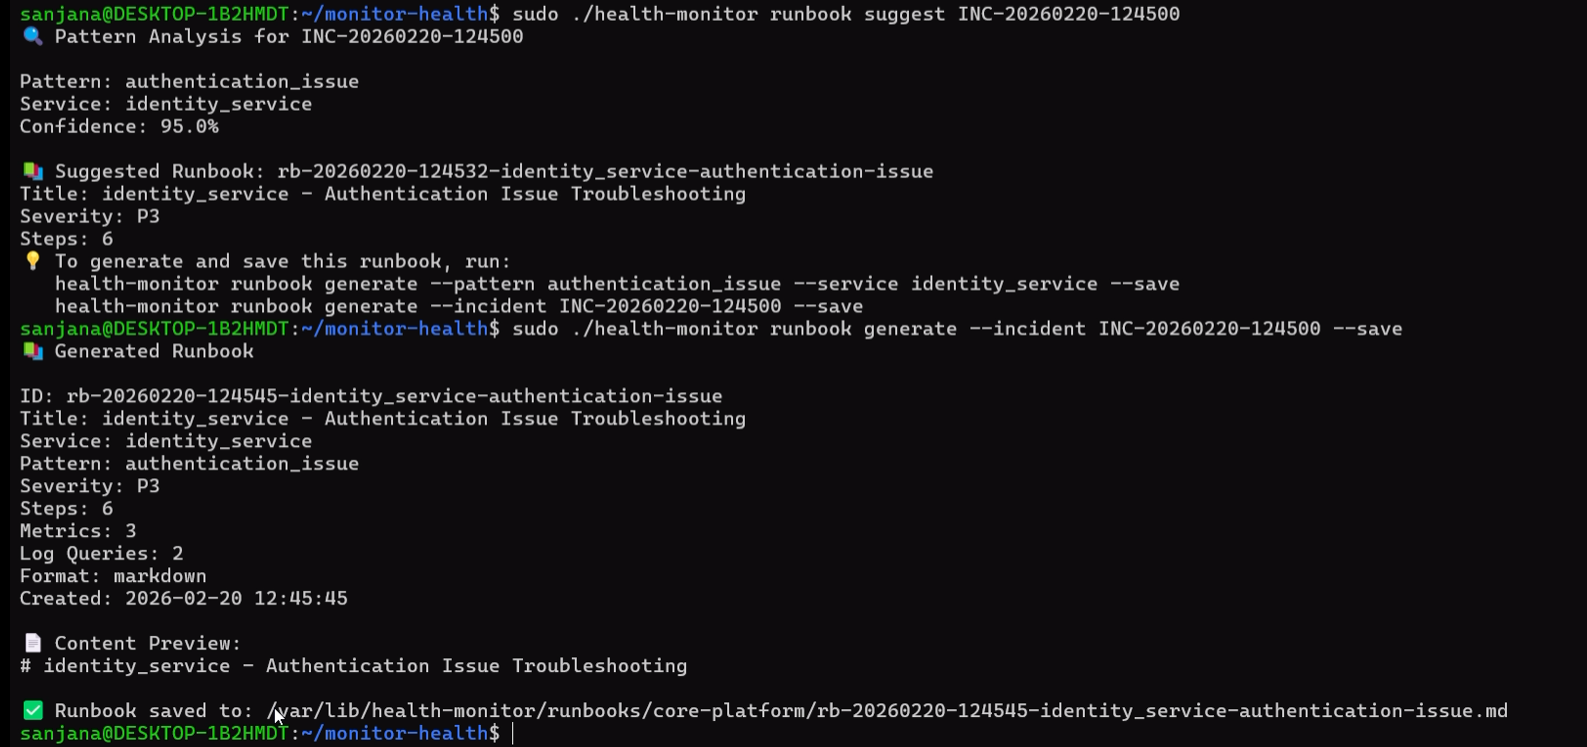
 ### 3. 自动化运行手册与 Playbook
Health-Monitor 使用其模式识别引擎自动分析故障状态,将日志与历史记录进行比较,并构建交互式的 Markdown Playbook。
```
# 查询活跃事件的模式匹配
sudo health-monitor runbook suggest INC-20260220-123456
# 使用 RCA 数据生成高保真的 troubleshooting runbook
sudo health-monitor runbook generate --incident INC-20260220-123456 --save
```
* **RCA 与历史分析注入**:当编译 Playbook 时,引擎会查询 SQLite 缓存以识别:
* 此特定模式的频率(例如 `postgres_connection_timeout` 发生了 3 次)。
* 哪些操作是有效的,哪些可以改进,以及在以前成功恢复中执行的确切命令配置。
### 3. 自动化运行手册与 Playbook
Health-Monitor 使用其模式识别引擎自动分析故障状态,将日志与历史记录进行比较,并构建交互式的 Markdown Playbook。
```
# 查询活跃事件的模式匹配
sudo health-monitor runbook suggest INC-20260220-123456
# 使用 RCA 数据生成高保真的 troubleshooting runbook
sudo health-monitor runbook generate --incident INC-20260220-123456 --save
```
* **RCA 与历史分析注入**:当编译 Playbook 时,引擎会查询 SQLite 缓存以识别:
* 此特定模式的频率(例如 `postgres_connection_timeout` 发生了 3 次)。
* 哪些操作是有效的,哪些可以改进,以及在以前成功恢复中执行的确切命令配置。
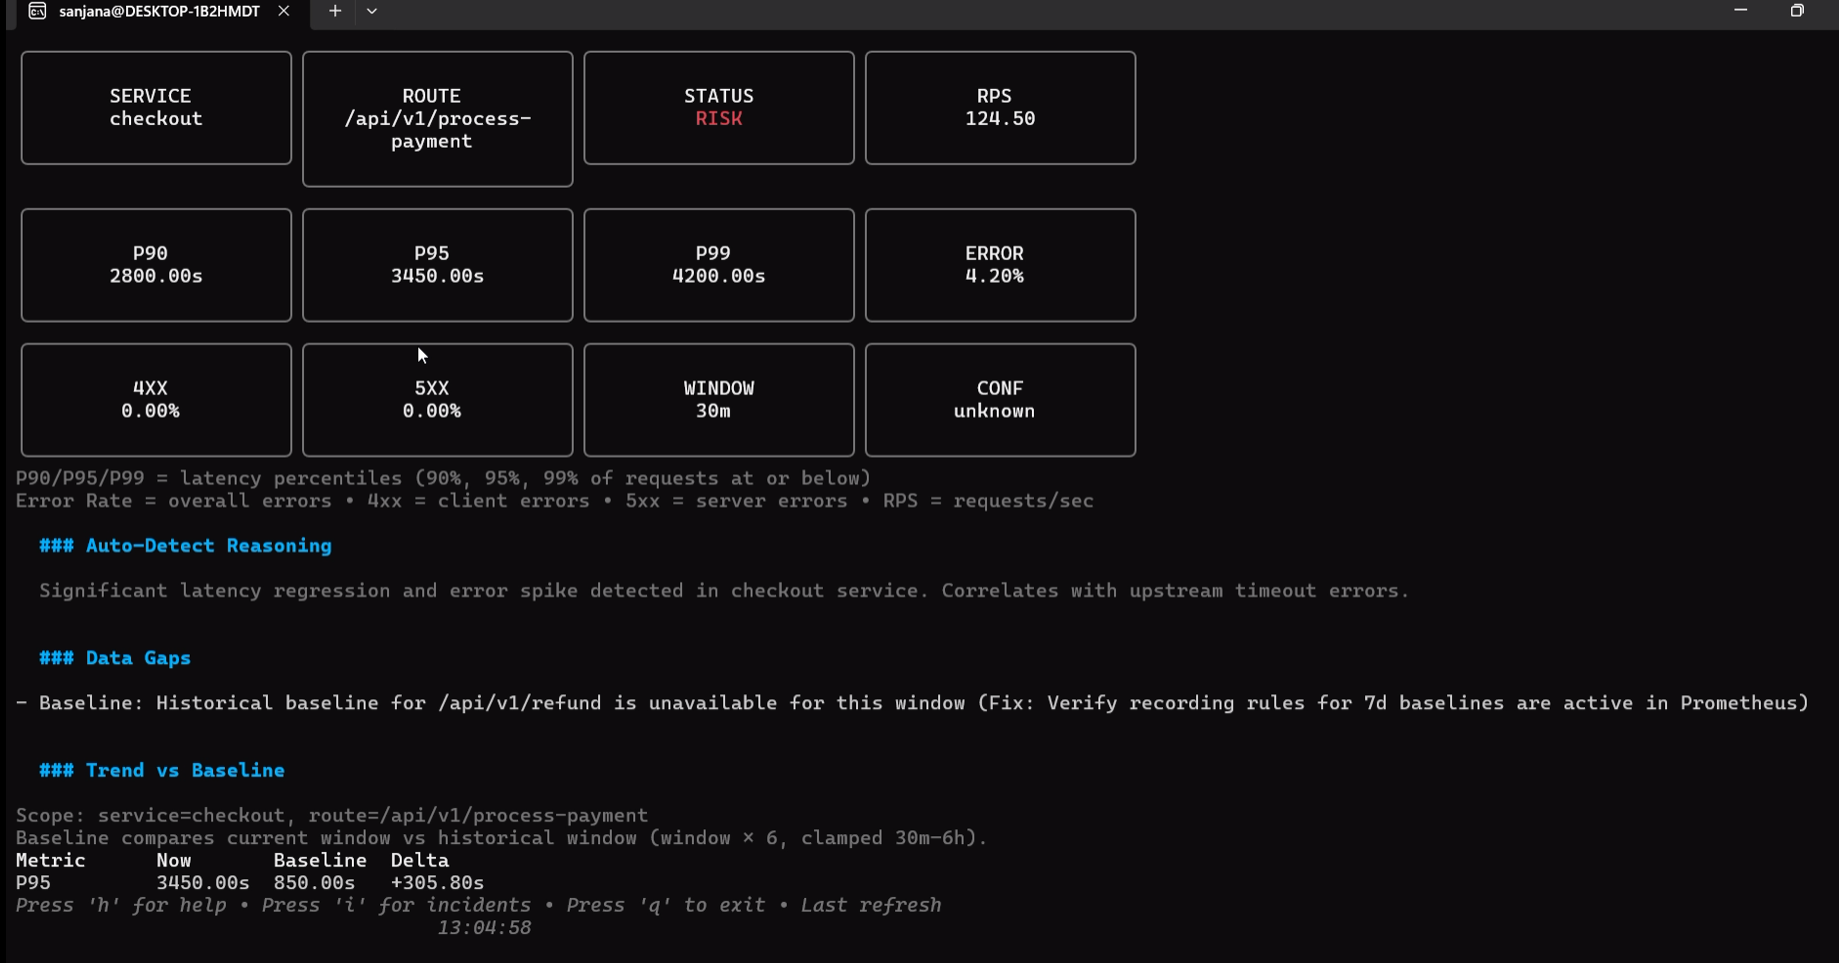
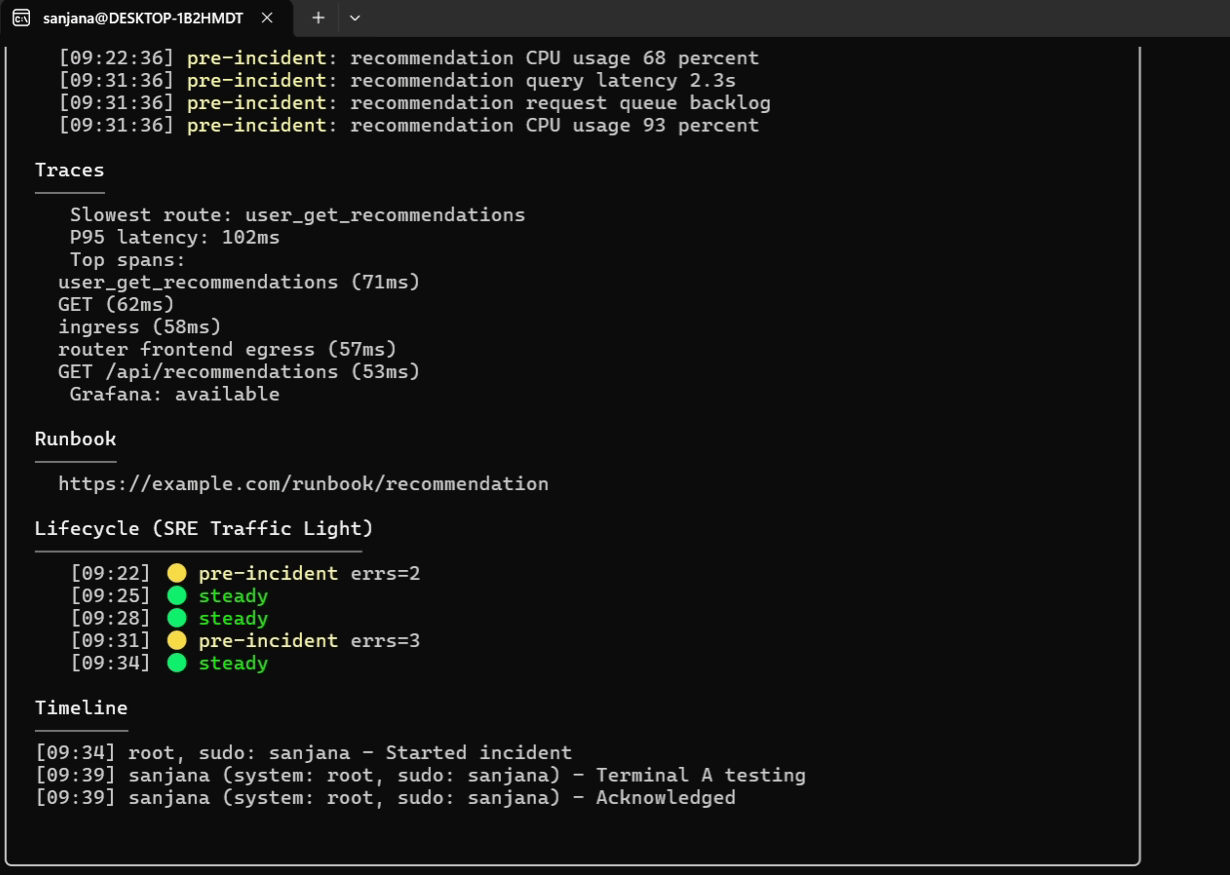
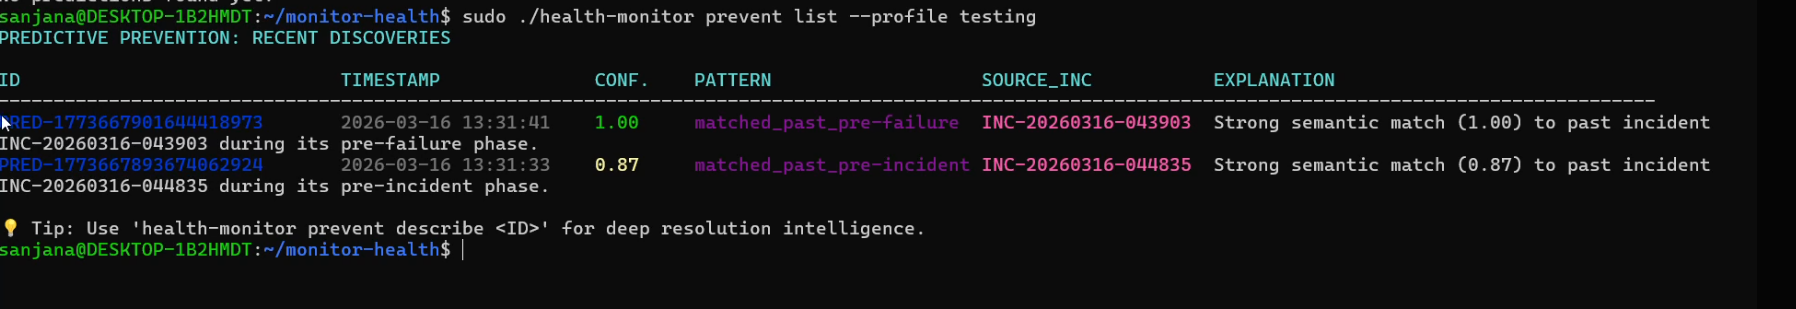
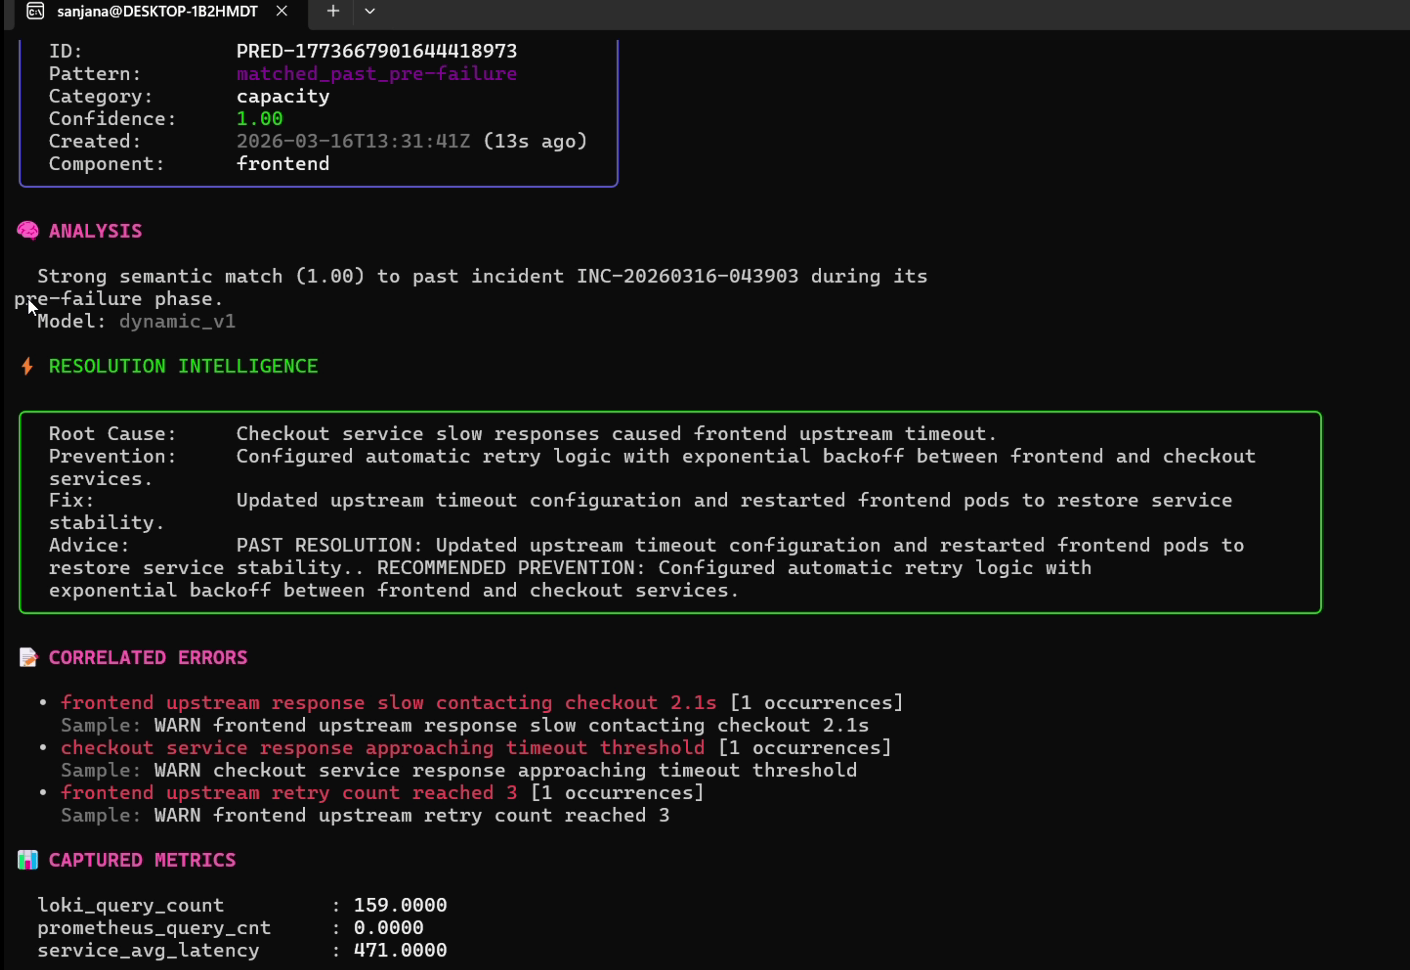
 ### 4. ML 预测性异常预防
`prevent` CLI 控制着一个高度优化的后台守护进程,该守护进程将实时指标漂移和 Loki 错误模式与历史事件特征进行映射比对。
```
# 启动每 5 秒触发一次的预测性预防守护进程
sudo ./health-monitor prevent start --profile production --interval 5s --background
# 启动守护进程并在启动时进行历史数据回填
sudo ./health-monitor prevent start --profile production --backfill 15m --background
# 列出主动检测到的预测和置信度分数
health-monitor prevent list --profile production
# 描述预测的根本原因和建议操作
health-monitor prevent describe PRED-123456789
```
### 4. ML 预测性异常预防
`prevent` CLI 控制着一个高度优化的后台守护进程,该守护进程将实时指标漂移和 Loki 错误模式与历史事件特征进行映射比对。
```
# 启动每 5 秒触发一次的预测性预防守护进程
sudo ./health-monitor prevent start --profile production --interval 5s --background
# 启动守护进程并在启动时进行历史数据回填
sudo ./health-monitor prevent start --profile production --backfill 15m --background
# 列出主动检测到的预测和置信度分数
health-monitor prevent list --profile production
# 描述预测的根本原因和建议操作
health-monitor prevent describe PRED-123456789
```
 ### 5. 多用户协作 SSH 隧道
在关键停机期间,使用内嵌的 SSH 层直接在您的服务器上托管实时、终端原生的协作会话。
```
# 在端口 9022 上启动协作式事件分流会话
sudo health-monitor incident view --tui --collaborative --ssh-port 9022 --id INC-20260220-123456
```
* **加入令牌安全模型**:为防止未经授权的访问,服务器在初始化时会生成一个加密安全的 12 位字符 **加入令牌 (Join Token)**。通过标准 SSH 加入的远程 SRE 必须通过安全的终端提示提供此令牌:
`ssh guest@server-ip -p 9022`
* **NAT 穿透模式**:
* *直接连接*:标准的公网 IP。
* *反向 SSH 隧道(位于 NAT 之后)*:主机发起一个出站反向连接:`ssh -R 9022:localhost:9022 remote-user@bastion-host`。远程访客通过 localhost 连接:`ssh localhost -p 9022`。
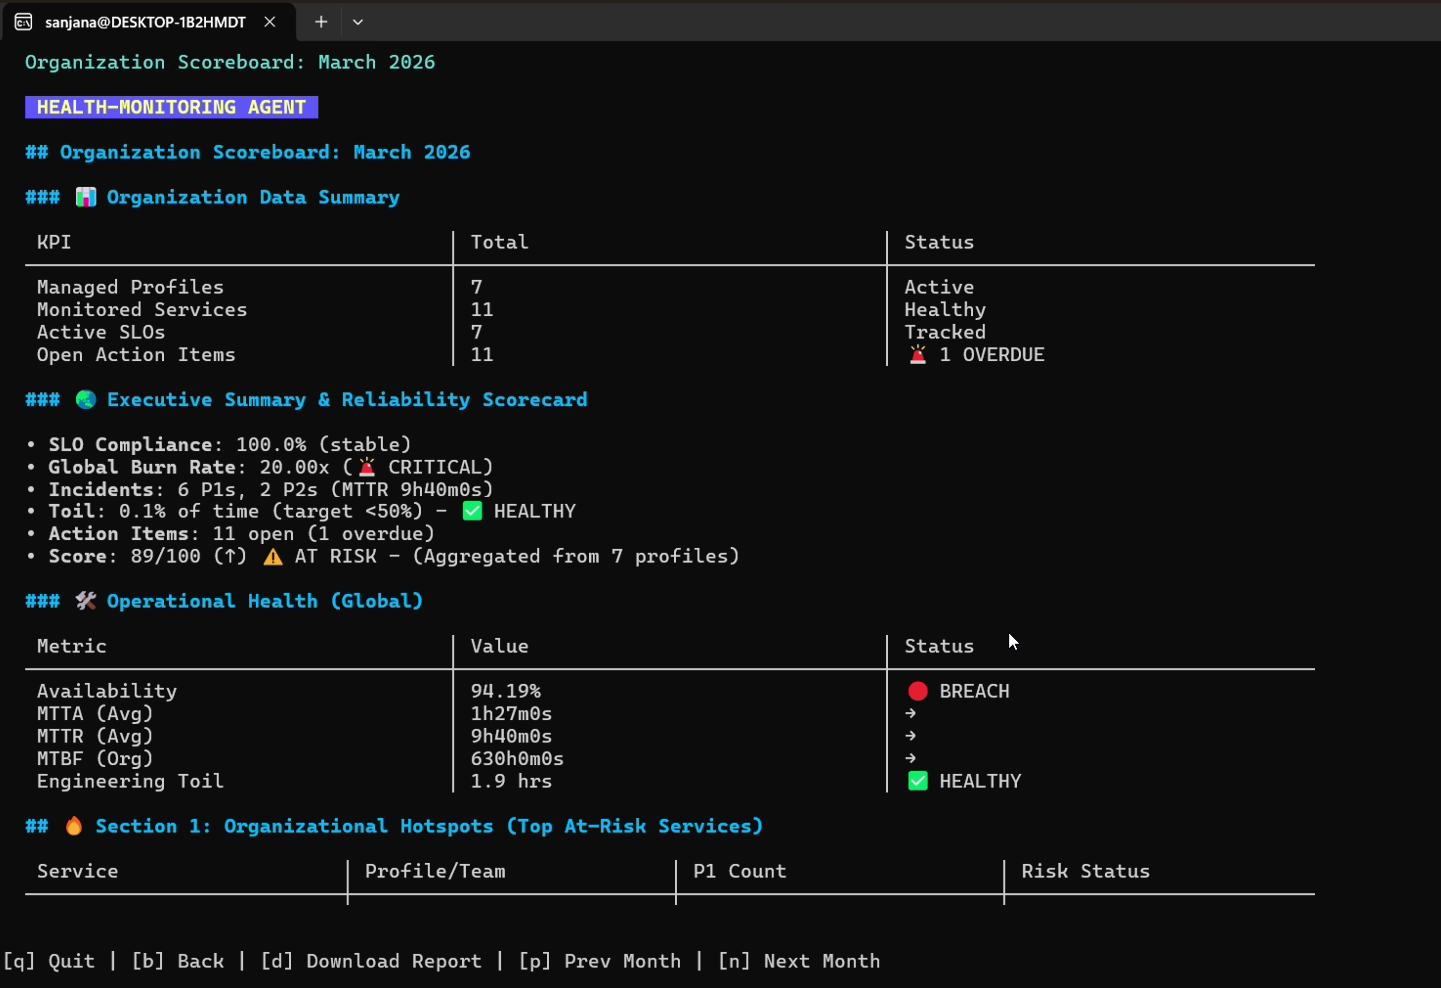
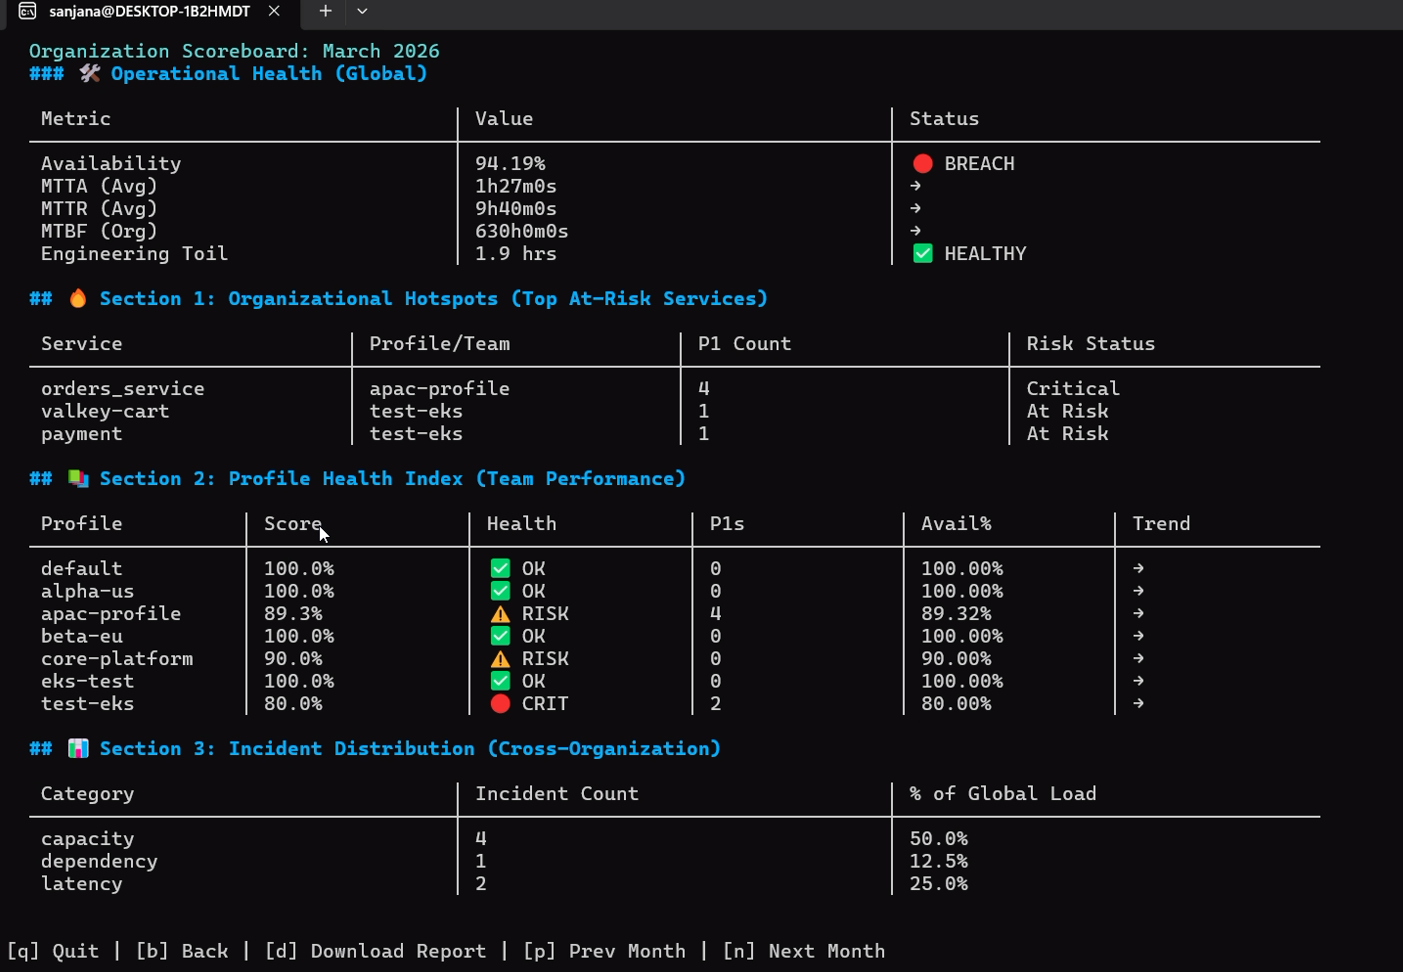
### 6. 可靠性记分卡与组织聚合器
```
# 为当前 profile 启动交互式 scorecard TUI
sudo health-monitor scorecard
# 全新:聚合的组织级可靠性计分板
sudo health-monitor scorecard --org --env prod
```
* **服务密度加权健康评分**:计算一个全局指数,其中具有高服务密度的团队将获得更高的权重:
$$\text{Global Health} = \frac{\sum (\text{Profile Score} \times \text{Service Count})}{\text{Total Organizational Services}}$$
* **错误预算燃烧率**:聚合整个机群的燃烧率指数:
$$\text{Global Burn Rate} = \text{Avg}\left(\frac{100 - \text{Availability}}{100 - \text{SLO Target}}\right)$$
### 7. 交互式引导浏览与 SRE 培训系统
新手 SRE 可以直接在模拟级联中断的独立沙盒种子环境中学习标准的系统操作流程。
```
# 启动交互式 Guided Tour CLI 控制台
health-monitor guide
```
* **交互式 SRE 实验室**:
* `Label Mystery Lab`:种子程序注入指标标签漂移(例如 Prometheus 标签从 `service` 变为 `app`),培训指南会提示操作员使用内部配置检查器进行调试。
* `Cascading Failure Lab`:在支付依赖项中植入延迟触发器,引导操作员完成下游链路追踪。
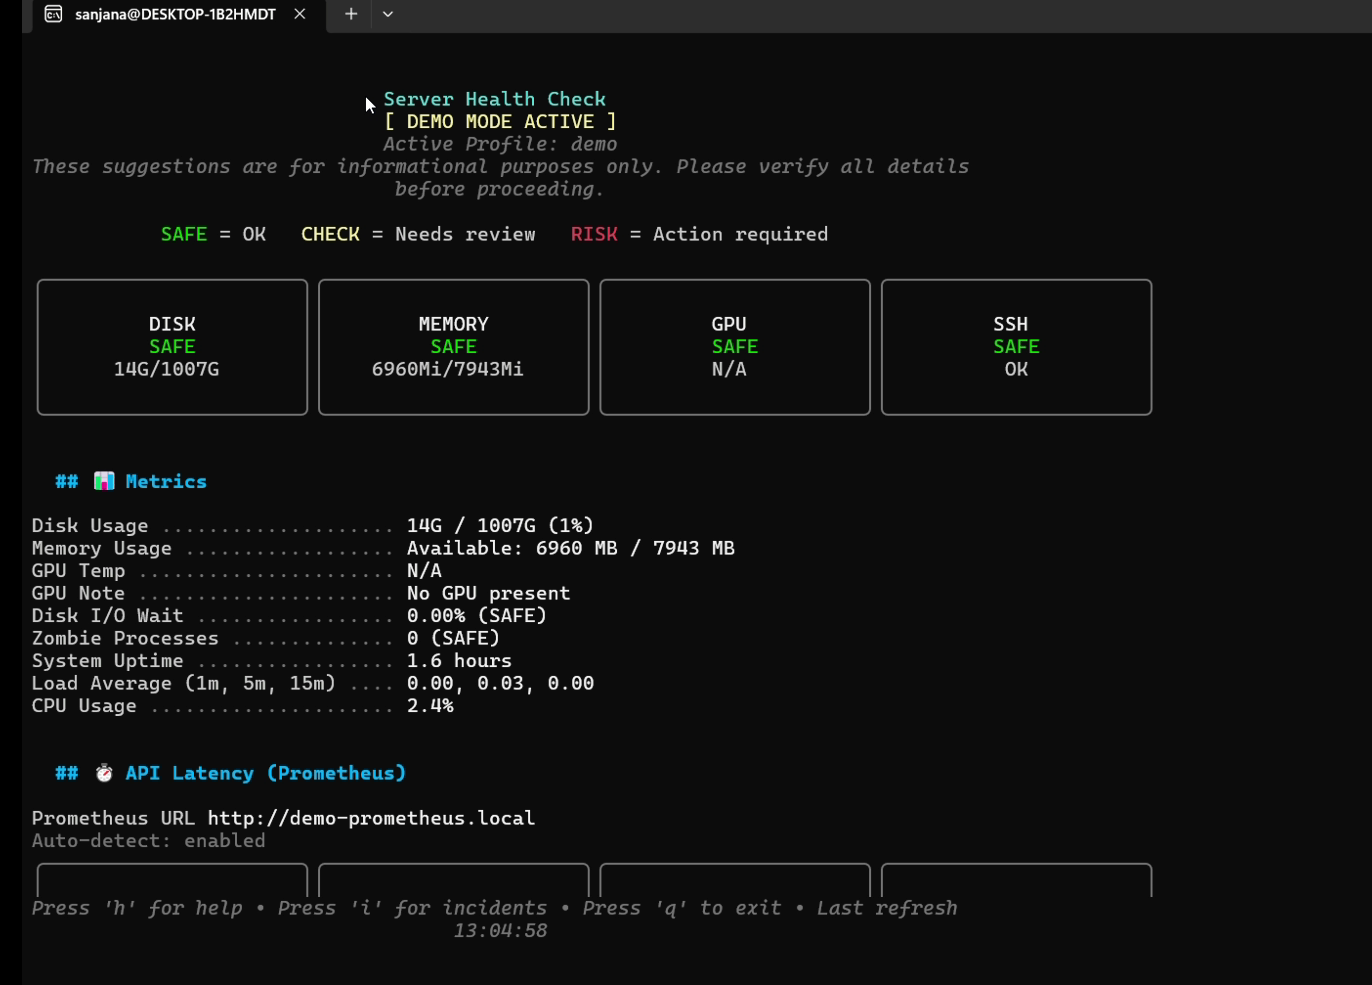
## 🛠️ 沙盒演示模式
Health-Monitor 具有一个隔离的、零依赖的沙盒 `demo` 模式,旨在无需任何活动遥测后端的情况下展示所有功能(TUI 仪表板、事件 RCA、ML 预测描述、HTML 导出)。
```
# 启动填充了演示数据的完全交互式 TUI
health-monitor demo
# 输出静态 CLI dashboard 摘要(非常适合脚本/headless 环境)
health-monitor demo --force-cli
```
## 🔧 生产部署指南
为了获得最佳的可靠性和全系统追踪能力,应使用 `sudo` 权限将 Health-Monitor 代理部署为系统级后台守护进程。
### 系统目录布局
* **配置路径**:`/etc/health-monitor/profiles/*.yaml`
* **状态与事件存储**:`/var/lib/health-monitor/state/`
* **机密目录**:`/etc/health-monitor/`(必须设置为 `0600` 权限)
### Systemd 服务配置
在 `/etc/systemd/system/health-monitor.service` 处创建服务描述符:
```
[Unit]
Description=Health-Monitor Observability & Alerting Daemon
After=network.target
[Service]
Type=simple
User=root
WorkingDirectory=/var/lib/health-monitor
ExecStart=/usr/local/bin/health-monitor alert listen --port 8080 --auth-token /etc/health-monitor/webhook.token
Restart=always
RestartSec=5s
StandardOutput=journal
StandardError=journal
[Install]
WantedBy=multi-user.target
```
应用并激活:
```
sudo systemctl daemon-reload
sudo systemctl enable health-monitor
sudo systemctl start health-monitor
sudo systemctl status health-monitor
```
## 🔒 安全与合规模型
1. **隔离的机密文件**:基本身份验证凭据和 Bearer Token 存储在专用的 `0600` 权限配置文件中,与主要的环境声明隔离开来。
2. **SHA-256 哈希标识符**:`/feedback` TUI 会自动对用户指标进行匿名化处理,在出站网络提交之前生成安全哈希的机器 ID。
3. **严格的 Webhook Token 认证**:传入的 Prometheus/Grafana 告警 payload 受到强制性的基于 Token 的请求身份验证保护。
## 👨💻 开发者与贡献者指南
在 git 提交之前,请验证本地构建、编译脚本并运行测试套件:
```
# 1. 验证 Go module 完整性
go mod tidy
go mod verify
# 2. 运行 profile 集成测试
go test -v ./test/...
# 3. 执行诊断验证脚本
./final_build_test.sh
```
## 📄 许可证
专有版权 - 由 Sanjana Mahajan 和 Sofueled Systems 团队倾注 🧡 开发。保留所有权利。
### 5. 多用户协作 SSH 隧道
在关键停机期间,使用内嵌的 SSH 层直接在您的服务器上托管实时、终端原生的协作会话。
```
# 在端口 9022 上启动协作式事件分流会话
sudo health-monitor incident view --tui --collaborative --ssh-port 9022 --id INC-20260220-123456
```
* **加入令牌安全模型**:为防止未经授权的访问,服务器在初始化时会生成一个加密安全的 12 位字符 **加入令牌 (Join Token)**。通过标准 SSH 加入的远程 SRE 必须通过安全的终端提示提供此令牌:
`ssh guest@server-ip -p 9022`
* **NAT 穿透模式**:
* *直接连接*:标准的公网 IP。
* *反向 SSH 隧道(位于 NAT 之后)*:主机发起一个出站反向连接:`ssh -R 9022:localhost:9022 remote-user@bastion-host`。远程访客通过 localhost 连接:`ssh localhost -p 9022`。
### 6. 可靠性记分卡与组织聚合器
```
# 为当前 profile 启动交互式 scorecard TUI
sudo health-monitor scorecard
# 全新:聚合的组织级可靠性计分板
sudo health-monitor scorecard --org --env prod
```
* **服务密度加权健康评分**:计算一个全局指数,其中具有高服务密度的团队将获得更高的权重:
$$\text{Global Health} = \frac{\sum (\text{Profile Score} \times \text{Service Count})}{\text{Total Organizational Services}}$$
* **错误预算燃烧率**:聚合整个机群的燃烧率指数:
$$\text{Global Burn Rate} = \text{Avg}\left(\frac{100 - \text{Availability}}{100 - \text{SLO Target}}\right)$$
### 7. 交互式引导浏览与 SRE 培训系统
新手 SRE 可以直接在模拟级联中断的独立沙盒种子环境中学习标准的系统操作流程。
```
# 启动交互式 Guided Tour CLI 控制台
health-monitor guide
```
* **交互式 SRE 实验室**:
* `Label Mystery Lab`:种子程序注入指标标签漂移(例如 Prometheus 标签从 `service` 变为 `app`),培训指南会提示操作员使用内部配置检查器进行调试。
* `Cascading Failure Lab`:在支付依赖项中植入延迟触发器,引导操作员完成下游链路追踪。
## 🛠️ 沙盒演示模式
Health-Monitor 具有一个隔离的、零依赖的沙盒 `demo` 模式,旨在无需任何活动遥测后端的情况下展示所有功能(TUI 仪表板、事件 RCA、ML 预测描述、HTML 导出)。
```
# 启动填充了演示数据的完全交互式 TUI
health-monitor demo
# 输出静态 CLI dashboard 摘要(非常适合脚本/headless 环境)
health-monitor demo --force-cli
```
## 🔧 生产部署指南
为了获得最佳的可靠性和全系统追踪能力,应使用 `sudo` 权限将 Health-Monitor 代理部署为系统级后台守护进程。
### 系统目录布局
* **配置路径**:`/etc/health-monitor/profiles/*.yaml`
* **状态与事件存储**:`/var/lib/health-monitor/state/`
* **机密目录**:`/etc/health-monitor/`(必须设置为 `0600` 权限)
### Systemd 服务配置
在 `/etc/systemd/system/health-monitor.service` 处创建服务描述符:
```
[Unit]
Description=Health-Monitor Observability & Alerting Daemon
After=network.target
[Service]
Type=simple
User=root
WorkingDirectory=/var/lib/health-monitor
ExecStart=/usr/local/bin/health-monitor alert listen --port 8080 --auth-token /etc/health-monitor/webhook.token
Restart=always
RestartSec=5s
StandardOutput=journal
StandardError=journal
[Install]
WantedBy=multi-user.target
```
应用并激活:
```
sudo systemctl daemon-reload
sudo systemctl enable health-monitor
sudo systemctl start health-monitor
sudo systemctl status health-monitor
```
## 🔒 安全与合规模型
1. **隔离的机密文件**:基本身份验证凭据和 Bearer Token 存储在专用的 `0600` 权限配置文件中,与主要的环境声明隔离开来。
2. **SHA-256 哈希标识符**:`/feedback` TUI 会自动对用户指标进行匿名化处理,在出站网络提交之前生成安全哈希的机器 ID。
3. **严格的 Webhook Token 认证**:传入的 Prometheus/Grafana 告警 payload 受到强制性的基于 Token 的请求身份验证保护。
## 👨💻 开发者与贡献者指南
在 git 提交之前,请验证本地构建、编译脚本并运行测试套件:
```
# 1. 验证 Go module 完整性
go mod tidy
go mod verify
# 2. 运行 profile 集成测试
go test -v ./test/...
# 3. 执行诊断验证脚本
./final_build_test.sh
```
## 📄 许可证
专有版权 - 由 Sanjana Mahajan 和 Sofueled Systems 团队倾注 🧡 开发。保留所有权利。
### 2. 事件管理生命周期
管理系统事件,关联诊断、日志事件,并生成 RCA 复盘。
```
# 通过自动 o11y correlation 手动启动事件
sudo health-monitor incident start \
--service billing_api \
--title "Payment Gateway Response Degradation" \
--severity P1 \
--description "95th percentile latency exceeded 2.5s"
# 列出具有活跃状态过滤器的故障事件
health-monitor incident list --state open --profile core-platform
# 执行包含 toil tracking 的交互式 15 字段 RCA Resolution
sudo health-monitor incident resolve \
--id INC-20260220-123456 \
--summary "Database connection pool scale-out complete" \
--root-cause "Connection pool exhaustion under heavy traffic spikes" \
--fix "Increased MaxOpenConns configuration and deployed pgBouncer proxy" \
--category dependency \
--component postgres_db \
--toil-minutes 45 \
--toil-category database_triage \
--downtime 12
# 生成全面的、无指责的 Markdown postmortem 报告
health-monitor incident postmortem --id INC-20260220-123456
```
### 3. 自动化运行手册与 Playbook
Health-Monitor 使用其模式识别引擎自动分析故障状态,将日志与历史记录进行比较,并构建交互式的 Markdown Playbook。
```
# 查询活跃事件的模式匹配
sudo health-monitor runbook suggest INC-20260220-123456
# 使用 RCA 数据生成高保真的 troubleshooting runbook
sudo health-monitor runbook generate --incident INC-20260220-123456 --save
```
* **RCA 与历史分析注入**:当编译 Playbook 时,引擎会查询 SQLite 缓存以识别:
* 此特定模式的频率(例如 `postgres_connection_timeout` 发生了 3 次)。
* 哪些操作是有效的,哪些可以改进,以及在以前成功恢复中执行的确切命令配置。
### 4. ML 预测性异常预防
`prevent` CLI 控制着一个高度优化的后台守护进程,该守护进程将实时指标漂移和 Loki 错误模式与历史事件特征进行映射比对。
```
# 启动每 5 秒触发一次的预测性预防守护进程
sudo ./health-monitor prevent start --profile production --interval 5s --background
# 启动守护进程并在启动时进行历史数据回填
sudo ./health-monitor prevent start --profile production --backfill 15m --background
# 列出主动检测到的预测和置信度分数
health-monitor prevent list --profile production
# 描述预测的根本原因和建议操作
health-monitor prevent describe PRED-123456789
```
### 5. 多用户协作 SSH 隧道
在关键停机期间,使用内嵌的 SSH 层直接在您的服务器上托管实时、终端原生的协作会话。
```
# 在端口 9022 上启动协作式事件分流会话
sudo health-monitor incident view --tui --collaborative --ssh-port 9022 --id INC-20260220-123456
```
* **加入令牌安全模型**:为防止未经授权的访问,服务器在初始化时会生成一个加密安全的 12 位字符 **加入令牌 (Join Token)**。通过标准 SSH 加入的远程 SRE 必须通过安全的终端提示提供此令牌:
`ssh guest@server-ip -p 9022`
* **NAT 穿透模式**:
* *直接连接*:标准的公网 IP。
* *反向 SSH 隧道(位于 NAT 之后)*:主机发起一个出站反向连接:`ssh -R 9022:localhost:9022 remote-user@bastion-host`。远程访客通过 localhost 连接:`ssh localhost -p 9022`。
### 6. 可靠性记分卡与组织聚合器
```
# 为当前 profile 启动交互式 scorecard TUI
sudo health-monitor scorecard
# 全新:聚合的组织级可靠性计分板
sudo health-monitor scorecard --org --env prod
```
* **服务密度加权健康评分**:计算一个全局指数,其中具有高服务密度的团队将获得更高的权重:
$$\text{Global Health} = \frac{\sum (\text{Profile Score} \times \text{Service Count})}{\text{Total Organizational Services}}$$
* **错误预算燃烧率**:聚合整个机群的燃烧率指数:
$$\text{Global Burn Rate} = \text{Avg}\left(\frac{100 - \text{Availability}}{100 - \text{SLO Target}}\right)$$
### 7. 交互式引导浏览与 SRE 培训系统
新手 SRE 可以直接在模拟级联中断的独立沙盒种子环境中学习标准的系统操作流程。
```
# 启动交互式 Guided Tour CLI 控制台
health-monitor guide
```
* **交互式 SRE 实验室**:
* `Label Mystery Lab`:种子程序注入指标标签漂移(例如 Prometheus 标签从 `service` 变为 `app`),培训指南会提示操作员使用内部配置检查器进行调试。
* `Cascading Failure Lab`:在支付依赖项中植入延迟触发器,引导操作员完成下游链路追踪。
## 🛠️ 沙盒演示模式
Health-Monitor 具有一个隔离的、零依赖的沙盒 `demo` 模式,旨在无需任何活动遥测后端的情况下展示所有功能(TUI 仪表板、事件 RCA、ML 预测描述、HTML 导出)。
```
# 启动填充了演示数据的完全交互式 TUI
health-monitor demo
# 输出静态 CLI dashboard 摘要(非常适合脚本/headless 环境)
health-monitor demo --force-cli
```
## 🔧 生产部署指南
为了获得最佳的可靠性和全系统追踪能力,应使用 `sudo` 权限将 Health-Monitor 代理部署为系统级后台守护进程。
### 系统目录布局
* **配置路径**:`/etc/health-monitor/profiles/*.yaml`
* **状态与事件存储**:`/var/lib/health-monitor/state/`
* **机密目录**:`/etc/health-monitor/`(必须设置为 `0600` 权限)
### Systemd 服务配置
在 `/etc/systemd/system/health-monitor.service` 处创建服务描述符:
```
[Unit]
Description=Health-Monitor Observability & Alerting Daemon
After=network.target
[Service]
Type=simple
User=root
WorkingDirectory=/var/lib/health-monitor
ExecStart=/usr/local/bin/health-monitor alert listen --port 8080 --auth-token /etc/health-monitor/webhook.token
Restart=always
RestartSec=5s
StandardOutput=journal
StandardError=journal
[Install]
WantedBy=multi-user.target
```
应用并激活:
```
sudo systemctl daemon-reload
sudo systemctl enable health-monitor
sudo systemctl start health-monitor
sudo systemctl status health-monitor
```
## 🔒 安全与合规模型
1. **隔离的机密文件**:基本身份验证凭据和 Bearer Token 存储在专用的 `0600` 权限配置文件中,与主要的环境声明隔离开来。
2. **SHA-256 哈希标识符**:`/feedback` TUI 会自动对用户指标进行匿名化处理,在出站网络提交之前生成安全哈希的机器 ID。
3. **严格的 Webhook Token 认证**:传入的 Prometheus/Grafana 告警 payload 受到强制性的基于 Token 的请求身份验证保护。
## 👨💻 开发者与贡献者指南
在 git 提交之前,请验证本地构建、编译脚本并运行测试套件:
```
# 1. 验证 Go module 完整性
go mod tidy
go mod verify
# 2. 运行 profile 集成测试
go test -v ./test/...
# 3. 执行诊断验证脚本
./final_build_test.sh
```
## 📄 许可证
专有版权 - 由 Sanjana Mahajan 和 Sofueled Systems 团队倾注 🧡 开发。保留所有权利。标签:API集成, EVTX分析, Go, Ruby工具, SRE, TUI, 偏差过滤, 可观测性, 告警自动化, 子域名突变, 日志审计, 自定义请求头, 请求拦截, 运维监控