BabylonFushi/Sindian-Dataset
GitHub: BabylonFushi/Sindian-Dataset
基于 UCI 台湾新店房地产数据集构建的端到端监督学习回归 pipeline,预测住宅单位面积价格并进行地理空间误差分析。
Stars: 1 | Forks: 0
# 房地产价格预测 — 台湾新店
这是一个完整的端到端 Machine Learning pipeline,旨在使用 [UCI 房地产估值数据集](https://archive.ics.uci.edu/dataset/477/real+estate+valuation+data+set) 预测台湾新北市新店区住宅房产的单位面积价格(NTD/ping)。
## 文件
- [Notebook](https://nbviewer.org/github/BabylonFushi/Sindian-Dataset/blob/main/.ipynb)
- [演示文稿](https://canva.link/jdzyqvy05zdhny8)
## 项目概述
目标是构建一个稳健的回归模型,利用空间和结构特征预测房价,并从地理空间角度分析预测误差,以发现模型可能未捕捉到的模式。
该 pipeline 包含:
- 直接从 UCI 仓库加载数据
- 探索性数据分析 (EDA) 和特征分布
- 使用 Mahalanobis 距离和 Isolation Forest 进行异常值检测
- 使用 VIF 进行多重共线性分析
- 使用 Scikit-learn Pipelines 进行特征工程和预处理
- 通过 k-fold 交叉验证对多个监督模型进行比较评估
- 使用 GridSearchCV 进行超参数调优的 Ensemble (VotingRegressor)
- 使用 Folium 交互式地图进行地理空间残差分析
- 使用 DBSCAN 和 KMeans 进行空间聚类
## 结果
| 模型 | R² (测试集) | MAE (测试集) | RMSE (测试集) | MAPE (测试集) |
|---|---|---|---|---|
| Linear Regression | 0.6546 | 5.76 | 7.86 | 15.51% |
| Random Forest | 0.6698 | 5.88 | 7.68 | 15.24% |
| Gradient Boosting | 0.7083 | 5.51 | 7.22 | 14.15% |
| SVR | 0.6587 | 5.67 | 7.81 | 15.55% |
| **Ensemble (Voting)** | **0.7122** | **5.32** | **7.17** | **14.24%** |
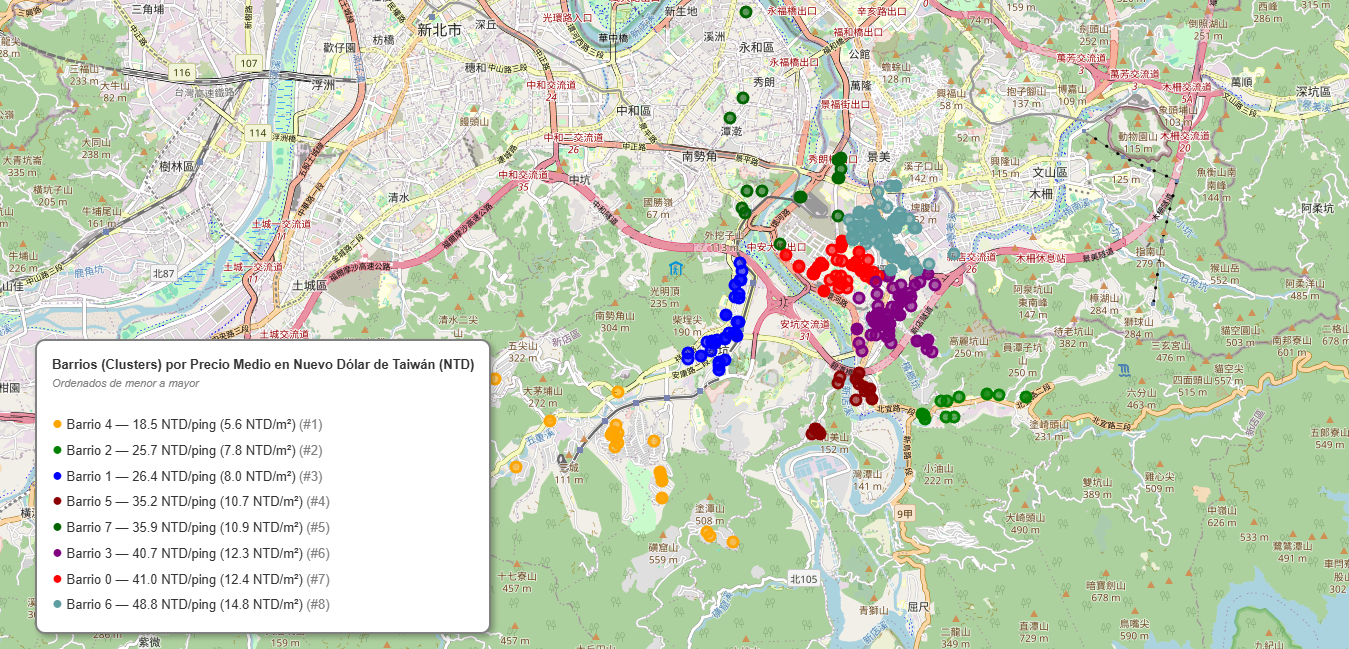
## 空间聚类地图
数据集中的房产使用 DBSCAN 和 KMeans 进行地理聚类,以识别区域内的自然分组。通过交互式地图,可以探索空间聚类与价格范围以及距离 MRT 车站远近之间的关系。
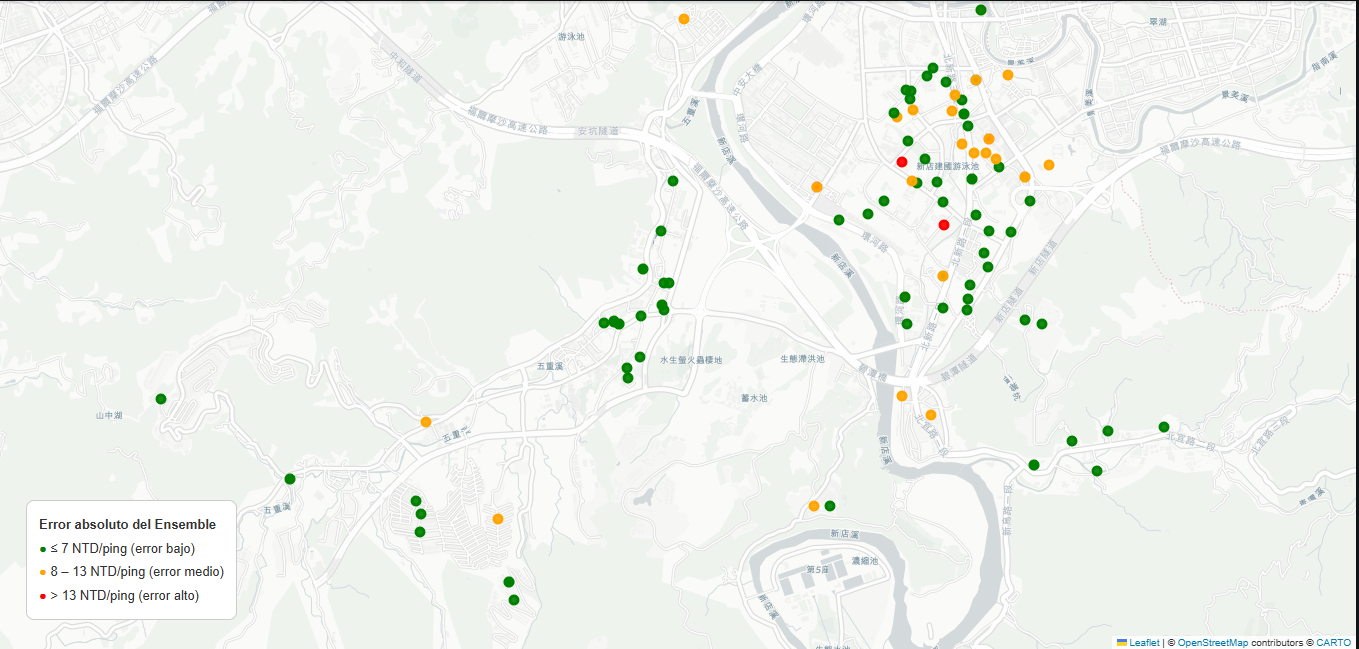
## 地理空间残差地图
地图上的每个点代表测试集中的一处房产。颜色表示绝对预测误差:
- **绿色**:误差 <= 7 NTD/ping
- **橙色**:误差 8–13 NTD/ping
- **红色**:误差 > 13 NTD/ping
## 数据集
**UCI 房地产估值** — 台湾新北市新店区 (2012–2013)
| 特征 | 描述 |
|---|---|
| 交易日期 | 销售年份(小数格式) |
| 房屋年龄 | 房产年龄(年) |
| 距 MRT 距离 | 距最近地铁站的距离(米) |
| 商店数量 | 附近的便利店数量 |
| 纬度 / 经度 | 地理坐标 |
| **房屋单位面积价格** | 目标变量 (NTD/ping) |
共 414 条记录,全部为数值型,无缺失值。
## 技术栈
Python 3.12 — Pandas, NumPy, Scikit-learn, SciPy, Statsmodels, Folium, Matplotlib, Seaborn
## 文件
| 文件 | 描述 |
|---|---|
| `notebook.ipynb` | 包含 Markdown 注释的完整 pipeline |
| `mapa_residuos_ensemble.html` | 交互式地理空间残差地图 |
| `mapa_clusters.html` | 交互式空间聚类地图 |
| `requirements.txt` | Python 依赖项 |
## 作者
Rafael Sanchez Clavijo — [rasancla2001new@gmail.com](mailto:rasancla2001new@gmail.com)
[LinkedIn](https://www.linkedin.com/in/rafael-sanchez-clavijo-3a75a6365) · [GitHub](https://github.com/BabylonFushi)
标签:Apex, 回归分析, 房价预测, 数据科学, 机器学习, 特征工程, 空间数据分析, 资源验证, 逆向工具