shrouqobaid/CyberSentinel-Splunk
GitHub: shrouqobaid/CyberSentinel-Splunk
基于 Splunk 的 SOC 安全调查项目,提供自动化暴力破解检测、自定义仪表盘和事件响应工作流。
Stars: 1 | Forks: 0
# CyberSentinel:Splunk 安全分析





# CyberSentinel 架构
```
+-------------------+
| Log Sources |
| Windows / Sysmon |
+---------+---------+
|
v
+-------------------+
| Splunk SIEM |
| Indexing & Search |
+---------+---------+
|
+-----------+-----------+
| |
v v
+---------------+ +------------------+
| SPL Detection | | SOC Dashboard |
| Correlation | | Visualization |
+-------+-------+ +--------+---------+
| |
+-----------+-----------+
|
v
+-------------------+
| Alerting Workflow |
| Incident Response |
+-------------------+
```
# 调查场景
该项目旨在将原始日志转化为 Actionable Threat Intelligence,通过:
* **Detection Engineering**
* **Log Analysis**
* **Threat Hunting**
* **SOC Monitoring**
* **Alerting & Response**
# 第一阶段:Recon & Data Ingestion
我开始配置分析环境,并确保 Splunk 内的 Log Ingestion 过程顺畅,以保证调查期间没有任何 Blind Spots。
## 环境设置与源分析
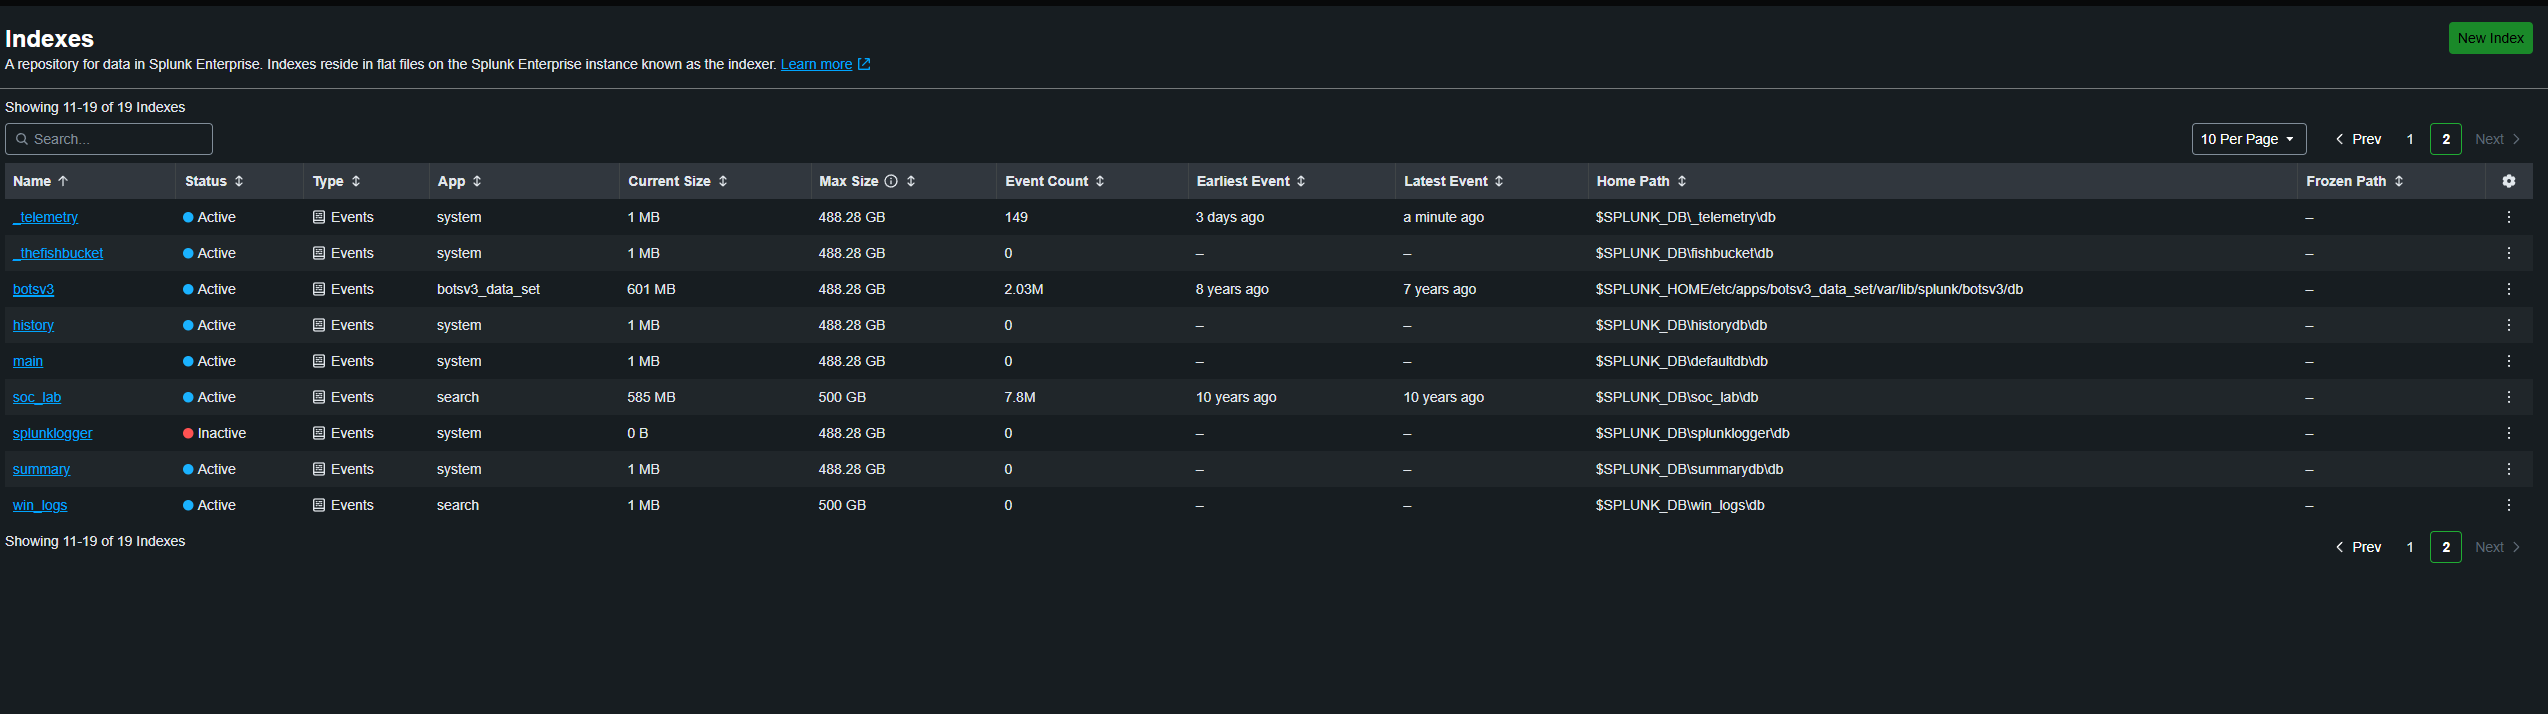
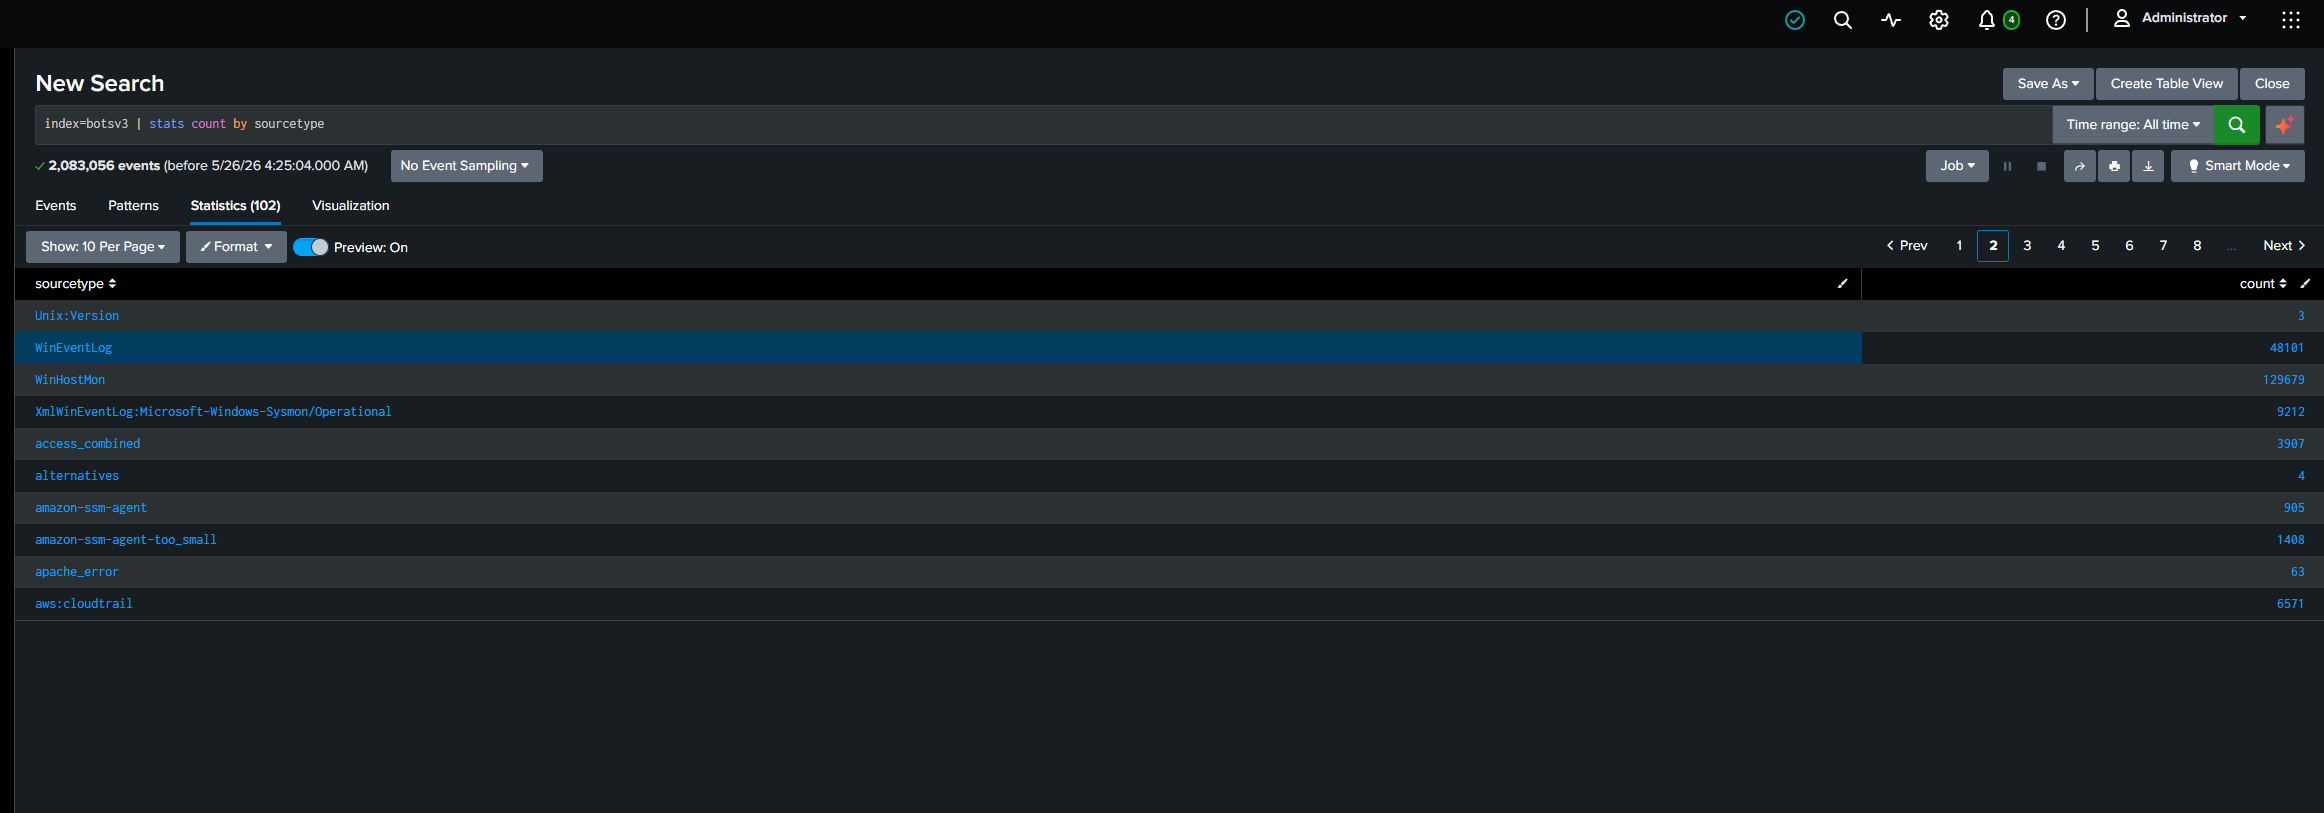
分析数据源并确保日志正确流入 Indexes。
## 摄入监控
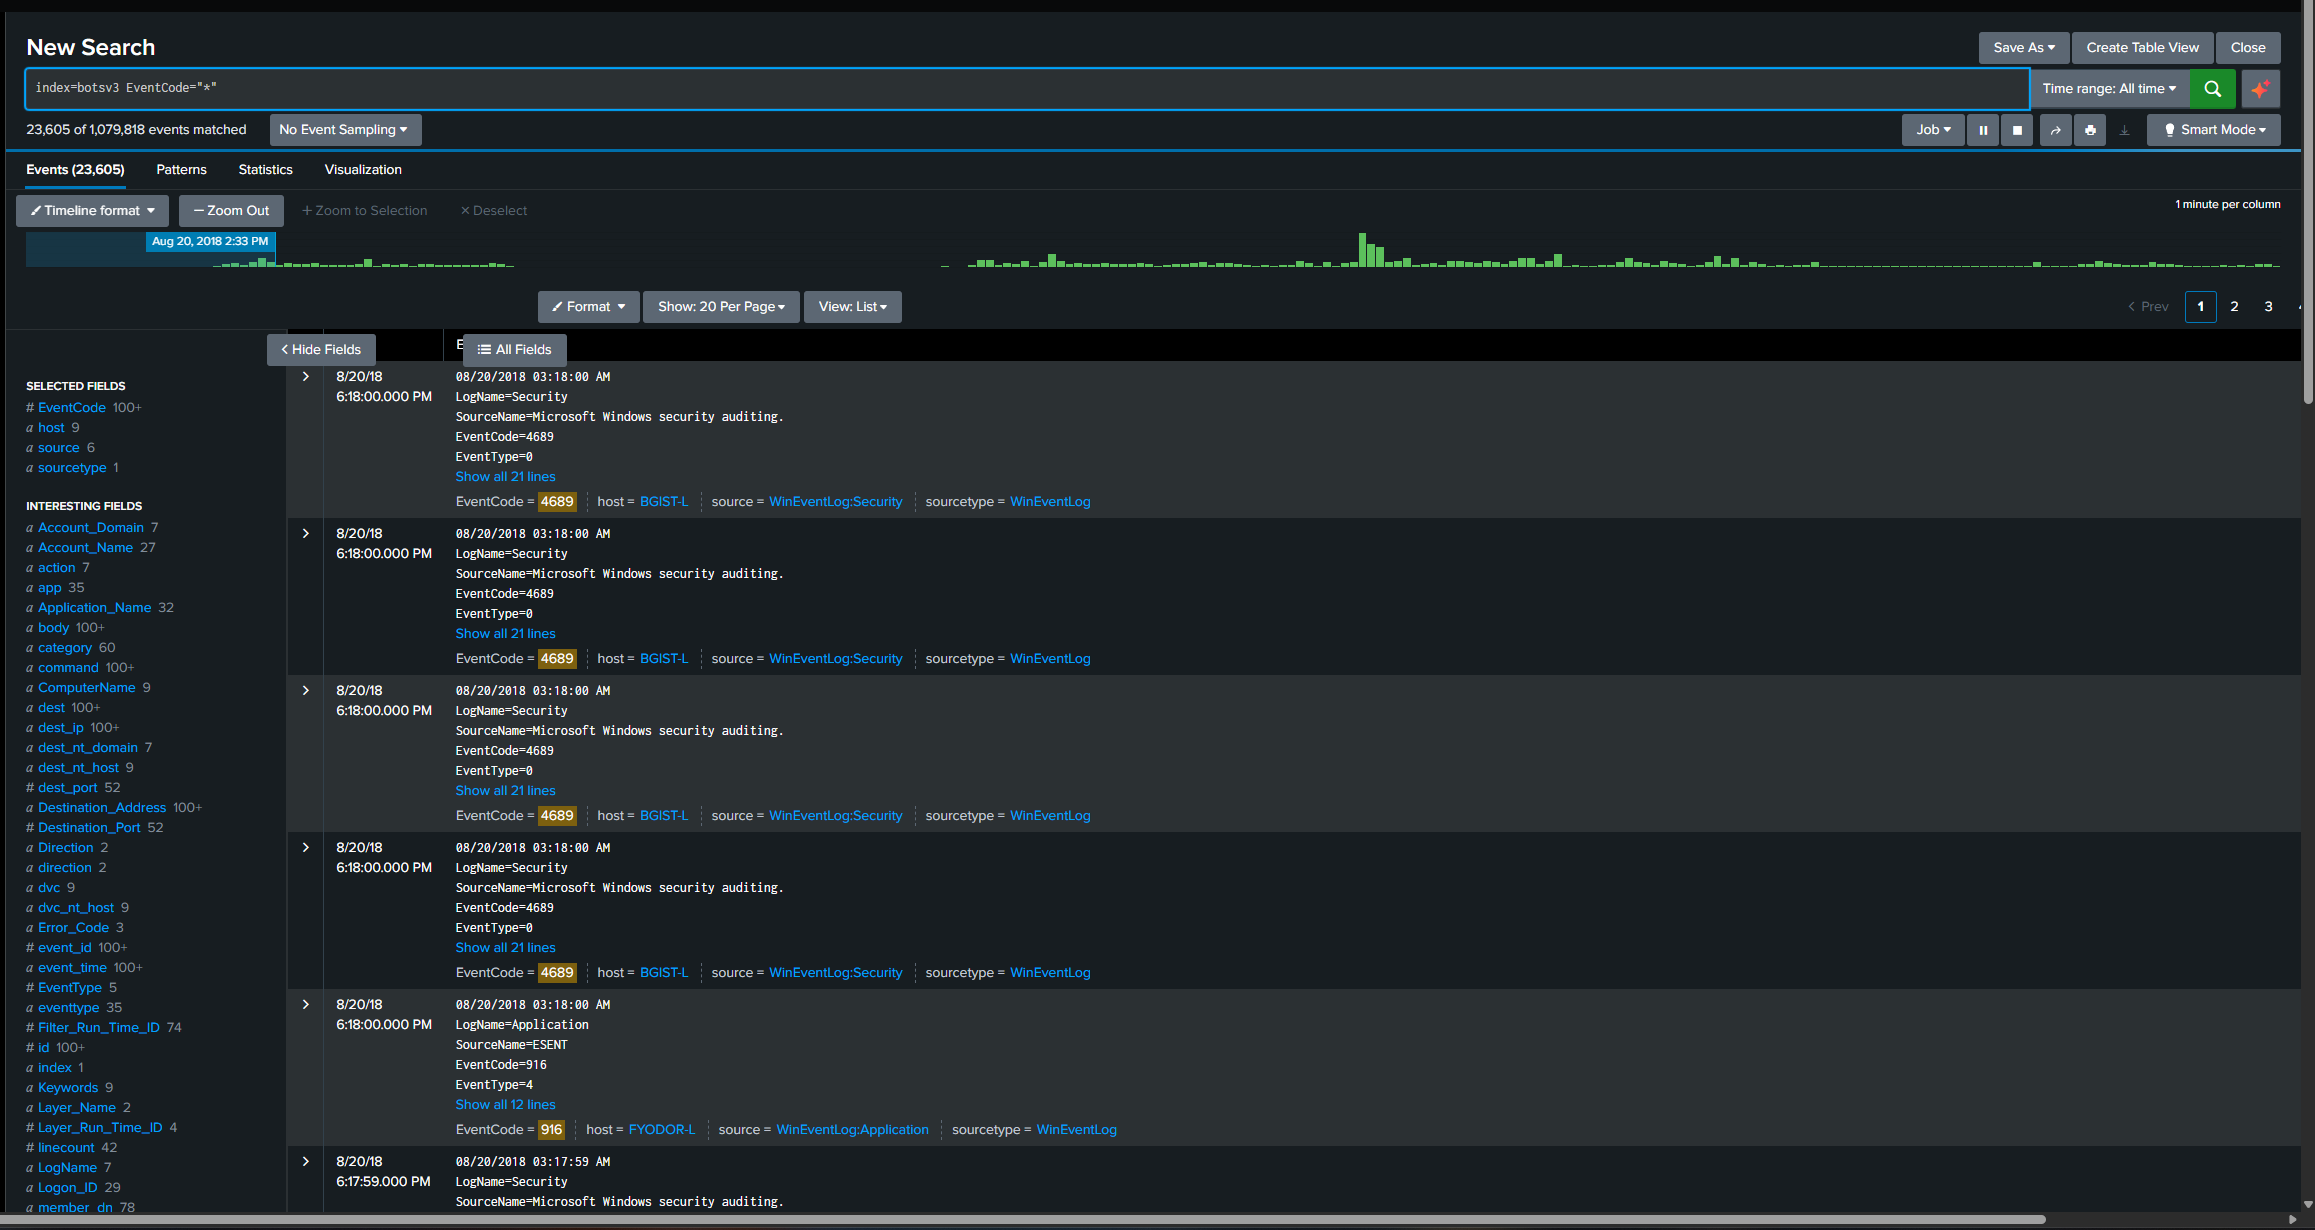
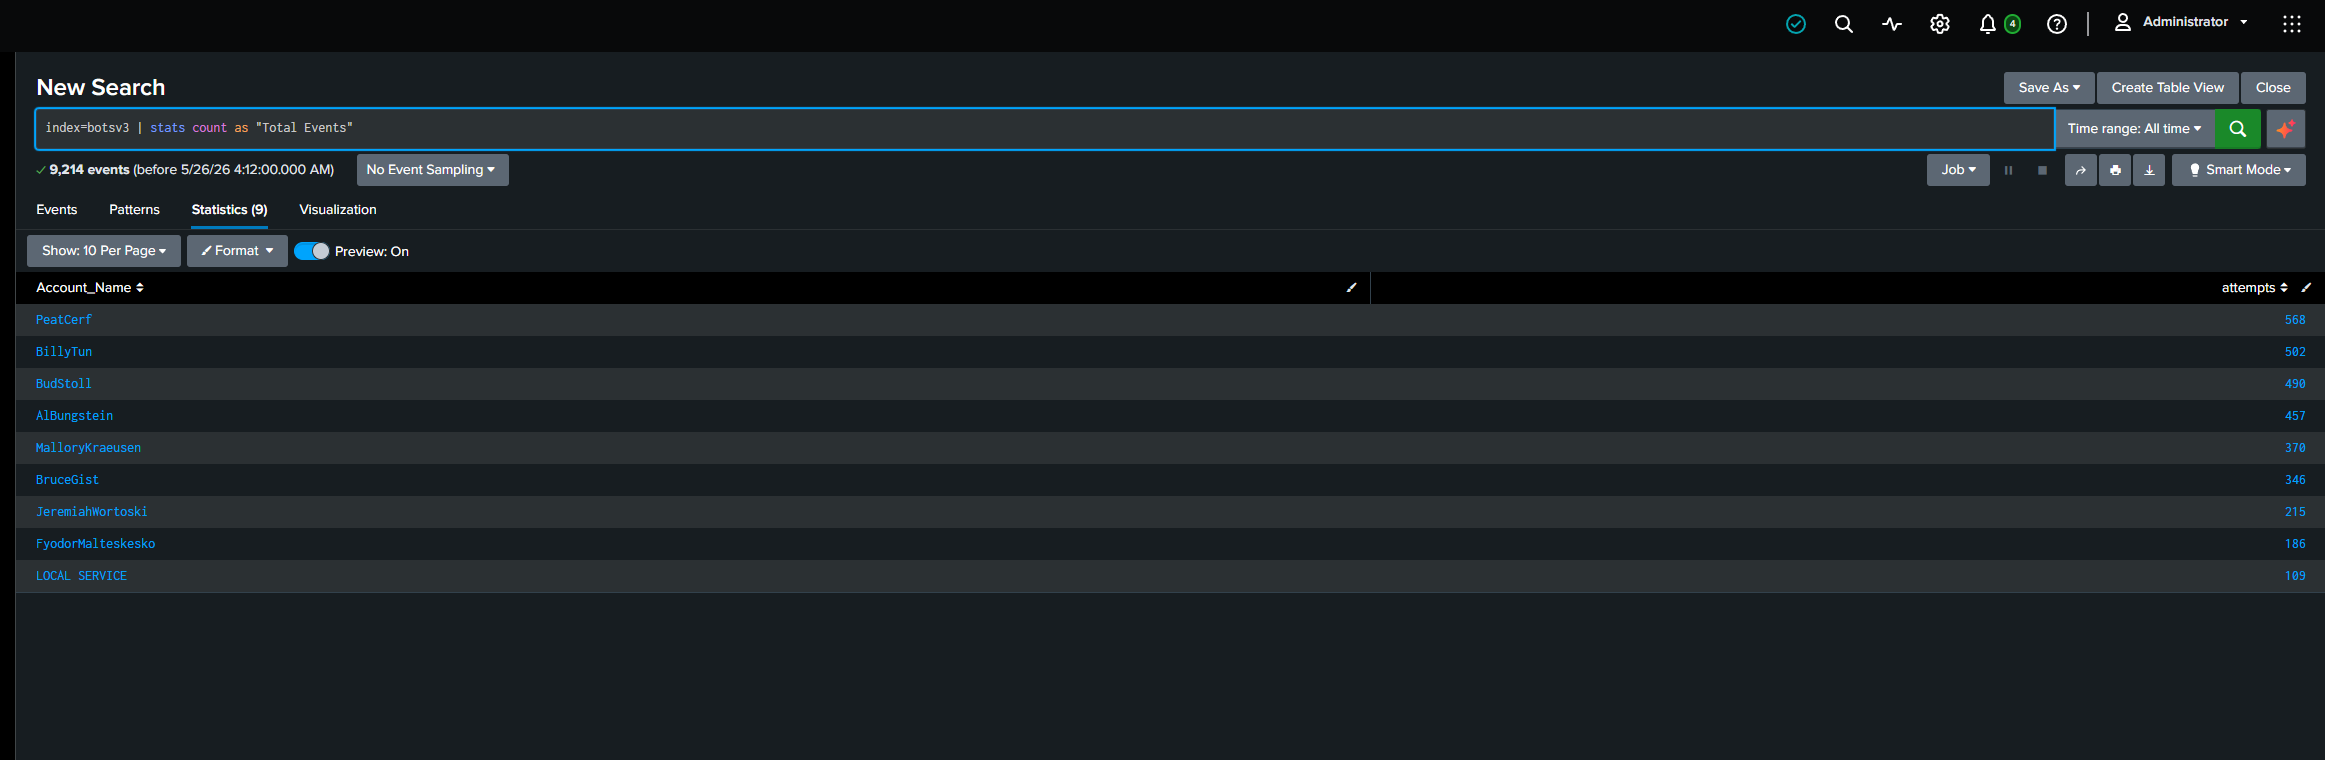
检查数据流的稳定性,并监控安全环境中的日志量。
# 第二阶段:Threat Hunting & SPL Detection
使用 SPL (Search Processing Language) 将日志转化为清晰的指标,以揭示攻击者的行为。
## 日志检查与失败身份验证分析
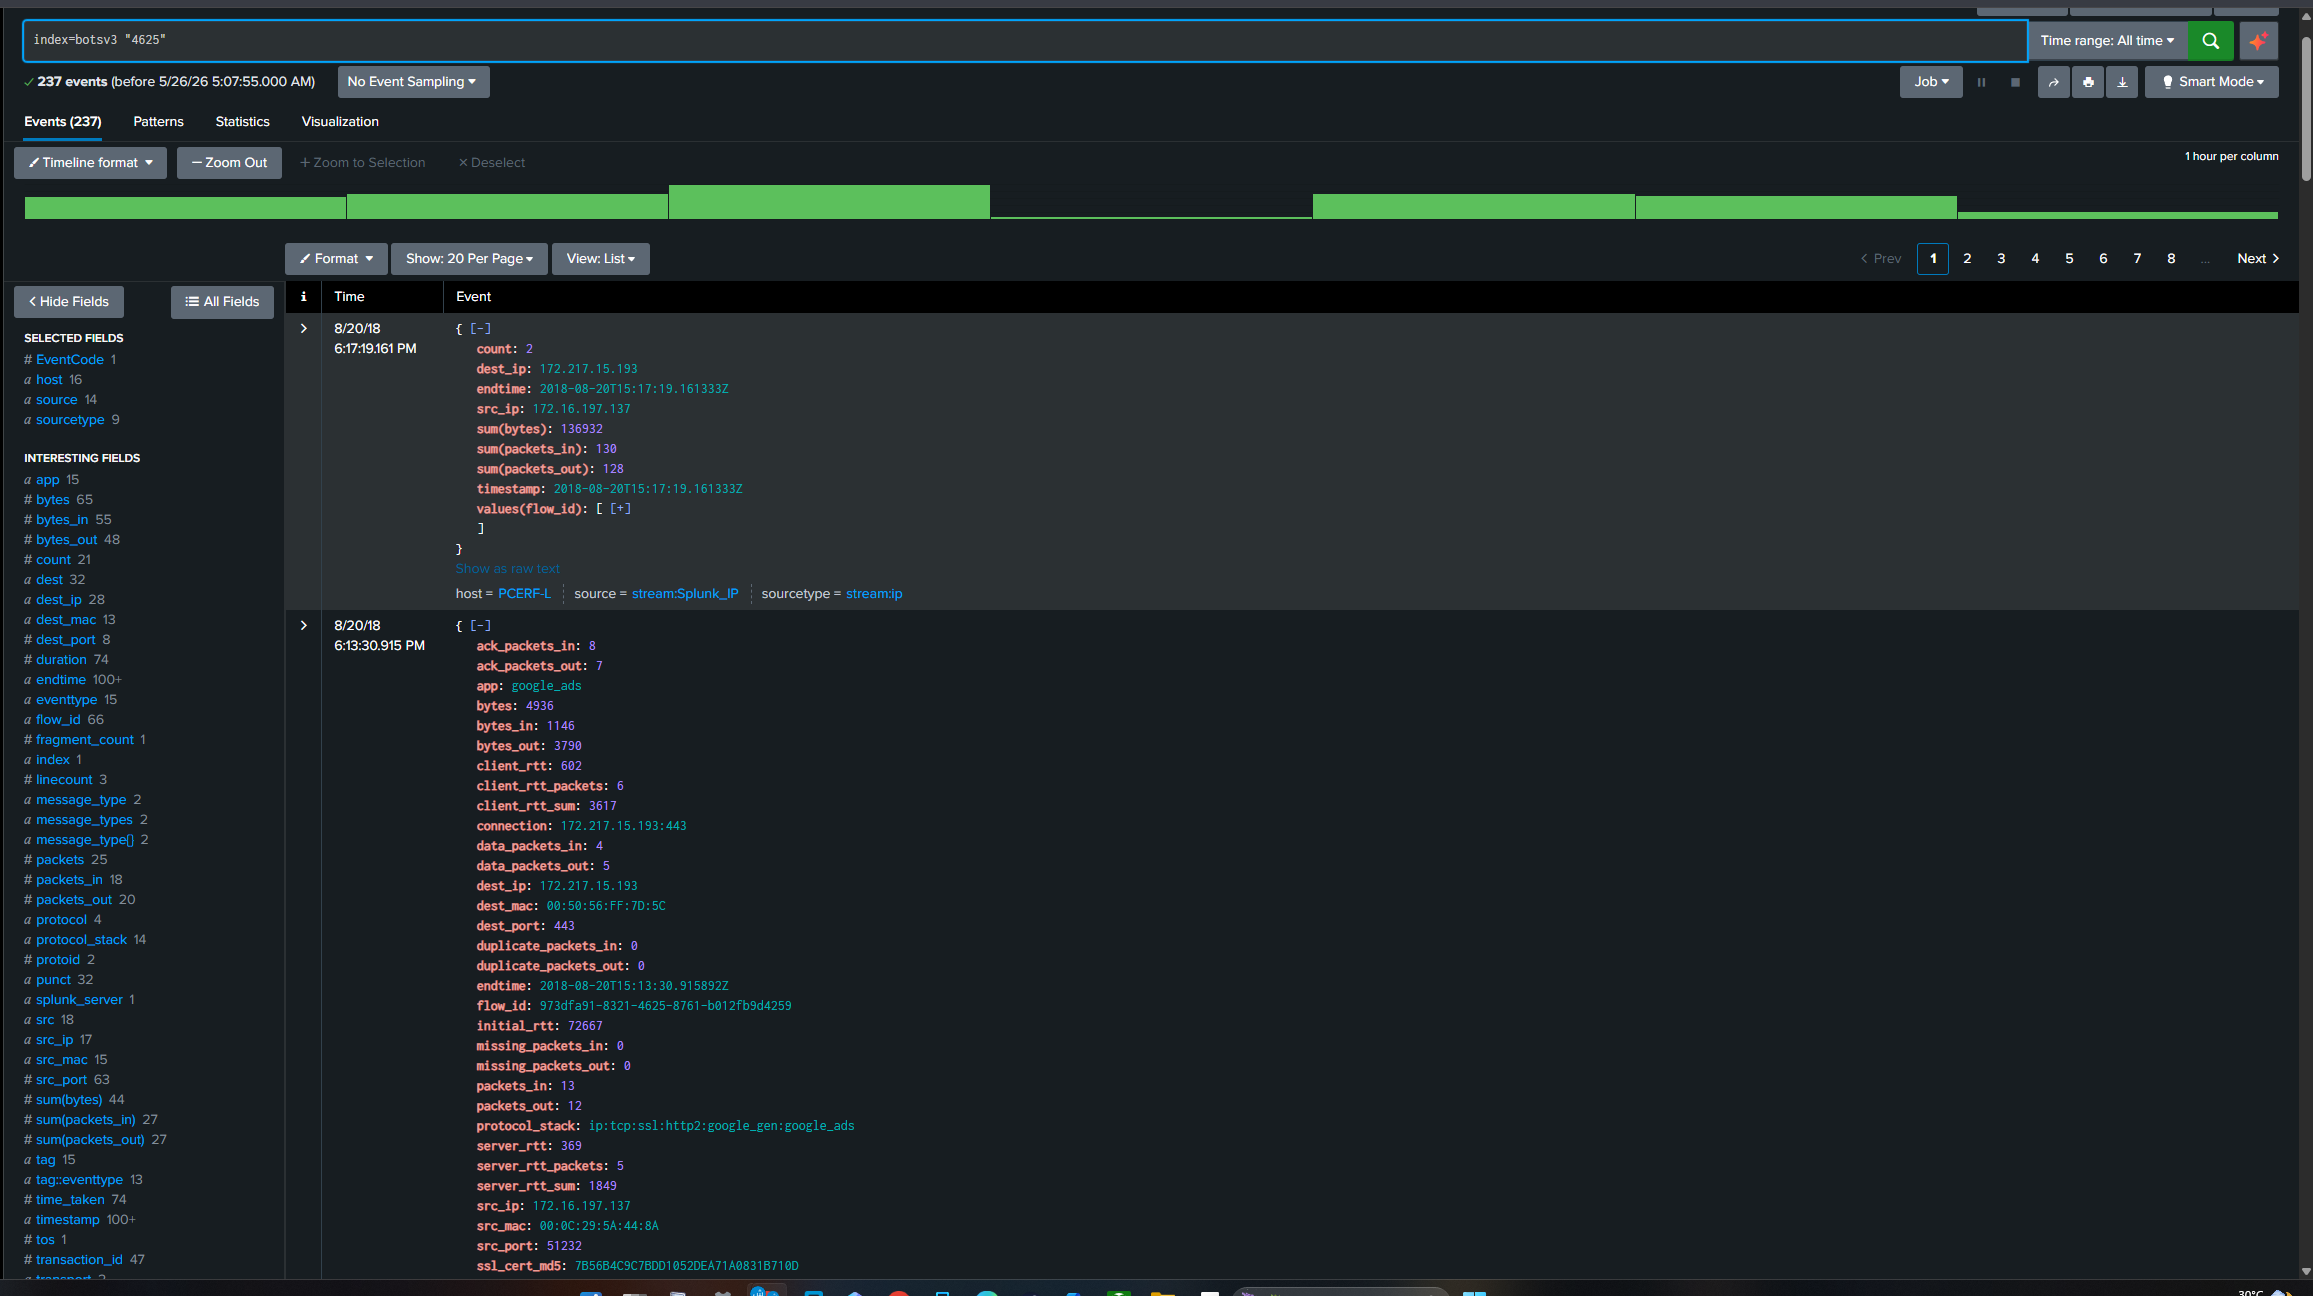
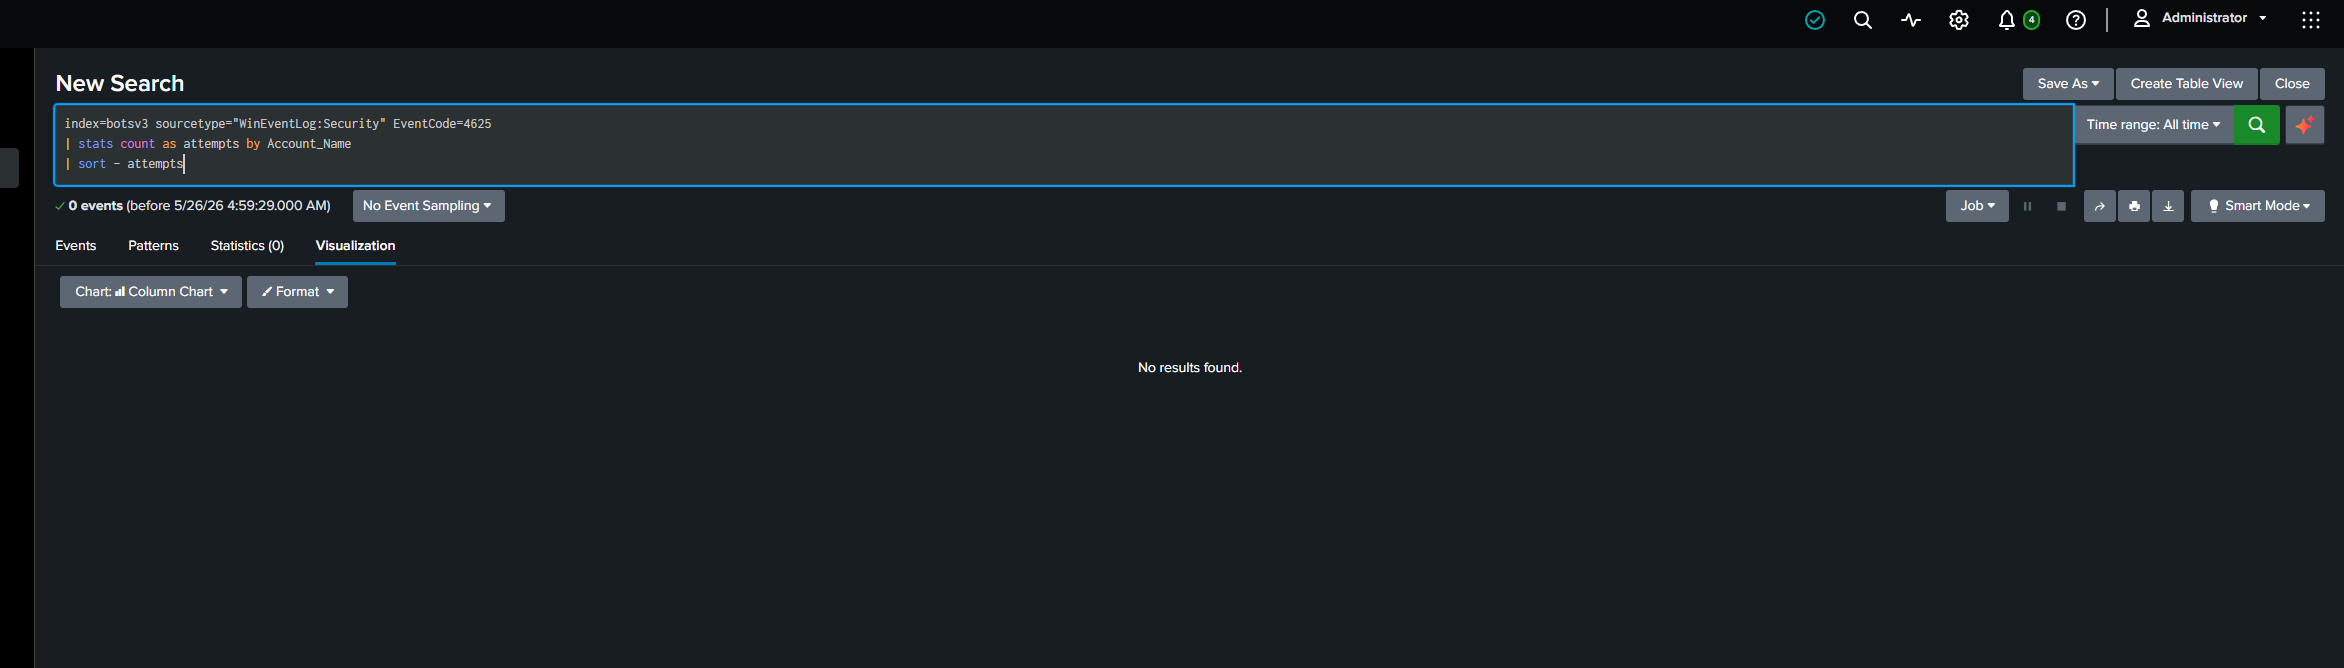
分析 Windows Event ID 4625 日志,以检测失败的登录尝试并识别 Brute Force 模式。
## 精准 SPL 检测
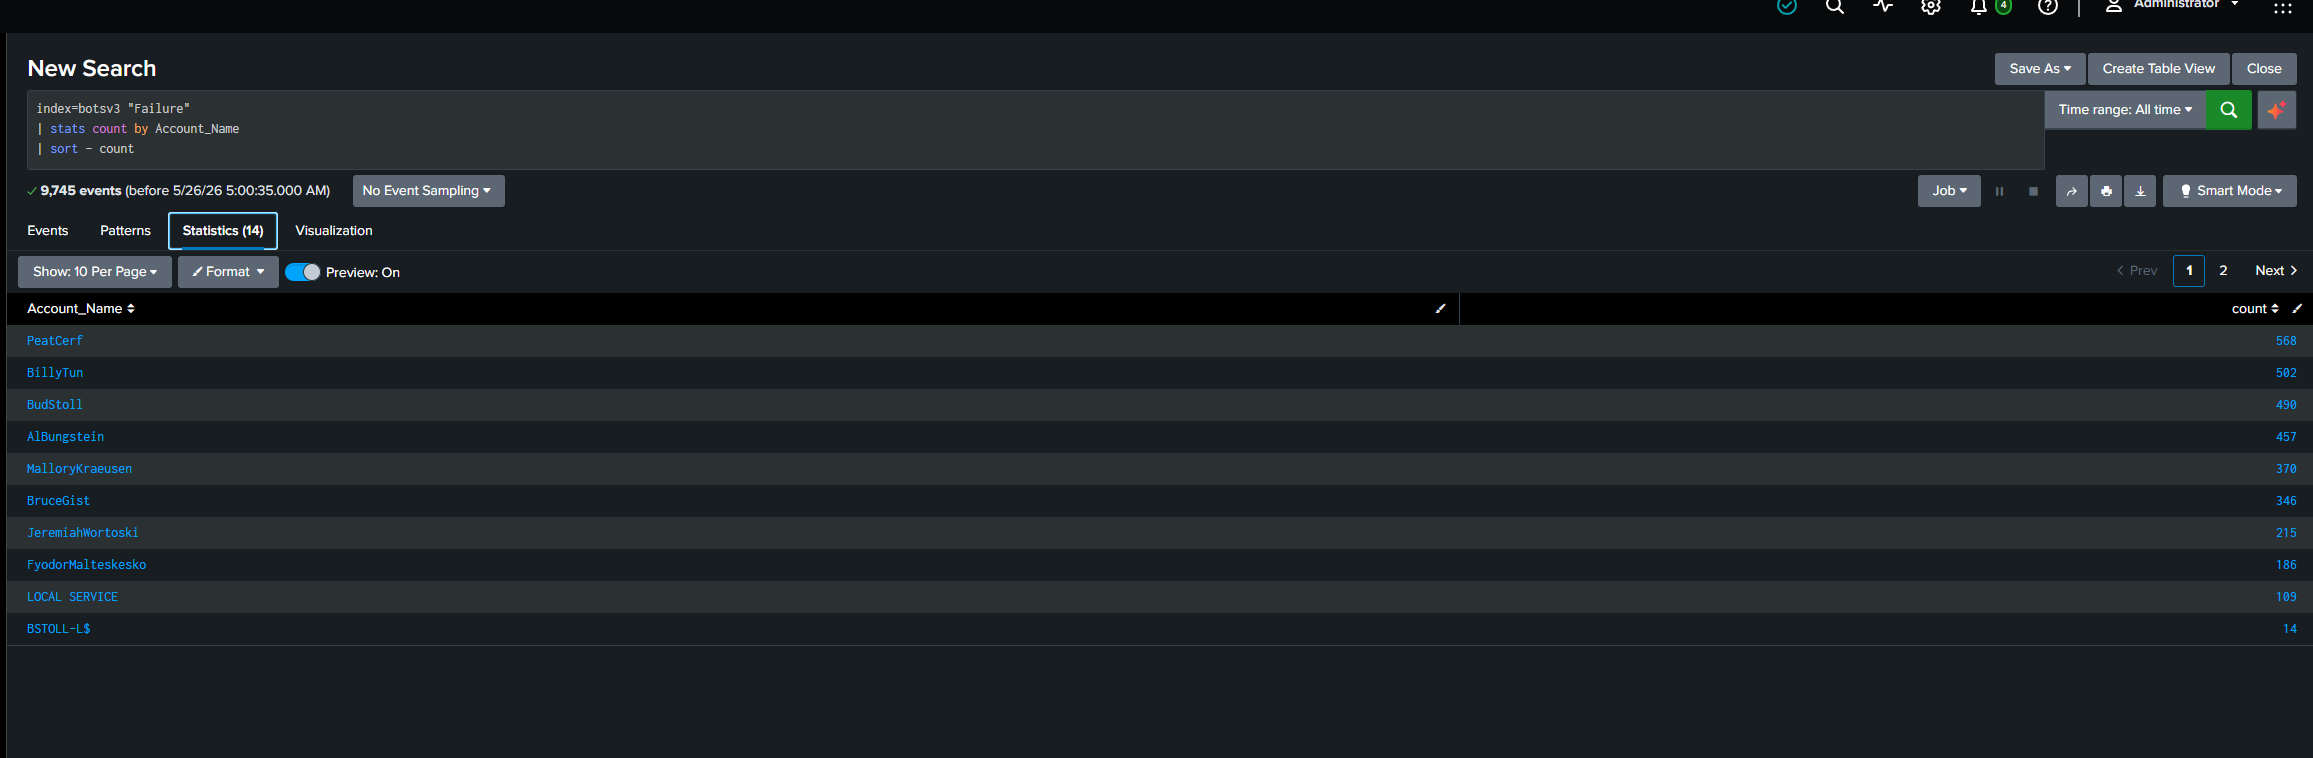
创建 SPL Detection Logic 以识别最活跃的 IP 地址,并将其与可疑尝试关联起来。
# 核心 SPL 检测查询
## Brute Force 检测
```
index=wineventlog EventCode=4625
| stats count by src_ip Account_Name
| where count > 10
| sort - count
```
## 攻击最多的 IP 地址
```
index=wineventlog EventCode=4625
| top limit=10 src_ip
```
## 目标账户检测
```
index=wineventlog EventCode=4625
| stats count by Account_Name
| sort - count
```
## 🚨 可疑登录活动时间线
```
index=wineventlog EventCode=4625
| timechart count by src_ip
```
## 高频身份验证尝试
```
index=wineventlog EventCode=4625
| bucket _time span=5m
| stats count by _time src_ip
| where count > 20
```
# 第三阶段:Forensic Findings
分析日志后,我开始将事件串联起来,并将数据转化为清晰的数字证据,以帮助理解攻击者的行为。
## IP 活动与攻击者追踪
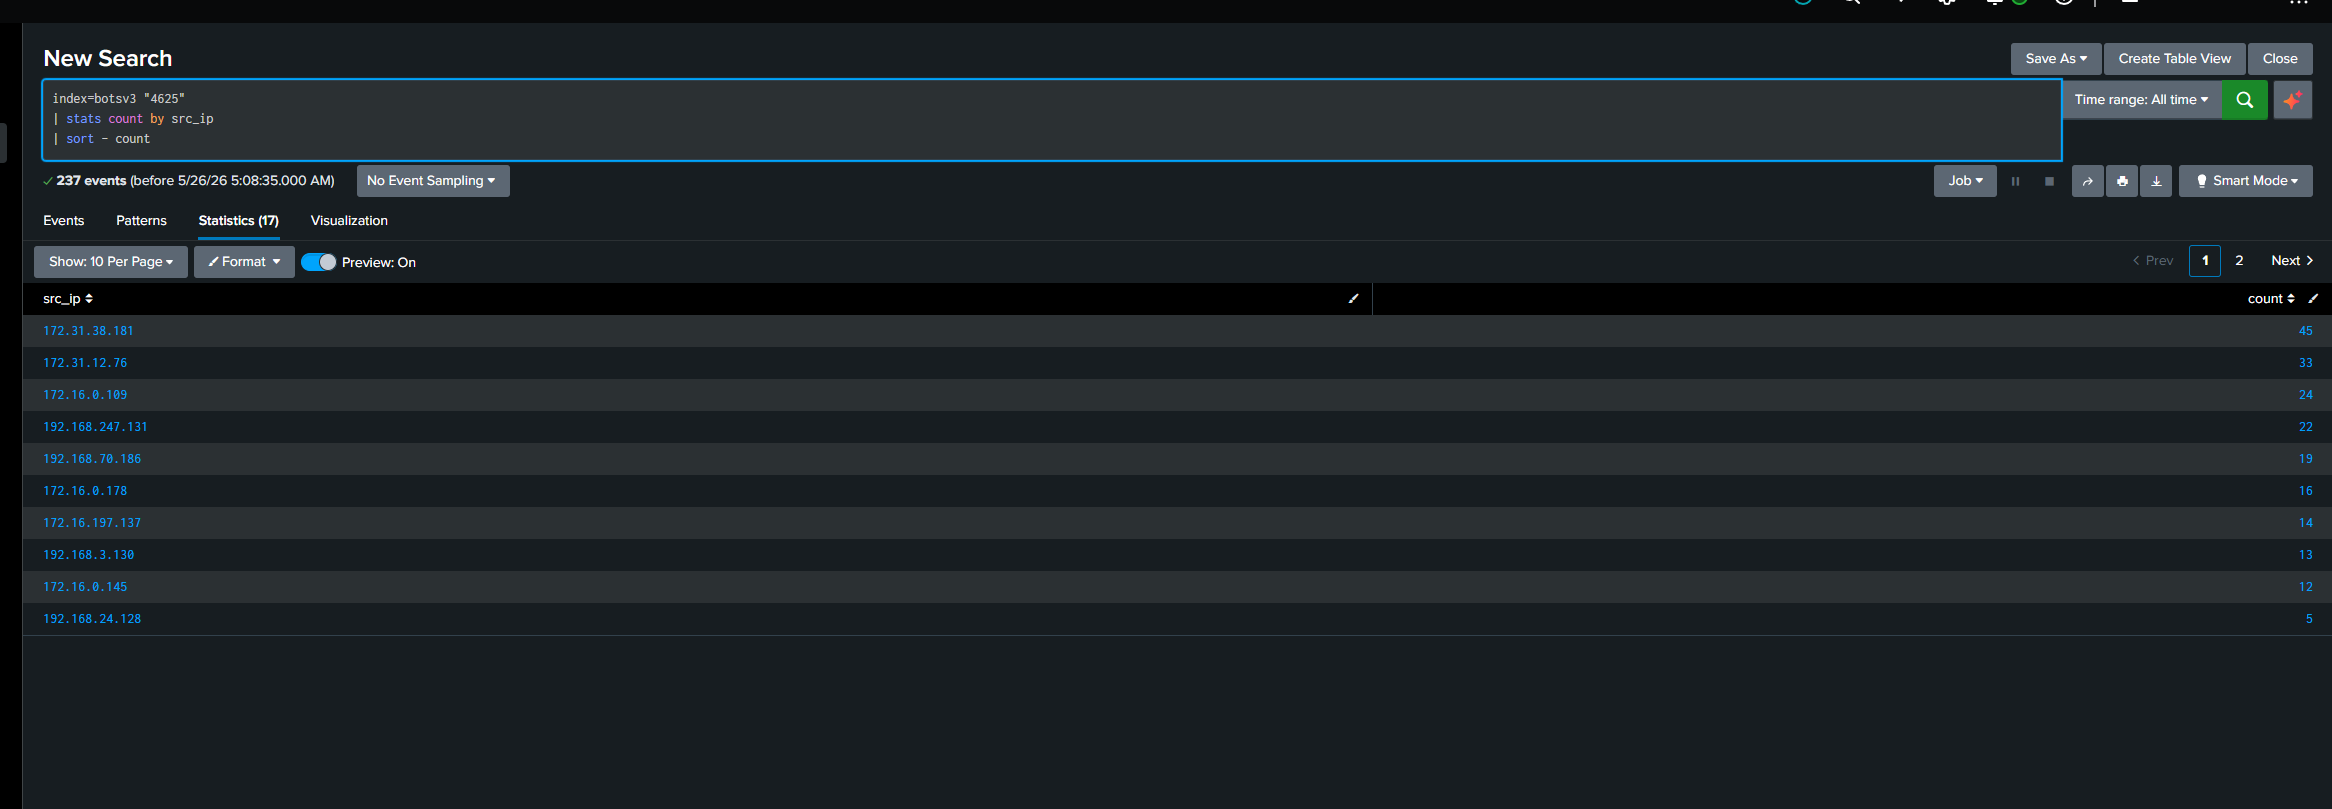
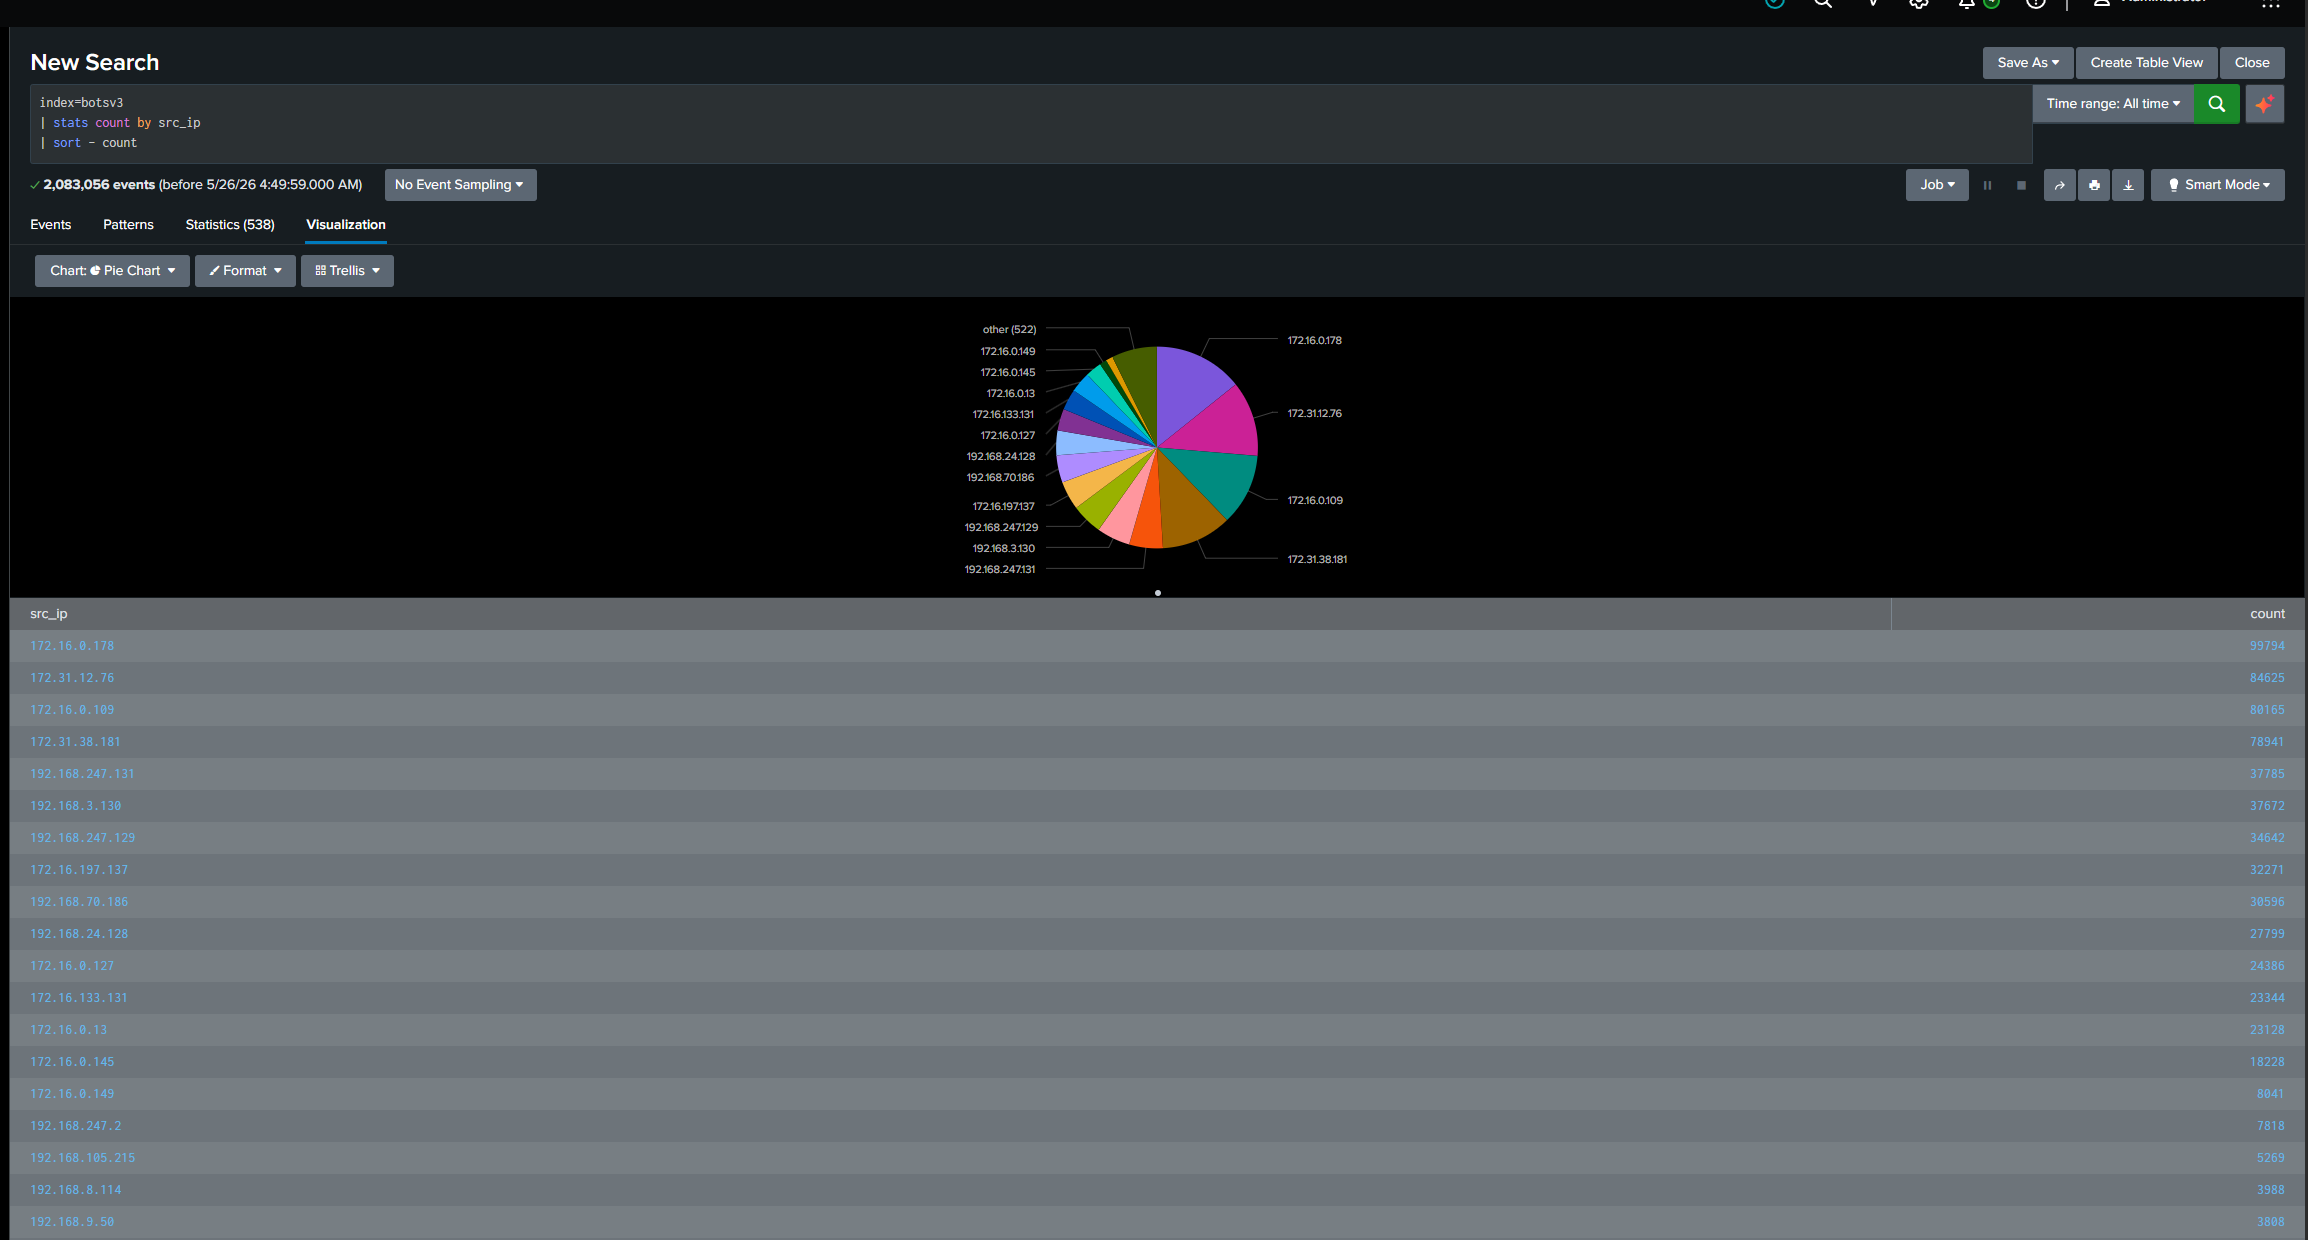
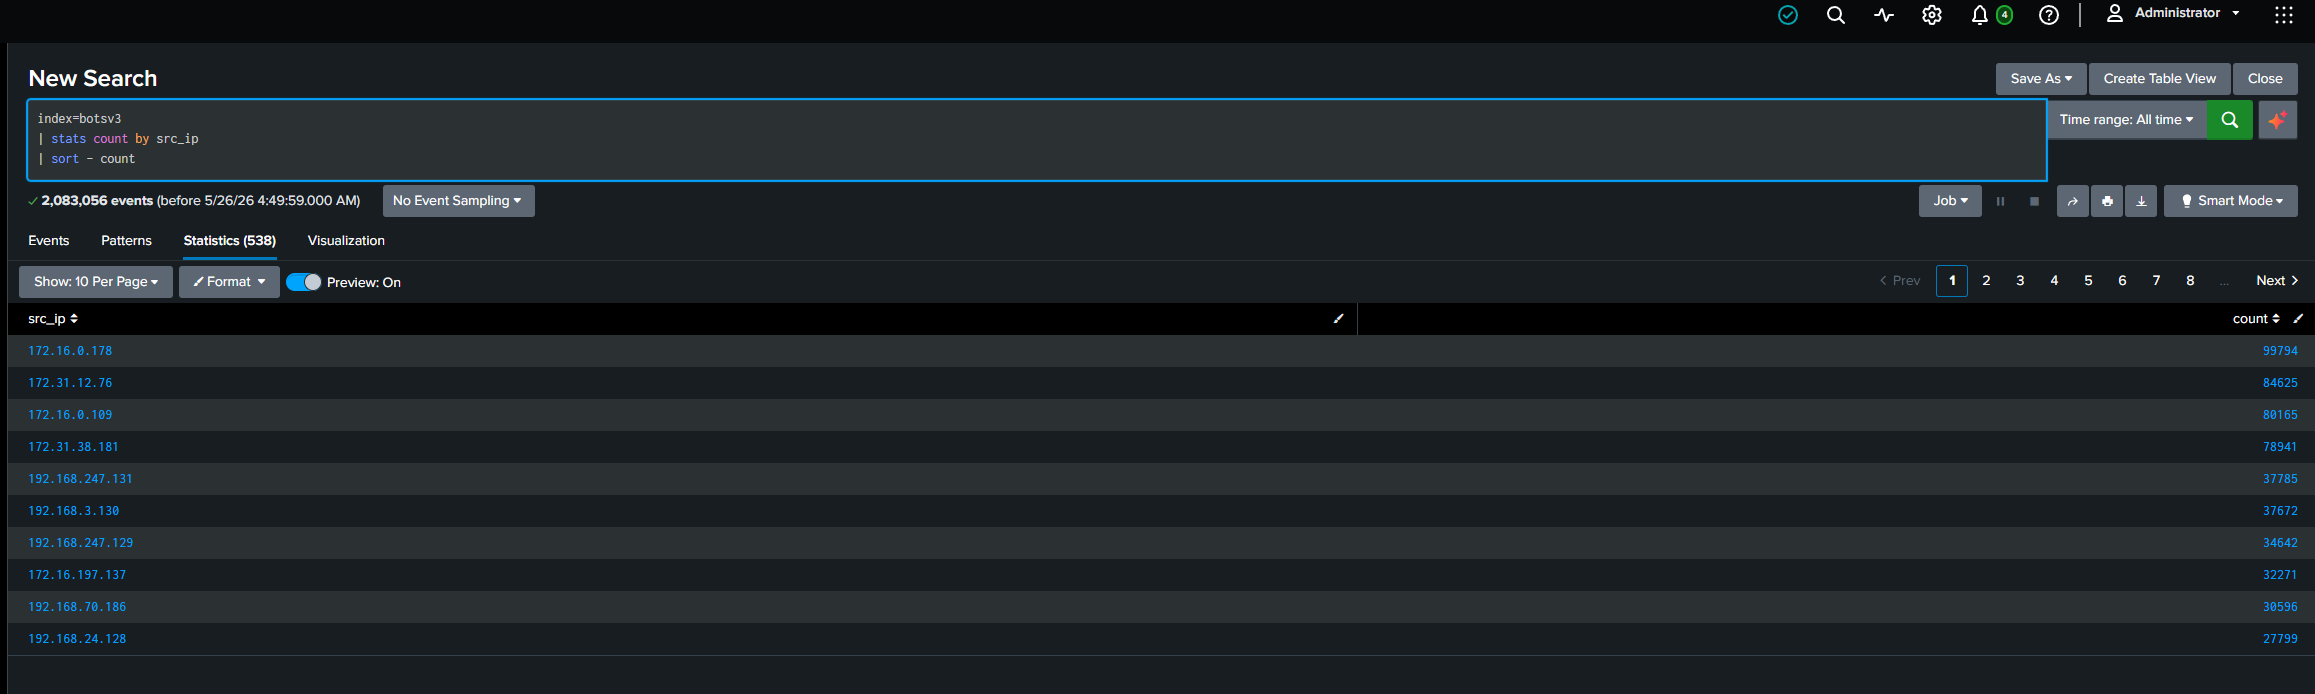
识别最活跃的 IP,并分析攻击者的流量模式。
## 目标账户分析
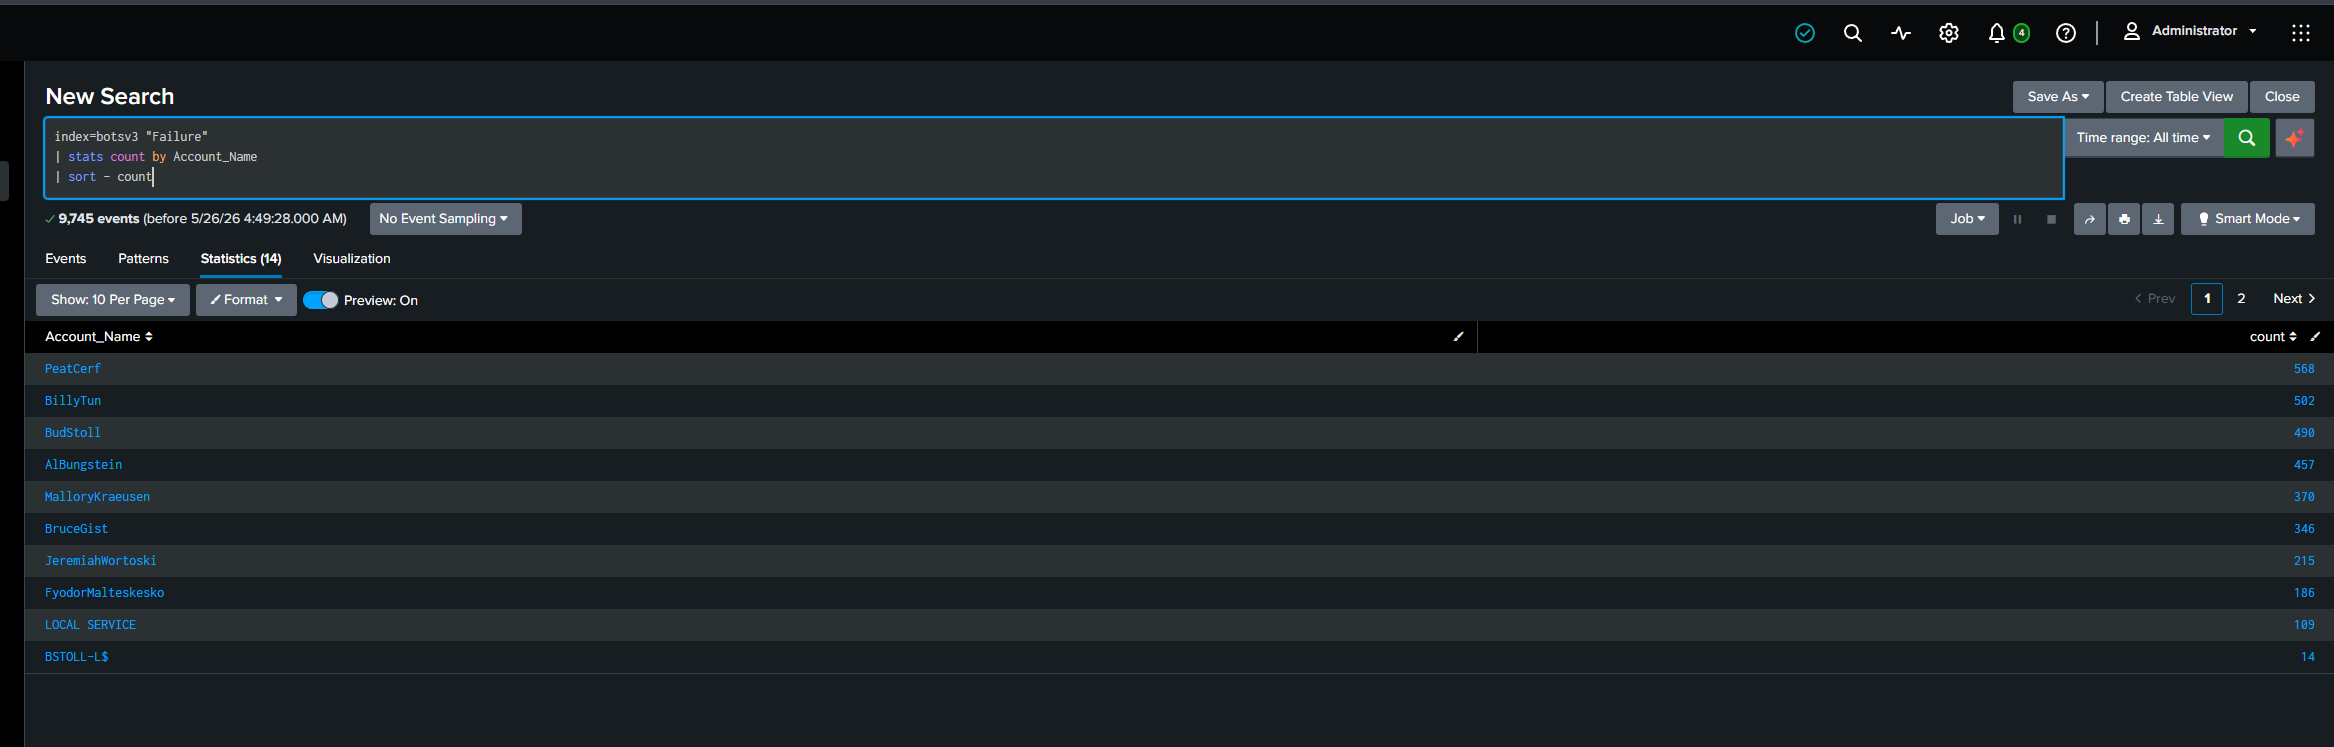
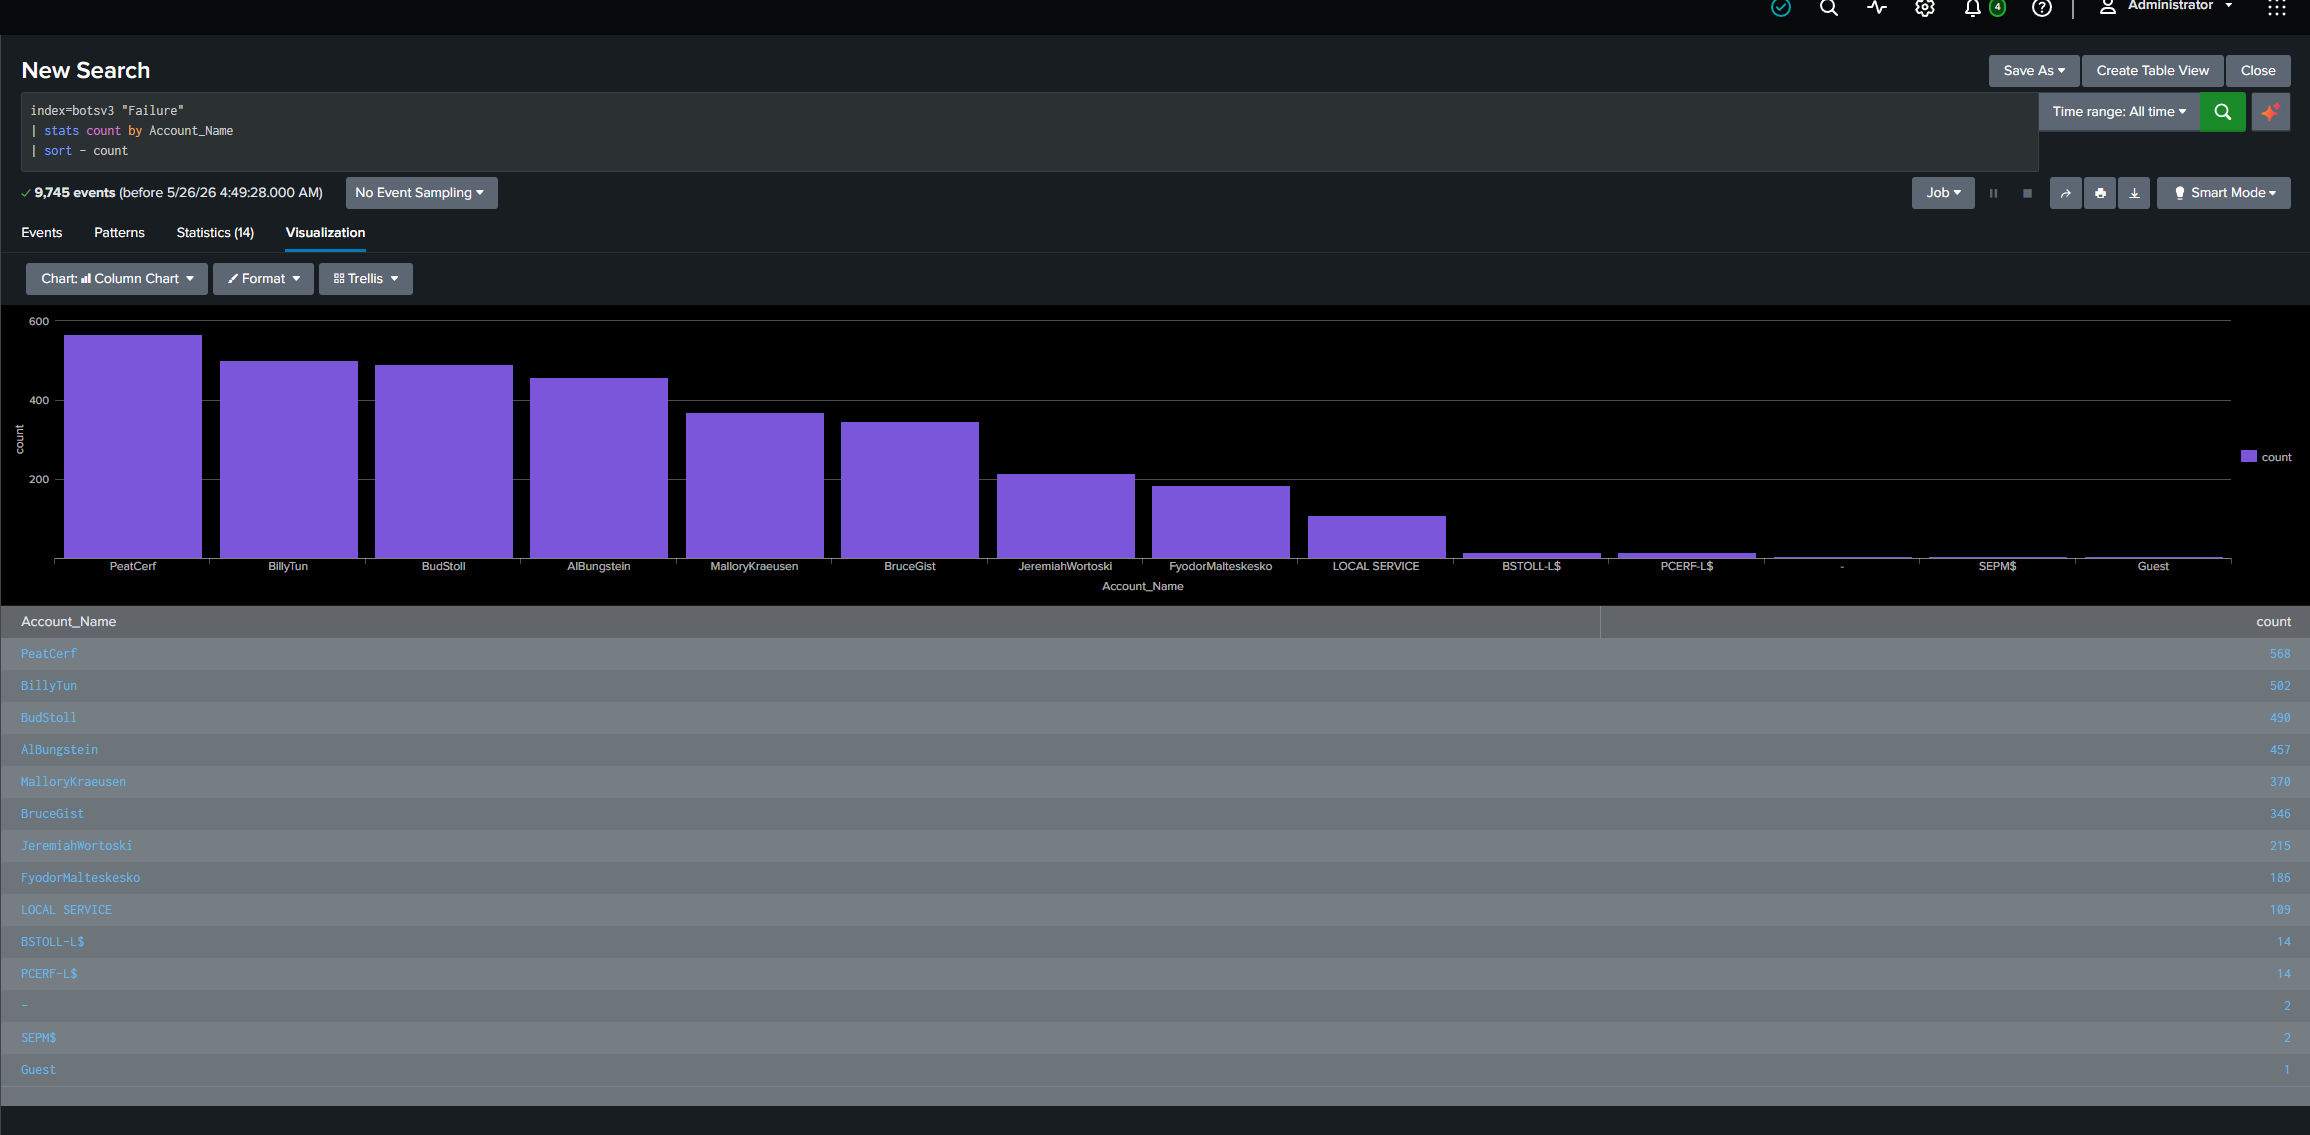
分析目标账户并确定受攻击最严重的敏感账户。
# 检测与用例
| Use Case | Description |
|---|---|
| Brute Force Detection | 检测频繁的失败登录尝试 |
| Suspicious Login Monitoring | 监控异常的登录尝试 |
| Threat Hunting | 在日志中搜寻攻击模式 |
| IOC Identification | 提取妥协指标 |
| Account Abuse Detection | 检测对敏感账户的针对性攻击 |
| SOC Monitoring | 实时监控安全事件 |
| Alert Correlation | 关联并分析告警 |
# MITRE ATT&CK 映射
| Technique ID | Tactic | Technique |
|---|---|---|
| T1110 | Credential Access | Brute Force |
| T1078 | Defense Evasion | Valid Accounts |
| T1059 | Execution | Command & Scripting |
| T1087 | Discovery | Account Discovery |
# 第四阶段:SOC Monitoring & Incident Response
检测到攻击后,建立了一个防御性监控环境,以便未来能够及早发现任何类似活动。
## SOC Dashboard 与告警可视化
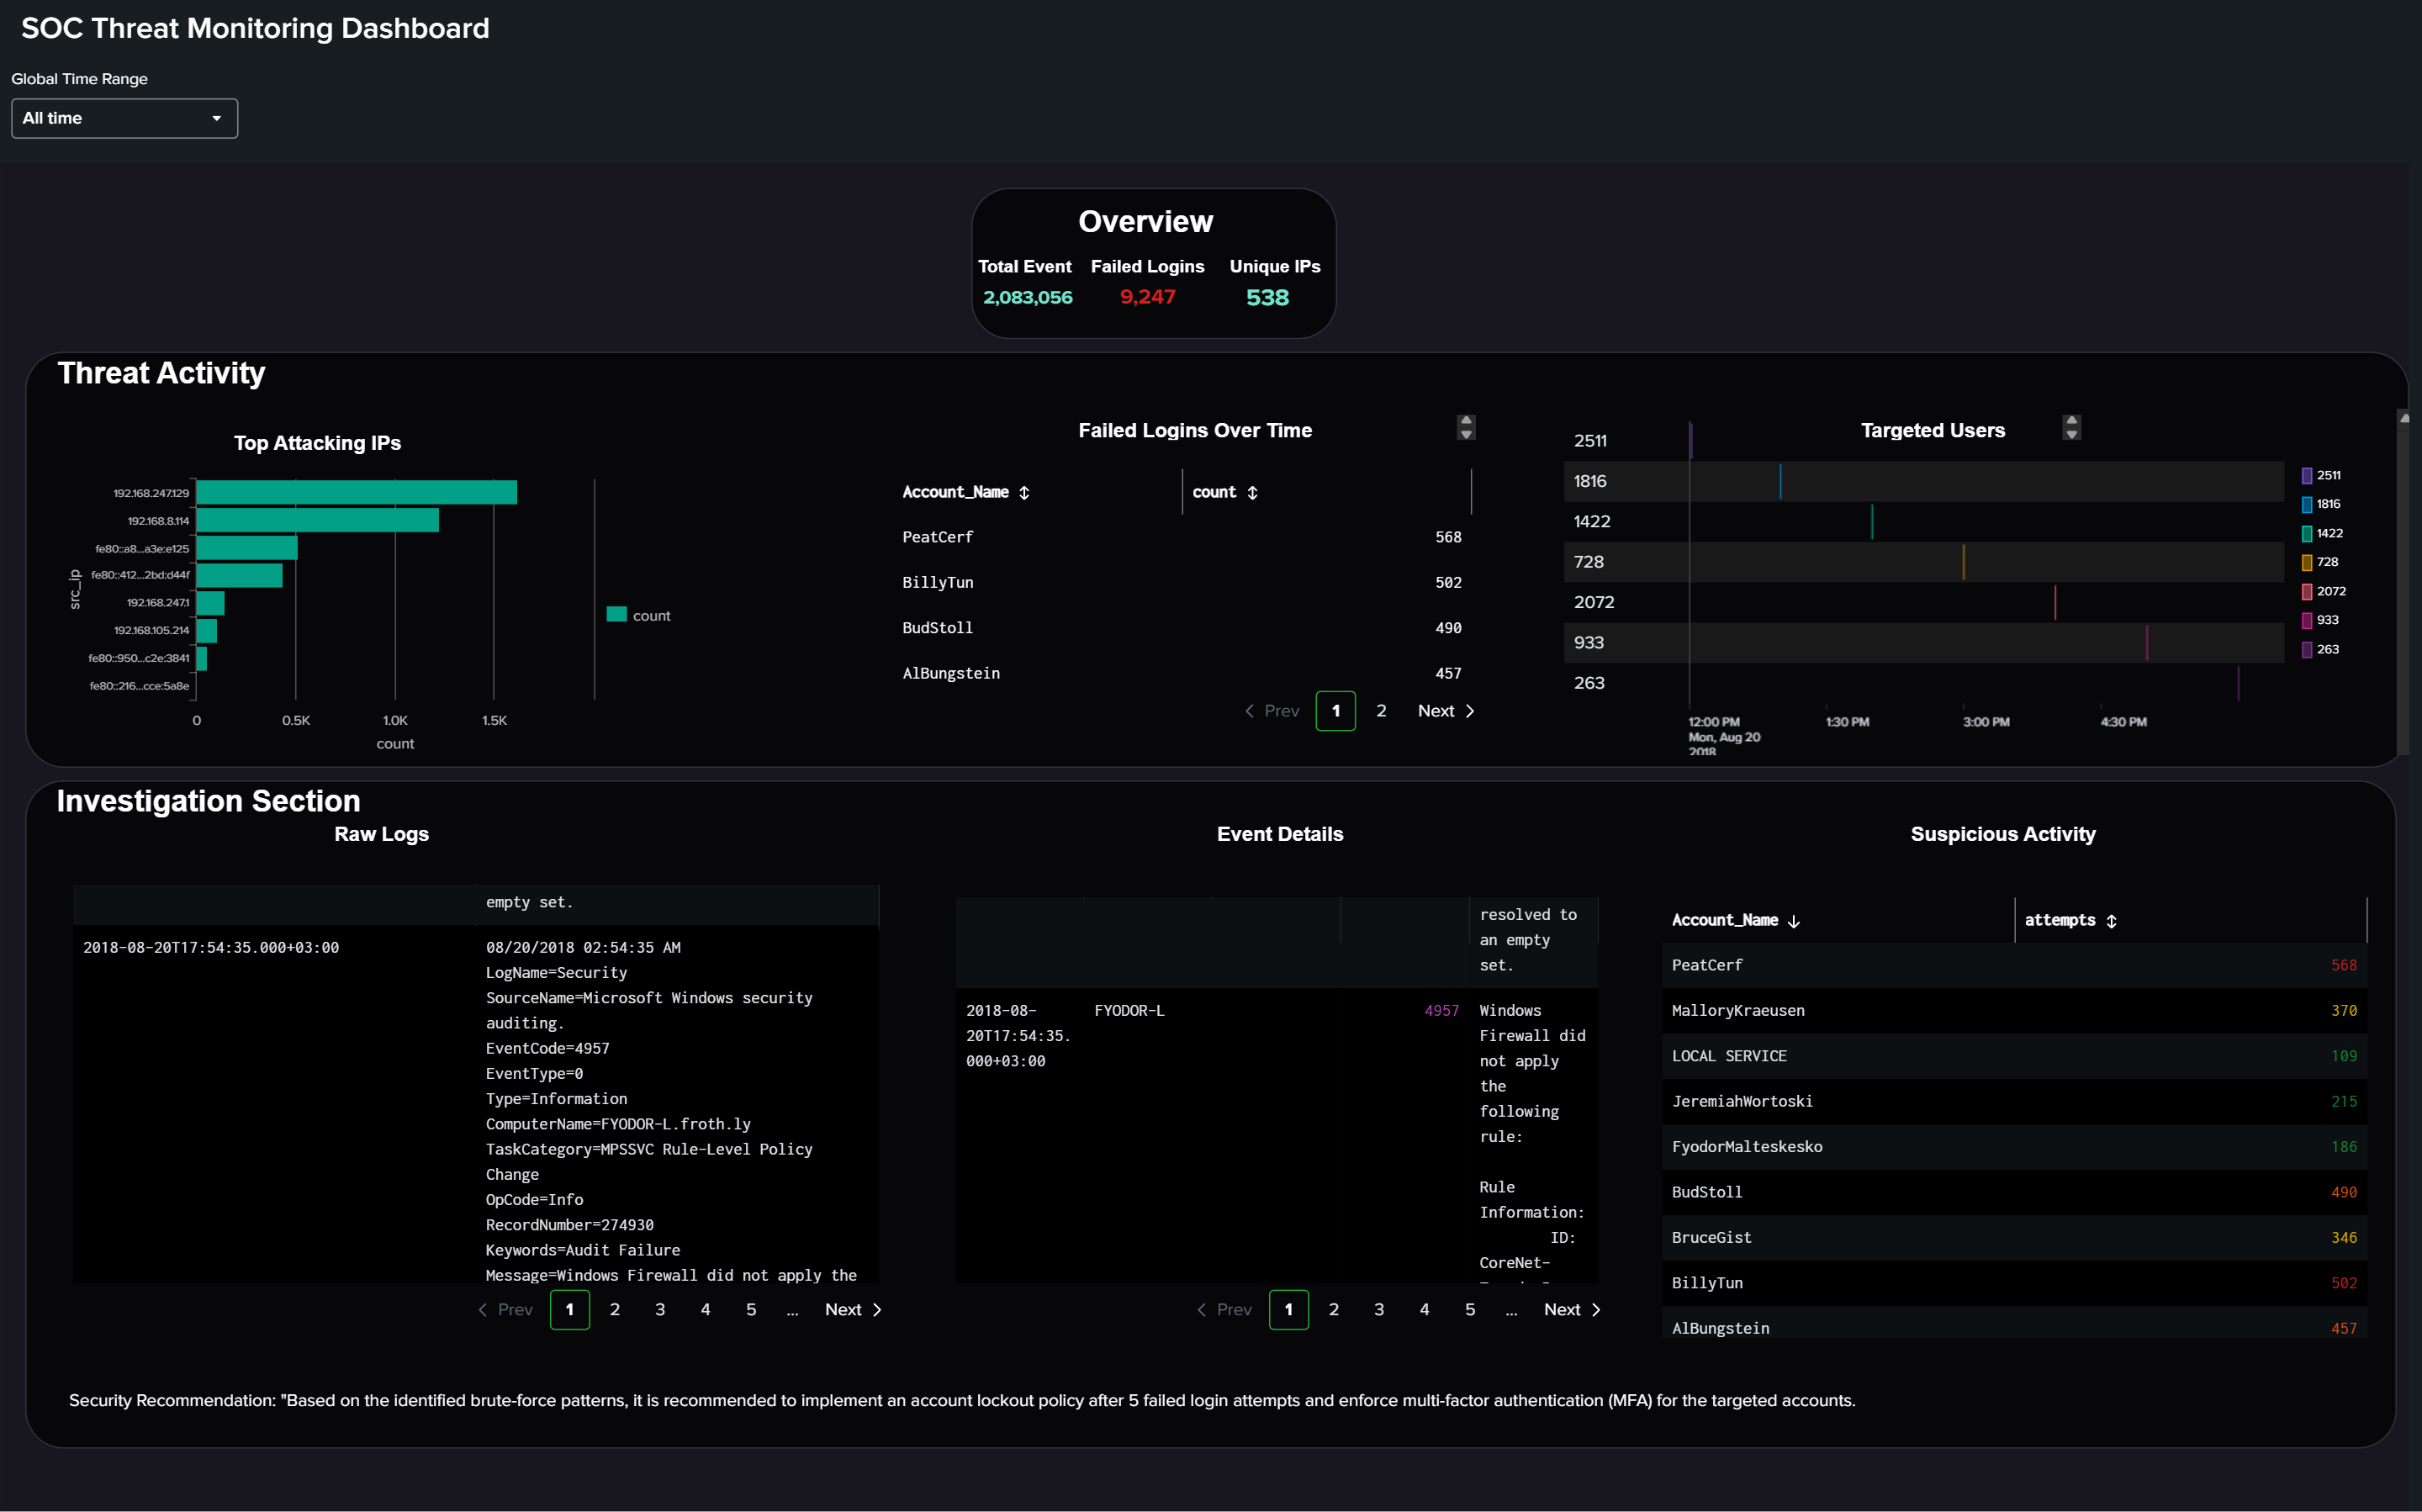
构建交互式 Dashboard 以实时展示安全活动和告警。
## 🚨 自动化告警工作流
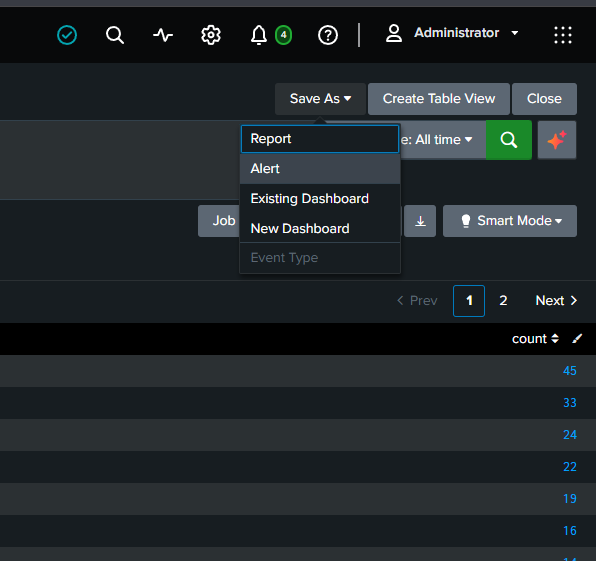
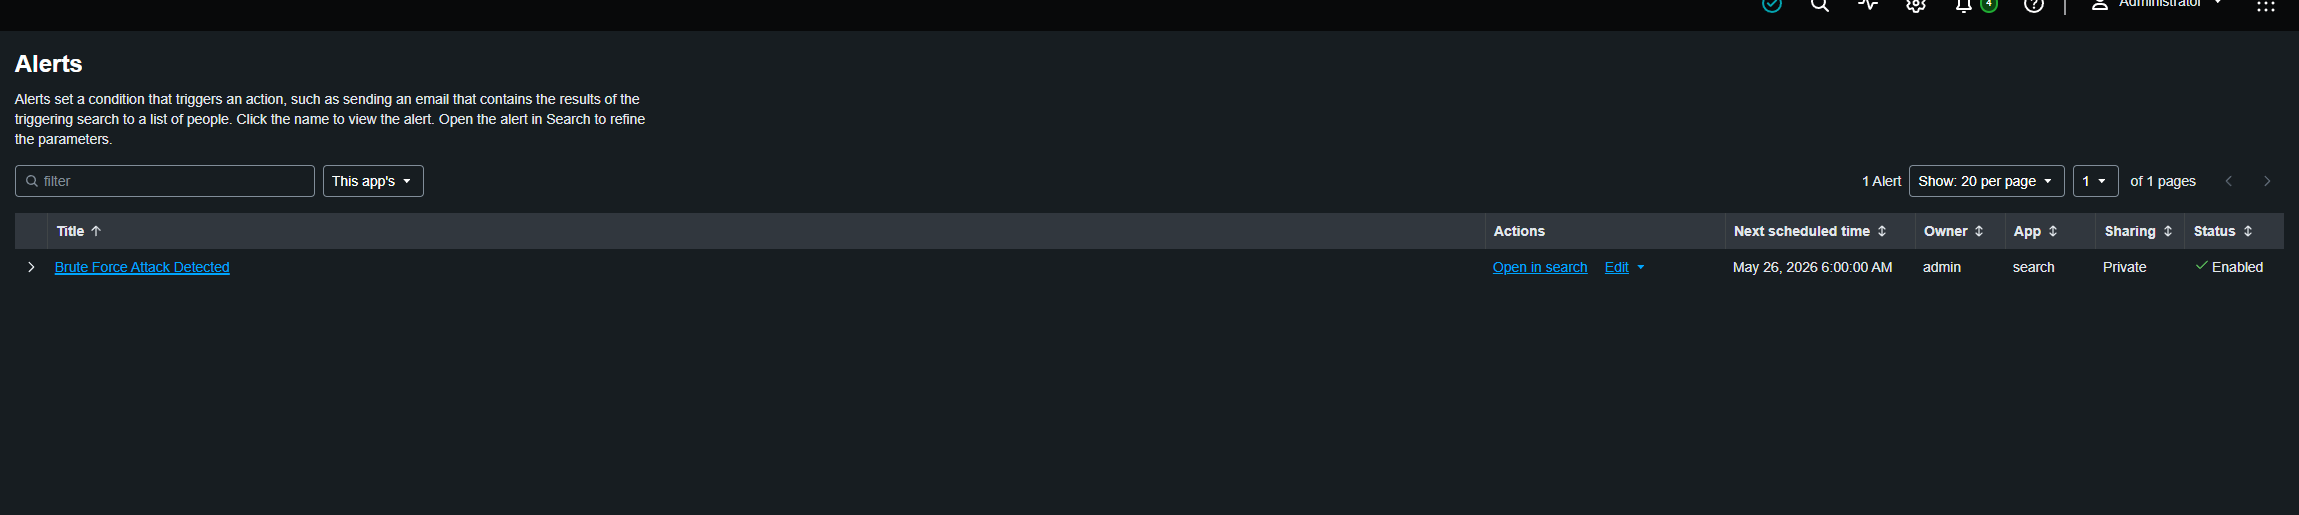
创建自动运行的 Alerting Workflow,以检测任何 Brute Force 活动并通知 SOC 团队。
## 🚨 安全告警
## 要查看告警工作流和检测规则,请访问 [Alerts](alerts/) 文件夹。
# SOC 建议
- 在 Firewall 级别封锁可疑 IP
- 启用 Account Lockout 策略
- 持续监控失败的 Authentication 尝试
- 启用 Multi-Factor Authentication (MFA)
- 在 Splunk 中创建 Correlation Rules
- 改善 Log Retention 和 Visibility
# 结束案例
我成功地:
- 检测到了 Brute Force 攻击
- 识别了攻击者的 IP
- 分析了目标账户
- 在 Splunk 中构建了 Detection Logic
- 创建了用于实时监控的 SOC Dashboard
- 启用了 Automated Alerts 以提高响应速度
该项目模拟了真实 SIEM 环境中 Junior SOC Analyst 的实际工作。
# 📂 Repository 结构
* **[alerts/](alerts/)** : 告警工作流(Alerting Workflow)和检测规则。
* **[dashboards/](dashboards/)** : 可视化监控面板(Dashboards)。
* **[SPL-Queries/](SPL-Queries/)** : 用于 Splunk 分析的查询。
* **[screenshots/](screenshots/)** : 记录工作步骤的屏幕截图。
* **[README.md](README.md)** : 该项目的综合分析报告。
# SOC Analyst 路径
该项目是我以下旅程的一部分:
- SOC Analysis
- Threat Hunting
- Detection Engineering
- SIEM Monitoring
- Incident Response标签:AMSI绕过, 威胁检测, 安全运营, 扫描框架