seyifalode-cmd/aws-guardduty-threat-detection-pipeline
GitHub: seyifalode-cmd/aws-guardduty-threat-detection-pipeline
该项目是一条完全基于 AWS 原生服务构建的自动化威胁检测与响应流水线,解决了 GuardDuty 发现事件缺乏自动响应、告警疲劳和取证链缺失的问题。
Stars: 0 | Forks: 0
# AWS GuardDuty 自动化威胁检测与响应流水线
**完整的检测工程生命周期 — 从零构建**
Oluwaseyi Michael Falode | 网络安全与云安全工程师 | 多伦多,安大略省 | 2026年5月


一条完全从零开始构建的 AWS 原生自动化威胁检测与响应流水线 —— 没有使用预置技术栈,没有现成的 CloudFormation 模板,也没有任何捷径。每一个组件都是经过手动选择、配置和串联,旨在演示完整的检测工程生命周期:从初始威胁检测、自动化修复、审计日志记录、证据存储,直至实时监控。
端到端测试共生成了 391 个 GuardDuty 样本发现。该流水线自动处理了所有符合条件的发现 —— 通过 EventBridge 路由,触发 Lambda 进行自动化修复,并在几秒钟内将完整的 JSON 告警载荷发送到分析师的收件箱。全程零人工干预。
## 项目概览
| | |
|---|---|
| **平台** | Amazon Web Services — 区域: us-east-2 (俄亥俄州) |
| **使用的服务** | GuardDuty · EventBridge · SNS · Lambda · IAM · CloudTrail · S3 · CloudWatch |
| **语言** | Python 3.12 (Lambda) · JSON (EventBridge 规则模式) |
| **安全重点** | 威胁检测 · 自动化修复 · 审计日志记录 · 事件响应 |
| **框架** | MITRE ATT&CK · 检测工程 · SOAR · 最小权限 |
| **测试结果** | 生成 391 个发现 · 投递 8 个 SNS 告警 · 针对 HIGH 严重性级别调用 Lambda |
| **完成时间** | 2026年5月 |
## 本项目解决的问题
安全团队面临一个根本性的检测工程问题:**威胁虽然被记录了,但什么也不会自动发生。**
GuardDuty 持续不断地触发发现 —— 但停留在仪表板上的发现根本无法阻止攻击者。在大多数环境中,检测与响应之间的时间差通常以小时甚至天数来衡量。到那个时候,被攻陷的 EC2 实例可能早就被用于横向移动、数据外泄或挖矿了。
标准的检测生命周期中存在三个缺口:
- **缺口 1 — 告警疲劳:** GuardDuty 会生成涵盖所有严重性级别的发现。如果不进行严重性过滤,低严重性 (LOW) 的信息事件就会淹没分析师的待办队列,掩盖关键的信号。响应流水线最终会被淹没在噪声中。
- **缺口 2 — 人工修复:** 即使检测到了高严重性 (HIGH) 的发现,也必须由人来注意到它、调查它并采取行动。在真实的安全事件中,这个过程太漫长了。一个被攻陷的 EC2 实例需要在几秒钟内被隔离,而不是几个小时。
- **缺口 3 — 缺乏取证链条:** 没有日志记录的自动化操作是极其危险的。如果 Lambda 隔离了一个 EC2 实例,就必须捕获该操作产生的每一个 API 调用 —— 包括操作者是谁、来源 IP 是什么、发生在何时 —— 以满足合规性、法律保全和事后调查的需要。
该流水线按顺序接入了八个 AWS 服务,同时解决了上述三个缺口。
## 流水线架构
```
THREAT OCCURS IN AWS ACCOUNT
|
| GuardDuty monitors continuously
v
┌─────────────────────────────────────────────────────────┐
│ GUARDDUTY (Detection Layer) │
│ Monitors: CloudTrail · VPC Flow Logs · DNS · EKS · EC2│
│ Generates structured findings with MITRE ATT&CK tags │
└──────────────────────┬──────────────────────────────────┘
│ Finding generated
v
┌─────────────────────────────────────────────────────────┐
│ EVENTBRIDGE (Routing & Severity Filter) │
│ Rule: guardduty-high-severity-response │
│ Filter: severity >= 4 (MEDIUM + HIGH only) │
│ LOW severity (1-3) → dropped, no downstream action │
└────────────┬────────────────────────┬───────────────────┘
│ │
│ simultaneously │ simultaneously
v v
┌────────────────────┐ ┌────────────────────────────────┐
│ SNS │ │ LAMBDA │
│ (Alerting) │ │ (Automated Remediation) │
│ │ │ │
│ Topic: │ │ Function: │
│ guardduty-alerts │ │ guardduty-auto-response │
│ │ │ Runtime: Python 3.12 │
│ Delivers full │ │ │
│ JSON payload to │ │ severity >= 7 (HIGH): │
│ analyst email │ │ → Tag EC2 as COMPROMISED │
│ in seconds │ │ → Isolate from rotation │
│ │ │ │
└────────────────────┘ │ severity 4-6 (MEDIUM): │
│ → Log to CloudWatch │
│ → No destructive action │
└────────────────────────────────┘
│
│ every API call logged
v
┌─────────────────────────────────────────────────────────┐
│ CLOUDTRAIL + S3 (Audit Trail & Evidence Storage) │
│ Trail: guardduty-audit-trail │
│ Captures: every API call, who made it, from where │
│ Storage: S3 bucket (durable, tamper-evident) │
│ Log file validation: Enabled │
└──────────────────────┬──────────────────────────────────┘
│ logs stream to CloudWatch
v
┌─────────────────────────────────────────────────────────┐
│ CLOUDWATCH (Monitoring Layer) │
│ Dashboard: GuardDuty-Detection-Pipeline │
│ Metrics: IncomingBytes · IncomingLogEvents │
│ Confirms pipeline is alive and log data is flowing │
└─────────────────────────────────────────────────────────┘
```
**检测流程:** `GuardDuty → EventBridge (严重性过滤) → SNS (告警) + Lambda (修复) → CloudTrail + S3 (日志) → CloudWatch (监控)`
## 阶段 1:GuardDuty — 检测层
GuardDuty 在 us-east-2 (俄亥俄州) 被启用。它作为主要的检测引擎 —— 持续分析多个数据源以发现可疑活动,并生成带有 MITRE ATT&CK 映射的结构化发现。
**GuardDuty 监控的内容:**
- CloudTrail 日志 — 账户中发起的每一个 API 调用
- VPC Flow Logs — 流经资源的所有进出网络流量
- DNS 日志 — 来自 EC2 实例的域名查询
- EKS 审计日志 — Kubernetes API 调用和容器行为
- 运行时监控 — 容器和 EC2 内部的进程级活动
**严重性等级:**
| 严重性 | 范围 | 流水线动作 |
|---|---|---|
| LOW | 1–3 | 信息性 — 仅记录日志,不触发自动化动作 |
| MEDIUM | 4–6 | 值得关注 — 触发完整的告警和响应流水线 |
| HIGH | 7–10 | 紧急 — 触发即时的自动化 EC2 隔离 |
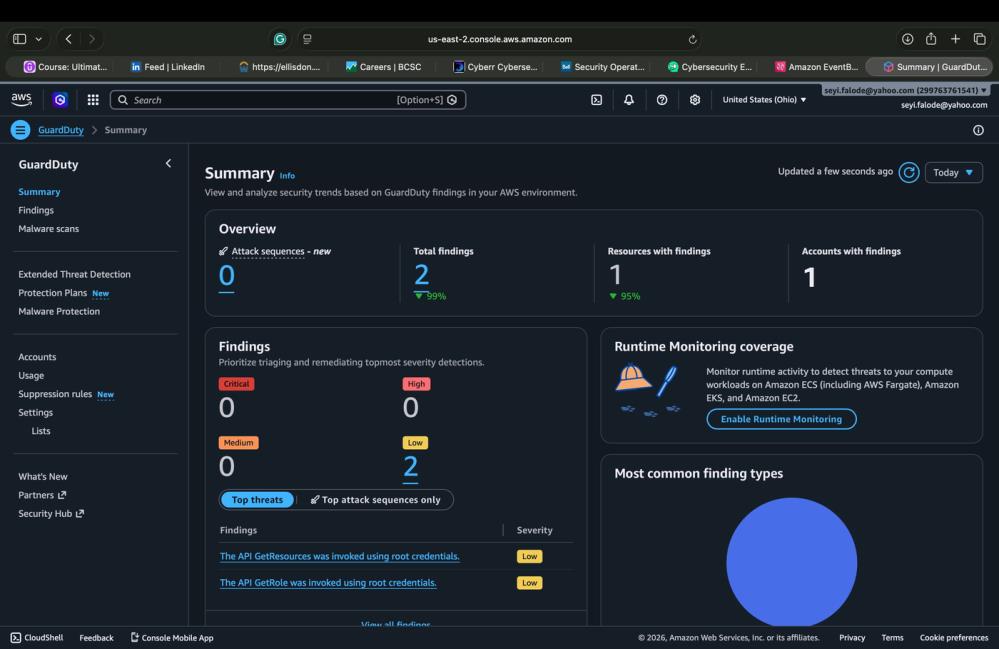
*截图 1 — GuardDuty 摘要仪表板,显示当前活动发现和运行时监控覆盖范围*
## 阶段 2:EventBridge — 路由与自动化层
EventBridge 是流水线的中枢神经系统。它在默认事件总线上监听 GuardDuty 发现,并在路由到下游目标之前应用严重性过滤器 —— 防止低严重性的噪声淹没响应链。
**规则配置:**
- 规则名称:`guardduty-high-severity-response`
- 事件总线:默认 | 状态:已启用
- 严重性过滤:`{ "severity": [{ "numeric": [">=", 4] }] }` — 仅 MEDIUM 和 HIGH 发现会触发
- 目标 1:`guardduty-alerts` (SNS) — 向分析师发送电子邮件告警
- 目标 2:`guardduty-auto-response` (Lambda) — 自动化修复
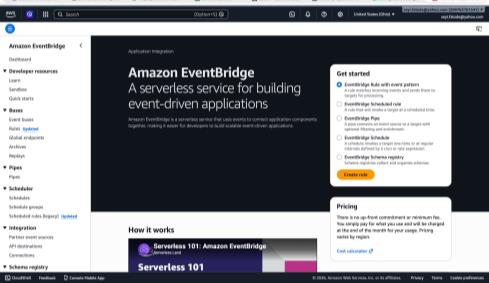
*截图 2 — Amazon EventBridge 主页*
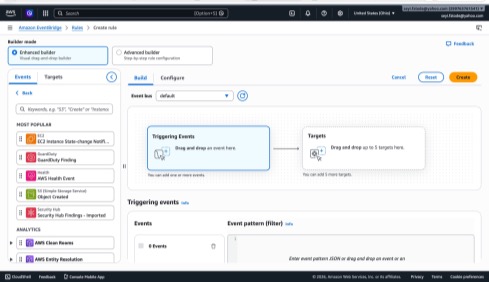
*截图 3 — 选中 GuardDuty Finding 作为触发事件源*
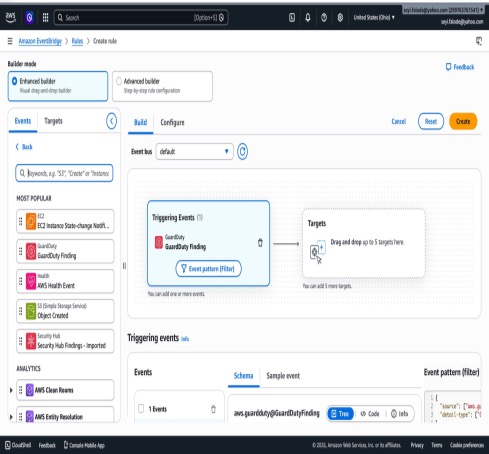
*截图 4 — 将 GuardDuty Finding 拖拽到 EventBridge 规则画布上*
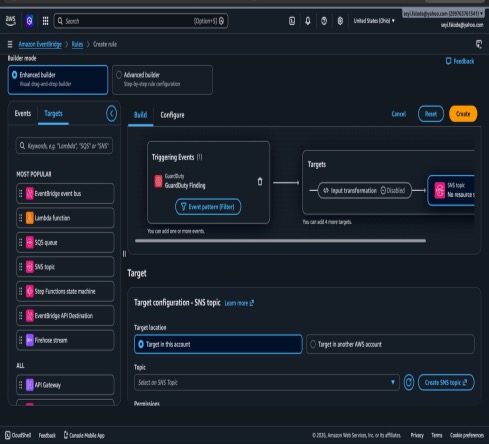
*截图 5 — 添加 SNS 目标(在阶段 3 创建主题之前,该目标无效)*
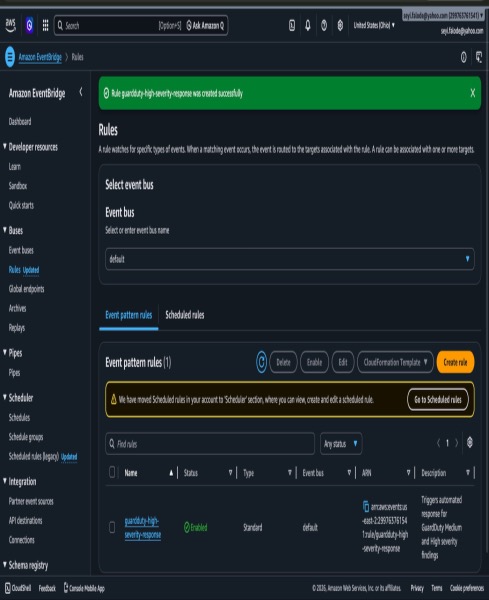
*截图 6 — 规则 guardduty-high-severity-response 已创建并启用*
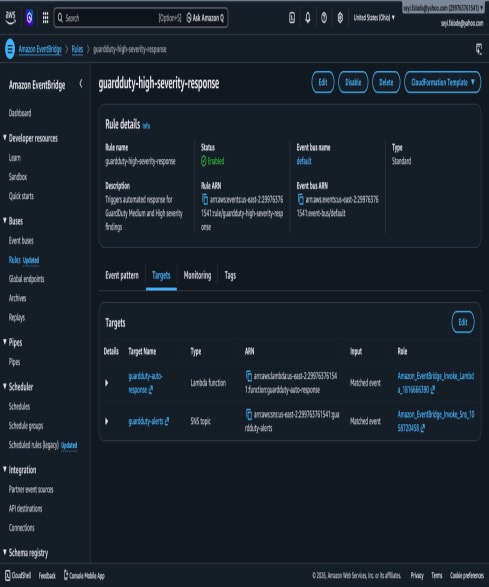
*截图 7 — 确认 Lambda 和 SNS 目标均已附加到规则上并处于活跃状态*
## 阶段 3:SNS — 告警层
Amazon SNS 负责处理流水线中面向人类的环节。当 EventBridge 路由符合条件的发现时,SNS 会立即将完整的 JSON 发现载荷以电子邮件形式发送到已订阅的分析师地址。
**配置:**
- 主题名称:`guardduty-alerts` | 类型:标准 | 区域:us-east-2
- ARN:`arn:aws:sns:us-east-2:299763761541:guardduty-alerts`
- 订阅:电子邮件 → seyi.falode@yahoo.com | 状态:已确认
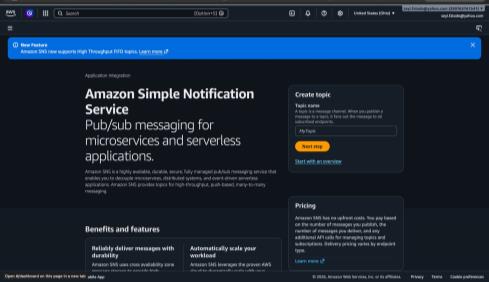
*截图 8 — Amazon Simple Notification Service 主页*
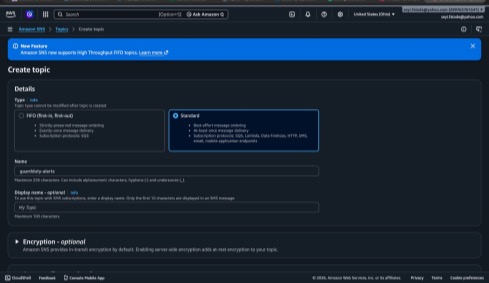
*截图 9 — 创建 guardduty-alerts 标准主题*
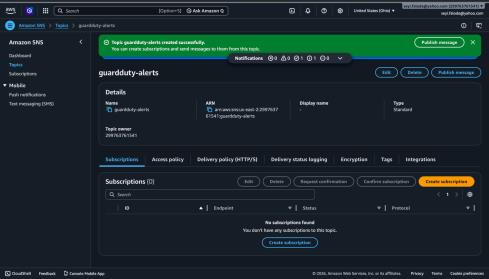
*截图 10 — 主题创建成功,ARN 已确认*
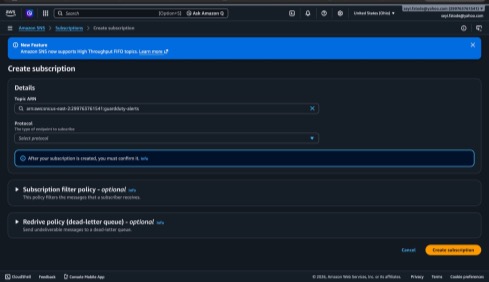
*截图 11 — 创建针对 guardduty-alerts 主题的电子邮件订阅*
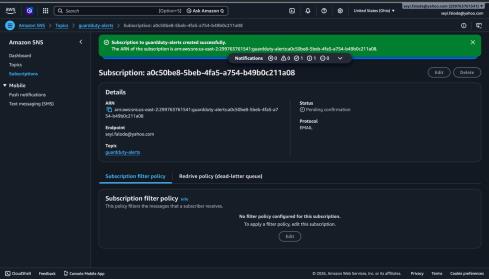
*截图 12 — 订阅已创建,等待电子邮件确认*
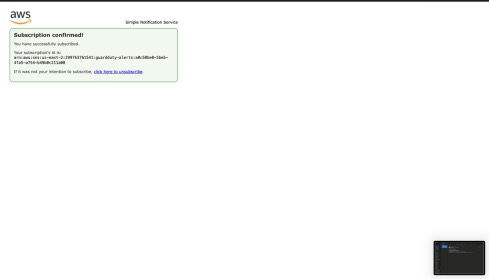
*截图 13 — 订阅已确认 — 分析师电子邮件现已激活*
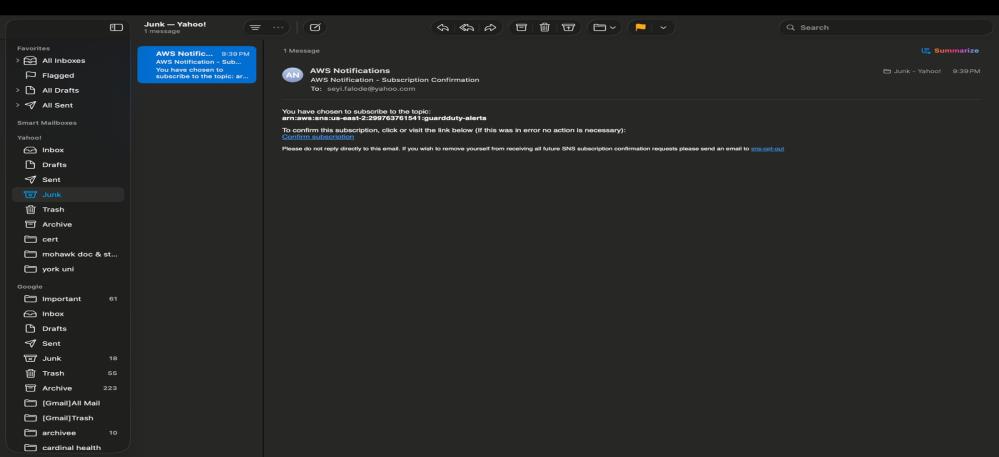
*截图 14 — Yahoo 邮箱收到的 AWS 确认电子邮件(落入垃圾邮件 — 属于预期行为)*
## 阶段 4:Lambda — 自动化修复层
Lambda 函数是响应引擎。它使用 Python 3.12 编写,接收来自 EventBridge 的 GuardDuty 发现,检查严重性,然后执行自动修复 (HIGH) 或记录和监控 (MEDIUM)。对于高严重性威胁,无需任何人盯着仪表板等待操作。
**函数详情:**
- 函数名称:`guardduty-auto-response` | 运行时:Python 3.12 | 区域:us-east-2
- 严重性 >= 7 (HIGH):将被攻陷的 EC2 标记为 `COMPROMISED` 并启动隔离
- 严重性 4–6 (MEDIUM):将发现记录到 CloudWatch,不执行破坏性操作 — 避免误报造成干扰
- 严重性 < 4 (LOW):不触发 — 在上游被 EventBridge 过滤掉
**核心代码逻辑:**
```
def lambda_handler(event, context):
detail = event.get('detail', {})
severity = detail.get('severity', 0)
resource_type = resource.get('resourceType', 'Unknown')
# HIGH severity — auto-isolate immediately
if severity >= 7:
if resource_type == 'Instance':
instance_id = resource.get('instanceDetails', {}).get('instanceId')
isolate_ec2_instance(instance_id, region) # tag as COMPROMISED + remove from rotation
# MEDIUM severity — log only, no destructive action
elif severity >= 4:
logger.info(f"MEDIUM finding: {finding_type} — analyst review required")
```
```
def isolate_ec2_instance(instance_id, region):
ec2 = boto3.client('ec2', region_name=region)
# Tag as COMPROMISED — preserves forensic state, does NOT terminate
ec2.create_tags(
Resources=[instance_id],
Tags=[
{'Key': 'SecurityStatus', 'Value': 'COMPROMISED'},
{'Key': 'IsolatedBy', 'Value': 'guardduty-auto-response'},
{'Key': 'IsolationReason','Value': 'GuardDuty HIGH severity finding'}
]
)
```
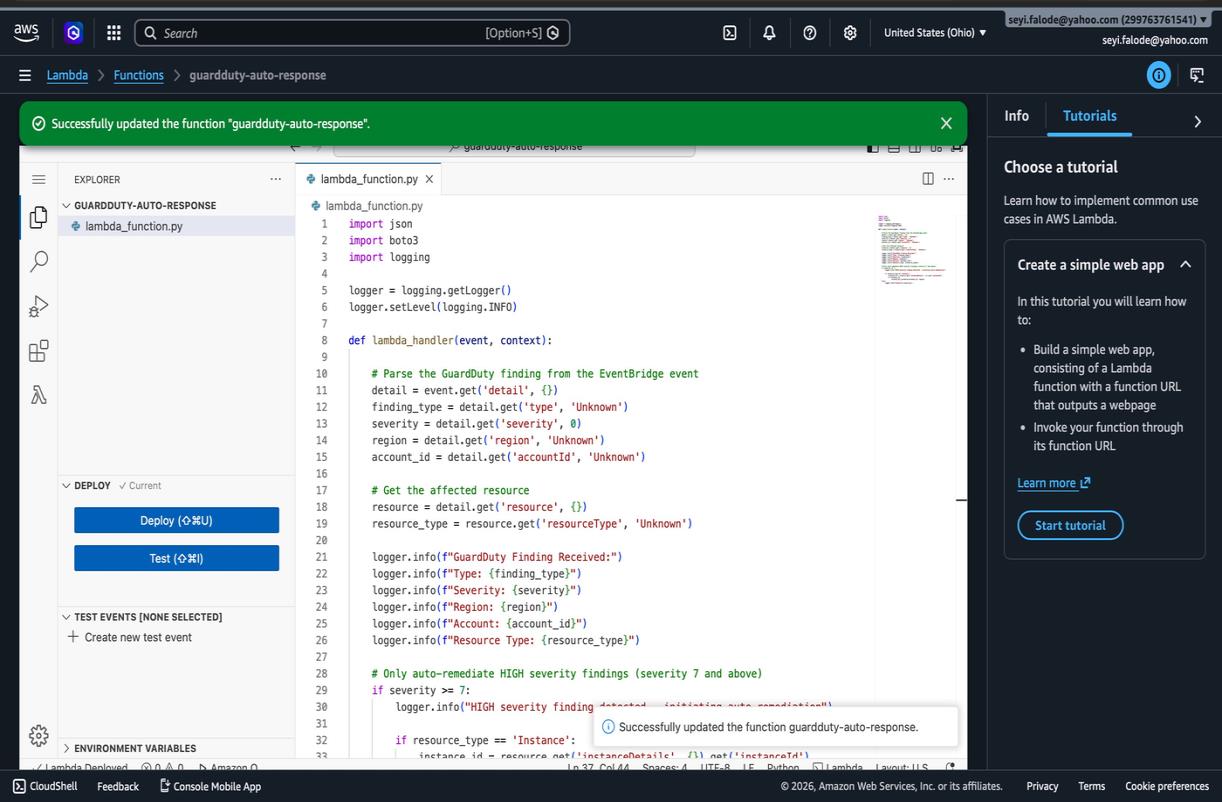
*截图 15 — Lambda 函数 guardduty-auto-response 已部署并成功更新*
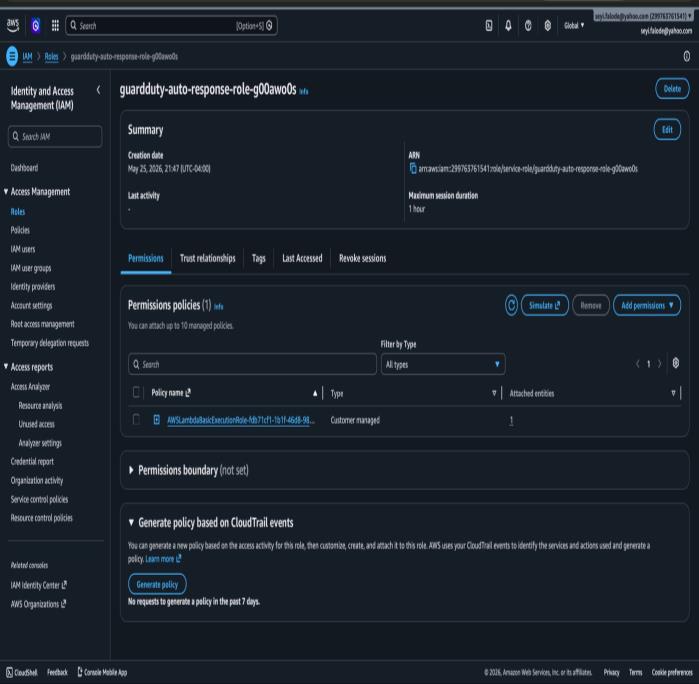
## 阶段 5:IAM — 最小权限
Lambda 执行角色配置了四项策略 —— 这是该函数运行所需的最低权限。Lambda 只能访问其完成工作所必需的内容,仅此而已。
**附加的策略:**
| 策略 | 用途 |
|---|---|
| `AWSLambdaBasicExecutionRole` | 自动创建 — 基础权限,允许 Lambda 执行并写入 CloudWatch Logs |
| `AmazonEC2FullAccess` | 允许 Lambda 在隔离期间标记和修改 EC2 实例 |
| `AmazonGuardDutyReadOnlyAccess` | 允许 Lambda 从 GuardDuty 读取发现详情 |
| `CloudWatchLogsFullAccess` | 允许 Lambda 为每次运行写入结构化执行日志 |
*截图 16 — 仅具有基础执行策略的 IAM 角色(在最小权限配置之前)*
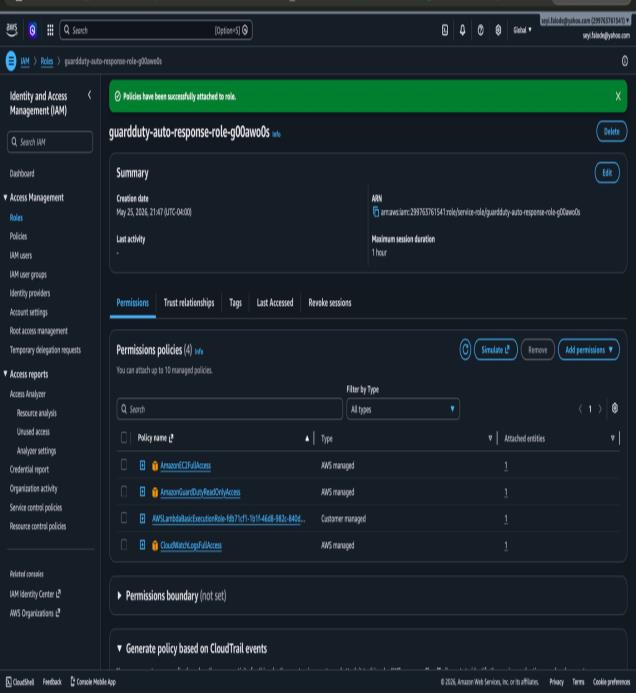
*截图 17 — 四项策略均已成功附加 — 最小权限配置完成*
## 阶段 6 & 7:CloudTrail + S3 — 审计跟踪与证据存储
CloudTrail 会捕获账户中发起的每一个 API 调用。当 Lambda 自动修复某个发现(例如标记 EC2 实例、修改安全组)时,CloudTrail 会记录确切的调用发起者、使用的角色、来源 IP 以及发生时间。这就是取证证据链。
**跟踪配置:**
- 跟踪名称:`guardduty-audit-trail` | 区域:us-east-2 | 多区域:是
- S3 存储桶:`guardduty-audit-logs-299763761541` — 在跟踪设置期间自动配置
- CloudWatch Logs 集成:已启用 — 对特定的 API 模式进行实时告警
- 日志文件验证:已启用 — 检测对存储的日志文件的篡改
- 状态:记录中
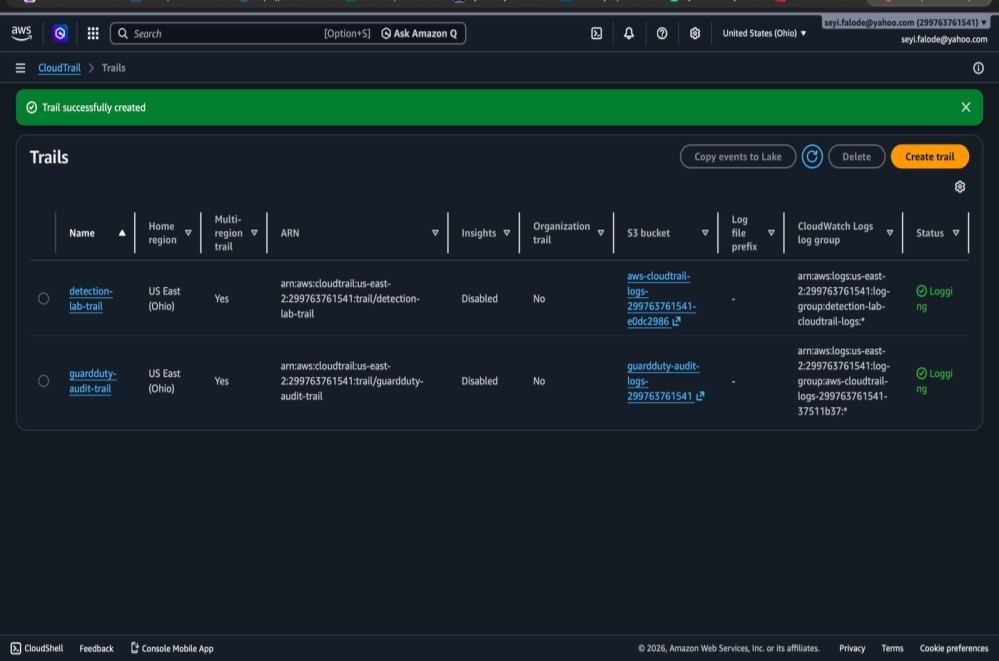
*截图 18 — CloudTrail 跟踪 guardduty-audit-trail 已创建并在 us-east-2 区域积极记录日志*
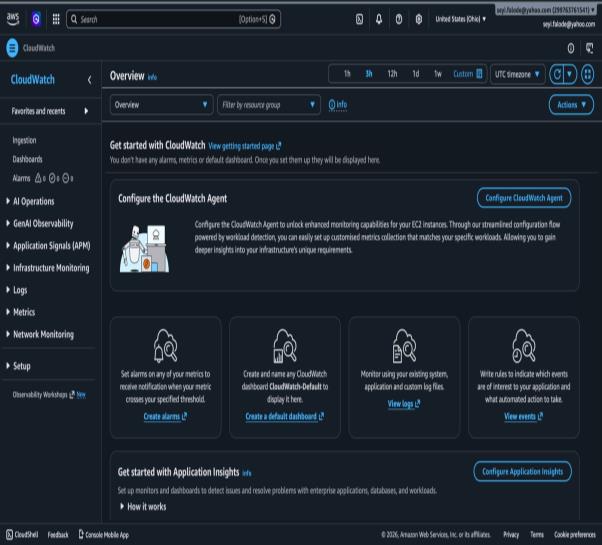
## 阶段 8:Cloud — 监控层
名为 `GuardDuty-Detection-Pipeline` 的 CloudWatch 仪表板可提供对流水线健康状况的实时可见性。通过它可以验证流水线是否正常工作、识别日志投递中的缺口,并检测是否有任何组件停止运行。
**仪表板指标:**
- `IncomingBytes` — 流入 CloudTrail 日志组的日志数据量
- `IncomingLogEvents` — 每分钟接收的单个日志事件数
- 受监控的日志组:`aws-cloudtrail-logs-299763761541-37511b37` 和 `detection-lab-cloudtrail-logs`
*截图 19 — Amazon CloudWatch 主页*
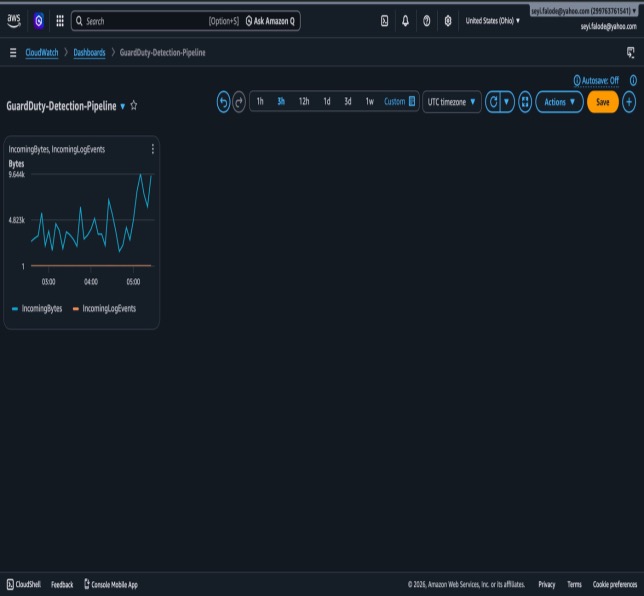
*截图 20 — GuardDuty-Detection-Pipeline 的 CloudWatch 仪表板 — 一览流水线健康状况*
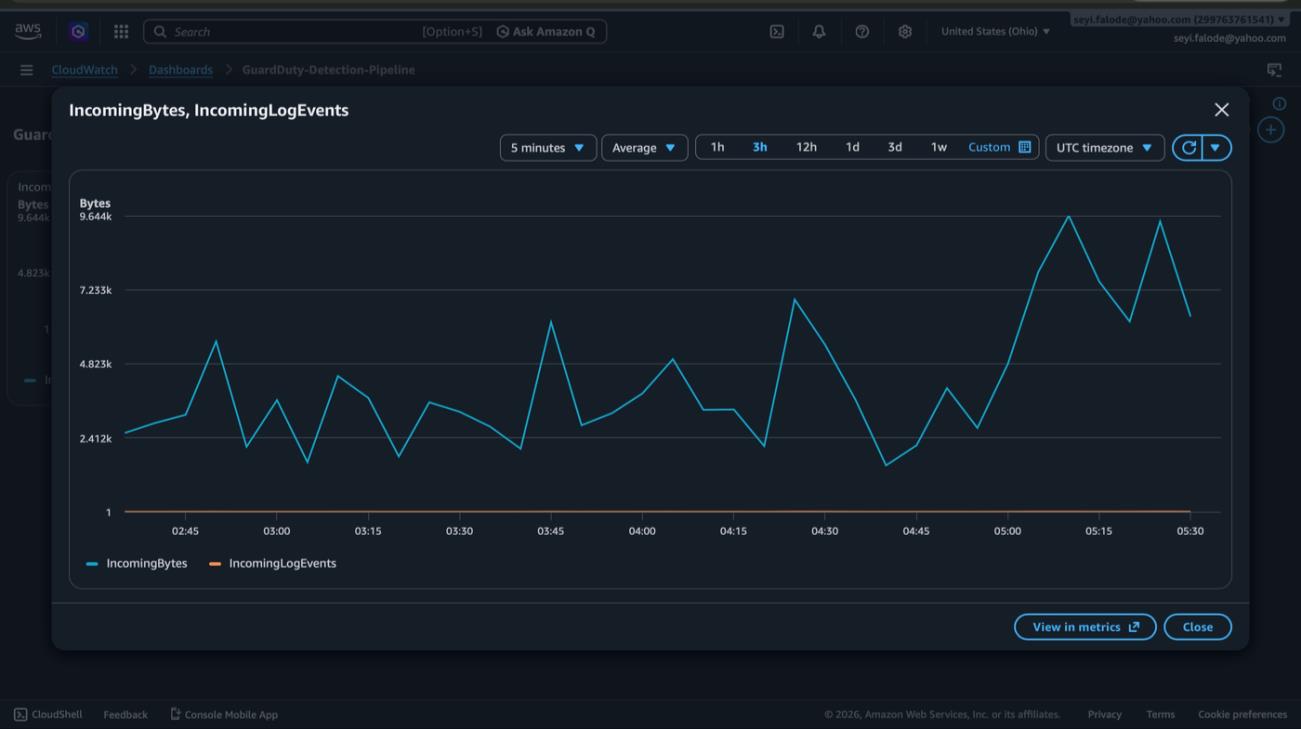
*截图 21 — 实时图表显示 CloudTrail 的 IncomingBytes 和 IncomingLogEvents 活动*
## 端到端流水线测试
在将所有八个组件串联完毕后,通过生成 GuardDuty 样本发现并观察从检测到电子邮件投递的完整链条,对流水线进行了测试。
**测试方法:**
- 导航至 GuardDuty 设置 → 点击 **生成样本发现 (Generate sample findings)**
- GuardDuty 会为所有严重性级别的每一种受支持的发现类型创建一个样本发现
- 观察发现流经 EventBridge → 同时发送至 Lambda + SNS
**结果:**
| 指标 | 结果 |
|---|---|
| 生成的样本发现总数 | 遍布所有严重性级别和发现类型的 391 个发现 |
| EventBridge 触发 | 为所有 MEDIUM 和 HIGH 发现(严重性 >= 4)触发 |
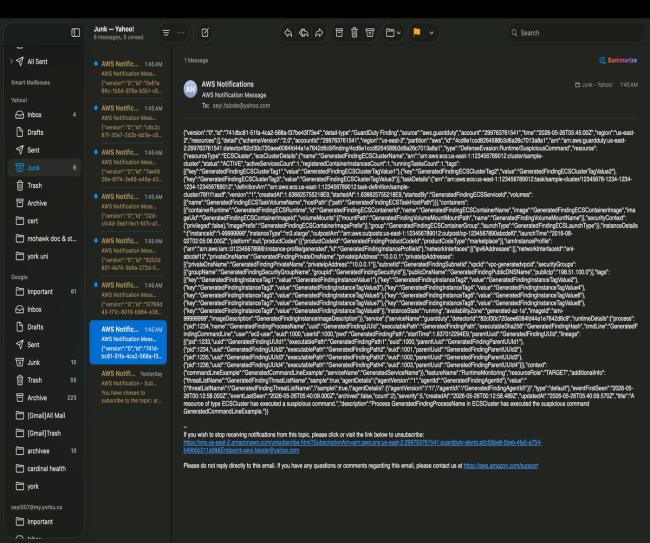
| 收到的 SNS 告警邮件 | 几秒钟内在 seyi.falode@yahoo.com 收到 8 封邮件 |
| 告警载荷 | 完整的 JSON 发现载荷,包括资源详情、时间戳、MITRE 映射 |
| Lambda 调用 | 针对 HIGH 严重性的发现进行调用 — 在 CloudWatch 中确认了执行日志 |
**告警中观察到的发现类型:**
| 发现类型 | MITRE 战术 |
|---|---|
| `DefenseEvasion:Kubernetes/SuccessfulAnonymousAccess` | 防御规避 |
| `DefenseEvasion:Runtime/FilelessExecution` | 防御规避 |
| `PrivilegeEscalation:Runtime/ContainerMountsHostDirectory` | 权限提升 |
| `Trojan:Runtime/BlackholeDNSTraffic` | 命令与控制 |
| `Persistence:Runtime/SuspiciousCommand` | 持久化 |
| `Execution:ECSCluster/MaliciousFile` (EICAR 测试文件) | 执行 |
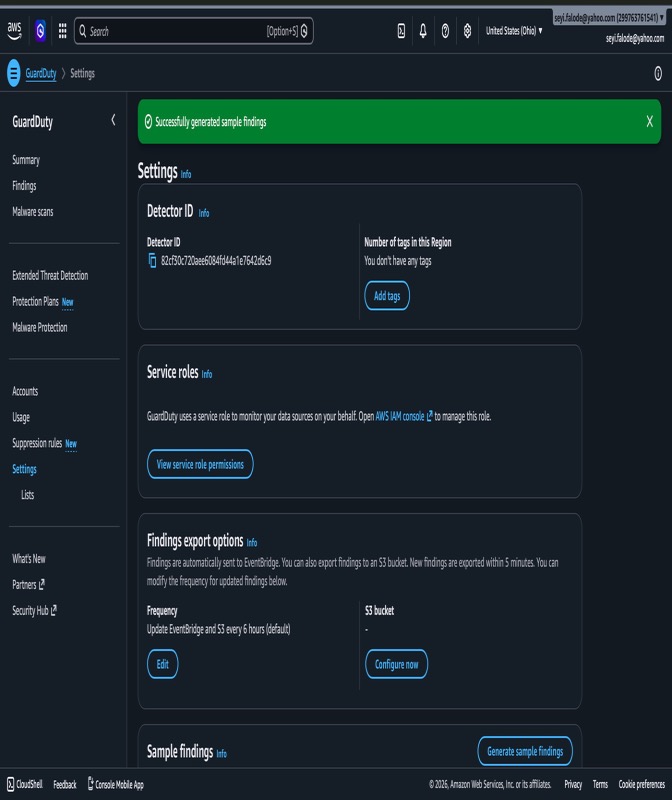
*截图 22 — GuardDuty 设置 — 样本发现已成功生成*
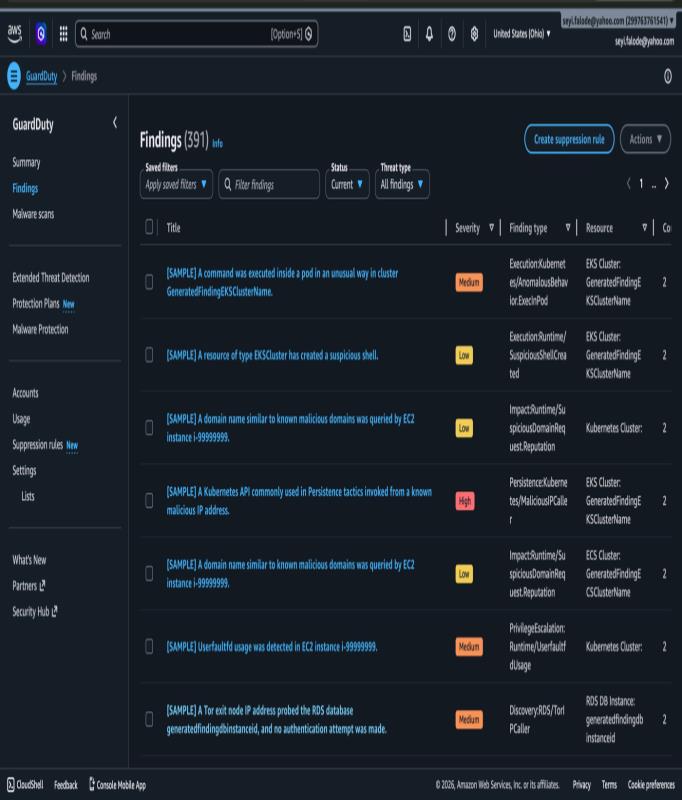
*截图 23 — GuardDuty Findings 仪表板显示 391 个发现,包括 HIGH 和 MEDIUM 严重性级别*
*截图 24 — 收到的 SNS 告警邮件 — 包含完整 JSON 载荷的 DefenseEvasion 发现*
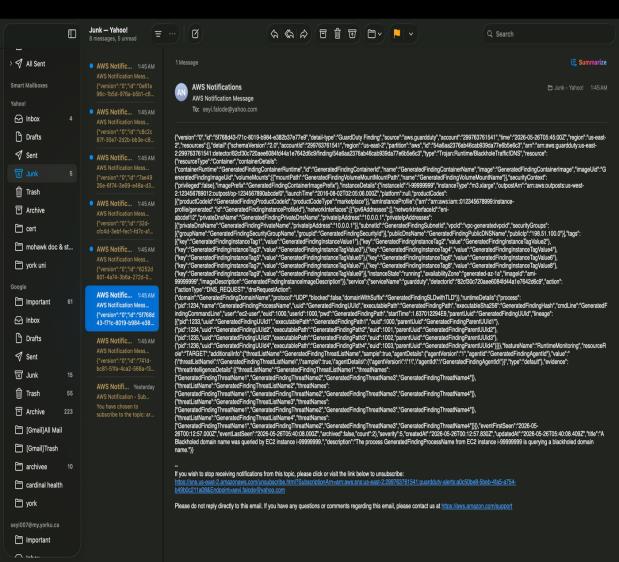
*截图 25 — 收到的 SNS 告警邮件 — 恶意软件扫描 / EICAR 测试文件检测*
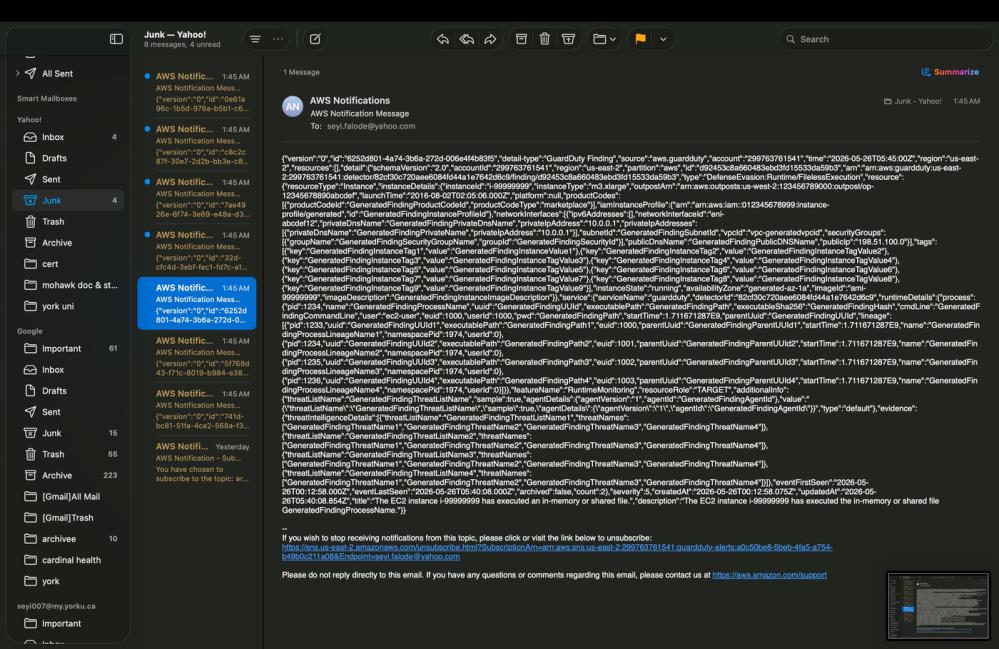
*截图 26 — 收件箱中的多封 AWS 通知确认完整的流水线已实现端到端正常运行*
## 仓库结构
```
aws-guardduty-threat-detection-pipeline/
├── lambda/
│ └── lambda_function.py # Python 3.12 — auto-remediation function
├── eventbridge/
│ └── rule-pattern.json # EventBridge rule — severity filter + dual targets
├── screenshots/ # 26 screenshots from the live AWS session
│ ├── screenshot-01-guardduty-summary-dashboard.jpg
│ ├── screenshot-02-eventbridge-homepage.jpg
│ ├── ... (26 total)
│ └── screenshot-26-multiple-alerts-inbox-pipeline-confirmed.jpg
├── docs/
│ └── AWS_GuardDuty_Pipeline_v2.pdf # Full lab report
└── README.md
```
## 如何重现此流水线
**前置条件:** 已启用账单功能的 AWS 账户、IAM 管理员用户、已配置的 AWS CLI
```
# 1. 启用 GuardDuty
# AWS Console → GuardDuty → Get Started → 启用 GuardDuty
# Region: us-east-2
# 2. 创建 SNS topic 和电子邮件订阅
aws sns create-topic --name guardduty-alerts --region us-east-2
aws sns subscribe \
--topic-arn arn:aws:sns:us-east-2::guardduty-alerts \
--protocol email \
--notification-endpoint your@email.com \
--region us-east-2
# 通过电子邮件确认订阅
# 3. 部署 Lambda 函数
# AWS Console → Lambda → Create function
# Name: guardduty-auto-response | Runtime: Python 3.12
# 将 lambda/lambda_function.py 粘贴到内联编辑器中
# Deploy
# 4. 将 IAM policies 附加到 Lambda execution role
# IAM → Roles → guardduty-auto-response-role → Add permissions:
# - AmazonEC2FullAccess
# - AmazonGuardDutyReadOnlyAccess
# - CloudWatchLogsFullAccess
# 5. 创建 EventBridge rule
# EventBridge → Rules → Create rule
# Name: guardduty-high-severity-response
# Event pattern: 从 eventbridge/rule-pattern.json 粘贴
# Targets: SNS topic (guardduty-alerts) + Lambda (guardduty-auto-response)
# 6. 创建 CloudTrail audit trail
aws cloudtrail create-trail \
--name guardduty-audit-trail \
--s3-bucket-name guardduty-audit-logs- \
--is-multi-region-trail \
--enable-log-file-validation \
--region us-east-2
aws cloudtrail start-logging --name guardduty-audit-trail --region us-east-2
# 7. 构建 CloudWatch dashboard
# CloudWatch → Dashboards → Create dashboard
# Name: GuardDuty-Detection-Pipeline
# Add widgets: 来自 CloudTrail log groups 的 IncomingBytes + IncomingLogEvents
# 8. 测试 pipeline
# GuardDuty → Settings → Generate sample findings
# Watch: EventBridge 触发 → Lambda 执行 → 收到 SNS 电子邮件
```
## 掌握的技能
**检测工程**
- 在没有预置技术栈的情况下,从零开始设计了完整的威胁检测生命周期
- 实施了基于严重性的分流逻辑,以将信号与噪声区分开,防止告警疲劳
- 将 MITRE ATT&CK 框架上下文应用于 GuardDuty 的发现类型
- 调整了自动化响应阈值,防止误报对工作负载造成破坏
**云安全 (AWS)**
- GuardDuty 威胁情报、发现分流以及样本发现生成
- 使用 JSON 事件模式严重性过滤实现 EventBridge 事件驱动自动化
- 使用 boto3 SDK 和 Python 3.12 进行 Lambda 无服务器函数开发
- 具有已确认电子邮件订阅的 SNS 发布/订阅告警架构
- 针对跨服务访问的 IAM 最小权限角色和策略配置
- 具有 CloudWatch Logs 集成和日志文件验证的 CloudTrail 审计日志记录
- 通过 CloudTrail 跟踪设置配置的 S3 取证证据存储
**安全自动化与 SOAR**
- 针对高严重性发现实现零人工干预的自动化 EC2 隔离
- 从检测到修复的端到端流水线在几秒钟内执行完毕
- 通过 CloudWatch Logs 对每一个自动化动作进行结构化日志记录
**事件响应**
- 构建了完整的取证证据链:CloudTrail → S3 → CloudWatch
- 在 CloudTrail 上实施了防篡改的日志文件验证
- 隔离工作流保留了实例状态以供取证分析,而不是直接终止
*Oluwaseyi Michael Falode · 网络安全与云安全工程师 · 多伦多,安大略省 · 2026年5月*
*linkedin.com/in/oluwaseyi-falode · github.com/seyifalode-cmd*
标签:AMSI绕过, AWS, DPI, PB级数据处理, Serverless, 威胁检测, 安全运维, 自动化响应, 速率限制