prasadDPR/ai-infrastructure-monitor
GitHub: prasadDPR/ai-infrastructure-monitor
企业级AI驱动型基础设施监控器,自动检测事件并提供AI分析。
Stars: 0 | Forks: 0
# 企业级 AI 驱动型基础设施监控器
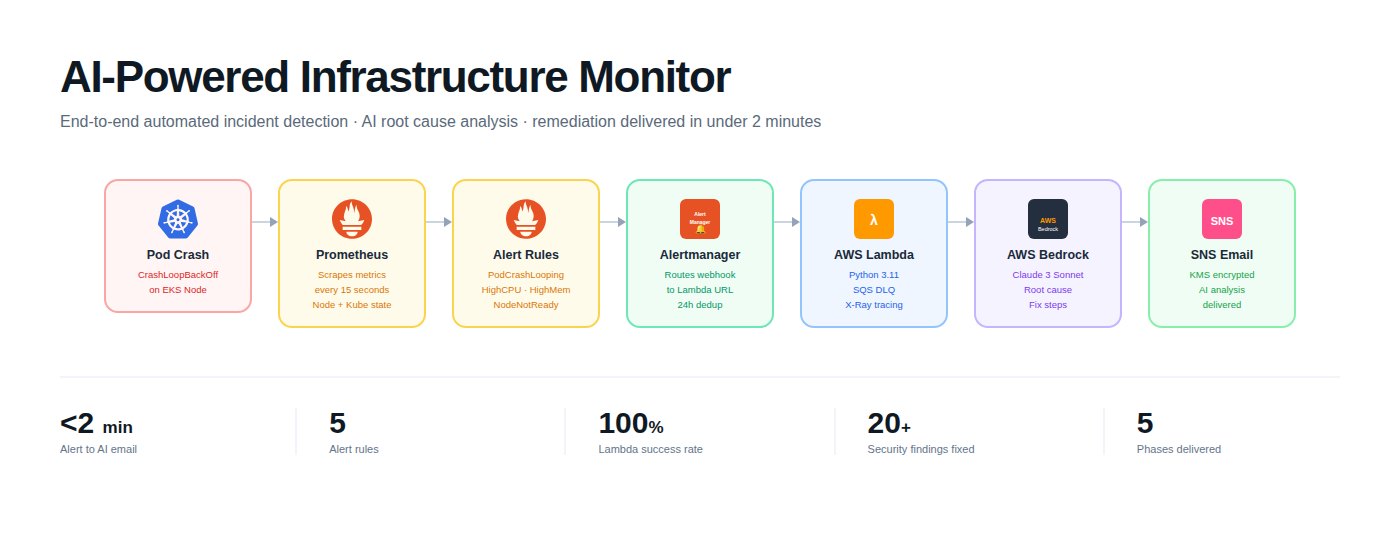
当基础设施发生事件时,该系统会自动检测,并通过 AWS Bedrock 使用 Claude AI 进行分析,在不到 2 分钟内向值班工程师提供根本原因分析和精确的修复步骤。
## 解决的合规标准
| 标准 | 本项目如何解决它 |
|------|------------------|
| NHS DSP 工具包 | KMS 加密、CloudTrail 审计日志、私有网络拓扑 |
| PCI-DSS | 加密机密、完整的 API 审计跟踪、网络隔离 |
| FCA 要求 | 不可变审计日志、访问控制、CI 中的安全扫描 |
| ISO 27001 | 最小权限 IAM、静态加密、事件响应自动化 |
安全架构——KMS 加密、CloudTrail、私有子网和强制 CI 安全门——代表了任何受监管行业的最佳实践。
## 工作原理
```
Infrastructure incident occurs (pod crash, high CPU, node failure)
│
├── Promtail collects logs from all pods → ships to Loki
│
├── Node Exporter + Kube State Metrics → Prometheus scrapes every 15s
│ → Alert rule threshold exceeded for 5 minutes
│ → Alert sent to Alertmanager
│
├── Alertmanager routes alert → Lambda webhook
│ → Lambda calls AWS Bedrock (Claude 3 Sonnet)
│ → AI generates: root cause + immediate fix + prevention
│ → SNS delivers email to on-call engineer
│
└── Engineer opens Grafana
→ Dashboard shows metrics at time of incident
→ Loki Explore shows exact log lines from affected pod
```
## 架构
```
AWS eu-west-2
└── VPC (10.0.0.0/16)
├── Public subnets — load balancers, NAT gateway
└── Private subnets — EKS worker nodes (not internet-facing)
└── EKS Cluster (Kubernetes v1.32)
├── Prometheus — metrics collection + alerting
├── Alertmanager — alert routing + deduplication
├── Grafana — dashboards + log exploration
├── Loki — log storage (10Gi EBS)
├── Promtail — log collection (1 per node)
└── Node Exporter — node-level metrics
Alert Pipeline
└── Alertmanager → Lambda → AWS Bedrock (Claude AI) → SNS → Email
Supporting infrastructure
├── Terraform — all AWS resources as code
├── ArgoCD — GitOps deployments via GitHub
├── GitHub Actions — CI/CD with security scanning
├── CloudTrail — full AWS API audit logging (all regions)
└── KMS — encryption at rest for secrets and audit logs
```
## 技术栈
| 层 | 技术 |
|----|-----------|
| 云 | AWS eu-west-2 (伦敦) |
| 容器编排 | Amazon EKS (Kubernetes v1.32) |
| 基础设施即代码 | Terraform |
| GitOps | ArgoCD |
| CI/CD | GitHub Actions |
| 指标收集 | Prometheus + Node Exporter + Kube State Metrics |
| 仪表板 | Grafana |
| 日志收集 | Promtail (DaemonSet — 每个节点 1 个) |
| 日志存储 | Loki 3.x 与 EBS 持久化 |
| 告警路由 | Alertmanager |
| AI 分析 | AWS Bedrock — Claude 3 Sonnet |
| 无服务器计算 | AWS Lambda (Python 3.11) |
| 通知 | AWS SNS |
| 安全扫描 | Checkov + tfsec (发现问题时阻止合并) |
| 审计日志 | AWS CloudTrail (多区域) |
| 加密 | AWS KMS (EKS 机密 + CloudTrail 日志) |
| 存储 | AWS EBS gp2 通过 EBS CSI 驱动程序 |
## 截图
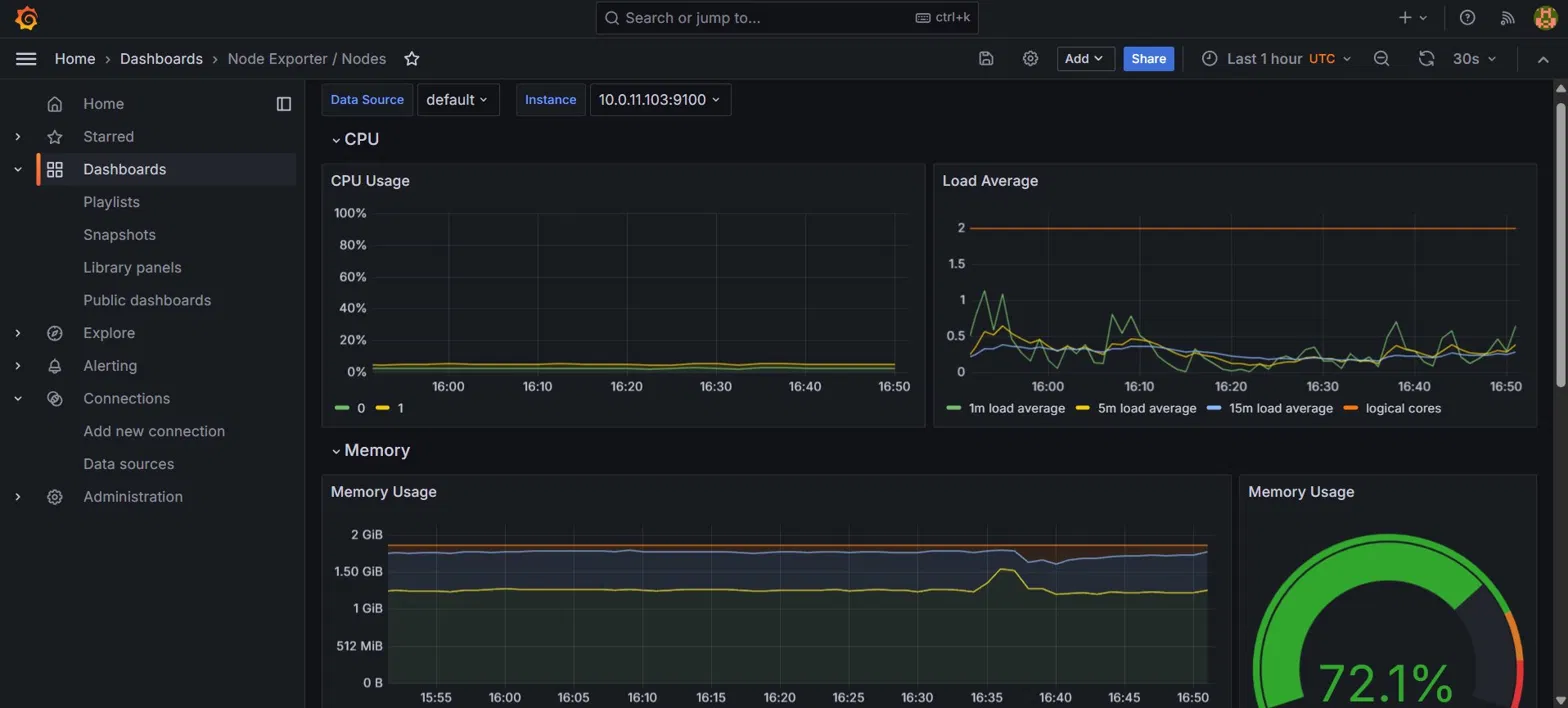
### Grafana — 实时节点指标
所有 3 个工作节点的 CPU 使用率、内存消耗和平均负载——每 30 秒更新一次。
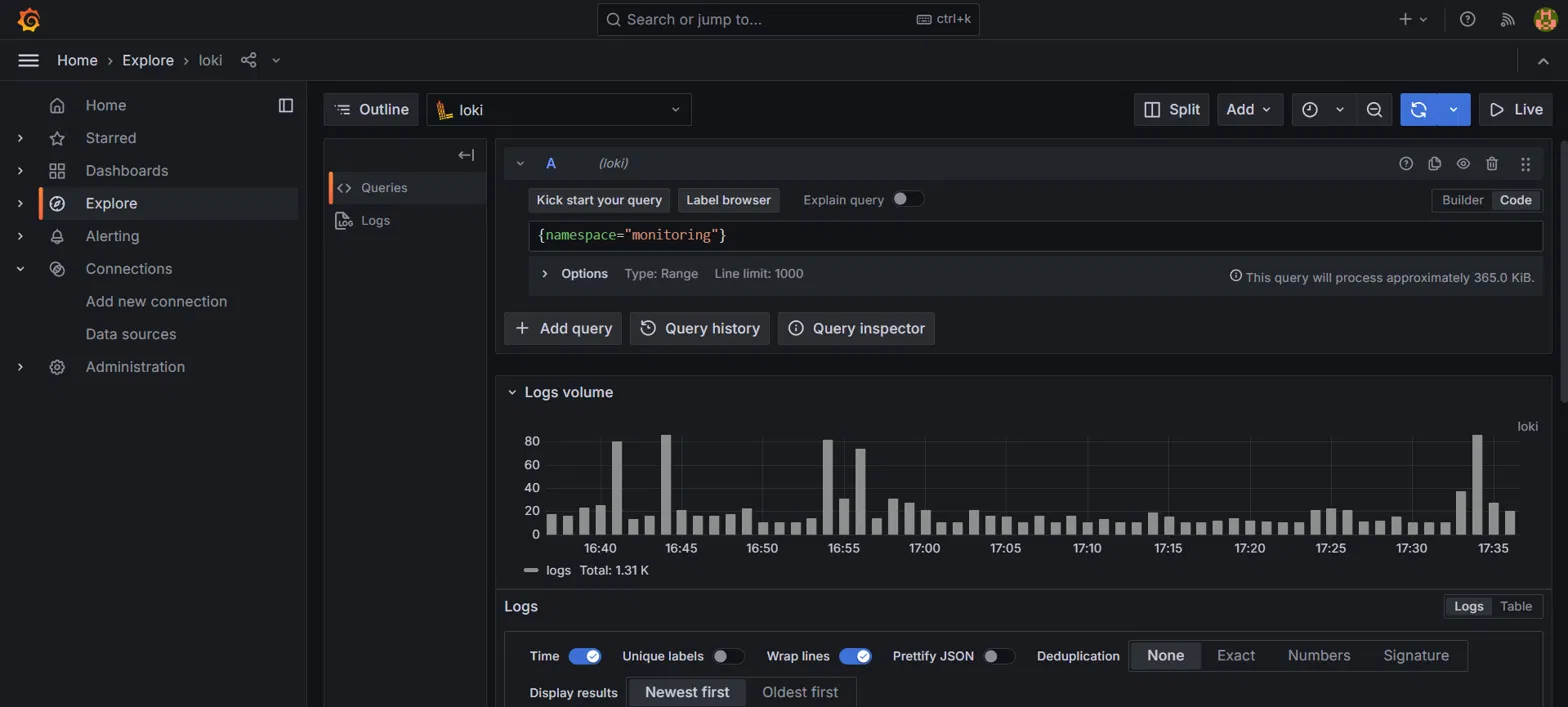
### Loki — 实时日志探索
从监控命名空间收集的 1,310 条日志行,可按 pod、命名空间和容器进行查询。
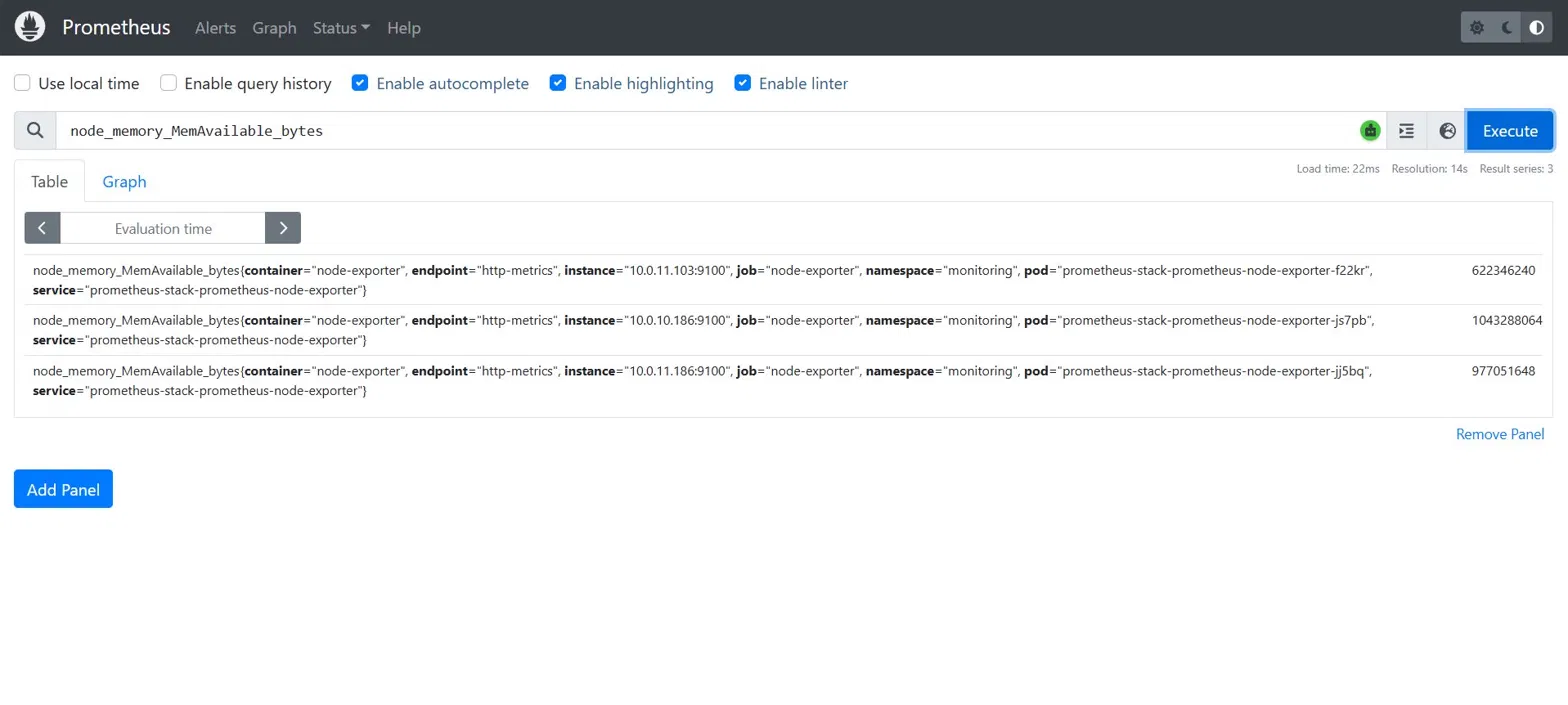
### Prometheus — 指标查询
每 15 秒通过 Node Exporter 从所有 3 个节点抓取的实时可用内存数据。
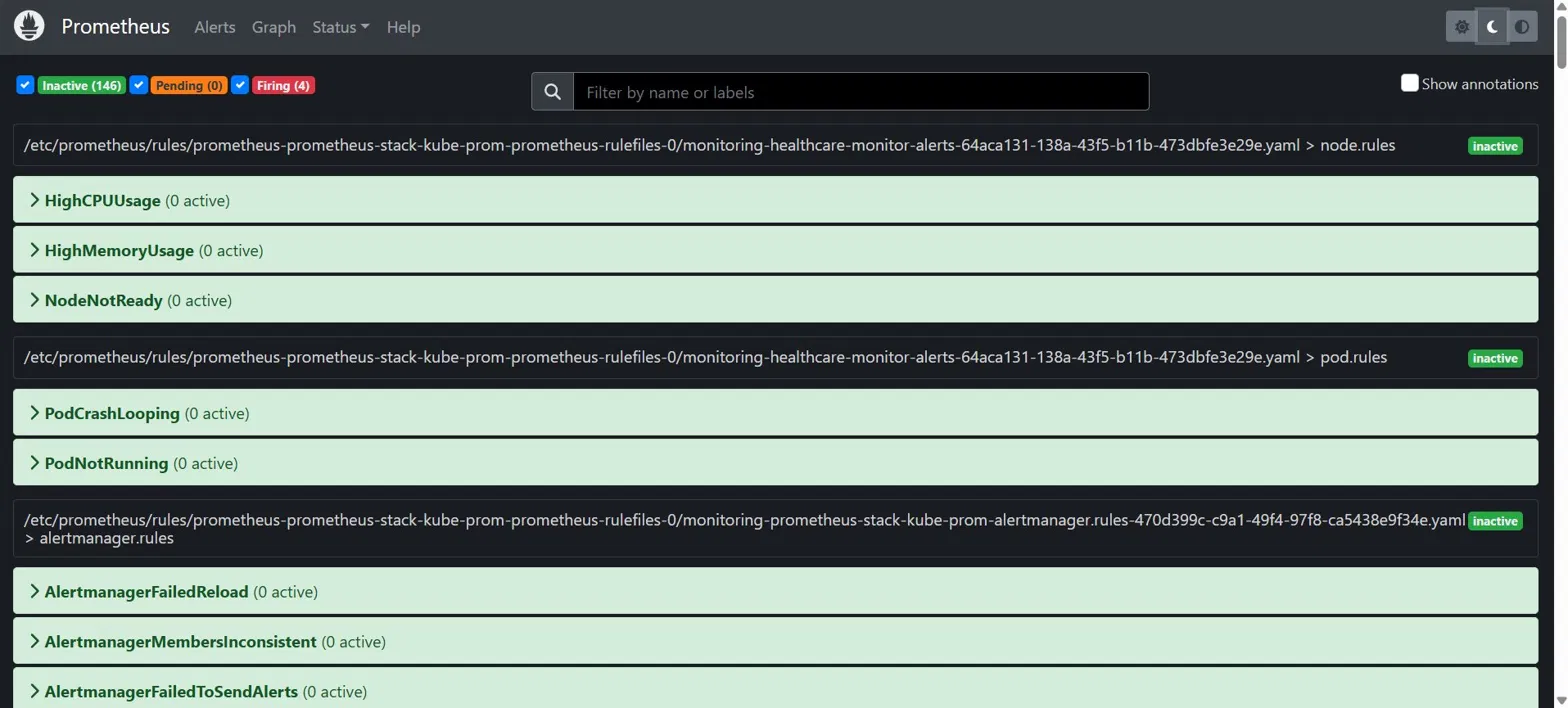
### Prometheus — 告警规则
所有 5 个自定义告警规则处于活动状态:PodCrashLooping、HighCPUUsage、HighMemoryUsage、NodeNotReady、PodNotRunning。
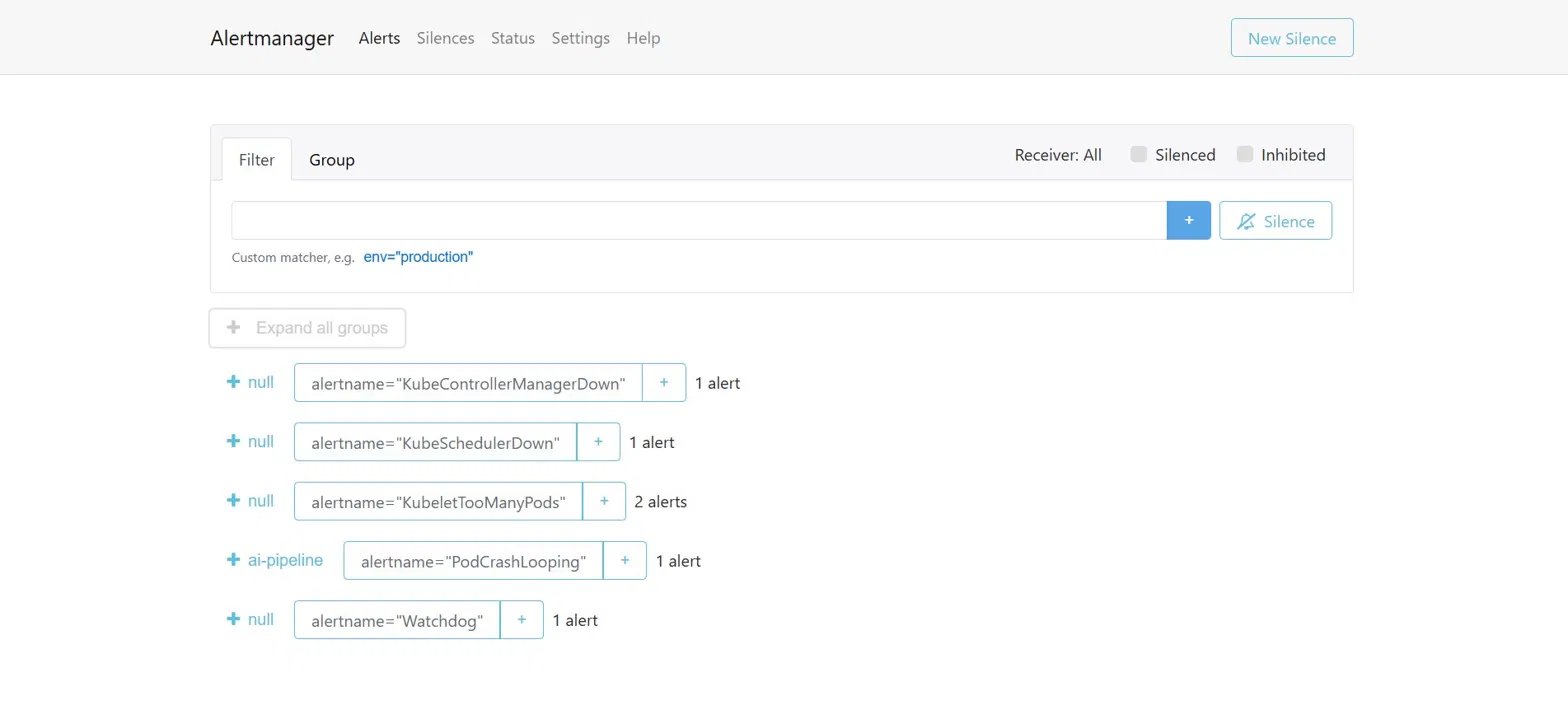
### Alertmanager — 路由
PodCrashLooping 路由到 ai-pipeline 接收器。基础设施误报静默到 null。
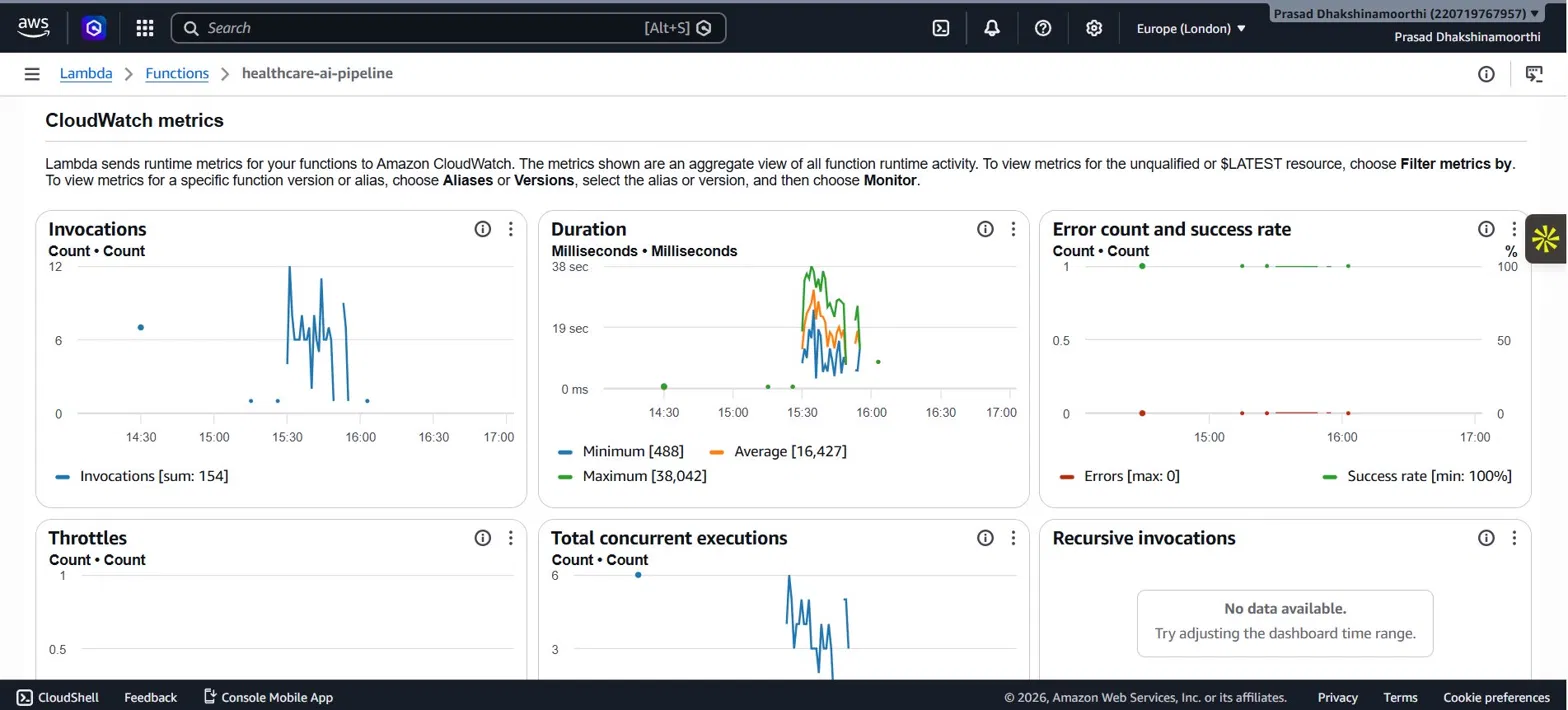
### Lambda — CloudWatch 指标
154 次调用,100% 成功率,平均 16 秒执行时间。
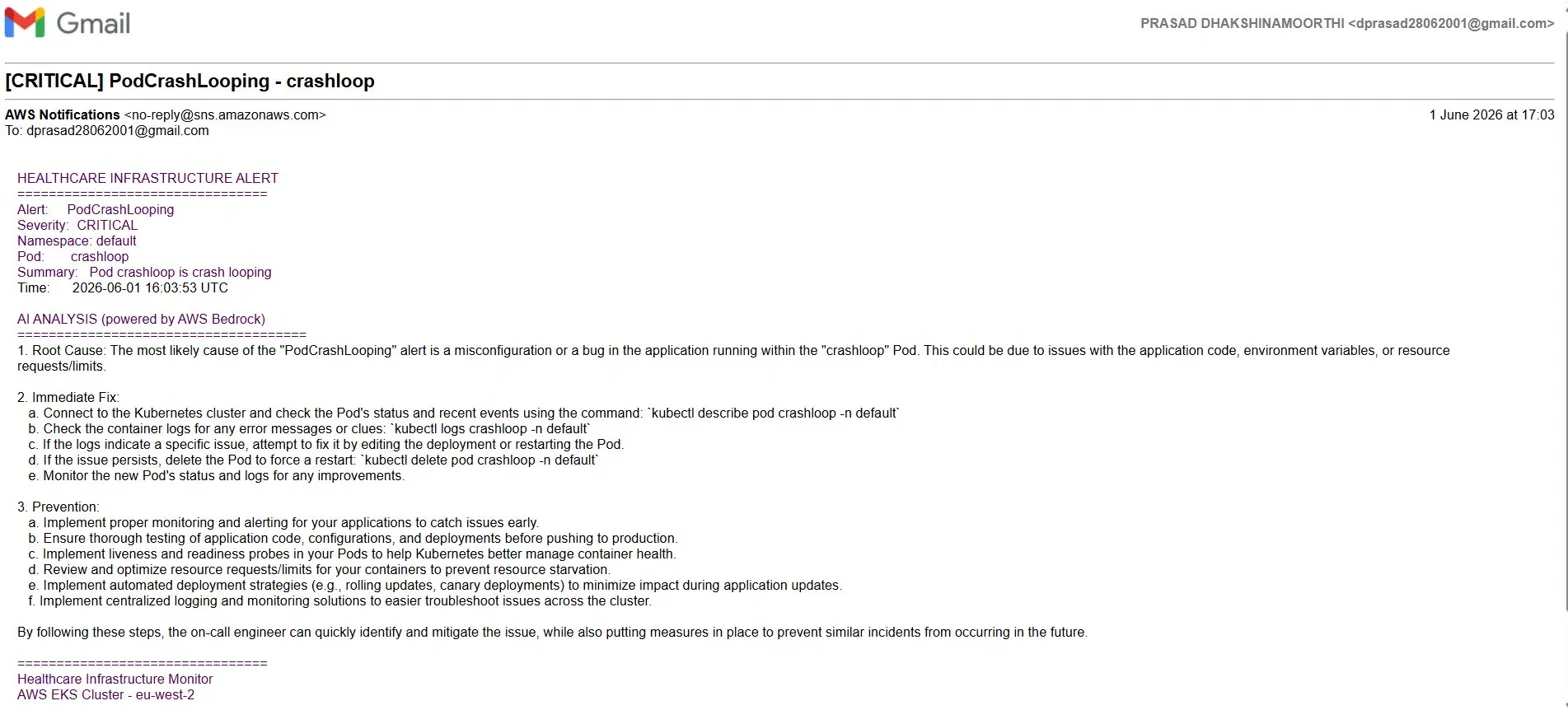
### AI 分析电子邮件 — 最终结果
通过电子邮件自动提供根本原因、立即修复步骤和预防建议。
## 告警规则
| 告警 | 条件 | 严重性 | 操作 |
|------|------|--------|------|
| PodCrashLooping | 重启率 > 0,持续 5 分钟 | 严重 | AI 分析电子邮件 |
| HighCPUUsage | 节点 CPU > 80%,持续 5 分钟 | 警告 | AI 分析电子邮件 |
| HighMemoryUsage | 节点内存 > 85%,持续 5 分钟 | 警告 | AI 分析电子邮件 |
| NodeNotReady | 节点未就绪,持续 2 分钟 | 严重 | AI 分析电子邮件 |
| PodNotRunning | Pod 处于 Failed/Unknown 状态,持续 2 分钟 | 警告 | AI 分析电子邮件 |
## AI 管道详情
Lambda 接收 Alertmanager webhook 并构建包含告警名称、严重性、命名空间、pod 和描述的提示。Claude 分析上下文并返回结构化响应:
```
[CRITICAL] PodCrashLooping - crashloop
━━━━━━━━━━━━━━━━━━━━━━━━━━━━━━━━━━━━━━
Alert: PodCrashLooping
Severity: CRITICAL
Namespace: default
Pod: crashloop
Time: 2026-06-01 16:03:53 UTC
AI ANALYSIS (powered by AWS Bedrock)
━━━━━━━━━━━━━━━━━━━━━━━━━━━━━━━━━━━━
Root Cause:
The pod is exiting immediately with a non-zero exit code, indicating
the container command is failing on startup. Most likely causes:
misconfigured entrypoint, missing environment variables, or OOMKill.
Immediate Fix:
a. kubectl describe pod crashloop -n default
b. kubectl logs crashloop -n default --previous
c. Fix the underlying issue (config, image, resources)
d. kubectl delete pod crashloop -n default
Prevention:
- Add liveness and readiness probes
- Set memory/CPU requests and limits
- Use rolling deployment strategies
- Implement pre-deployment smoke tests
```
## 安全架构
```
Network isolation
└── All worker nodes in private subnets
— no direct internet access, outbound only via NAT
Encryption
├── KMS key encrypts all Kubernetes secrets at rest
├── KMS key encrypts all CloudTrail logs
└── EBS volumes encrypted at rest
Audit logging
└── CloudTrail records every AWS API call
— multi-region, log file validation enabled
— stored in dedicated S3 bucket with public access blocked
CI/CD security gates
├── Checkov scans Terraform on every push
├── tfsec scans Terraform on every push
└── soft_fail: false — merges blocked on security findings
IAM
└── Lambda role scoped to minimum permissions:
bedrock:InvokeModel, sns:Publish, logs:PutLogEvents only
```
## 部署方法
### 先决条件
- 拥有程序性访问权限的 AWS 账户(eu-west-2)
- Terraform v1.0+、kubectl、helm、eksctl、argocd CLI
- 拥有个人访问令牌的 GitHub 账户
### 部署
```
# 克隆
git clone https://github.com/prasadDPR/ai-infrastructure-monitor.git
cd ai-infrastructure-monitor
# 为 Terraform 状态创建 S3 存储桶
aws s3api create-bucket \
--bucket your-tfstate-bucket-name \
--region eu-west-2 \
--create-bucket-configuration LocationConstraint=eu-west-2
# 使用您的存储桶名称更新 terraform/backend.tf
# 使用您的电子邮件更新 terraform/environments/prod/main.tf
# 部署基础设施(15-20分钟)
cd terraform/environments/prod
terraform init
terraform apply
# 连接 kubectl
aws eks update-kubeconfig --name healthcare-monitor --region eu-west-2
# 安装 ArgoCD
kubectl create namespace argocd
kubectl apply -n argocd -f https://raw.githubusercontent.com/argoproj/argo-cd/stable/manifests/install.yaml --server-side --force-conflicts
# 部署监控堆栈
kubectl apply -f helm/argocd-apps/prometheus-app.yaml
kubectl apply -f helm/argocd-apps/loki-app.yaml
kubectl apply -f helm/argocd-apps/promtail-app.yaml
kubectl apply -f alerts/alerting-rules.yaml
# 访问 Grafana
kubectl port-forward svc/prometheus-stack-grafana -n monitoring 3000:80
# http://localhost:3000
```
### 销毁
```
cd terraform/environments/prod
terraform destroy
```
## 成本
| 资源 | 运行成本 | 销毁成本 |
|------|---------|----------|
| EKS 集群 | ~£0.10/小时 | £0 |
| 3x t3.small 节点 | ~£0.05/小时 | £0 |
| NAT 网关 | ~£0.05/小时 | £0 |
| EBS 10Gi 卷 | ~£0.10/天 | £0 |
| Lambda + Bedrock | ~£0.01/告警 | £0 |
| CloudTrail + SNS | 免费层 | £0 |
| **总活跃** | **~£1.50/天** | |
| **总空闲** | **~£0.10/天** | |
当不活跃时销毁集群。重建需要 20 分钟。
## 项目结构
```
.
├── terraform/
│ ├── modules/
│ │ ├── vpc/ — VPC, subnets, NAT, internet gateway
│ │ ├── eks/ — EKS cluster, node groups, IAM, KMS, EBS CSI
│ │ ├── lambda/ — Lambda function, SNS topic, IAM role
│ │ └── security/ — CloudTrail, KMS, S3 audit bucket
│ └── environments/
│ └── prod/ — production environment wiring
├── helm/
│ ├── prometheus/ — kube-prometheus-stack values
│ ├── loki/ — Loki 3.x values
│ └── argocd-apps/ — ArgoCD Application manifests
├── alerts/
│ ├── alerting-rules.yaml — Prometheus PrometheusRule
│ └── alertmanager-config.yaml — Alertmanager routing config
├── lambda/
│ └── ai_pipeline.py — alert processing + Bedrock + SNS
└── .github/
└── workflows/
└── terraform.yml — security scan + plan + apply pipeline
```
## 作者
**Prasad Dhakshinamoorthi**
莱斯特,英国
[GitHub](https://github.com/prasadDPR) · [LinkedIn](https://www.linkedin.com/in/prasad2806/)
## 许可证
MIT
标签:AI 响应, ArgoCD, AWS 服务, EKS, FCA 要求, Grafana, ISO 27001, Lambda, Loki, NHS DSP Toolkit, PCI-DSS, 云原生监控, 人工智能安全, 加密, 合规性, 告警管理, 基础设施监控, 开源框架, 持续集成, 最佳实践, 漏洞利用检测, 漏洞扫描器, 网络隔离, 自动化运维, 自定义请求头, 逆向工具