Ngenzipack/intelligent-security-alert-triage-engine
GitHub: Ngenzipack/intelligent-security-alert-triage-engine
基于本地 LLaMA 3 模型的安全告警自动化分诊引擎,通过 MITRE 丰富和风险评分帮助 SOC 团队缓解告警疲劳。
Stars: 0 | Forks: 0
# 智能安全告警分诊引擎
这是一个生产级风格的概念验证(POC),旨在利用本地 LLM 进行分诊,从而减少 SOC 的告警疲劳。
## 项目存在的原因
安全团队常常面临告警疲劳:SIEM 告警量巨大,而分析师的时间有限。本项目展示了一个实用的分诊 pipeline,它接收原始告警,将其标准化,执行 LLM 辅助分析,结合威胁上下文丰富结果,并输出分析师可直接使用的结果。
## 项目定位
本仓库被特意定位为一个**概念验证(POC)**,但在设计上融入了面向生产环境的考量:
- 类型化的数据契约
- LLM 不可用时的确定性降级方案
- 结构化日志
- 审计持久化
- 单元/集成测试和 CI
它不是一个经过认证的生产级 SOC 平台。
## 验证产物
- 项目报告:[`docs/Intelligent_Security_Alert_Triage_Engine_Project_Report.docx`](docs/Intelligent_Security_Alert_Triage_Engine_Project_Report.docx)
- 补丁前后对比报告:[`REPORT_BEFORE_AFTER_PATCH.md`](REPORT_BEFORE_AFTER_PATCH.md)
- 完整功能仪表盘截图:`screenshots/full-capability/`
- 补丁验证截图:`screenshots/report/`
## 生产就绪打包
本仓库被准备为一个生产风格的项目包,具有以下特点:
- 明确的架构和数据契约
- 防御性运行时行为和平滑的降级模式
- 结构化日志和可审计存储
- CI 门禁(lint + 测试)和可复现的验证证据
- 带有截图证明的补丁前后对比报告
## 展示截图
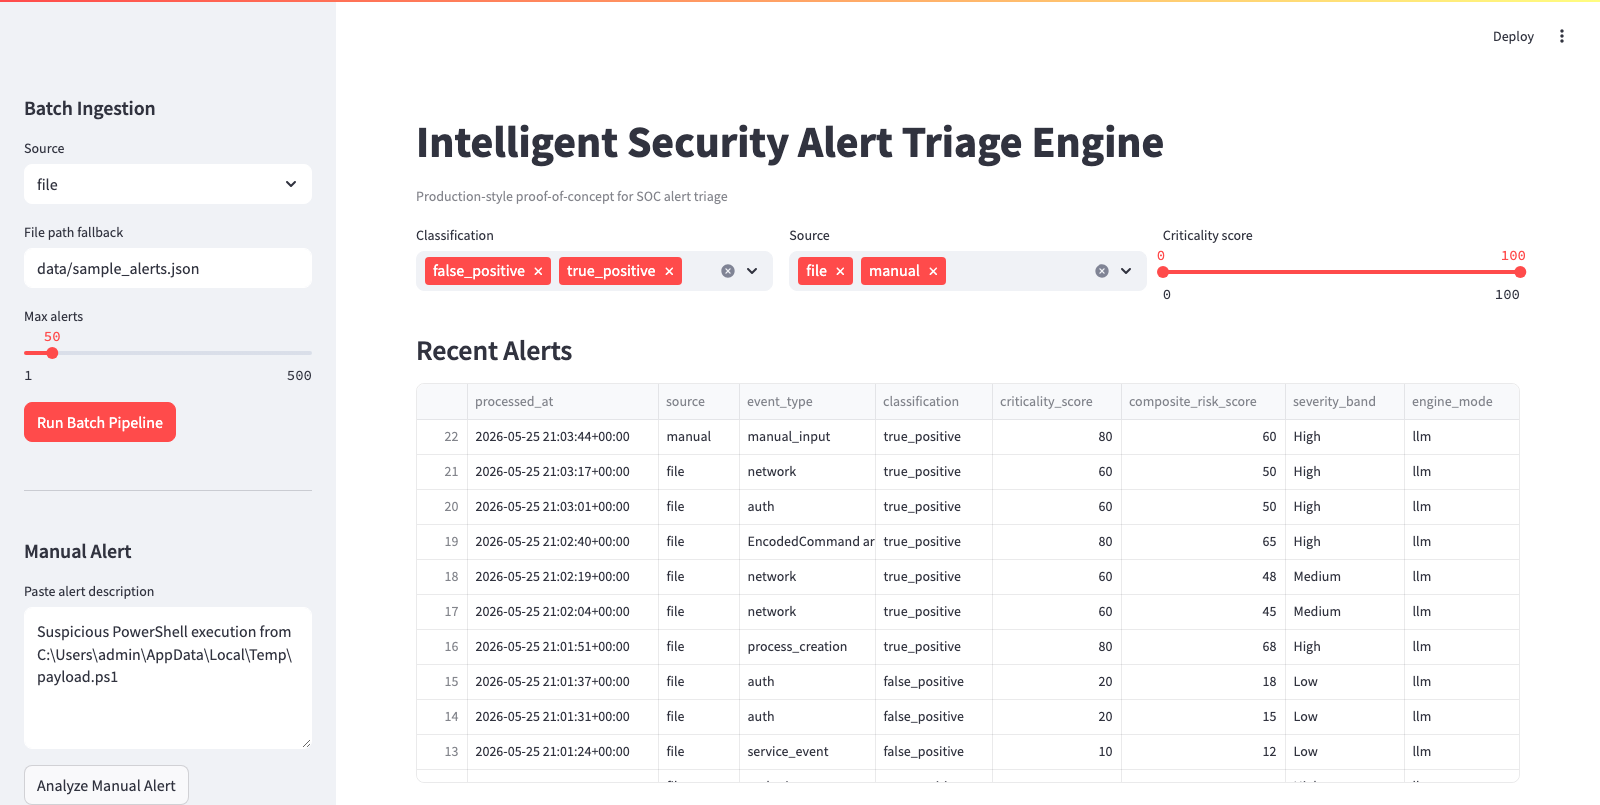
### 仪表盘概览(LLM 运行)
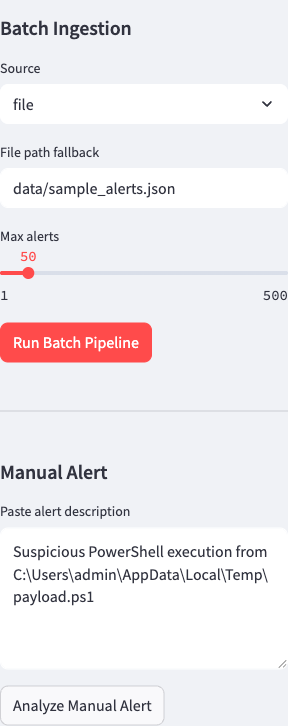
### 侧边栏工作流控制
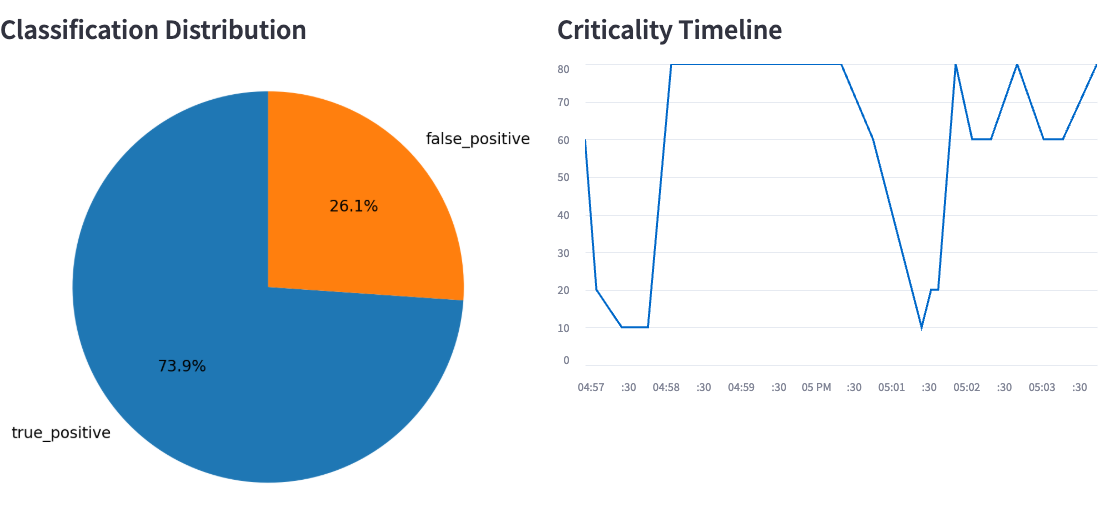
### 指标与图表
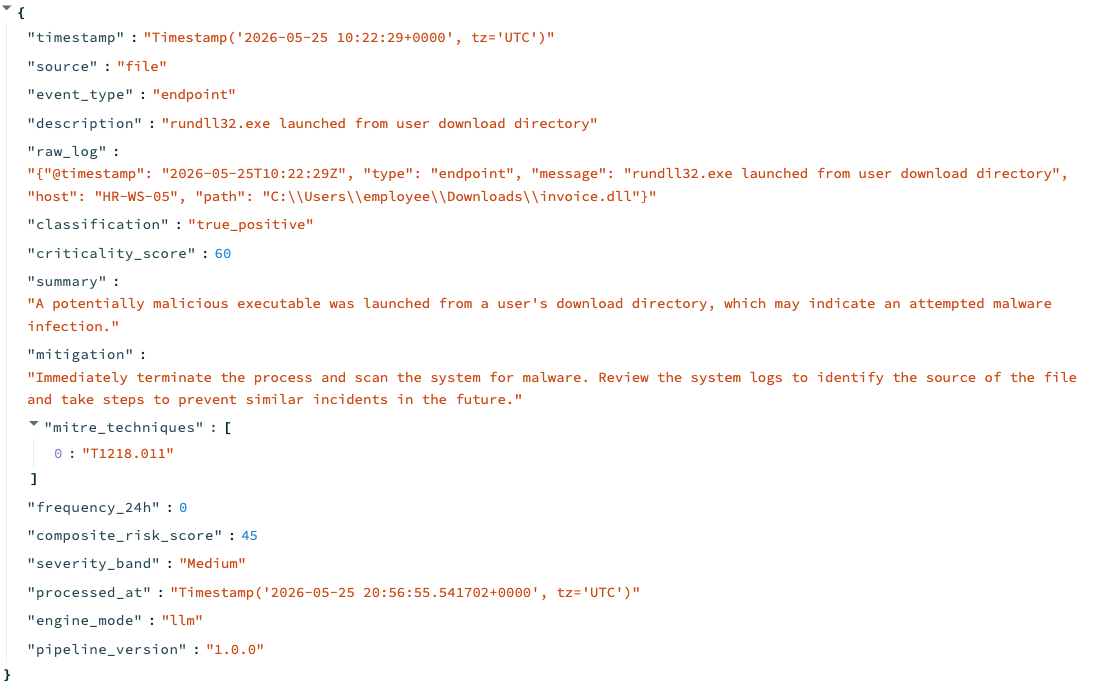
### 带有情报丰富和引擎模式的告警详情
## 核心能力
1. 从以下来源接入告警:
- 本地 JSON/CSV 模拟文件(主要路径)
- 可选的 Wazuh API
- 可选的 Elasticsearch 索引
2. 标准化为规范 schema:
- `timestamp`
- `source`
- `event_type`
- `description`
- `raw_log`
3. 使用本地 LLM (Ollama + `llama3`) 进行分析:
- 分类:`true_positive | false_positive | uncertain`
- 严重性评分:`0-100`
- 纯英文摘要
- 缓解措施
4. 丰富告警:
- MITRE ATT&CK 技术推断
- 过去 24 小时内的频率
- 综合风险评分
- 严重性级别(`Low|Medium|High|Critical`)
5. 持久化与可视化:
- 将丰富后的输出追加到 `alerts_log.json`
- 交互式 Streamlit 仪表盘,提供过滤、图表、下钻和导出功能
## 架构与数据流
```
flowchart LR
A["Wazuh API"] --> D["Ingestion Layer"]
B["Elasticsearch"] --> D
C["JSON or CSV Simulation"] --> D
D --> E["Normalization to Canonical Schema"]
E --> F["LLM Analysis Engine via Ollama llama3"]
F --> G["JSON Parser and Validation"]
G --> H["Fallback Classifier if needed"]
H --> I["Enrichment MITRE and Risk"]
I --> J["JSON Audit Store alerts_log.json"]
J --> K["Streamlit Dashboard"]
```
### Pipeline 阶段
- **接入**:从选定来源收集记录。
- **标准化**:将异构 payload 转换为统一 schema。
- **分析**:使用严格的 JSON prompt 查询 Ollama 的 `POST /api/generate` 接口。
- **护栏解析**:从嘈杂的模型输出中恢复 JSON,验证必填字段。
- **降级**:如果模型宕机/输出格式错误,则执行确定性关键词分诊。
- **丰富**:附加 MITRE 映射 + 频率 + 综合风险。
- **持久化**:将丰富后的记录追加到 JSON 审计日志中。
- **可视化**:仪表盘表格、过滤器、饼图、时间轴和导出。
## 仓库结构
```
src/
analysis/ # prompting, parser, Ollama client, fallback logic
ingestion/ # file/wazuh/elk adapters + normalizer
enrichment/ # MITRE mapping + risk scoring
storage/ # JSON append store with file lock support
dashboard/ # Streamlit UI
cli.py # command interface
pipeline.py # orchestration
data/
sample_alerts.json
screenshots/
README.md
tests/
unit + integration tests
.github/workflows/
ci.yml
```
## 要求
- Python **3.11+**
- 本地安装 Ollama
- 拉取了 `llama3` 模型 (`ollama pull llama3`)
## 快速开始
1. 克隆仓库并进入目录。
2. 创建环境并安装依赖:
```
python3.11 -m venv .venv
source .venv/bin/activate
pip install --upgrade pip
pip install -r requirements.txt
```
3. 配置环境:
```
cp .env.example .env
```
4. 确保 Ollama 正在运行:
```
ollama serve
ollama list | grep llama3
```
## 命令
### CLI 批处理(模拟)
```
python -m src.cli run-batch --source file --path data/sample_alerts.json
```
### CLI 批处理(Wazuh)
```
python -m src.cli run-batch --source wazuh
```
### CLI 批处理(ELK)
```
python -m src.cli run-batch --source elk
```
### CLI 手动告警分析
```
python -m src.cli analyze-text --text "Suspicious PowerShell execution from C:\Users\admin\AppData\Local\Temp\payload.ps1"
```
### Streamlit 仪表盘
```
streamlit run src/dashboard/app.py
```
### Makefile 快捷方式
```
make setup
make lint
make test
make run-cli
make run-ui
make sample
```
## 环境变量
| 变量 | 用途 | 默认值 |
|---|---|---|
| `OLLAMA_BASE_URL` | Ollama endpoint 基础 URL | `http://localhost:11434` |
| `OLLAMA_MODEL` | 本地模型名称 | `llama3` |
| `OLLAMA_TIMEOUT_SECONDS` | 模型/API 调用的 HTTP 超时时间 | `45` |
| `OLLAMA_MAX_RETRIES` | 降级前的 LLM 重试次数 | `2` |
| `WAZUH_API_URL` | 可选的 Wazuh 告警 endpoint | 空 |
| `WAZUH_API_TOKEN` | 可选的 Wazuh bearer token | 空 |
| `ELK_URL` | 可选的 Elasticsearch URL | 空 |
| `ELK_INDEX` | Elasticsearch 索引模式 | `security-alerts-*` |
| `ELK_API_KEY` | 可选的 Elasticsearch API key | 空 |
| `ALERT_LOG_PATH` | JSON 审计日志路径 | `logs/alerts_log.json` |
| `APP_LOG_PATH` | 应用程序日志文件路径 | `logs/app.log` |
| `APP_LOG_LEVEL` | 日志详细程度 | `INFO` |
| `PIPELINE_VERSION` | 丰富记录的版本标签 | `1.0.0` |
## 输出 schema
每个丰富后的告警包括:
- 标准化的输入字段
- `classification`, `criticality_score`, `summary`, `mitigation`
- `mitre_techniques`
- `frequency_24h`
- `composite_risk_score`
- `severity_band`
- `processed_at`
- `engine_mode` (`llm` 或 `fallback`)
- `pipeline_version`
## 行为示例
输入:
预期输出风格:
- 分类:`true_positive`
- 严重性:高 (90+)
- 摘要:疑似 LOLBin 样式滥用
- 缓解措施:隔离主机,阻断 C2,收集取证工件
- MITRE:`T1059.001`
## 设计决策
- **严格的 JSON prompt + 解析器护栏**:LLM 输出在被接受前受到约束和验证。
- **确定性降级路径**:在模型中断期间,演示和 pipeline 保持正常运行。
- **综合风险公式**:将严重性与最近的复发频率相结合:
- `min(100, round(0.75 * criticality_score + 0.25 * min(frequency_24h*10, 100)))`
- **带锁的 JSON 追加存储**:针对项目范围的简单且可审计的持久化方案。
## 测试与 CI
本地:
```
ruff check .
pytest
```
GitHub Actions (`.github/workflows/ci.yml`):
- Python 3.11
- 依赖安装
- Ruff linting
- Pytest 执行
## 工程评审点
- 为什么在 LLM 推理之前 schema 标准化至关重要。
- 如何通过验证 + 重试 + 降级来强化 LLM 输出。
- 风险评分的权衡与可解释性。
- 关键词 MITRE 映射的局限性及后续改进。
- 演进路径:基于队列的接入、DB 存储、SOC 集成、RBAC、模型评估基准。
## 局限性与路线图
当前局限性:
- 启发式 MITRE 映射
- 使用 JSON 文件存储而非数据库
- 没有分布式 worker 或实时队列
后续步骤:
1. 添加异步 worker 队列(Celery/RQ/Kafka)。
2. 将持久化转移至 PostgreSQL/Elasticsearch。
3. 添加告警去重和抑制策略。
4. 添加分析师反馈循环以进行模型微调。
5. 添加评估数据集及精确率/召回率追踪。
## 演示资产
- 示例告警:`data/sample_alerts.json`
- 截图清单:`screenshots/README.md`
- 发布操作手册:`scripts/capture_demo_checklist.md`
标签:AI风险缓解, Cloudflare, DLL 劫持, Kubernetes, LLaMA3, LLM评估, MITRE ATT&CK, Ollama, SOC运营, Streamlit, 大语言模型, 安全告警分诊, 访问控制, 逆向工具, 风险评分