MrN7King/network-observability-lab
GitHub: MrN7King/network-observability-lab
一个基于 Docker 的生产级网络可观测性实验室,模拟 ISP/企业网络拓扑并提供完整的监控、告警、日志聚合和混沌测试能力。
Stars: 0 | Forks: 0
# 🌐 网络可观测性实验室
### 生产级网络监控与 NOC 模拟环境
## 概述
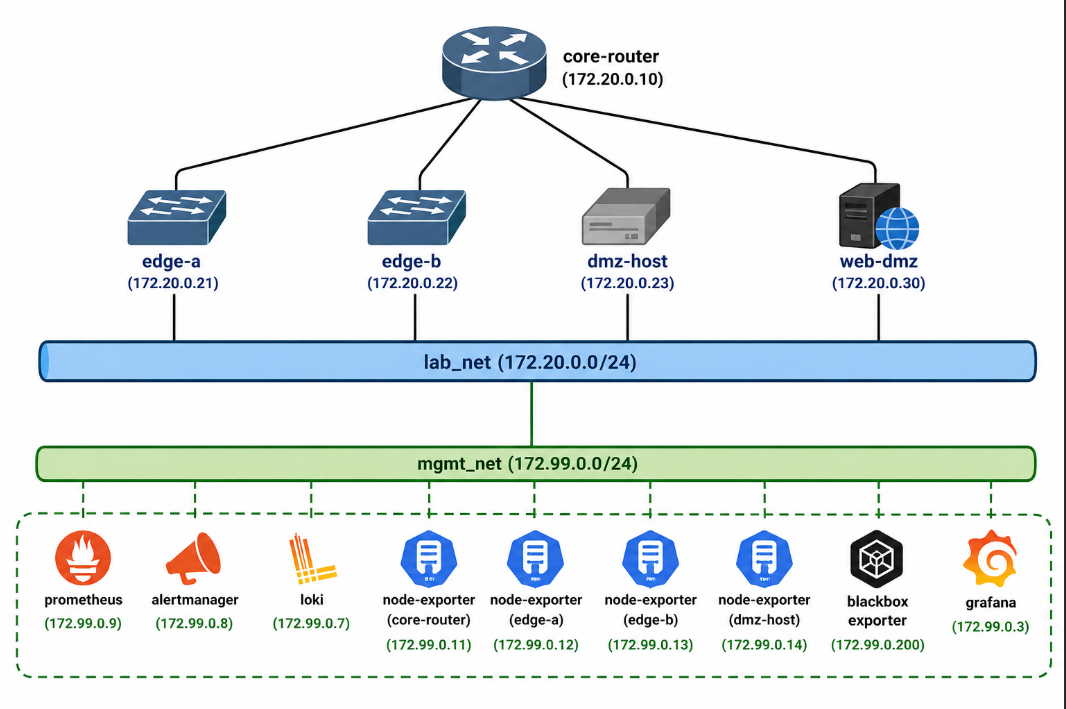
一个完全容器化的网络监控实验室,模拟小型 ISP 级拓扑结构——核心路由器、边缘节点和 DMZ——连接到完整的可观测性技术栈。所有内容均通过代码进行配置:无需手动点击 Grafana,启动后也无需四处寻找 YAML。
作为一个作品集项目构建,旨在展示简历中实际的 NOC、网络和可观测性技能。
**它展示了:**
- 多节点 Docker 网络拓扑设计
- ICMP 可达性监控 + HTTP 应用层探测
- 指标收集、PromQL 查询和告警规则
- Alertmanager 路由流水线(已适配 Slack)
- 使用 Loki + Promtail 进行日志聚合
- 在 Grafana 中自动配置的实时 NOC 大屏仪表板
- 故障注入和混沌测试脚本
## 架构
## 技术栈
| 容器 | 镜像 | 角色 |
|-----------|-------|------|
| `core-router` | alpine:3.19 | 中心节点 - 多宿主跨所有网段 |
| `edge-a` | alpine:3.19 | 分支机构模拟 |
| `edge-b` | alpine:3.19 | 数据中心边缘模拟 |
| `dmz-host` | alpine:3.19 | DMZ 节点(受 ICMP 监控) |
| `web-dmz` | nginx:alpine | DMZ Web 服务器(受 HTTP + ICMP 监控) |
| `exporter-*` ×4 | prom/node-exporter | 每个节点的 CPU、内存、接口指标 |
| `blackbox` | prom/blackbox-exporter | ICMP 可达性 + HTTP 健康探测 |
| `prometheus` | prom/prometheus | 指标收集和告警规则 |
| `alertmanager` | prom/alertmanager | 告警路由(已适配 Slack) |
| `loki` | grafana/loki | 日志聚合后端 |
| `promtail` | grafana/promtail | 收集并发送所有容器日志 |
| `grafana` | grafana/grafana | NOC 大屏 + 仪表板(自动配置) |
## 前置条件
- **Docker Desktop for Windows**(WSL2 或 Hyper-V 后端)
- **PowerShell**(Windows 内置 - 无需安装)
- **Git**(可选,用于克隆)
## 快速开始
```
# Clone
git clone https://github.com/MrN7King/network-observability-lab.git
cd network-observability-lab
# 清除任何旧数据(对于首次干净运行非常重要)
docker compose down -v
# 启动所有 16 个 containers
docker compose up -d
# 确认一切正在运行
docker compose ps
```
一旦所有容器显示为 `Up`:
| 服务 | URL | 凭证 |
|---------|-----|-------------|
| **Grafana NOC 大屏** | http://localhost:3001 | admin / netlab123 |
| Prometheus | http://localhost:9090 | - |
| Alertmanager | http://localhost:9093 | - |
| DMZ Web 服务器 | http://localhost:8080 | - |
| Loki | http://localhost:3100 | - |
## 使用说明
### 生成流量
使 Grafana 仪表板面板显示实时图表而不是平直线:
```
.\scripts\traffic.ps1
```
### 故障注入 - 单节点
模拟节点故障并观察 Grafana 中的告警触发:
```
.\scripts\fault-inject.ps1 -Node edge-a -DownSeconds 30
```
打开 http://localhost:3001 的 NOC 大屏。`edge-a` 磁贴会在约 20 秒内变为**红色**,告警触发,然后一切自动恢复。
### 混沌模式
随机连续故障 - 非常适合录屏或现场演示:
```
.\scripts\chaos.ps1 # runs forever
.\scripts\chaos.ps1 -Rounds 5 # 5 random faults then stops
```
## 告警
在 `prometheus/alerts.yml` 中定义的告警:
| 告警 | 条件 | 严重性 |
|-------|-----------|----------|
| `NodeUnreachable` | ICMP 探测失败超过 20 秒 | 严重 |
| `WebServerDown` | HTTP 探测失败超过 15 秒 | 严重 |
| `HighLatency` | ICMP RTT 超过 100ms 持续 30 秒以上 | 警告 |
| `ExporterDown` | Node exporter 停止响应 | 警告 |
| `HighCPU` | CPU 超过 85% 持续 1 分钟以上 | 警告 |
| `HighRxTraffic` | 接口 RX 超过 50 MB/s | 警告 |
### 启用 Slack 通知
1. 在 https://api.slack.com/messaging/webhooks 创建一个 Incoming Webhook
2. 打开 `alertmanager/alertmanager.yml`
3. 取消注释 `slack_configs` 块并粘贴你的 webhook URL
4. 重新加载 Alertmanager:
```
docker exec alertmanager wget -qO- --post-data='' http://localhost:9093/-/reload
```
## Grafana 仪表板
**NOC 大屏**会自动作为主页仪表板加载,包含:
- 所有 5 个节点的节点可达性磁贴(绿色 = UP,红色 = DOWN)
- DMZ Web 服务器的 HTTP 响应时间
- 所有节点的 ICMP 往返时间历史记录
- 每个节点的接口 RX / TX 流量
- 活动告警面板(来自 Prometheus 的实时数据)
- 容器日志流(来自 Loki 的实时数据)
## 项目结构
```
network-observability-lab/
├── docker-compose.yml
├── prometheus/
│ ├── prometheus.yml # Scrape configs, relabelling, alertmanager integration
│ └── alerts.yml # Alert rules (ICMP, HTTP, CPU, traffic)
├── alertmanager/
│ └── alertmanager.yml # Routing tree + Slack config (commented out)
├── blackbox/
│ └── blackbox.yml # ICMP + HTTP + TCP probe modules
├── loki/
│ └── loki.yml # Log storage backend config
├── promtail/
│ └── promtail.yml # Docker log scraping via Docker socket
├── nginx/
│ ├── conf/default.conf # nginx with /health endpoint + stub_status
│ └── html/index.html # DMZ landing page
├── grafana/
│ ├── provisioning/
│ │ ├── datasources/ # Auto-configures Prometheus + Loki
│ │ └── dashboards/ # Auto-loads dashboard JSON
│ └── dashboards/
│ └── noc-wallboard.json # Main NOC dashboard
└── scripts/
├── traffic.ps1 # Continuous ICMP + HTTP traffic generator
├── fault-inject.ps1 # Single node failure simulation
└── chaos.ps1 # Random continuous fault injection
```
## 停止实验室
```
docker compose down # stop containers, keep Prometheus/Grafana data
docker compose down -v # stop containers and wipe all stored data
```
## 展示的技能
- **Docker 网络** - 多网桥拓扑、静态 IP 分配、子网规划
- **Prometheus** - 抓取配置、指标重新标记、PromQL、告警规则
- **Alertmanager** - 路由树、分组配置、接收器设置、Slack 集成
- **Grafana** - 数据源配置、仪表板即代码(JSON 模型)、统计/时间序列/日志面板
- **Blackbox Exporter** - ICMP 可达性和 HTTP 端点监控
- **Node Exporter** - 接口级遥测(RX/TX 字节、CPU、内存)
- **Loki + Promtail** - 带有 Docker 服务发现的日志聚合流水线
- **nginx** - 服务器配置、健康端点、访问日志格式化
- **可观测性方法论** - 将指标、日志、告警作为统一的流水线
业余时间制作的项目 · 计算机网络理学士(荣誉)· 正在考取 CCNA
标签:AI合规, API集成, Docker, Grafana, 可观测性, 安全防御评估, 混沌工程, 自定义请求头, 请求拦截, 运维