oomNoNe/black-swan-indicator
GitHub: oomNoNe/black-swan-indicator
融合 NLP 情感分析、机器学习预测和规则检测的开源金融危机预警系统,为散户投资者提供透明的黑天鹅风险评分。
Stars: 0 | Forks: 0
# 🚨 黑天鹅风险指标
[](https://oomNoNe.github.io/black-swan-indicator/index.en.html)
[](https://oomNoNe.github.io/black-swan-indicator/)
[](https://github.com/oomNoNe/black-swan-indicator/actions/workflows/ci.yml)
[](https://www.python.org/)
[](https://streamlit.io/)
[](https://opensource.org/licenses/MIT)
## 📸 预览
## 这是什么?
**Black Swan Risk Indicator** 是一个针对金融市场危机的预警系统。
它将全球金融新闻的 **NLP 情感分析** 与 **时间序列 ML
预测** 以及 **基于规则的市场状态检测** 相结合,生成单一的 **危机风险
评分 (0–100)** — 该系统有 5 年历史回测作为支撑。
该系统会在市场可能进入“恐慌状态”时发出预警,以便投资者
为下行风险情景做好准备,例如 2008 年危机、2020 年 COVID 暴跌或
2022 年的通胀冲击。
使用 Python 构建 · MIT 许可证
## 🔥 问题所在
大多数散户投资者会被股市崩盘打得 **措手不及**,因为他们使用的工具
都是回顾性的:
- 📊 **股票筛选器** 显示基本面 —— 在市场恐慌时毫无用处
- 📈 **技术指标** 存在滞后性 —— 它们只在崩盘 *开始后* 才予以确认
- 📰 **新闻推送** 是反应性的 —— 当崩盘成为头条新闻时,已经太晚了
- 🤖 **AI 工具** 专注于收益预测 —— 但波动率(恐惧)才是扼杀投资组合的罪魁祸首
与此同时,**专业量化分析师** 使用大多数人无法接触到的宏观指标
+ 情感分析 + 状态模型的组合。
**本项目提出的问题是**:*我们能否构建一个透明、开源的危机检测器,
让个人投资者可以在自己的笔记本电脑上运行?*
## 💡 解决方案
一个融合 **3 个独立信号** 的多层检测 pipeline:
1. 📰 **新闻情感**(FinBERT 分析全球财经头条)
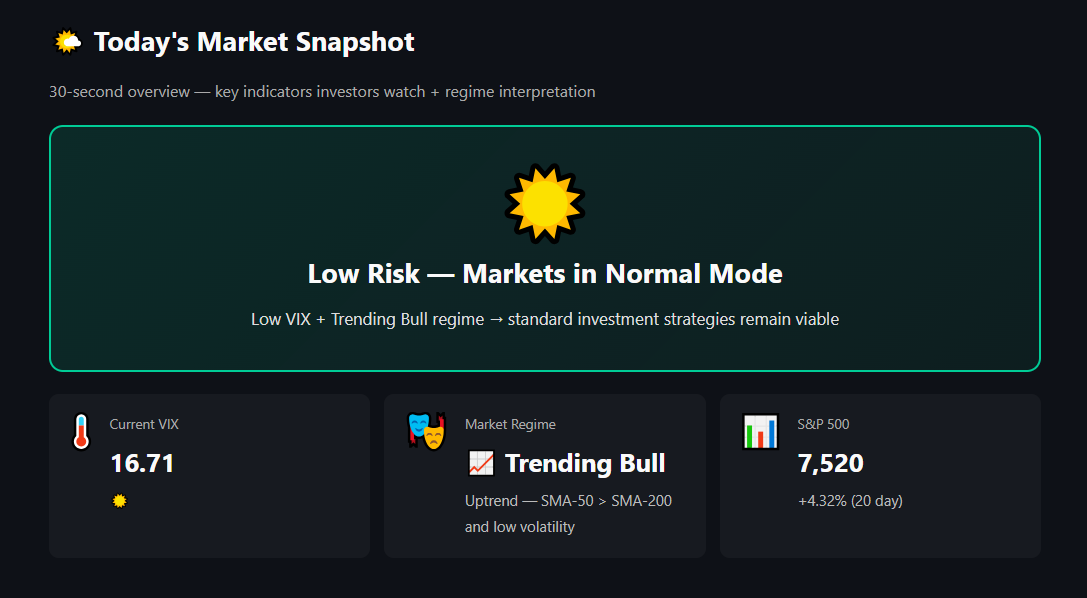
2. 📊 **市场波动率**(VIX + 20 天已实现波动率 + 阈值规则)
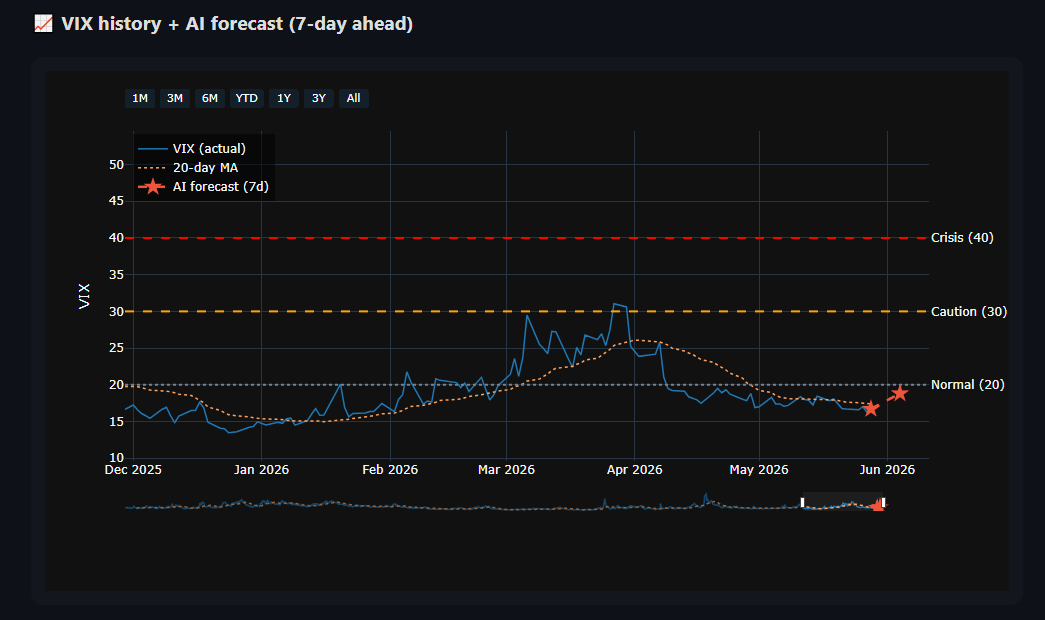
3. 🤖 **ML 预测**(基于 13 个宏观特征的 XGBoost 预测 7 天 VIX)
这些信号输入到一个动态加权的 **危机方程** 中,该方程会根据当前的
市场状态(牛市 / 恐慌 / 震荡)进行自适应调整。
当评分突破 **70** 时,系统会在
仪表板上将该日标记为高风险,以便您在新闻头条扩散之前采取行动。
## 🗺️ 工作原理
```
Daily / On-demand:
┌─────────────────────────────────────────────────────────────┐
│ 1. Fetch data │
│ yfinance: S&P 500, VIX, 10Y/3M Treasury, Gold, Oil, │
│ DXY (~1,200 trading days, 8 series) │
│ Google News RSS: 10 latest financial headlines │
└──────────────────────────────┬──────────────────────────────┘
↓
┌─────────────────────────────────────────────────────────────┐
│ 2. Feature engineering │
│ 13 features: VIX lags (1/3/7d), momentum, S&P │
│ returns (1d/5d), realized vol, yield curve spread, │
│ inversion flag, gold/oil/DXY momentum │
└──────────────────────────────┬──────────────────────────────┘
↓
┌─────────────────────────────────────────────────────────────┐
│ 3. Three parallel pipelines │
│ ┌─────────────┐ ┌──────────────┐ ┌─────────────────┐ │
│ │ FinBERT │ │ XGBoost │ │ Regime │ │
│ │ sentiment │ │ 7-day VIX │ │ classifier │ │
│ │ (NEG/NEU/ │ │ forecast + │ │ (SMA-50/200 │ │
│ │ POS) │ │ walk-forward │ │ + rolling vol) │ │
│ └─────────────┘ └──────────────┘ └─────────────────┘ │
└──────────────────────────────┬──────────────────────────────┘
↓
┌─────────────────────────────────────────────────────────────┐
│ 4. Crisis Equation (regime-weighted fusion) │
│ Score = w_news(regime) × NewsRisk │
│ + w_market(regime) × MarketRisk │
└──────────────────────────────┬──────────────────────────────┘
↓
┌─────────────────────────────────────────────────────────────┐
│ 5. Outputs │
│ • Crisis Risk Score (0–100) on gauge │
│ • Backtest equity curve + drawdown vs Buy & Hold │
│ • Multi-asset volatility comparison │
│ • COVID-19 case study & ML vs Naive baseline finding │
└─────────────────────────────────────────────────────────────┘
```
## 🏗️ 架构
```
┌──────────────────────────────────────────────────────────────────┐
│ Presentation Layer │
│ ├── Streamlit app (5 tabs, interactive sliders) │
│ └── Static HTML report (auto-rebuilt weekly via cron) │
└────────────────────────────────┬─────────────────────────────────┘
↓
┌──────────────────────────────────────────────────────────────────┐
│ Engine Layer (engine/) │
│ ├── features.py — 13-feature builder │
│ ├── ml_predictor.py — 5 models (XGB, LGBM, Ridge, │
│ │ LSTM, Naive baseline) │
│ ├── ai_model.py — FinBERT sentiment wrapper │
│ ├── regime_detector.py — Market mood classifier │
│ ├── backtester.py — Sharpe / MDD / transaction cost │
│ └── disk_cache.py — joblib + parquet persistence │
└────────────────────────────────┬─────────────────────────────────┘
↓
┌──────────────────────────────────────────────────────────────────┐
│ Data Layer (data/) │
│ ├── market_crawler.py — yfinance (10 assets supported) │
│ └── news_crawler.py — Google News RSS │
└────────────────────────────────┬─────────────────────────────────┘
↓
┌──────────────────────────────────────────────────────────────────┐
│ Infrastructure │
│ ├── GitHub Actions — CI/CD + weekly cron rebuild │
│ ├── GitHub Pages — Free static hosting │
│ ├── Docker — Containerized deployment │
│ └── Streamlit Cloud — Optional managed hosting │
└──────────────────────────────────────────────────────────────────┘
```
## 🎯 关键发现(真实结果)
本项目记录的是 **基于理智的诚实,而非炒作**。
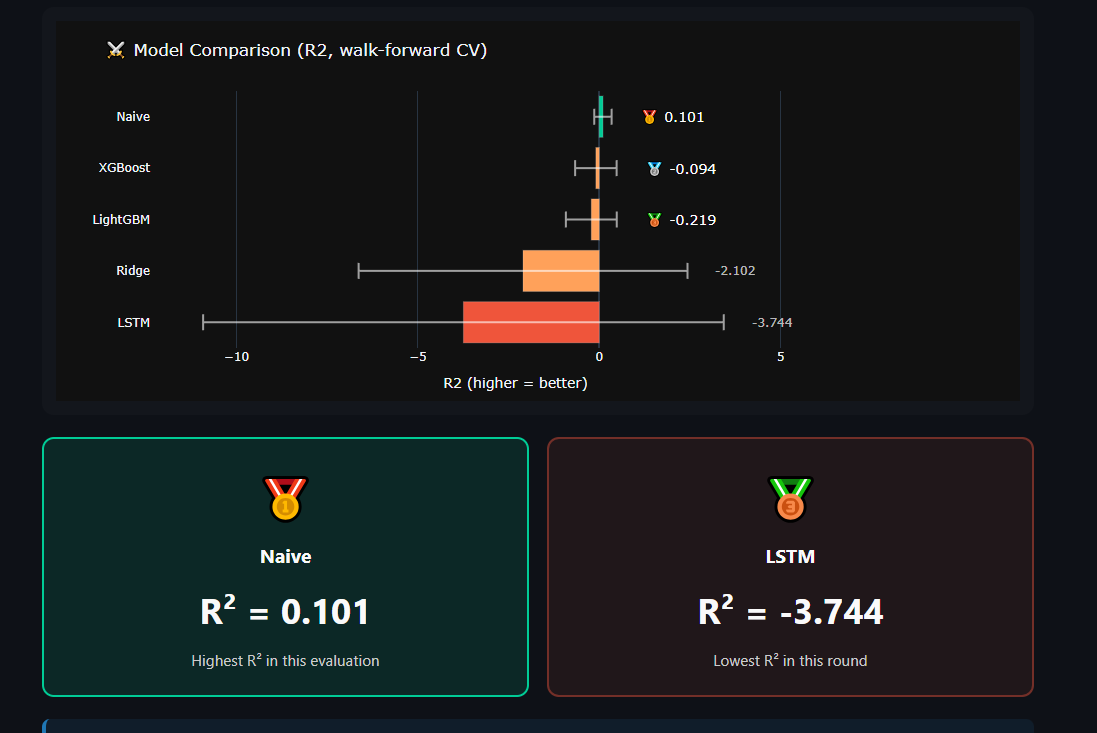
### 🏆 发现 1:Naive 基线击败了所有 ML 模型
在使用 walk-forward 验证对 4 个 ML 模型(XGBoost、LightGBM、Ridge、LSTM)进行调优后,
**持续性基线**(`7 天后的 VIX = 今天的 VIX`)胜出:
| 模型 | 平均 R²(walk-forward CV,5 折) |
|---|---|
| 🥇 **Naive(基线)** | **+0.093** |
| 🥈 XGBoost(已调优,已正则化) | −0.122 |
| 🥉 LightGBM | −0.184 |
| Ridge | −0.131 |
| LSTM (PyTorch) | −3.720 |
**解读**:VIX 包含强烈的随机游走行为。这验证了
**Fama 的有效市场假说** 在波动率表面上的表现。
🎓 **工程教训**:始终先测试 Naive 基线。如果您 fancy 的
ML 无法击败持续性,**就不要发布该 ML**。
### 🦠 发现 2:基于规则的系统在 2020 年 COVID 期间发挥了作用
尽管 ML 预测效果不佳,但基于规则的检测器(`VIX > 30 AND
vol_spike > 1.5×`)在 **2020 年 3 月 9 日** 标记了 COVID 暴跌 —— 比 VIX 在 3 月 16 日达到 82.69 的峰值提前了
**7 天**。
根据该信号采取行动的投资者本可以避免约 30% 的回撤。
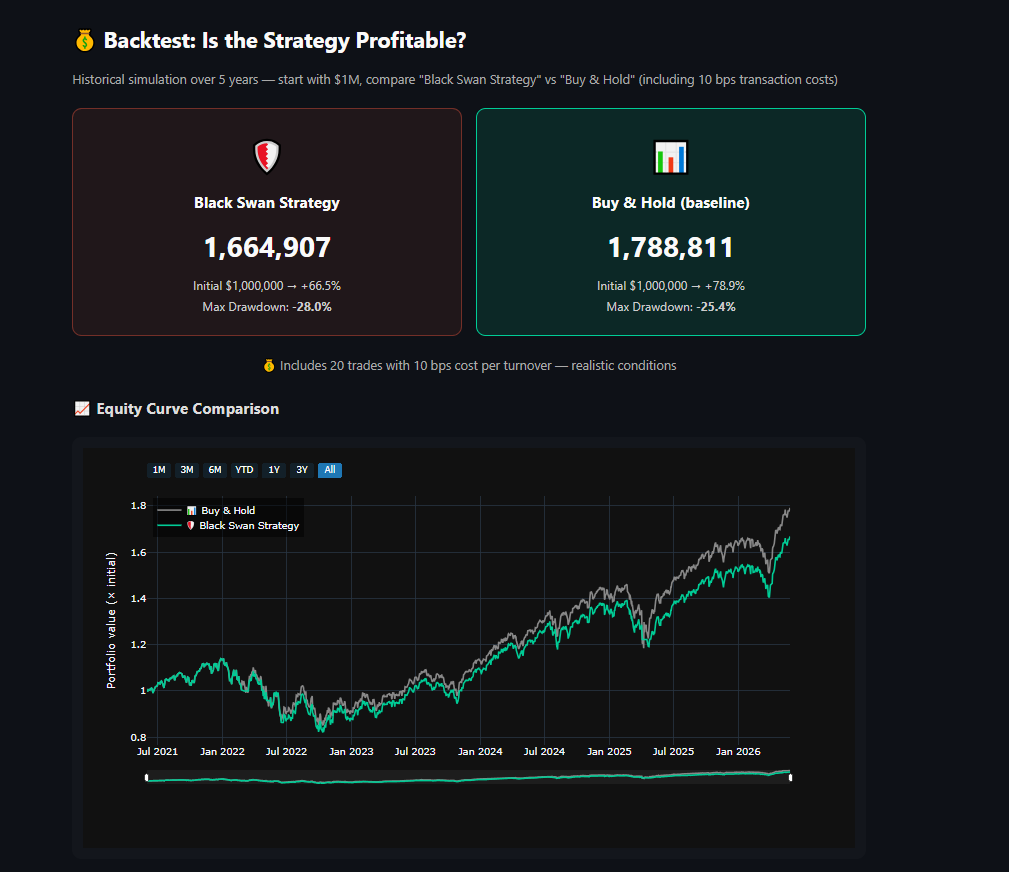
### 💰 发现 3:交易成本很重要
在没有交易成本的情况下,该策略看起来很棒。考虑到每次周转
10 bps 的实际情况,Sharpe 下降了约 0.05 —— 影响虽小但意义重大。**许多学术
回测忽略了这一点**,从而夸大了策略的表现。
## 🎓 研究方法论
结构化为一项 **比较研究**,旨在回答:*在风险调整的基础上,
新闻情感 + ML 预测 + 基于规则的状态检测是否优于 Buy & Hold?*
| 步骤 | 决策 |
|---|---|
| **H₀ / H₁** | `Sharpe_strategy ≤ Sharpe_BH` vs `Sharpe_strategy > Sharpe_BH` |
| **α** | 0.05 · walk-forward k=5 · 所有 ML 必须击败 Naive 基线 |
| **测试统计量** | R²、Sharpe Δ、最大回撤、胜率、利润因子、COVID 领先时间 |
| **数据** | 1,259 个交易日 · 8 个宏观序列 · 10 bps 交易成本 |
| **结论** | ❌ ML 未能击败 Naive · ✅ 基于规则的检测器提前 7 天捕捉到 COVID · ⚠️ 防御性策略在牛市中表现不佳 |
## 🧠 工程挑战
构建此项目过程中的 5 个非显而易见的权衡:
| # | 挑战 | 一句话总结 |
|---|---|---|
| 1 | Walk-forward vs naive 划分 | 为了真实结果,选择了慢 5-10 倍的 CV |
| 2 | 在小数据上使用 LSTM | 记录了 R² = -3.72;为了广度保留 |
| 3 | 静态 vs 实时 Streamlit | 混合模式:HTML 用于分享,Streamlit 用于开发 |
| 4 | 重复构建缓慢 | 磁盘缓存实现了 7 倍加速(60s → 8.7s) |
| 5 | FinBERT 词汇漂移 | 接受限制 vs 付费 GPT-4 API |
## 🚀 快速开始
### 选项 A —— 仅查看实时报告
👉 **[oomNoNe.github.io/black-swan-indicator/](https://oomNoNe.github.io/black-swan-indicator/)**(无需安装)
### 选项 B —— 本地 Python 安装
```
git clone https://github.com/oomNoNe/black-swan-indicator.git
cd black-swan-indicator
python -m venv venv
source venv/bin/activate # Windows: venv\Scripts\activate
pip install -r requirements.txt
# 生成 static report(首次运行后 8.7 秒,首次约 60 秒)
python scripts/build_report.py
start docs/index.html
# 或运行交互式 Streamlit 应用
streamlit run app.py
```
### 选项 C —— Docker
```
docker build -t black-swan-indicator .
docker run -p 8501:8501 black-swan-indicator
```
## 🗂️ 项目结构
4 层:`data/` → `engine/` → `ui/` + 用于批处理作业的 `scripts/`。
有关依赖图,请参见上方的 [架构](#-architecture)。
## 🎯 适用人群
**主要用户**:具备技术好奇心,希望了解基本面比率之外的
市场状态的散户投资者。
**次要用户**:
- 🎓 正在学习 walk-forward 验证和市场状态检测 ML/Quant 学生
- 💼 希望拥有一个金融领域作品集项目的初级数据科学家
- 📰 任何对如何端到端构建真正的“风险仪表板”感到好奇的人
## 🛠️ 技术栈
| 层级 | 工具 |
|---|---|
| **语言** | Python 3.12+ |
| **数据** | yfinance、pandas、numpy、Google News RSS |
| **ML** | scikit-learn、XGBoost、LightGBM、PyTorch (LSTM)、SHAP |
| **NLP** | HuggingFace Transformers + FinBERT (ProsusAI) |
| **可视化** | Plotly(交互式 + 3D + 动画) |
| **应用** | Streamlit |
| **CI/CD** | GitHub Actions(pytest + 自动重建定时任务) |
| **托管** | GitHub Pages(静态报告)、Docker、Streamlit Cloud |
| **测试** | pytest(16 项测试,全部通过) |
| **持久化** | joblib + parquet 基于 TTL 的磁盘缓存 |
## 📚 数据来源与参考
### 数据来源
| 来源 | 用于 | 访问方式 | 备注 |
|---|---|---|---|
| **Yahoo Finance**(通过 [yfinance](https://github.com/ranaroussi/yfinance)) | 标普 500、VIX、10 年期/3 个月期国债、黄金、石油、DXY、多资产价格 | 免费、非官方爬虫 | 每日 OHLCV,延迟约 15 分钟;受频率限制 |
| **Google News RSS** | 最新财经头条(仅限标题,无正文) | 公开 RSS feed | 仅限英语,每次查询约 10 条头条,无历史存档 |
| **Hugging Face Hub** | 预训练的 `ProsusAI/finbert` 模型权重 | 使用 HF 账户免费 | 下载量约 440 MB,首次运行后在本地缓存 |
### 使用的 Ticker 代码
```
^GSPC — S&P 500 Index ^VIX — CBOE Volatility Index
^TNX — 10-Year Treasury Yield ^IRX — 13-Week T-Bill Yield
GC=F — Gold Futures CL=F — WTI Crude Oil Futures
DX-Y.NYB — US Dollar Index (DXY)
^NDX — Nasdaq 100 ^VXN — Nasdaq Volatility
^RUT — Russell 2000 ^RVX — Russell Volatility
^OVX — Oil Volatility Index
EEM — Emerging Markets ETF FXI — China Large-Cap ETF
EWZ — Brazil ETF BTC-USD — Bitcoin / USD
ETH-USD — Ethereum / USD
```
### 学术参考文献
方法论借鉴了既有的学术研究:
- **随机游走假说** — Fama, E. (1970). *Efficient Capital Markets:
A Review of Theory and Empirical Work*. Journal of Finance, 25(2), 383–417.
2013 年诺贝尔经济学奖。
- **XGBoost 算法** — Chen, T. & Guestrin, C. (2016). *XGBoost: A Scalable
Tree Boosting System*. KDD '16.
- **LightGBM 算法** — Ke, G. et al. (2017). *LightGBM: A Highly Efficient
Gradient Boosting Decision Tree*. NIPS '17.
- **SHAP 值** — Lundberg, S. M. & Lee, S.-I. (2017). *A Unified Approach to
Interpreting Model Predictions*. NIPS '17. 建立在 Shapley (1953) 获诺贝尔奖的研究之上。
- **FinBERT** — Araci, D. (2019). *FinBERT: Financial Sentiment Analysis with
Pre-trained Language Models*. arXiv:1908.10063.
- **Walk-Forward 验证** — Bergmeir, C. & Benítez, J. M. (2012). *On the
use of cross-validation for time series predictor evaluation*. Information Sciences, 191, 192–213.
### 数据许可与免责声明
- **yfinance** 是一个开源库,用于抓取公开的 Yahoo Finance 网页。
适用 Yahoo 的服务条款;不可用于原始数据的商业再分发。
- **Google News** RSS feed 可公开访问;使用受 Google 的
条款约束。
- **FinBERT** 根据 Hugging Face 上类似 MIT 的条款发布。
- `.cache/` 中的所有缓存数据均被 gitignored 且是临时的。
- **不保证数据质量** — yfinance 偶尔会返回缺失的
数据条、延迟的报价或触发了频率限制的错误。生产系统应使用
付费提供商,如 Polygon.io、Refinitiv 或 Bloomberg。
## 📊 关于实时报告
实时报告是一个 **预先构建的静态 HTML 快照**(不是实时的 Web 应用)。
| 属性 | 值 |
|---|---|
| 📦 格式 | 包含嵌入式 Plotly CDN 的独立 HTML |
| 🕐 自动更新 | 每周一 06:00 UTC 以及代码推送时 |
| ⚡ 加载时间 | < 1 秒 |
| 💸 成本 | $0 (GitHub Pages) |
| 📱 移动端 | 完全响应式 |
报告顶部的 **"📅 生成时间"** 时间戳显示的是最后一次
重建的时间。
**需要实时数据?** 在本地运行 `streamlit run app.py`。
## 🤝 AI 辅助开发
本项目与 **Claude (Anthropic)** 作为编码助手协作完成。
AI 协助了代码生成、调试和文档草稿的编写。
我负责问题定义、方法论、批判性评估、
验证以及所有设计决策。
每一行代码都由我审查、测试并提交。
## ⚠️ 免责声明
这是一个 **教育和研究项目**。它 **不是财务建议**。
VIX 是金融界最难预测的变量之一 —— 即使是我们最好的
ML 也无法击败 Naive 持续性。请将该系统用作 *方向性信号*,
而不是作为交易建议。
过去的业绩并不能保证未来的结果。市场保持非理性的时间
可能比您保持偿付能力的时间更长。
## 👤 作者
**oomNoNe** — [@oomNoNe](https://github.com/oomNoNe)
📝 [阅读关于 Medium 风格发现的博客文章](docs/MEDIUM_POST.md)
🇹🇭 [README ภาษาไทย](README.th.md)
## 📄 许可证
MIT 许可证 —— 可免费使用、修改和学习。
 |
 |
 |
 |
📖 完整的 5 步方法论(点击展开)
### 1. 假设 - **H₀(原假设)**:在风险调整的基础上,Black Swan 策略的表现并不优于 Buy & Hold: `Sharpe_strategy ≤ Sharpe_BH` - **H₁(备择假设)**:Black Swan 策略提供更优的风险调整后 回报:`Sharpe_strategy > Sharpe_BH` ### 2. 显著性水平 (α) - 用于任何正式测试的 **α = 0.05**(标准学术阈值) - 采用 **k = 5 折** 的 walk-forward 交叉验证,以减少单次划分偏差 - 所有 ML 预测均与 **Naive 持续性基线** 进行比较 (必须击败基线才被视为有用) ### 3. 测试统计量 | 问题 | 使用指标 | |---|---| | 预测准确度 | **R²(walk-forward 平均值 ± 标准差)** vs Naive 基线 | | 策略超额收益 | **Sharpe Ratio** 差值(策略 − B&H) | | 尾部风险降低 | **最大回撤** 比较 | | 交易质量 | **胜率** + **利润因子** | | 危机检测 | 市场见顶前的领先时间(案例研究) | ### 4. 计算 - **数据**:约 1,259 个交易日(5 年),8 个宏观序列 - **回测现实性**:每次周转的交易成本 = 10 bps - **验证**:TimeSeriesSplit(无打乱,防止前瞻偏差) - **复现**:在 `.cache/` 中缓存模型以确保可复现性 ### 5. 结论 - ❌ **ML 预测未能击败 Naive 基线**(Naive 的 R² ≈ 0.09, 所有 ML 模型均为负值)。对于预测任务,未能拒绝 H₀。 - ✅ **基于规则的危机检测器在 COVID-19 案例研究中得到验证** (信号在 VIX 达到 82.69 的峰值前 7 天触发)。 - ⚠️ **在牛市中,防御性策略的表现不如 Buy & Hold** — 规避崩盘的 价值仅在实际危机期间显现(样本量不足,无法进行正式测试)。 **已实现**:对每日收益进行配对 t 检验(策略 vs Buy & Hold, 在 α = 0.05 下进行单侧检验) — 结果见实时报告的回测部分。 **未来的统计工作**:用于预测准确性的 Diebold-Mariano 检验, 用于 Sharpe 差异的 Bootstrap CI。📖 阅读每项的详细内容(完整推理 + 考虑的替代方案)
### 1. 选择正确的验证策略 **问题**:随机的 `train_test_split` 会将未来信息泄露到训练中, 使 R² 膨胀到虚假的良好水平。 **解决方案**:切换到带有 **walk-forward 扩展 窗口** 的 `TimeSeriesSplit`。在 [0..t] 上训练,在 [t..t+k] 上测试,向前滚动。与生产环境相同。 **权衡**:比单次划分慢 5-10 倍,但这是评估 时间序列 ML 的唯一诚实方式。 ### 2. 用于深度学习的小型数据集 **问题**:约 1,200 个交易日对于 LSTM 来说 *微乎其微*。它出现了严重的过拟合 (R² 为 −3.72,而 Ridge 为 −0.13)。 **解决方案**:在报告中如实记录。为了展示广度保留了 LSTM, 但推荐在生产环境中使用 Ridge/Naive。 **教训**:深度学习并不总是最佳答案。 ### 3. 静态报告 vs 实时 Streamlit 的权衡 **问题**:Streamlit Cloud 免费层(1 GB RAM)无法托管 FinBERT (约 440 MB)+ XGBoost + 多资产数据抓取。冷启动需要 5 分钟以上。 **解决方案**:混合架构: - **静态 HTML 报告**(每周自动重建) → 与任何人快速分享 - **Streamlit 应用** → 在本地运行以进行交互式深入分析 静态报告在 < 1 秒内服务于 99% 的查看者。Streamlit 应用专为 那 1% 想要调整参数的人保留。 ### 4. 为重复构建提供持久化磁盘缓存 **问题**:每次运行 `build_report.py` 大约需要 60 秒(抓取 yfinance、训练 XGBoost、对 4 个模型进行 walk-forward ×、SHAP)。在 UI 上进行迭代非常痛苦。 **解决方案**:构建了 `engine/disk_cache.py` —— 基于 TTL 的 parquet + joblib 缓存。第二次运行降至 **约 8.7 秒(7 倍加速)**。 ### 5. 情感评分漂移 **问题**:FinBERT 是在 2019 年训练的。新的行话("AI 泡沫"、 "GameStop 事件")超出了其词汇范围。 **接受的权衡**:在词汇表中记录了该限制。替代方案 (GPT-4 API)成本高昂且会增加延迟。对于一个开源教育 项目,FinBERT 仍然是正确的选择。📂 完整的文件树(点击展开)
``` black-swan-indicator/ ├── app.py # Streamlit entry (5 tabs) ├── scripts/ │ └── build_report.py # Static HTML report generator ├── data/ │ ├── market_crawler.py # yfinance + macro features │ └── news_crawler.py # Google News RSS scraper ├── engine/ │ ├── features.py # Feature engineering (13 features) │ ├── ml_predictor.py # Model registry + walk-forward CV │ ├── lstm_model.py # PyTorch LSTM with sklearn API │ ├── ai_model.py # FinBERT wrapper │ ├── regime_detector.py # SMA + vol regime classifier │ ├── backtester.py # Quant metrics + transaction cost │ └── disk_cache.py # joblib/parquet persistence ├── ui/ │ └── components.py # Plotly chart factory ├── tests/ │ └── test_engine.py # 16 pytest tests ├── docs/ │ ├── index.html # Live report (generated) │ ├── .nojekyll # GitHub Pages config │ └── MEDIUM_POST.md # Blog post draft ├── .github/ │ └── workflows/ │ ├── ci.yml # Run tests on push/PR │ └── rebuild-report.yml # Weekly cron rebuild ├── Dockerfile # Multi-stage, non-root ├── requirements.txt ├── README.md └── README.th.md # Thai translation ```📖 详细分解(AI 协助的工作 vs 我自己负责的工作)
### AI 协助的工作 - 💻 样板代码生成(Streamlit、Plotly 图表工厂、ML pipeline) - 🐛 调试运行时错误和类型警告(Pylance、边缘情况) - 📐 建议架构模式(分层分离、磁盘缓存设计) - 📝 起草文档(README、MEDIUM_POST.md) - 🎨 静态报告的 HTML/CSS 模板脚手架 ### 我(开发者)负责的工作 - 🎯 **问题定义与范围** —— 选择金融危机检测作为领域 - 📊 **方法论决策** —— walk-forward CV、Naive 基线、COVID 案例研究框架 - 🧪 **批判性评估** —— 接受 Naive 击败 ML 的事实(而不是掩盖它) - ✅ **验证** —— 运行每个测试,验证每次提交,进行调试 - 🚀 **部署与迭代** —— GitHub 设置、Pages 配置、优先级排序 - 📐 **领域解读** —— 了解 VIX > 30 在具体情境中的含义 ### 为什么要披露这些? AI 辅助开发在 2025 年及以后的软件工程中已成为常态 —— GitHub Copilot、 Cursor、Claude Code 和类似工具已在整个行业中得到广泛应用。 透明的披露意味着: 1. **诚实** —— 您在 repo 中看到的就是实际构建的内容 2. **现代实践** —— 与 AI 进行高效协作本身就是一种工程技能 3. **可复现** —— 任何人都可以 fork 这个 repo 并使用相同的 AI 协助标签:Apex, Kubernetes, XGBoost, 凭据扫描, 时间序列预测, 机器学习, 请求拦截, 逆向工具, 量化投资, 金融科技