sahilsinghi/soc-detection-lab
GitHub: sahilsinghi/soc-detection-lab
基于 MITRE ATT&CK 框架的 SOC 检测工程实验室,提供 32 条经端到端验证的 Splunk/Wazuh 检测规则及完整的攻击模拟验证管线。
Stars: 0 | Forks: 0
# SOC 检测实验室 🛡️
## 📊 覆盖统计
| 指标 | 数值 |
|--------|-------|
| 检测规则 | 已编写 32 条 / 计划 7 条 / 已完成端到端验证 6 条 |
| 已覆盖 ATT&CK 战术 | 12 |
| 已实时验证技术 (2026-05-27) | T1110.001, T1059.001, T1562.001, T1136.001, T1547.001, T1021.002 |
| 已调优误报 | T1003.001 (排除了 svchost→lsass 0x1000 状态查询) |
| SIEM | Splunk Enterprise Free + Wazuh 4.13.1 |
| 活跃 Wazuh Agent | 2 (macOS Apple Silicon 主机 + Windows 11 ARM64 虚拟机) |
| 受监控端点 | Windows 11 ARM64 (Splunk UF + Wazuh agent), macOS (Wazuh agent) |
## 🏗️ 架构
```
graph TD
A[Atomic Red Team\nWindows Endpoints] -->|Attack Simulation| B[Windows Event Log\n+ Sysmon Operational]
B -->|Splunk UF port 9997| C[Splunk SIEM\nlocalhost:8000]
C -->|Scheduled Searches every 60s| D[Detection Alerts\nATT&CK Tagged]
D --> E[Coverage Dashboard\nMITRE Navigator Layer]
style C fill:#e8193c,color:#fff
style D fill:#ff6b35,color:#fff
style E fill:#2ecc71,color:#fff
```
### 实验室组件
| 组件 | 详情 |
|-----------|---------|
| **SIEM** | 运行于 macOS ARM 的 Splunk Enterprise Free (500 MB/天) |
| **端点 1** | Windows 10 Enterprise Eval — 主要受害者 |
| **端点 2** | Windows Server 2022 Eval — AD/服务器 TTPs |
| **Sysmon** | v15.x 及 Olaf Hartong sysmon-modular 配置 |
| **日志转发器** | Splunk Universal Forwarder 9.x |
| **攻击模拟** | Atomic Red Team + Invoke-AtomicRedTeam |
| **Hypervisor** | macOS Apple Silicon 上的 UTM (QEMU) |
## 🗂️ 仓库结构
```
soc-detection-lab/
├── README.md
├── docs/
│ ├── architecture.md # Detailed network diagram + VM specs
│ ├── setup-guide.md # Step-by-step reproduction guide
│ └── one-detection-walkthrough.md # Deep dive: T1003.001 LSASS dump
├── detections/
│ ├── initial-access/
│ ├── execution/ # e.g. T1059.001__powershell-encoded-command/
│ │ ├── rule.spl # → SPL detection query
│ │ └── README.md # → Technique, FP notes, response
│ ├── persistence/
│ ├── privilege-escalation/
│ ├── defense-evasion/
│ ├── credential-access/
│ ├── discovery/
│ ├── lateral-movement/
│ ├── collection/
│ ├── command-and-control/
│ ├── exfiltration/
│ └── impact/
├── tests/
│ ├── execution_log.csv # Timestamped atomic test results
│ ├── execution_log.md # Human-readable test report
│ └── atomic-mappings.csv # Detection → Atomic test ID mapping
├── dashboards/
│ └── coverage.xml # Splunk dashboard XML
├── navigator/
│ └── soc-lab-coverage.json # MITRE ATT&CK Navigator layer
├── sysmon-config/
│ └── sysmonconfig.xml # Olaf Hartong modular config
└── scripts/
├── install-sysmon.ps1 # Sysmon setup on Windows endpoints
├── install-splunk-uf.ps1 # Universal Forwarder setup
└── run-atomics.ps1 # Batch atomic test runner
```
## 🚀 快速开始(复现此实验室)
完整说明请参阅 [`docs/setup-guide.md`](docs/setup-guide.md)。
**前置条件:**
- 配备 16 GB RAM,120 GB 可用磁盘空间的笔记本电脑
- UTM 或 VirtualBox(免费)
- splunk.com 的免费 Splunk 账号
**复现时间:** 约 4 小时
## 🎯 检测覆盖率
### 按战术分类
| 战术 | 规则 | 示例技术 |
|--------|-------|-------------------|
| 初始访问 | 2 | T1566.001 鱼叉式网络钓鱼附件 |
| 执行 | 4 | T1059.001 PowerShell 编码命令 |
| 持久化 | 4 | T1547.001 注册表 Run 键 |
| 权限提升 | 2 | T1055.001 进程注入 |
| 防御规避 | 3 | T1562.001 禁用 Windows Defender |
| 凭证访问 | 4 | T1003.001 LSASS 内存转储 |
| 发现 | 3 | T1082 系统信息发现 |
| 横向移动 | 3 | T1021.002 SMB 管理共享 |
| 收集 | 2 | T1005 本地数据暂存 |
| 命令与控制 | 2 | T1071.001 HTTP C2 Beacon |
| 数据渗出 | 1 | T1041 通过 C2 通道渗出 |
| 影响 | 1 | T1486 加密数据造成影响 |
## 🔍 示例检测:T1003.001 LSASS 内存转储
```
index=main sourcetype="XmlWinEventLog:Microsoft-Windows-Sysmon/Operational"
EventCode=10 TargetImage="*lsass.exe"
NOT (SourceImage="*\\MsMpEng.exe" OR SourceImage="*\\csrss.exe")
| eval mitre_technique="T1003.001"
| table _time, host, SourceImage, TargetImage, GrantedAccess, mitre_technique
| sort -_time
```
**工作原理:** 当进程打开另一个进程的句柄时,Sysmon Event ID 10 会触发。攻击者使用 Mimikatz 等工具读取 LSASS 内存以获取凭证。`NOT` 子句排除了 Windows Defender (`MsMpEng.exe`),因为它会合法地访问 LSASS —— 这就是误报调优的过程。
详细分解请参阅 [`docs/one-detection-walkthrough.md`](docs/one-detection-walkthrough.md)。
关于端到端验证证据 —— T1110.001 暴力破解、T1059.001 编码 PowerShell、T1562.001 禁用 Defender 尝试、T1003.001 误报调优以及 pipeline 健康状态快照 —— 请参阅 [`docs/validation-log.md`](docs/validation-log.md)。
关于辅助 Wazuh SIEM 设置(Ubuntu ARM64 上的 manager,macOS 主机上的第一个 agent),请参阅 [`docs/wazuh-setup.md`](docs/wazuh-setup.md)。
## 📸 截图
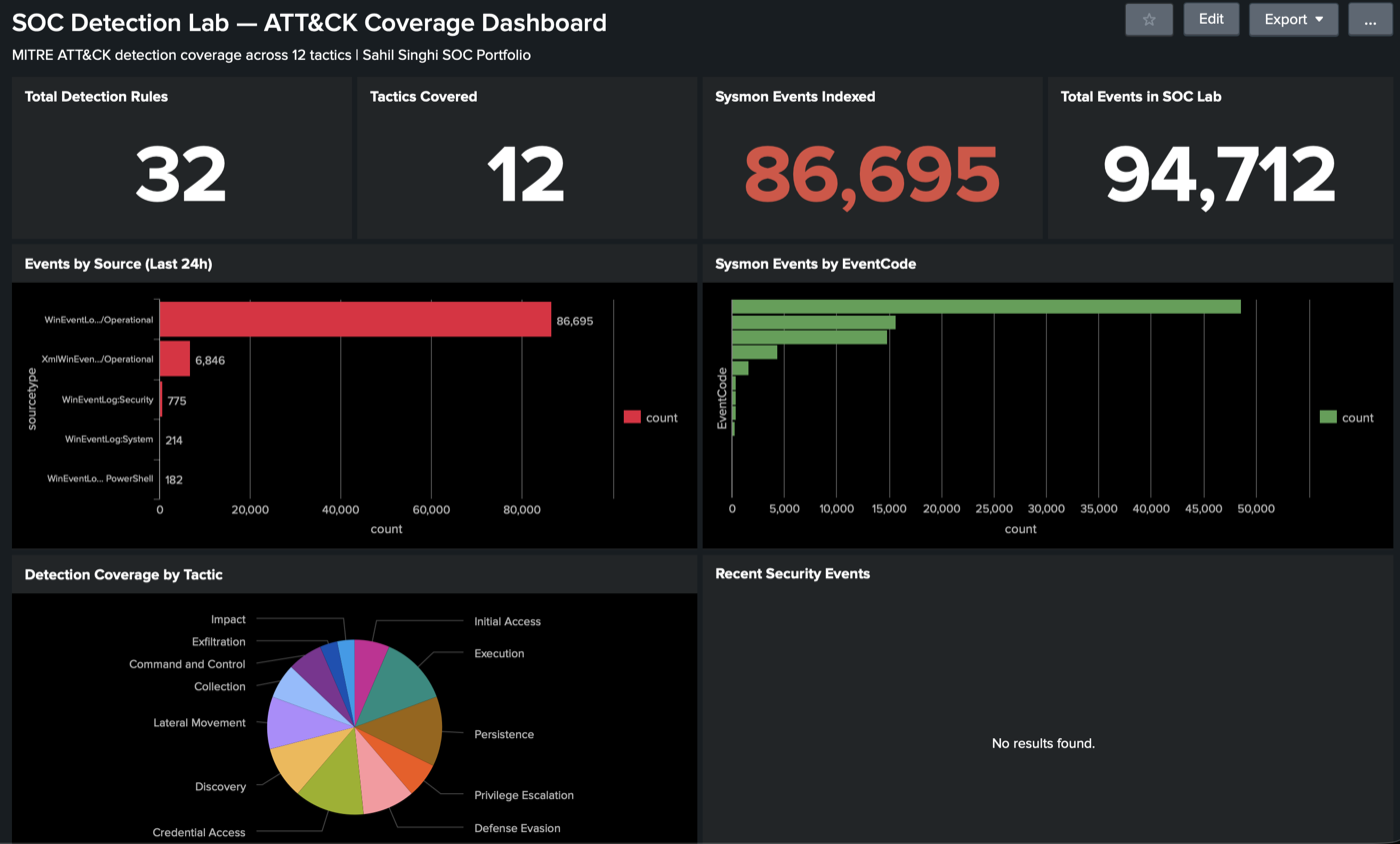
### Splunk 覆盖率仪表板
实时仪表板显示超过 94K 条已索引事件,以及覆盖 12 项 MITRE ATT&CK 战术的检测情况。
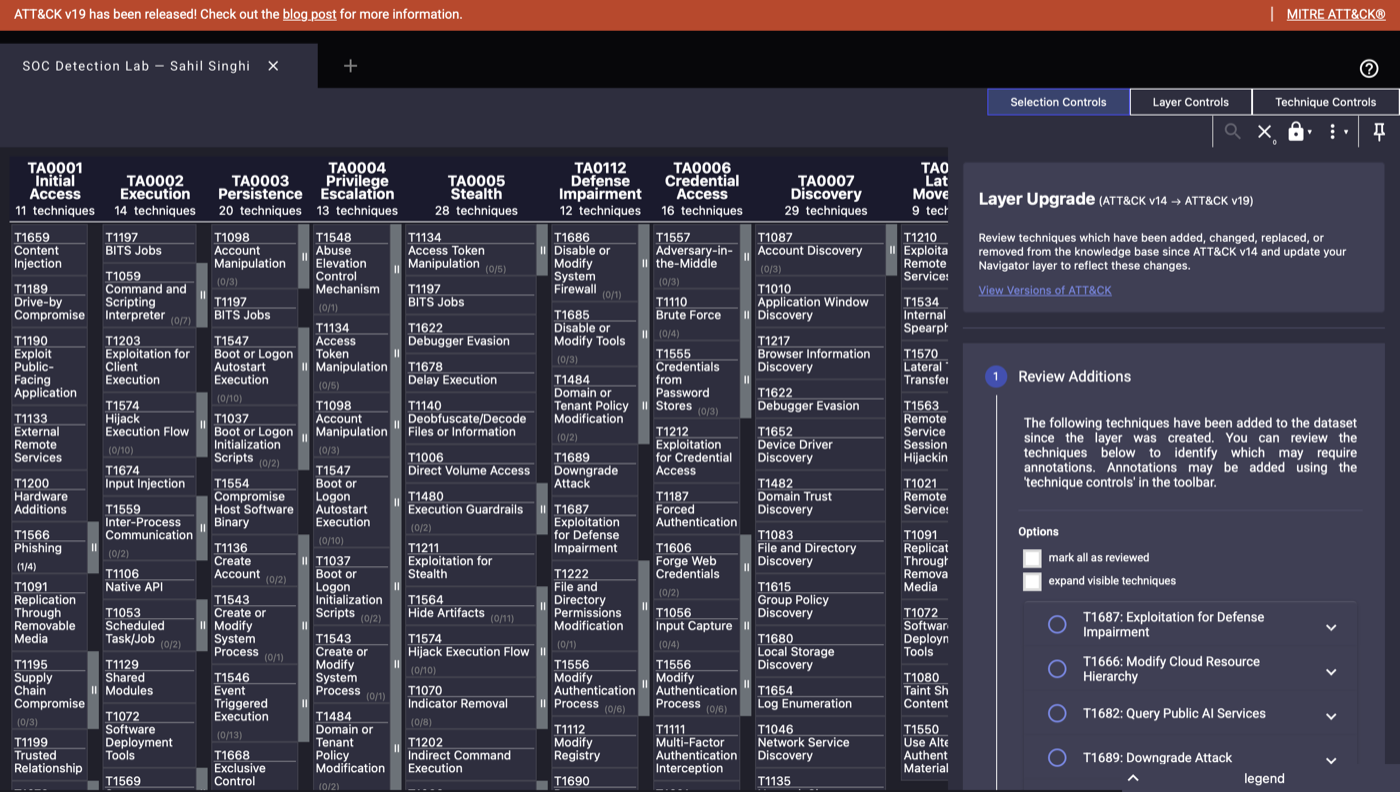
### MITRE ATT&CK Navigator 层
展示本实验室部署的 32 条检测规则所覆盖技术的热力图。
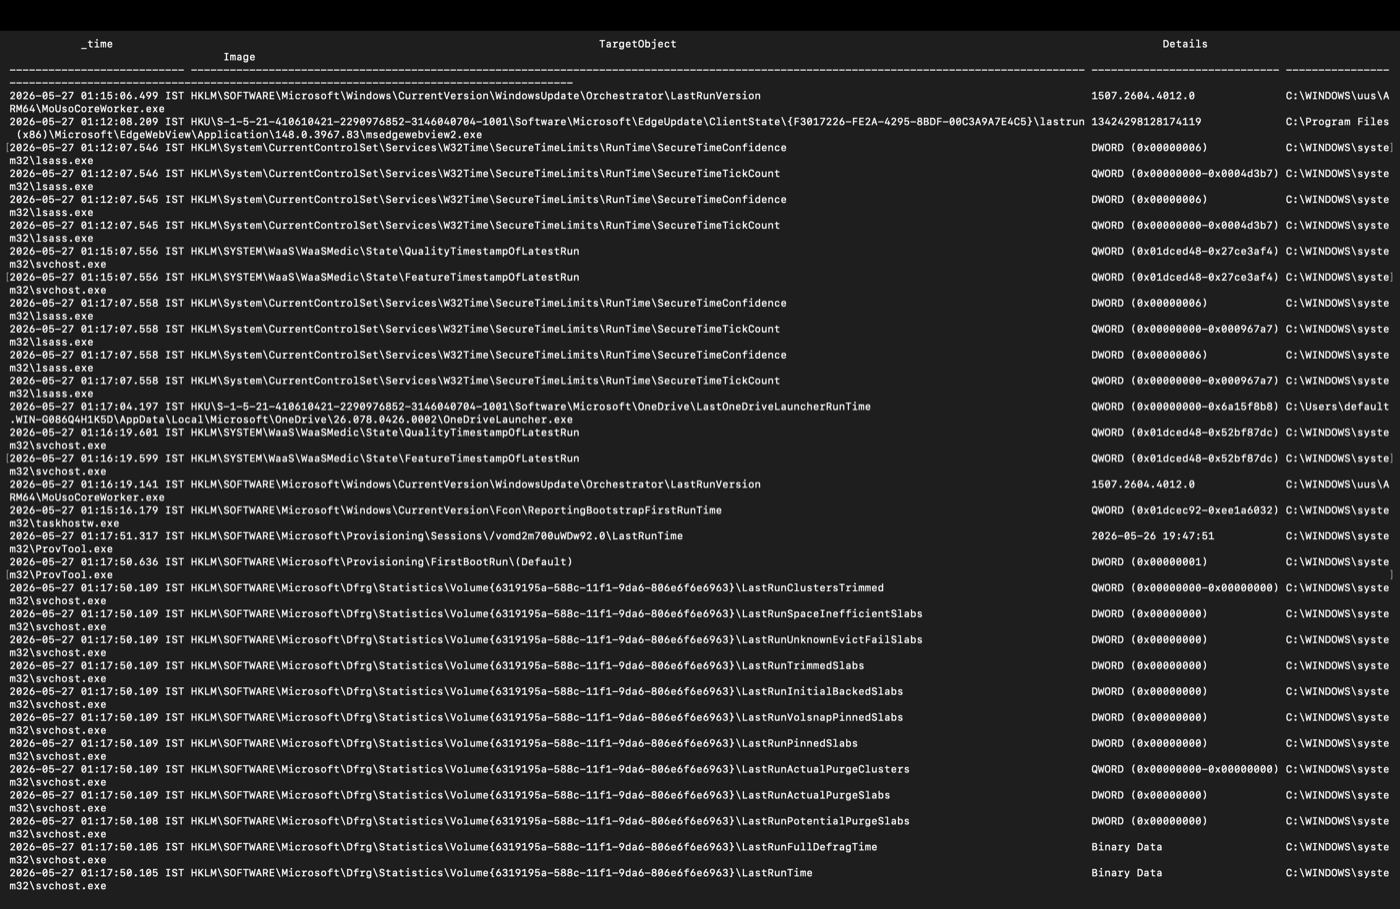
### T1547.001 注册表 Run 键 — 攻击已确认
端到端验证:Atomic Red Team 攻击 → Sysmon EventCode 13 → Splunk 索引事件。
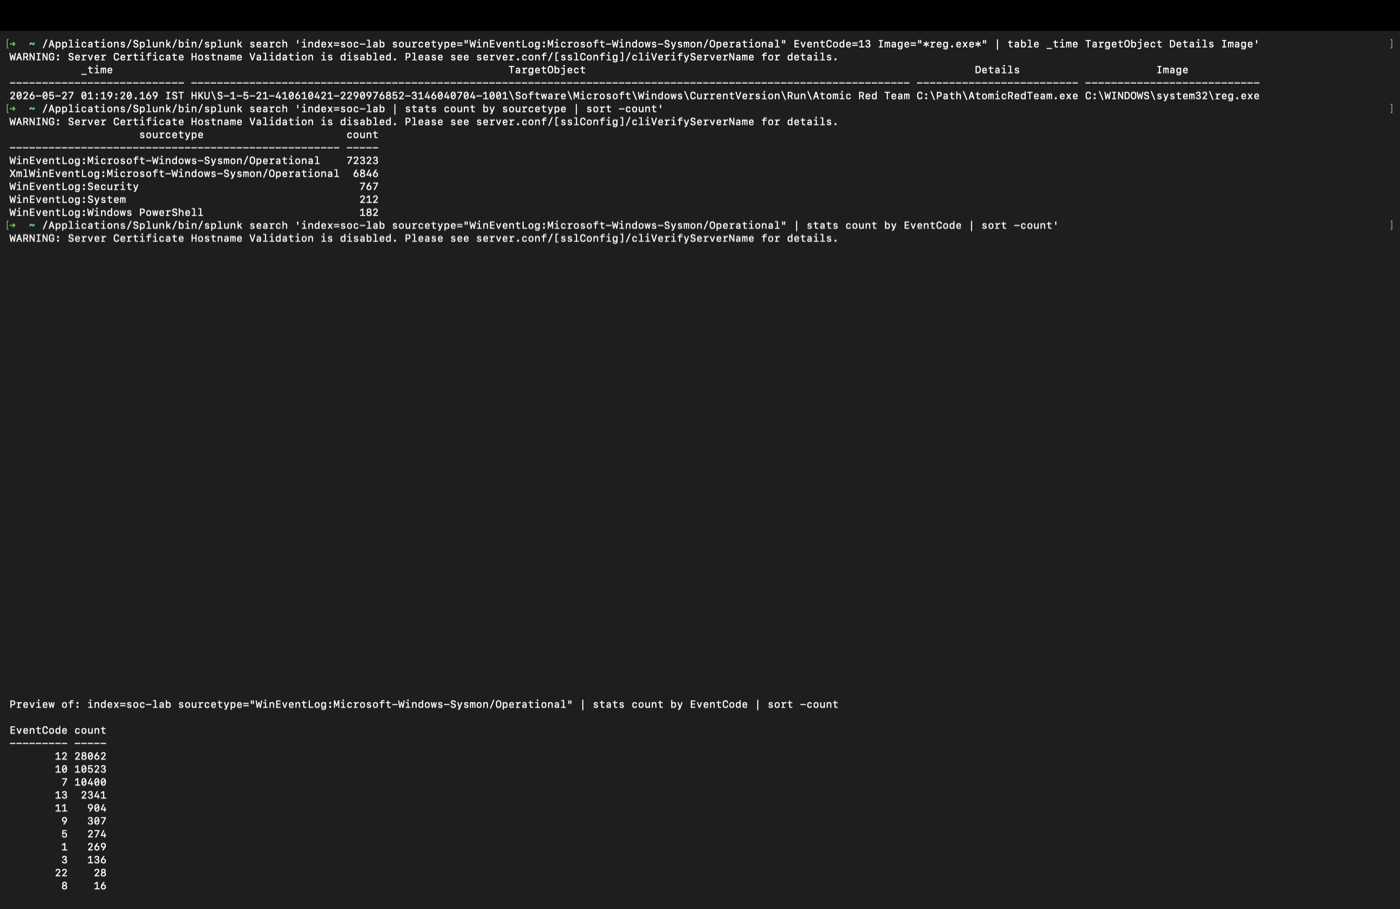
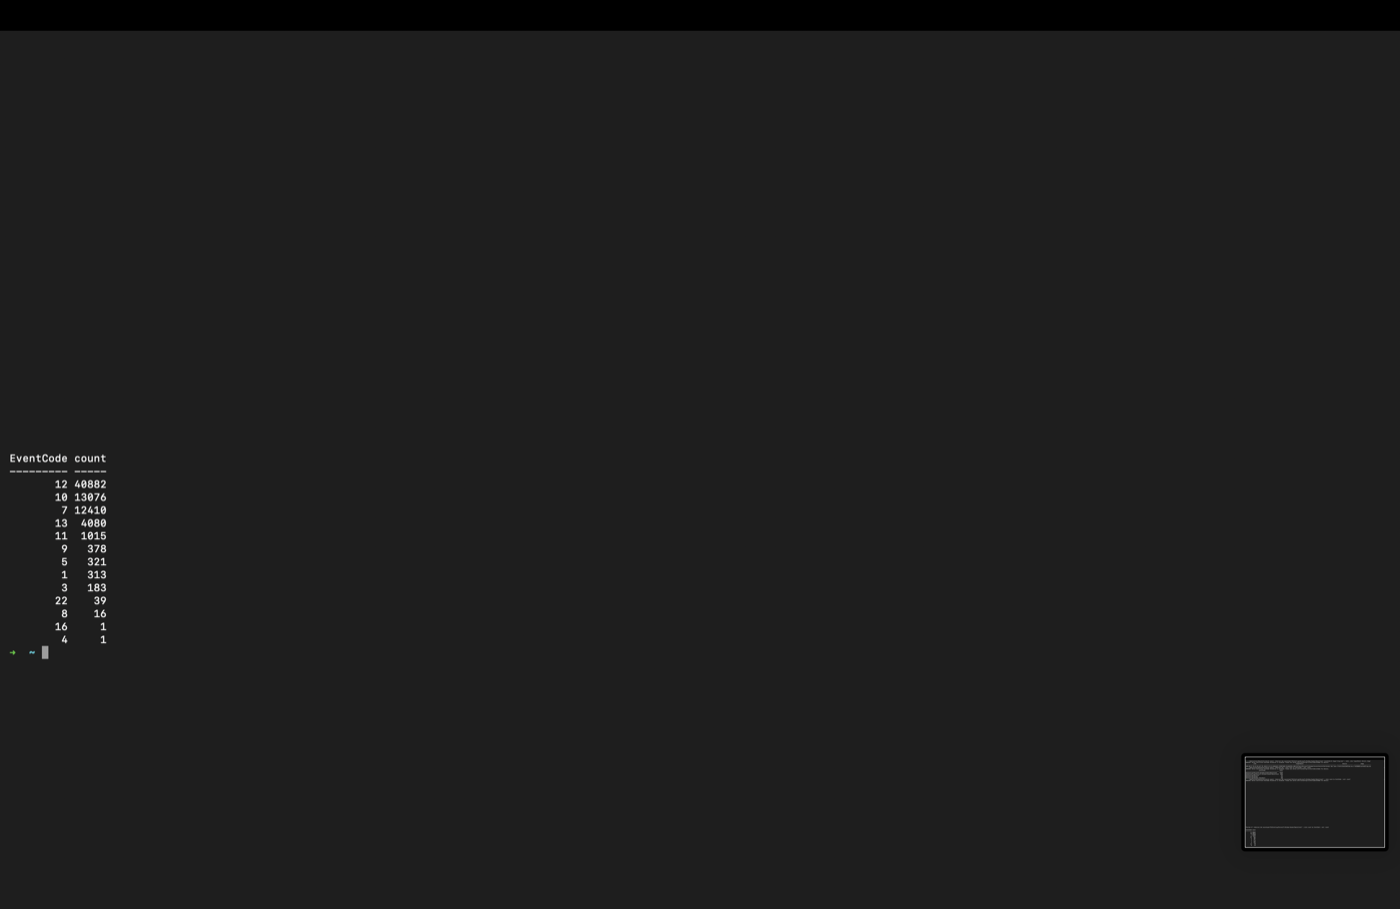
### Splunk 搜索结果
`soc-lab` 索引中的 Sysmon EventCode 分解和 sourcetype 分布。
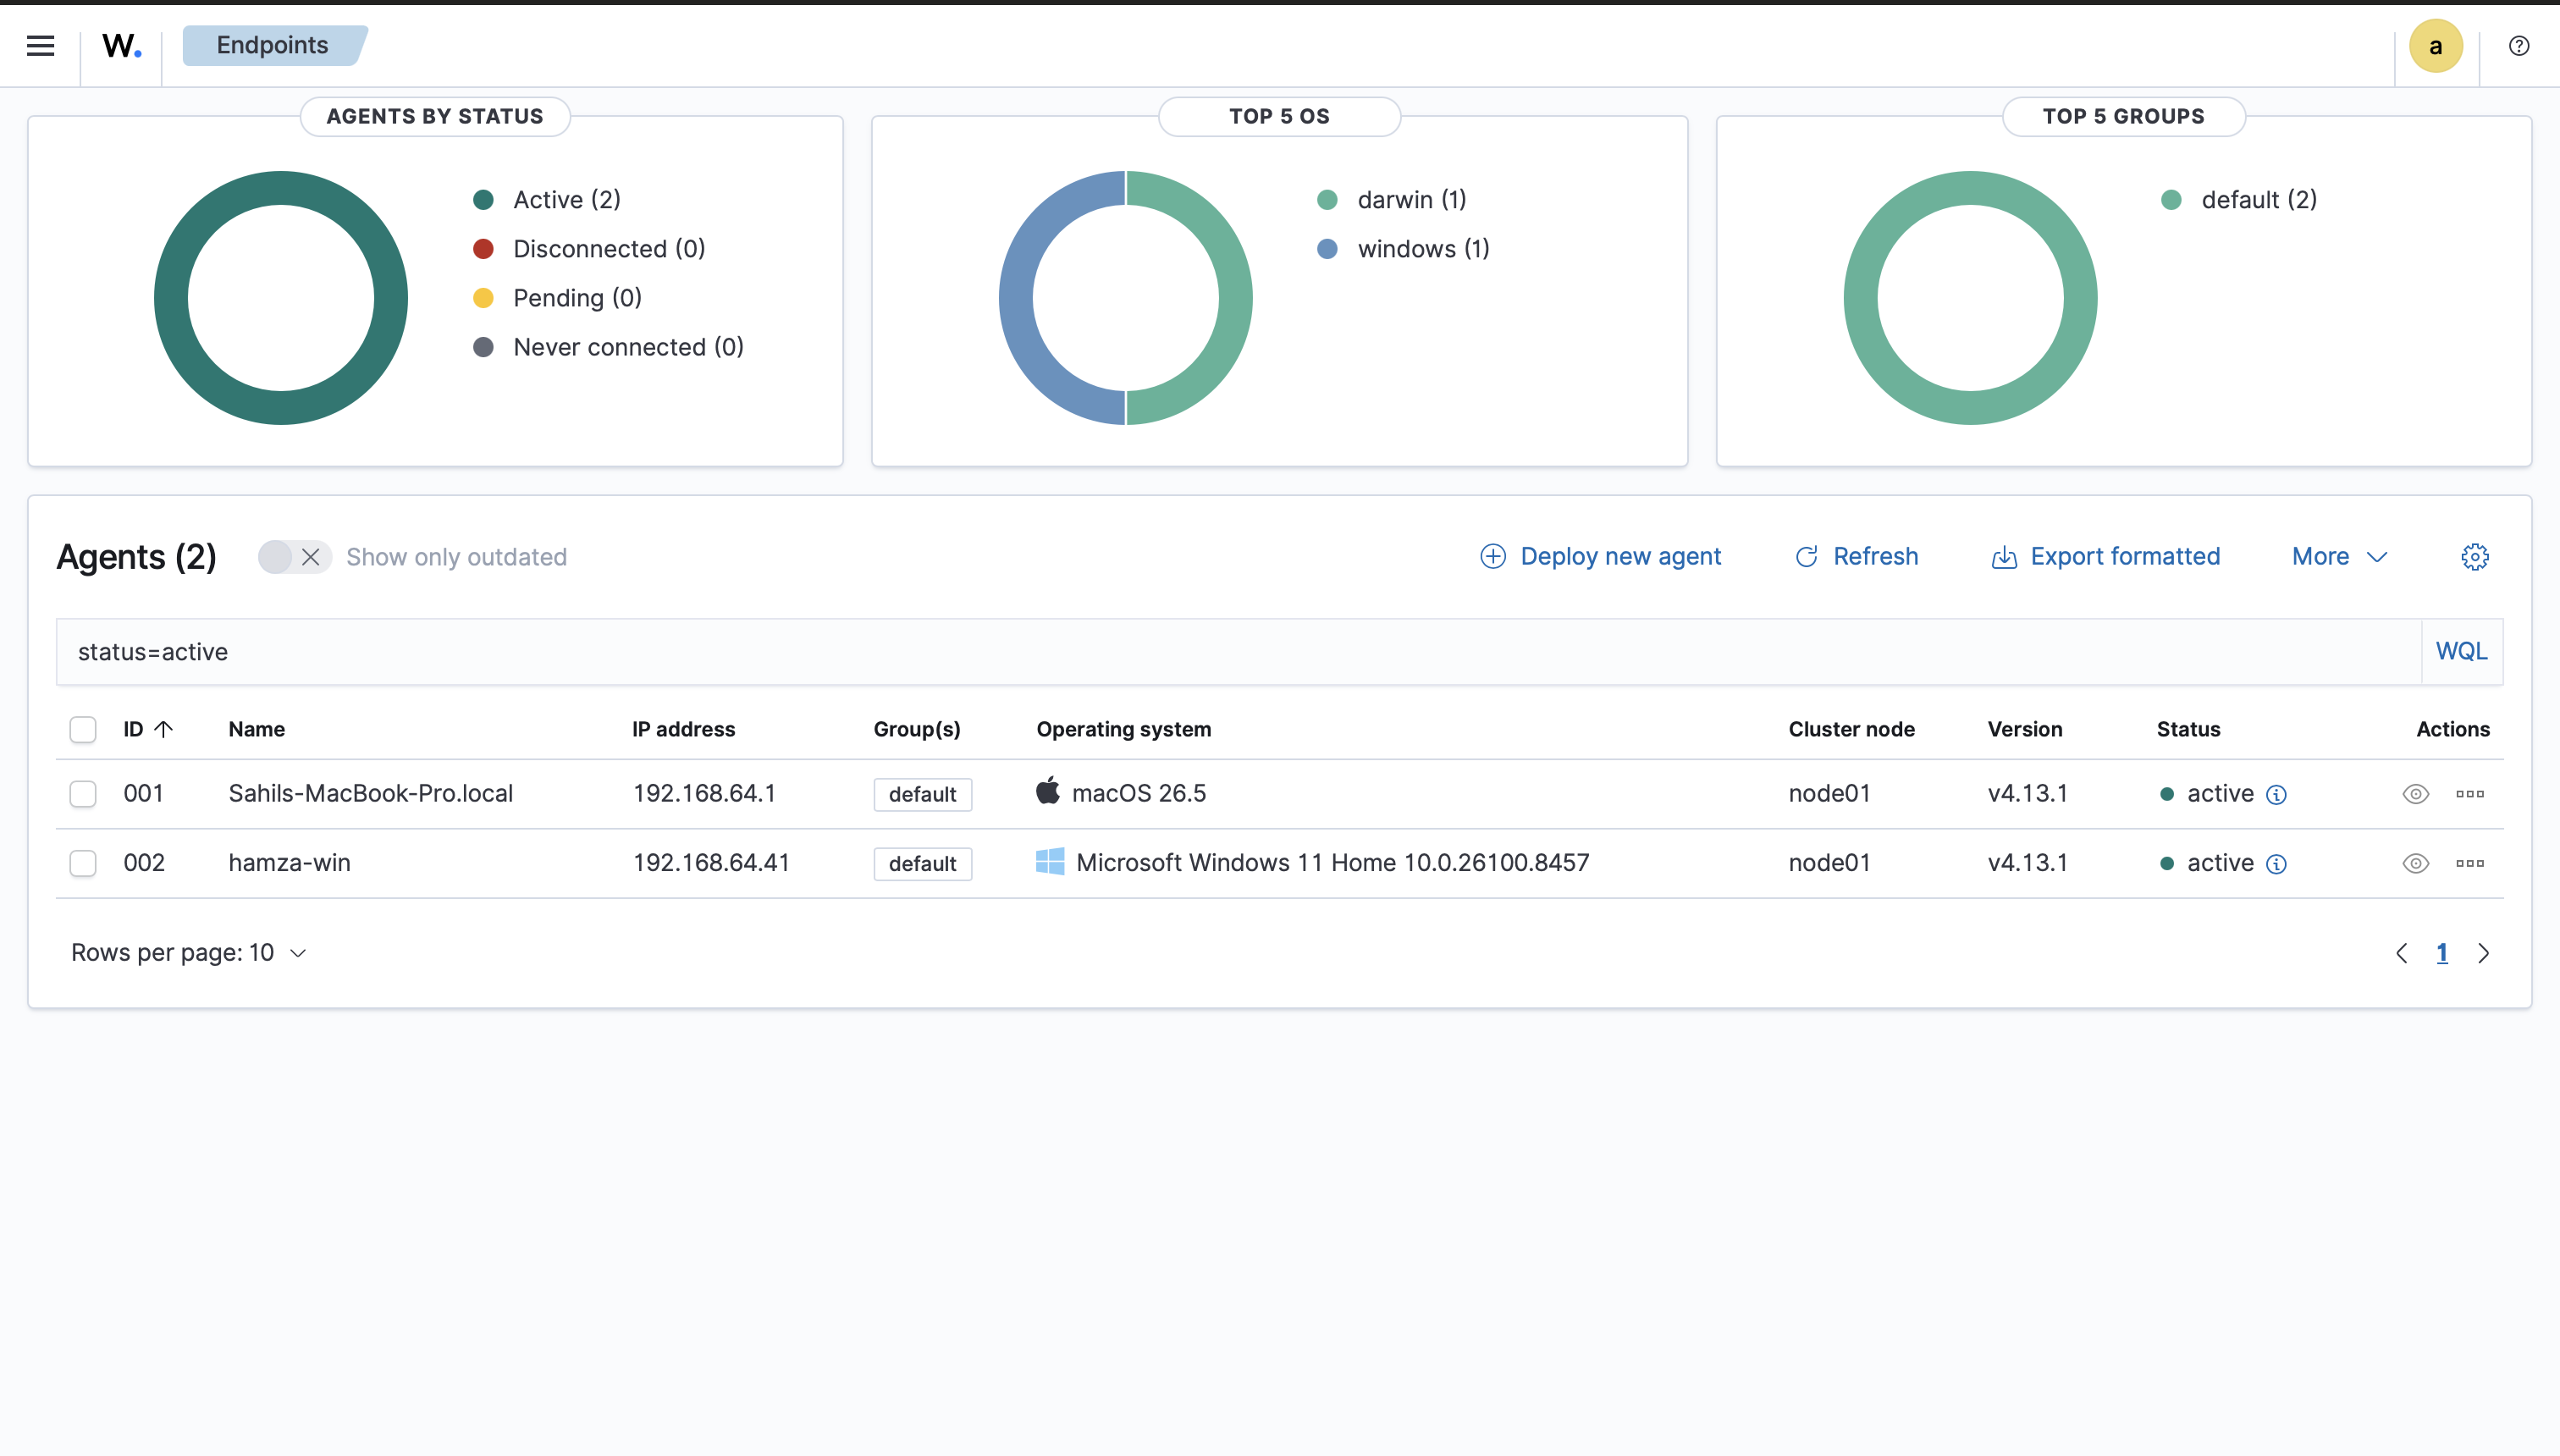
### Wazuh — 双 Agent 活跃
与 Splunk 并行运行的辅助 SIEM。macOS 主机和 Windows 11 ARM64 虚拟机均向 Wazuh manager 报告为活跃状态。
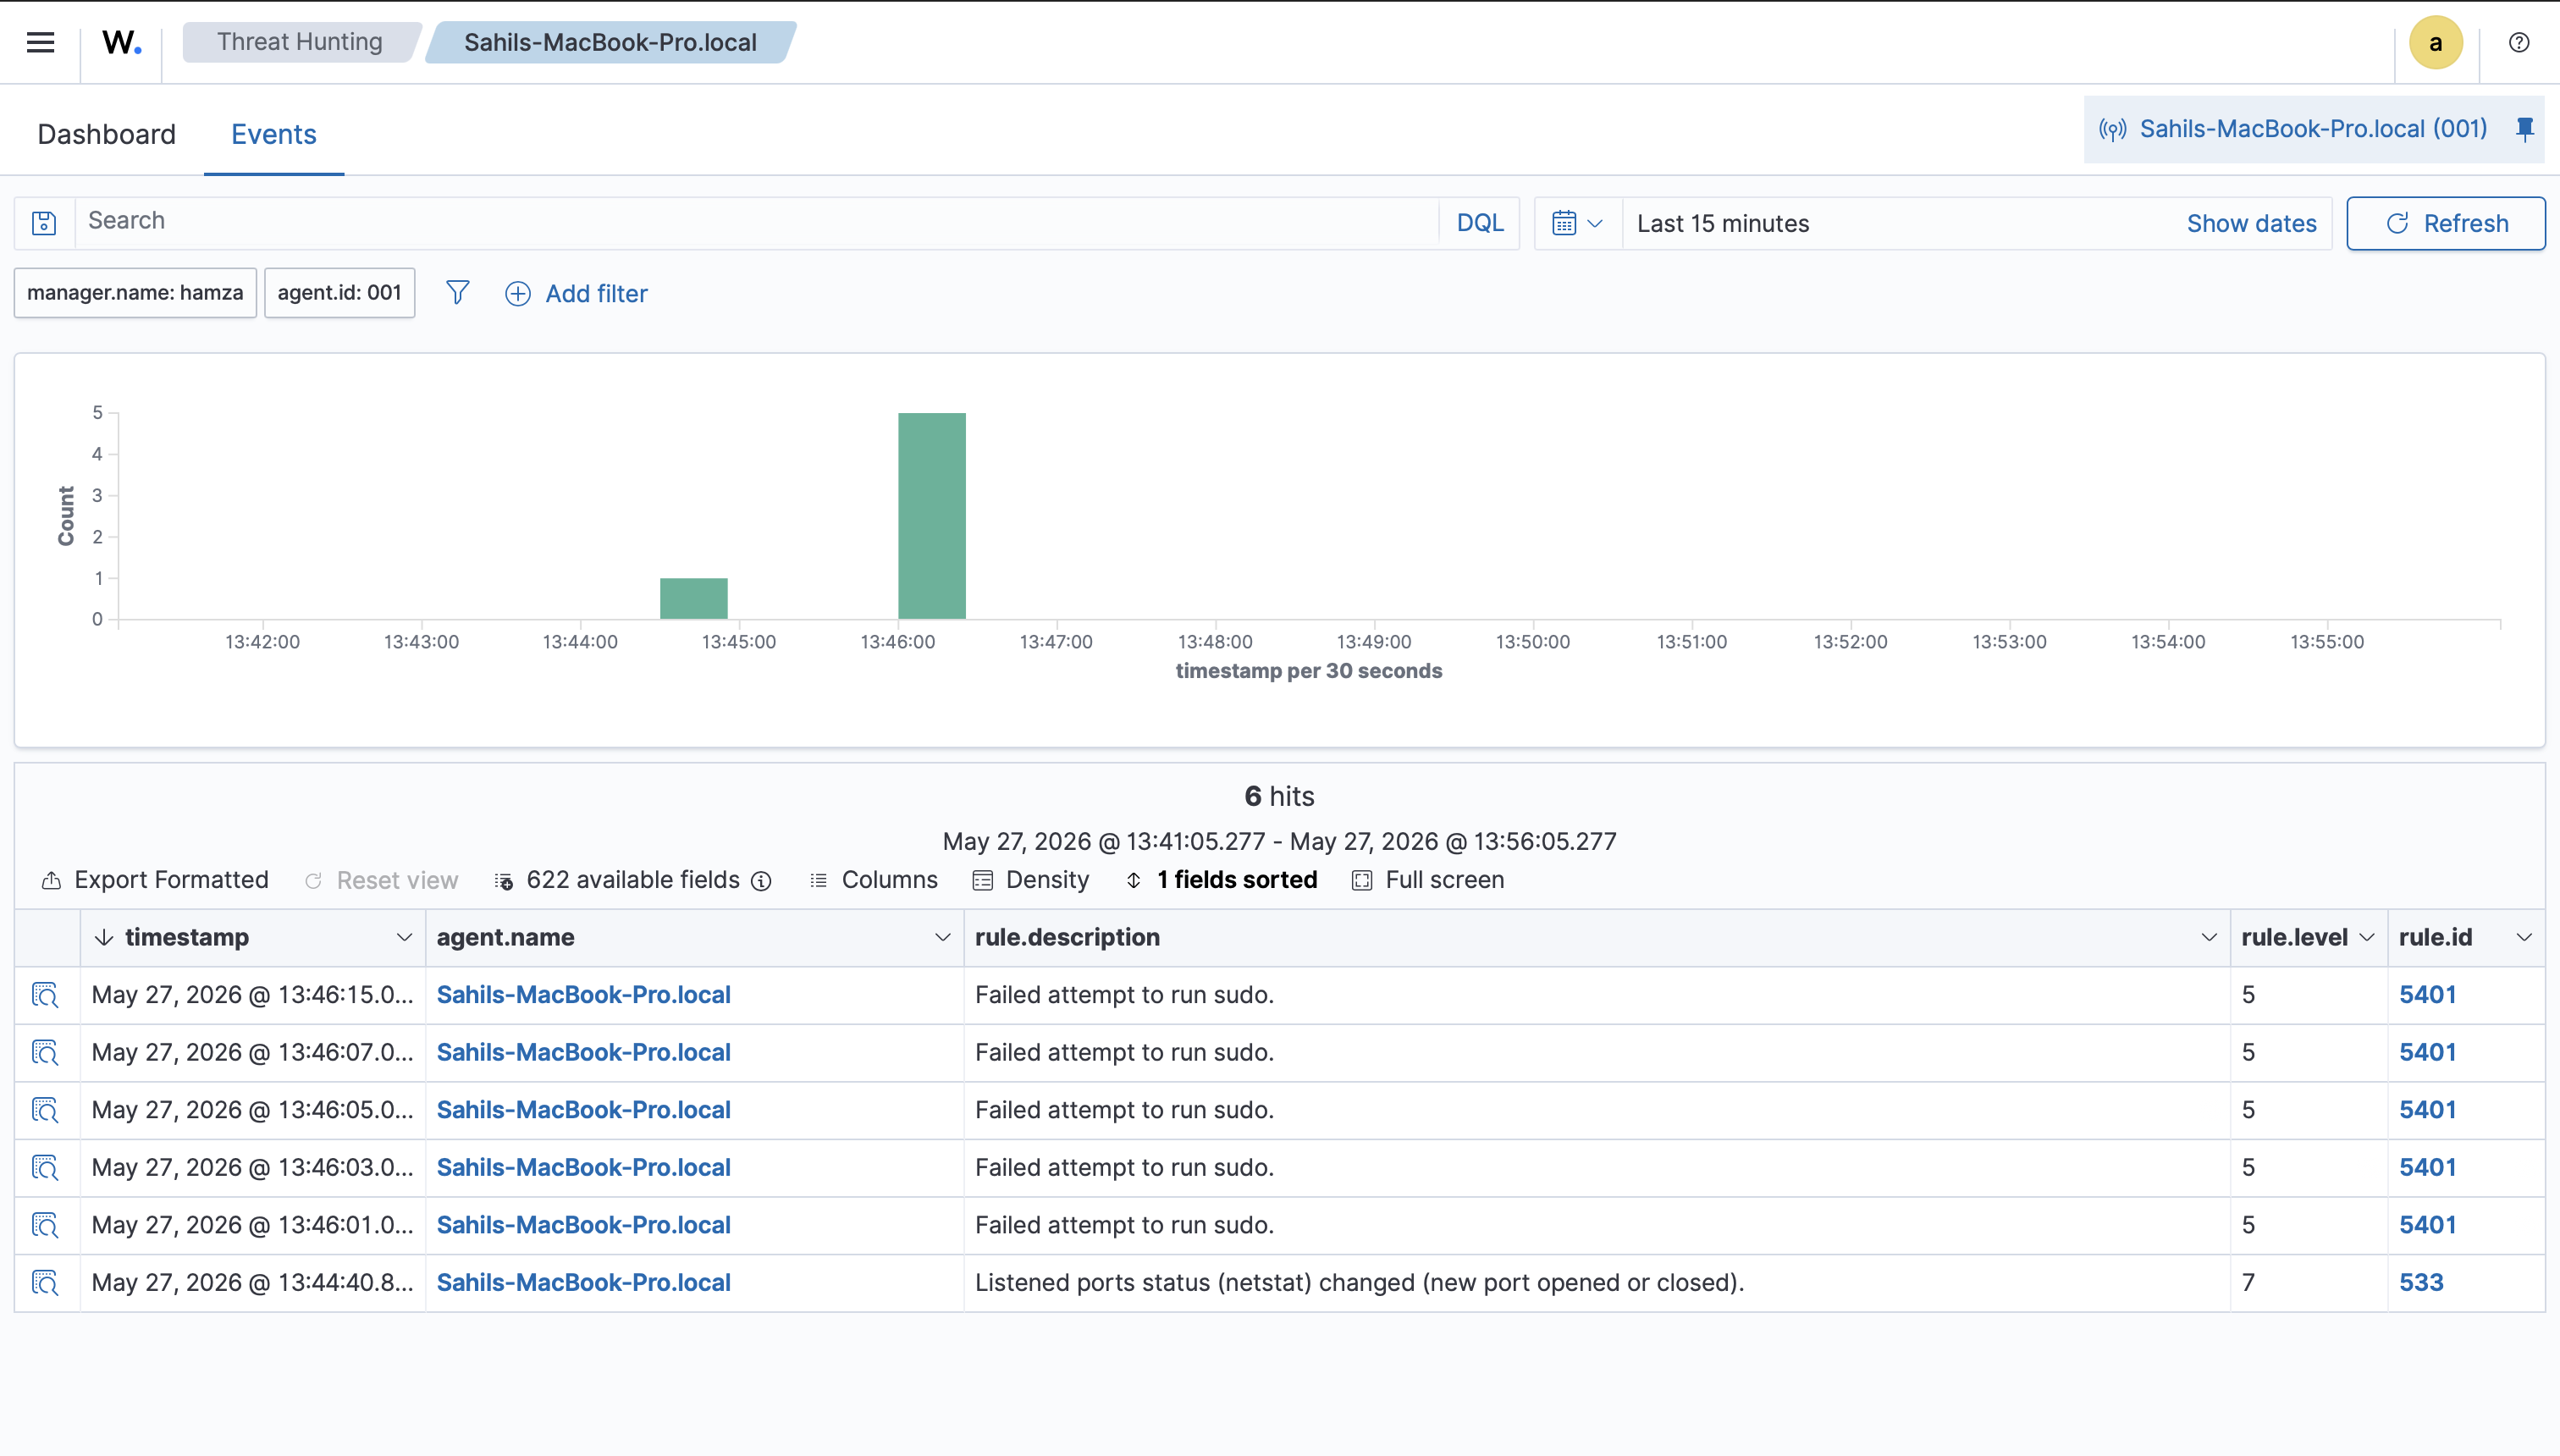
### Wazuh — 规则 5401 Sudo 失败检测
Mac agent 上的首个真实警报:5 次失败的 sudo 尝试被 Wazuh 内置的 macOS decoder 捕获,并在约 30 秒内显示在 Threat Hunting 中。
## 📝 简历要点
## 🤝 作者
**Sahil Singhi** | [github.com/sahilsinghi](https://github.com/sahilsinghi)
标签:AI合规, PE 加载器, Wazuh, 安全实验室, 安全运营, 扫描框架