Yassine12c/zabbix-monitoring-lab
GitHub: Yassine12c/zabbix-monitoring-lab
一个基于 Zabbix 与 Docker 的实验室项目,用于实时检测 SSH 和 RDP 暴力破解攻击,并与 GLPI 工单系统集成实现告警的自动化创建与分配。
Stars: 1 | Forks: 0
# 🛡️ Zabbix 监控实验室 — 攻击检测 & GLPI 集成
   
完整的网络监控项目,通过 Docker 将 Zabbix 7.4 部署在 AWS EC2 上。包括对 SSH 和 RDP 暴力破解攻击的实时检测,并在 GLPI 中自动创建工单分配给负责的技术人员。
## 📋 描述
- 通过 Docker Compose 在 AWS EC2 上部署 Zabbix Server 7.4
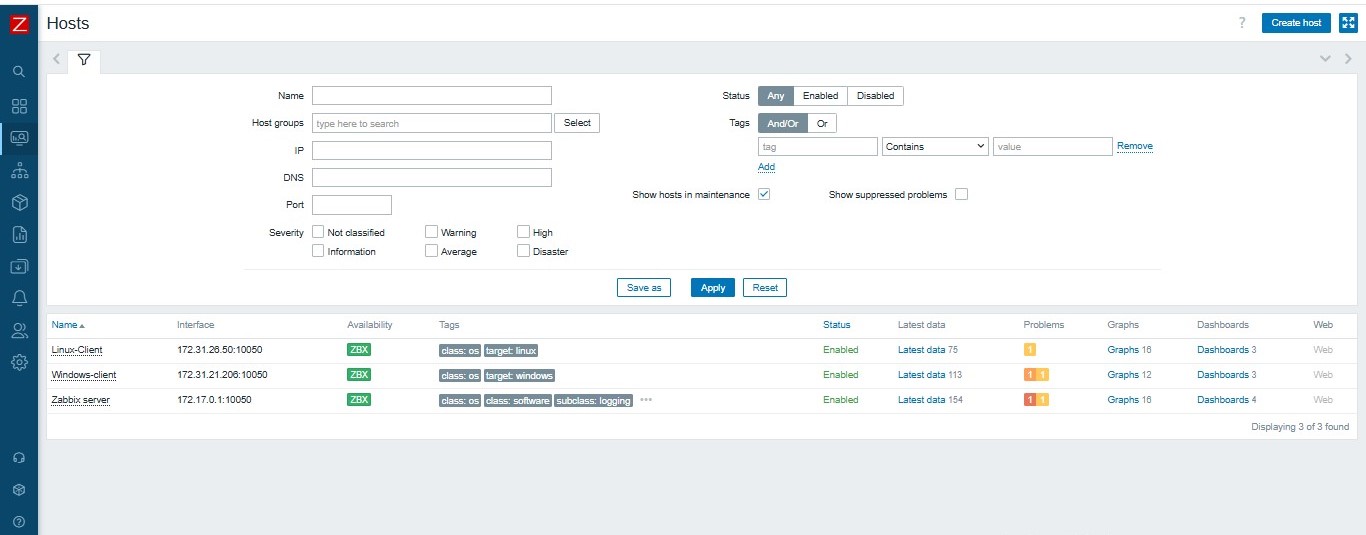
- 3 台被监控机器:Zabbix Server、Linux-Client、Windows-Client
- 通过 auth.log 日志检测 Linux 服务器上的 SSH 暴力破解
- 通过 Event ID 4625 检测 Windows 上的 RDP 暴力破解
- GLPI 集成:通过 API REST + Webhook 自动创建工单
- 根据严重程度自动分配给技术人员
- 通过 SMTP 配置 Gmail 告警
## 🏗️ 架构
VM_SERVER_ZABBIX (172.31.16.197) : Zabbix Server + Docker
VM_GLPI (44.211.180.168) : GLPI + MariaDB
VM_CLIENT_ZABBIX (172.31.26.50) : Linux client monitored
VM_CLIENT_WINDOWS (172.31.21.206) : Windows client monitored
流程:Linux-Client 发起 SSH/RDP 攻击 → Zabbix 检测 → Webhook → GLPI 创建工单 → 分配给 tech
## 📸 截图
## ⚙️ 安装说明
### 前置条件
- AWS EC2 Ubuntu 24.04 (t3.medium)
- Docker + Docker Compose
- Linux 和 Windows 上的 Zabbix Agent
- 端口:22, 80, 8080, 10050, 10051
### 步骤 1 — Zabbix Server Docker
mkdir ~/zabbix && cd ~/zabbix
nano docker-compose.yml
docker compose up -d
### 步骤 2 — Linux Agent
sudo nano /etc/zabbix/zabbix_agentd.conf
Server=127.0.0.1,172.17.0.1,172.18.0.2
ServerActive=127.0.0.1
Hostname=Zabbix server
sudo systemctl restart zabbix-agent
### 步骤 3 — Windows Agent
Server=172.31.16.197
ServerActive=172.31.16.197
Hostname=Windows-client
### 步骤 4 — AWS Security Group
端口 22 TCP SSH
端口 80 TCP GLPI Web
端口 8080 TCP Zabbix Web
端口 10050 TCP Zabbix Agent
端口 10051 TCP Zabbix Server
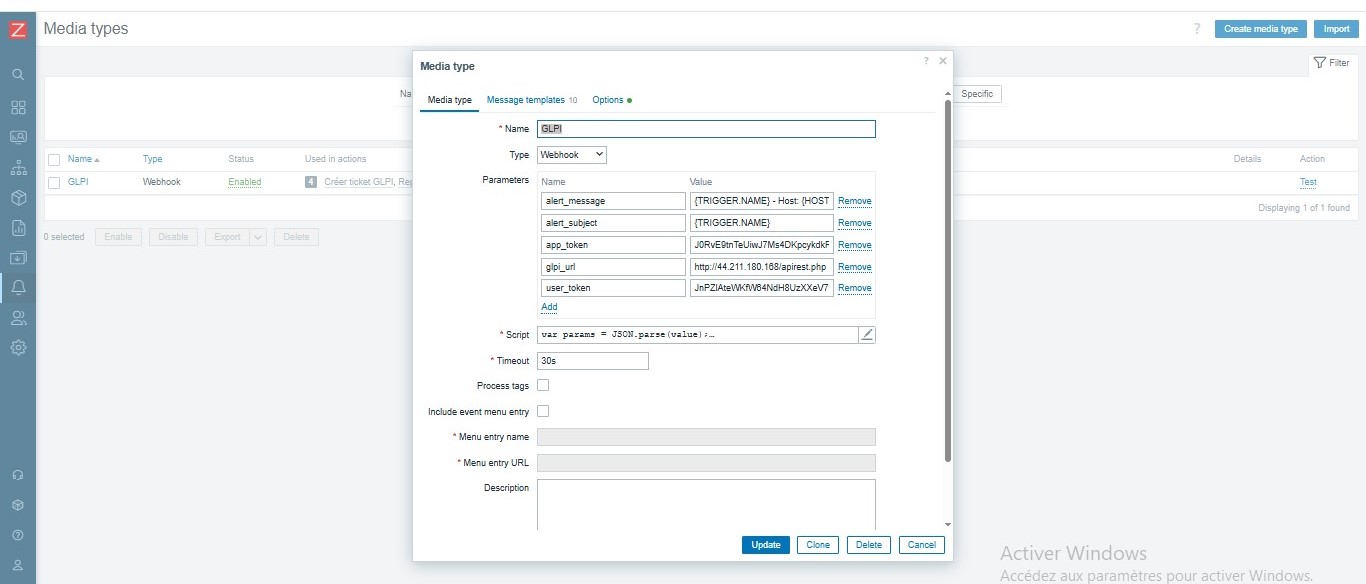
## 🔗 GLPI 集成
### 流程
Zabbix 检测到 >= High 的告警
→ 动作:创建 GLPI 工单
→ Webhook JavaScript 调用 GLPI API REST
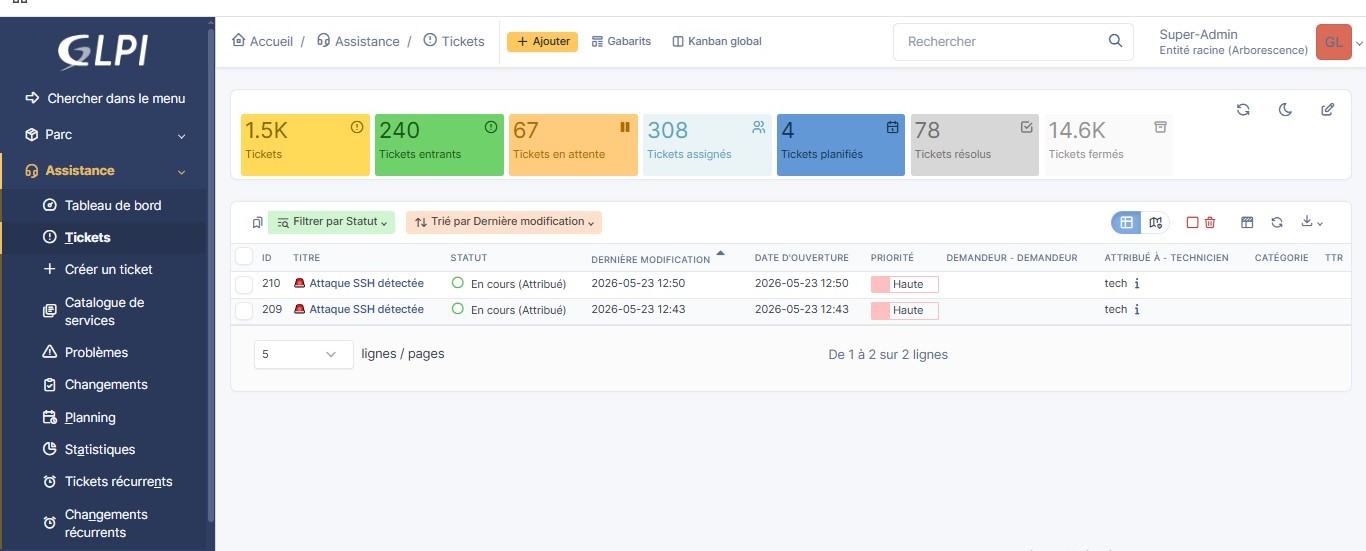
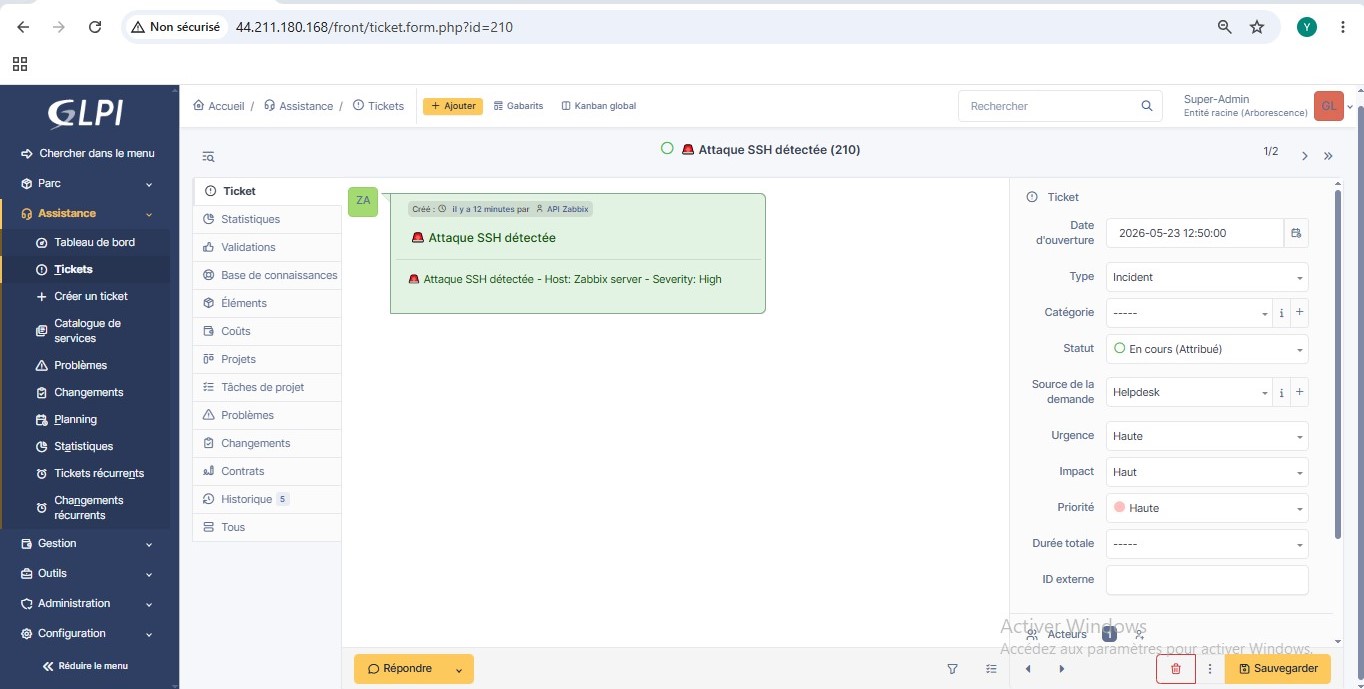
→ 自动创建工单
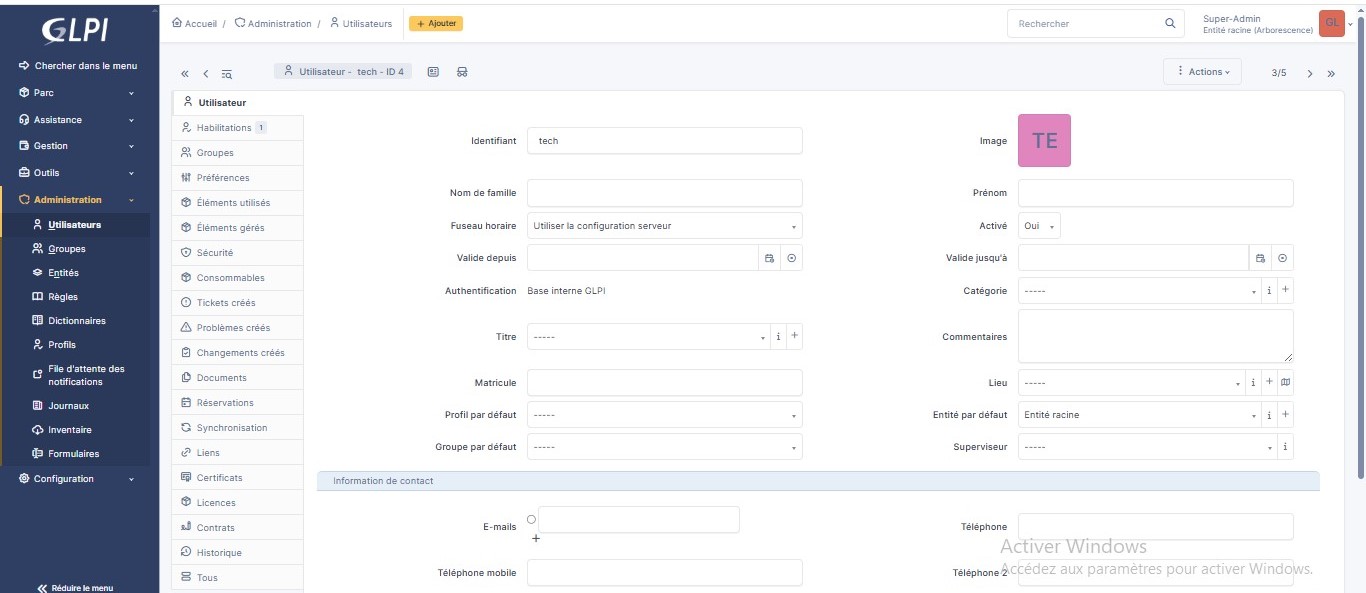
→ 分配给技术人员 tech (ID=4)
→ 根据严重程度动态调整优先级
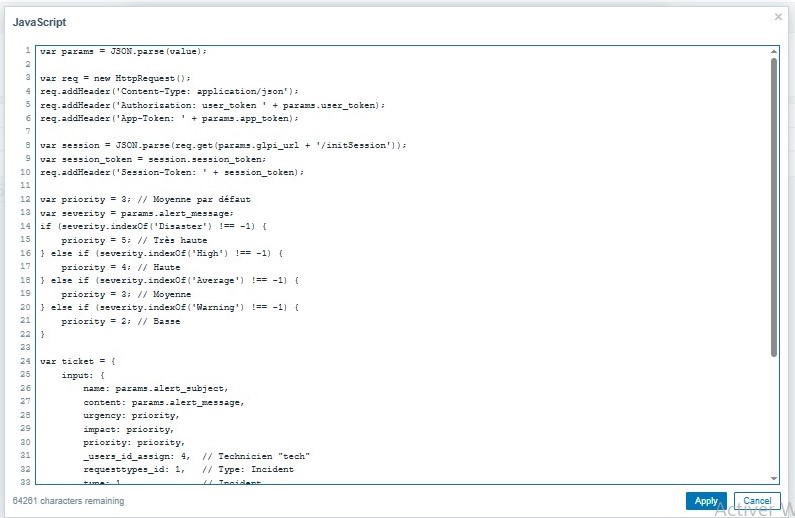
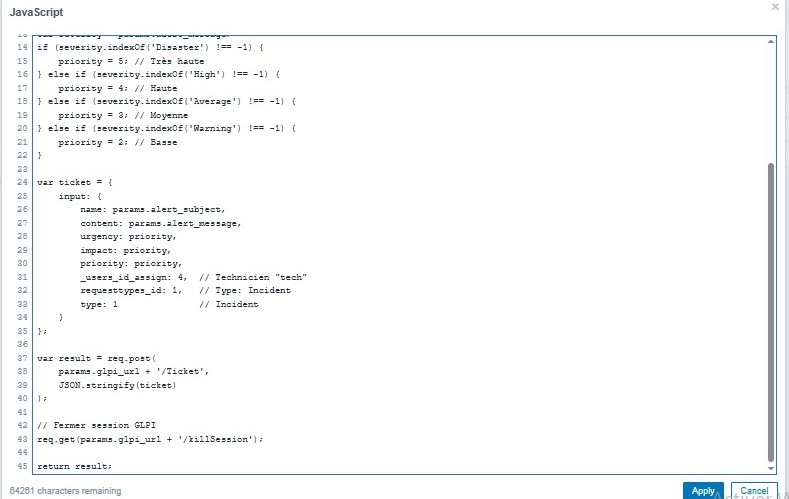
### Webhook JavaScript 脚本
var params = JSON.parse(value);
var req = new HttpRequest();
req.addHeader('Content-Type: application/json');
req.addHeader('Authorization: user_token ' + params.user_token);
req.addHeader('App-Token: ' + params.app_token);
var session = JSON.parse(req.get(params.glpi_url + '/initSession'));
req.addHeader('Session-Token: ' + session.session_token);
var priority = 3;
if (params.alert_message.indexOf('Disaster') !== -1) { priority = 5; }
else if (params.alert_message.indexOf('High') !== -1) { priority = 4; }
var ticket = { input: { name: params.alert_subject, content: params.alert_message, urgency: priority, impact: priority, priority: priority, _users_id_assign: 4, type: 1 }};
var result = req.post(params.glpi_url + '/Ticket', JSON.stringify(ticket));
req.get(params.glpi_url + '/killSession');
return result;
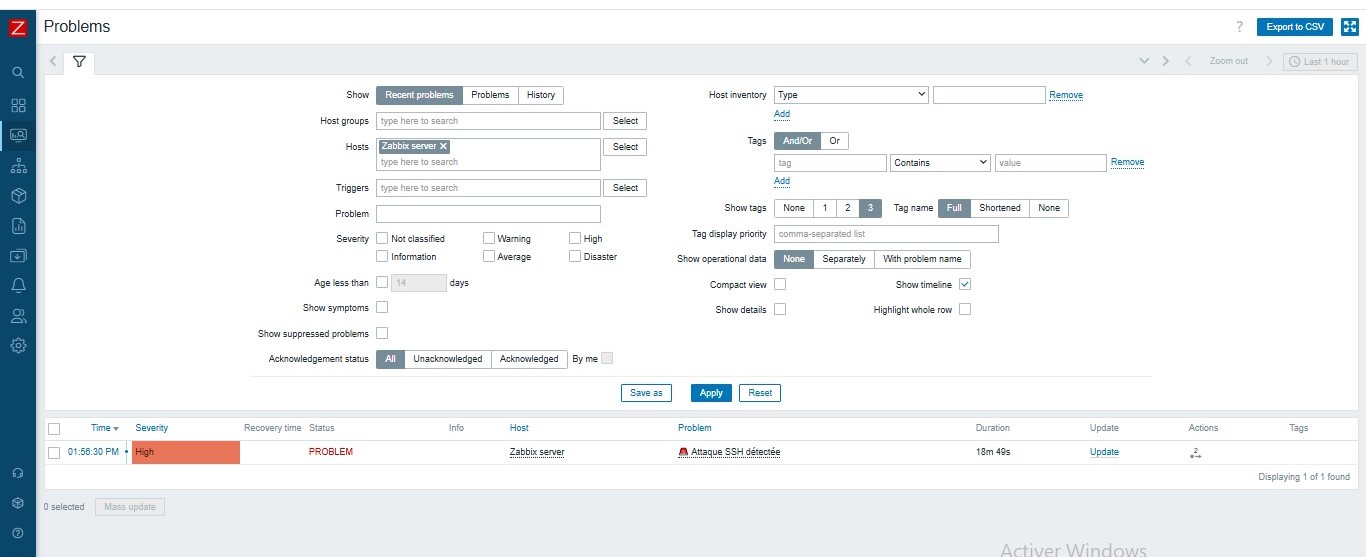
## 🔴 攻击场景
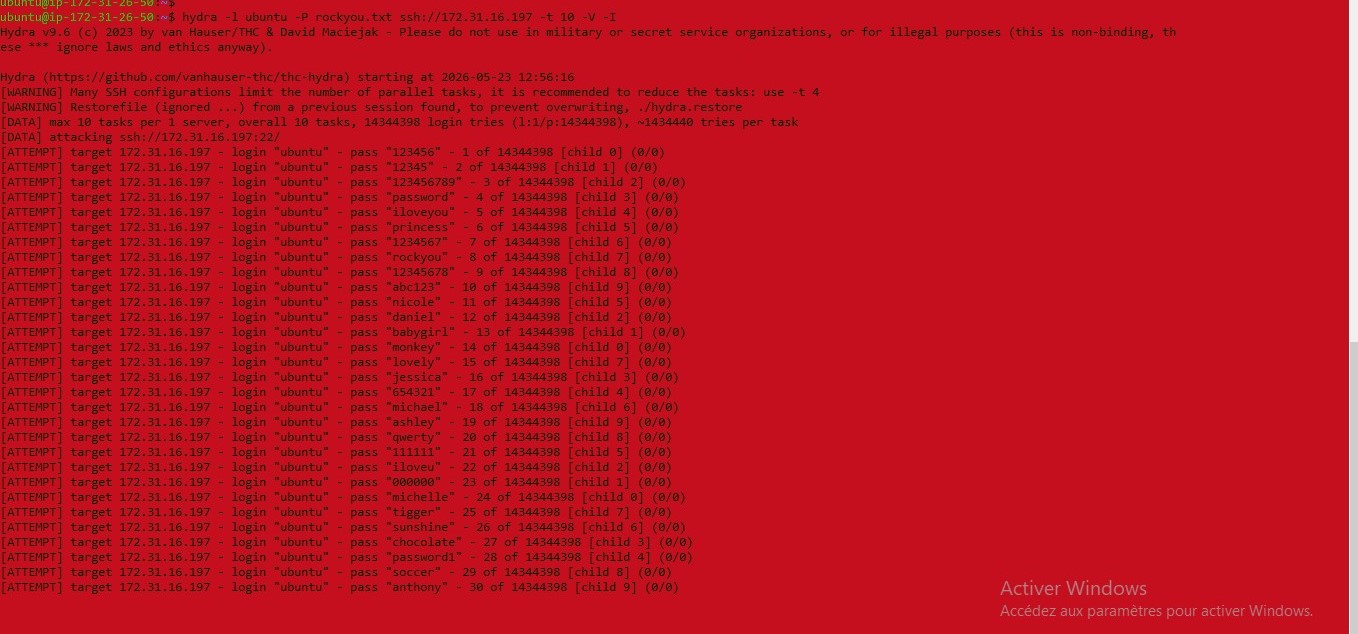
### SSH 暴力破解
hydra -l ubuntu -P ~/rockyou.txt ssh://172.31.16.197 -t 10 -V -I
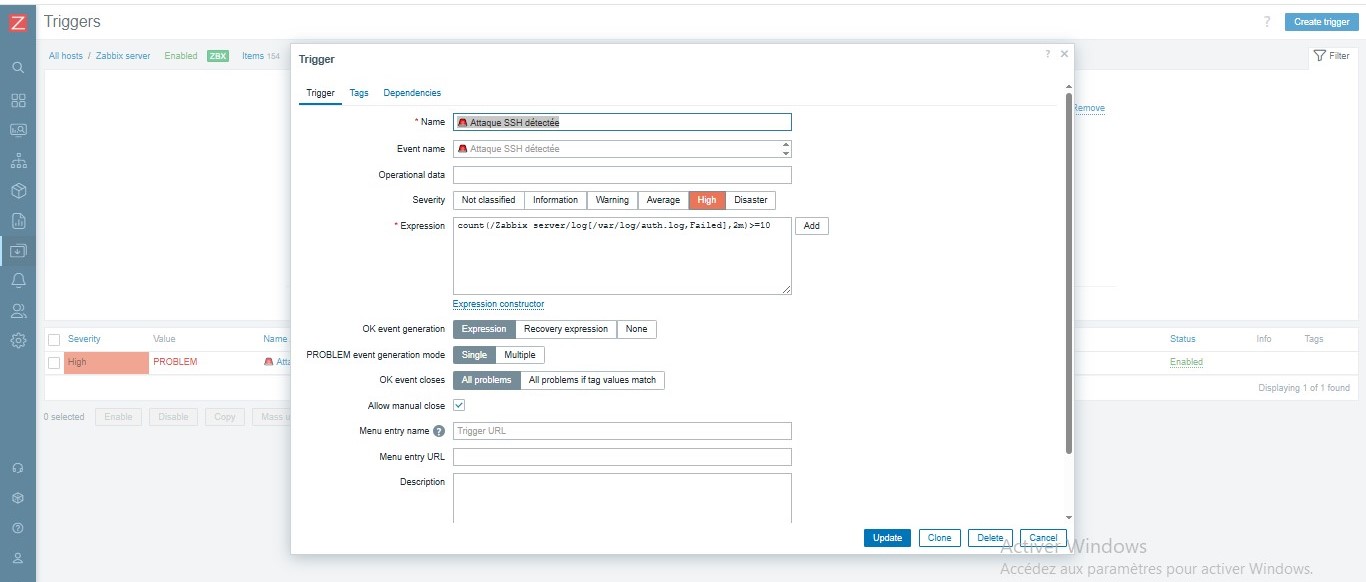
Trigger : count(/Zabbix server/log[/var/log/auth.log,Failed],2m)>=10
Severity : High — 模式:Single
### RDP 暴力破解
hydra -l Administrator -P ~/rockyou.txt rdp://172.31.21.206 -V -f -t 1 -W 3
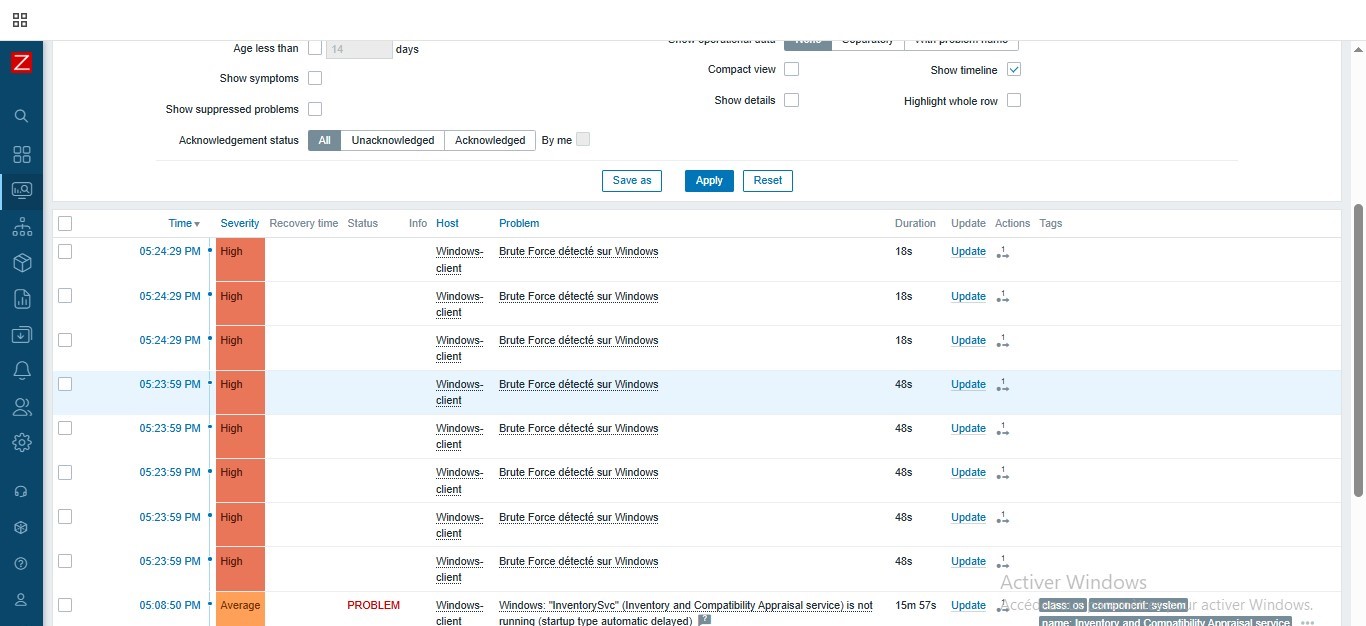
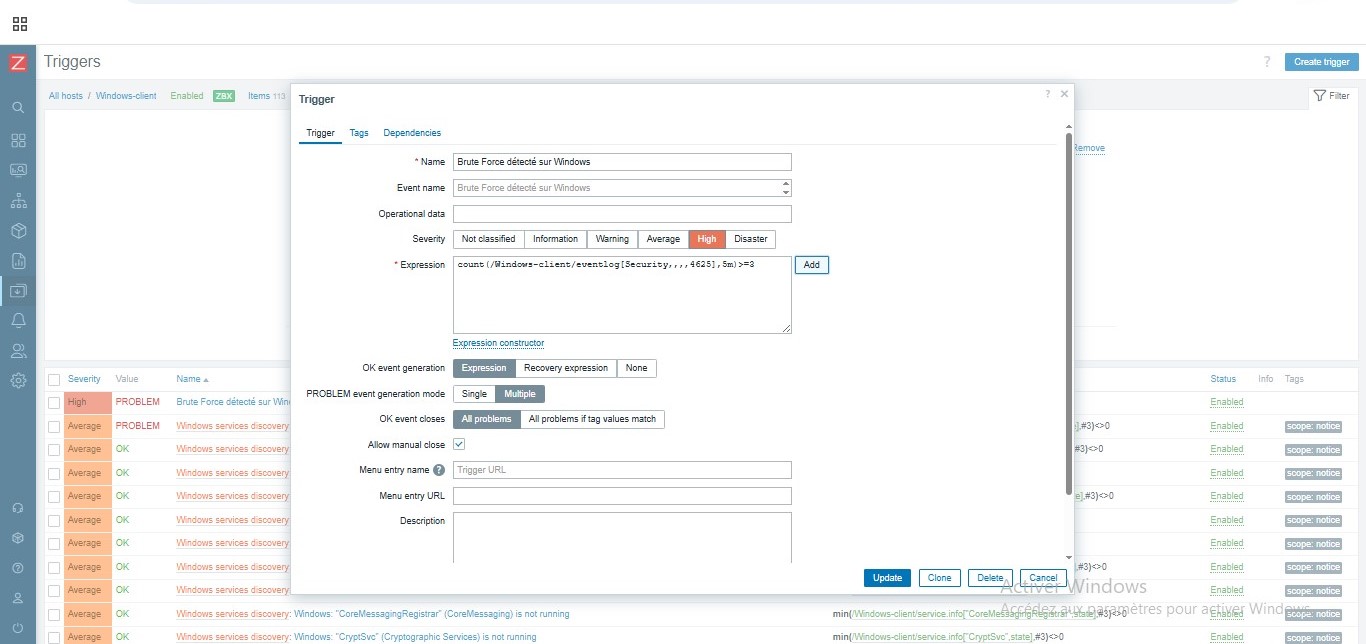
Trigger : count(/Windows-client/eventlog[Security,,,,4625],5m)>=3
Severity : High — 模式:Multiple
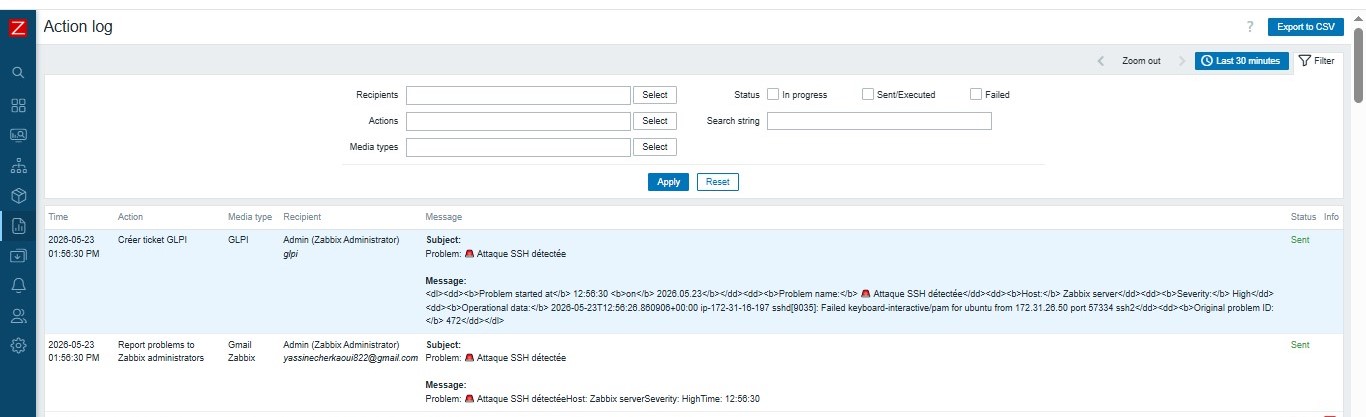
## 📧 Gmail
SMTP 服务器 : smtp.gmail.com
SMTP 端口 : 587
连接 : STARTTLS
## ✅ 最终结果
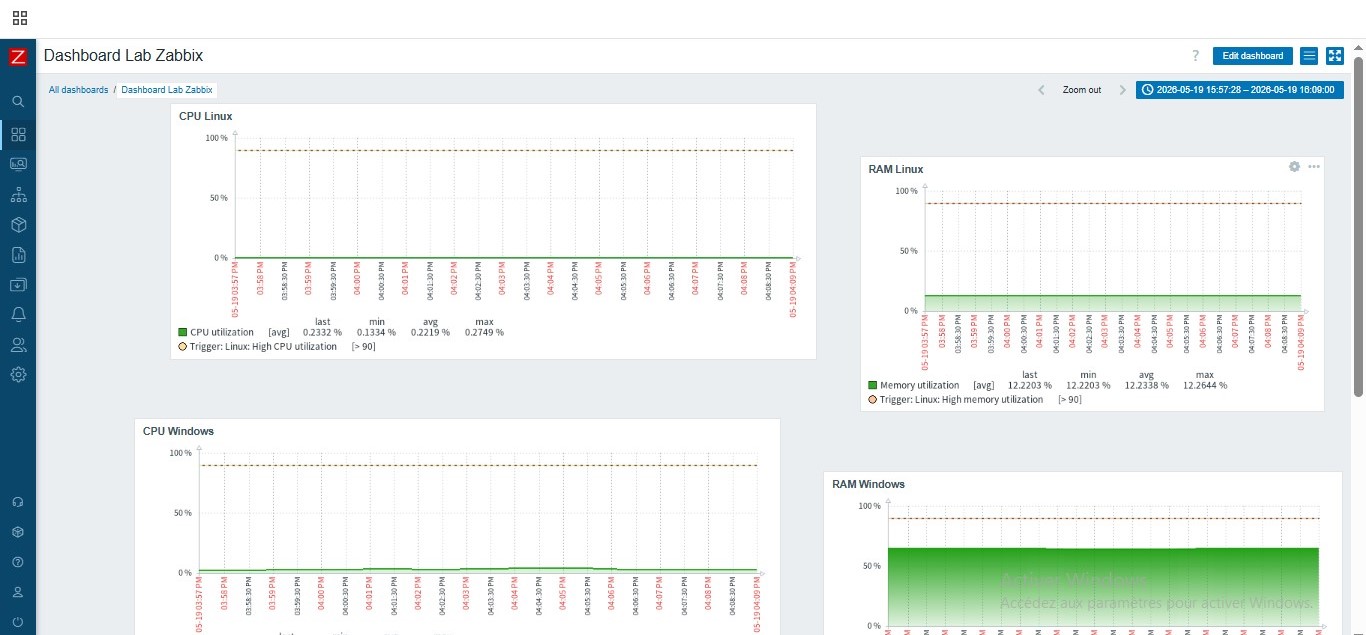
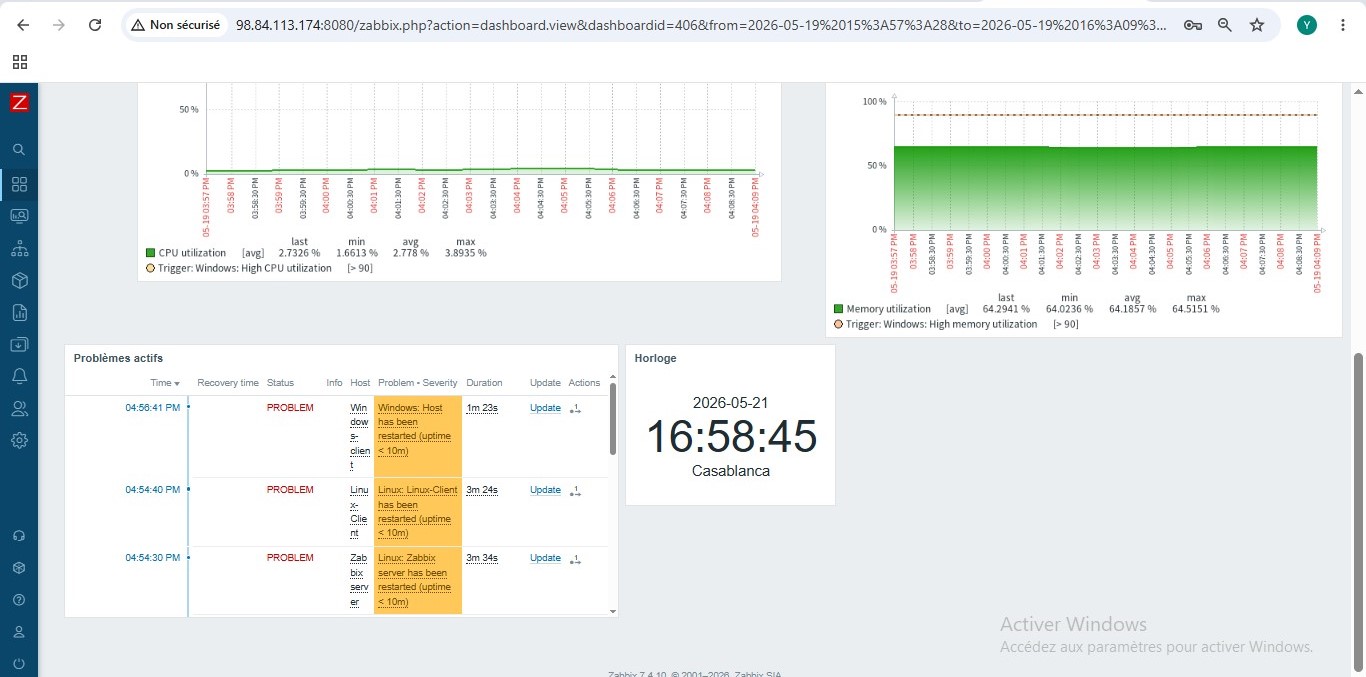
Zabbix Server Docker : 运行中
Zabbix Web 界面 : 端口 8080
Linux-Client Agent : ZBX 绿色
Windows-Client Agent : ZBX 绿色
Zabbix Server Agent : ZBX 绿色
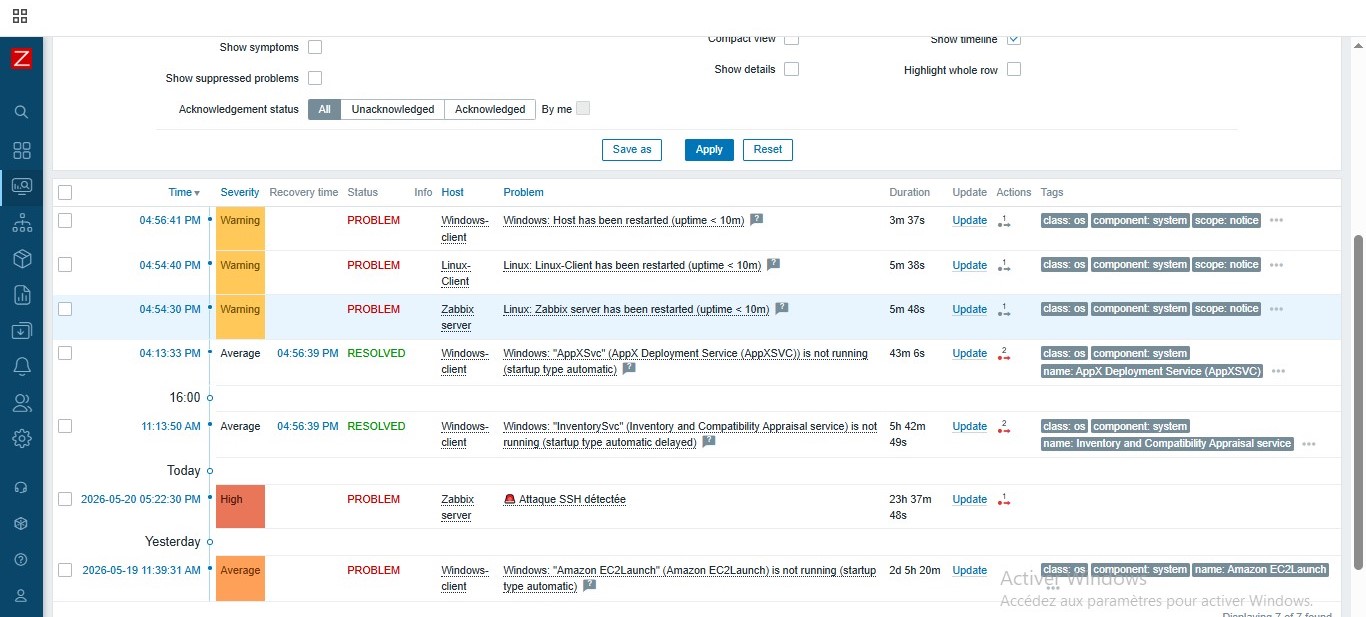
SSH 暴力破解检测 : High 告警
RDP 暴力破解检测 : High 告警
Gmail 通知 : 已配置
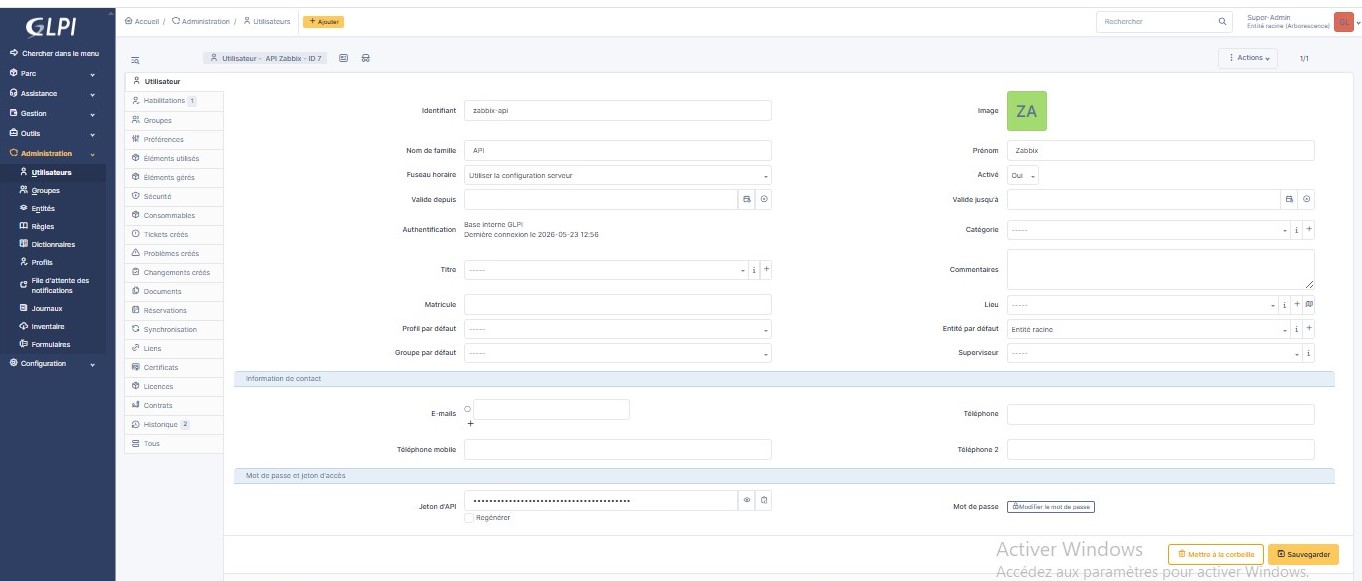
GLPI API 已启用 : REST + Token
GLPI Webhook : JS 脚本
GLPI 自动工单 : 每次攻击生成 1 个工单
技术人员分配 : tech (ID=4)
动态优先级 : High 级别对应为高
严重程度过滤 >= High : 已配置
## 🧠 遇到的问题
ZBX 红色 → 在 agent 的 Server= 中添加 172.18.0.2
Item eventlog Not supported → 更改为 Zabbix agent active
端口 10051 被阻止 → 在 AWS Security Group 中开放
Docker IP 变动 → 在 docker-compose.yml 中固定 IP
GLPI API Token 为 NULL → 仅通过 GLPI 界面生成
ERROR_NOT_ALLOWED_IP → 创建使用 0.0.0.0/0 范围的 API 客户端
ERROR_GLPI_LOGIN_USER_TOKEN → 使用由 GLPI 界面生成的 token
工单重复 → 模式设为 Single + 分离 Gmail 和 GLPI
TRIGGER.NAME 变量未解析 → 使用 alert_subject 和 alert_message
## 🔧 常用命令
docker ps
docker logs zabbix-zabbix-server-1 --tail 50
sudo systemctl status zabbix-agent
sudo tail -f /var/log/auth.log
curl -X GET http://GLPI_IP/apirest.php/initSession -H 'Authorization: user_token TOKEN' -H 'App-Token: APP_TOKEN'
docker exec -it glpi-db mariadb -u root -pglpi_root glpidb -e "UPDATE glpi_tickets SET status=6 WHERE status!=6;"
cd ~/zabbix && docker compose down && docker compose up -d
## 📁 结构
zabbix-monitoring-lab/
├── README.md
├── docker-compose.yml
├── zabbix_agentd.conf
├── zabbix/
└── screenshots/ (17 张图片)
本项目使用 Zabbix 7.4.10 + GLPI 10.x 在 AWS EC2 Ubuntu 24.04 上实现 — 2026年5月
标签:AWS EC2, Docker, GLPI, Zabbix, 免杀技术, 安全防御评估, 数据可视化, 暴力破解检测, 版权保护, 运维监控