tharkaratul/Splunk-SSH_Dashboard
GitHub: tharkaratul/Splunk-SSH_Dashboard
基于 Splunk 构建的 SSH 日志分析仪表板,通过可视化和 SPL 查询实现暴力破解检测与 IP 地理定位等安全监控功能。
Stars: 0 | Forks: 0
⚙️ 设置说明
请按照以下步骤在 Splunk 中配置 SSH 监控仪表板。
### 📌 第 1 步 — 添加仪表板 XML 复制 `dashboard.xml` 文件的内容。 然后打开仪表板源代码编辑器并粘贴 XML 代码以创建仪表板。 ### 📂 第 2 步 — 上传示例日志 上传 `ssh_logs_new.json` 文件以添加示例 SSH 日志数据。 ### ⏰ 第 3 步 — 设置时间范围 将仪表板时间范围设置为:所有时间 ### 截图 -->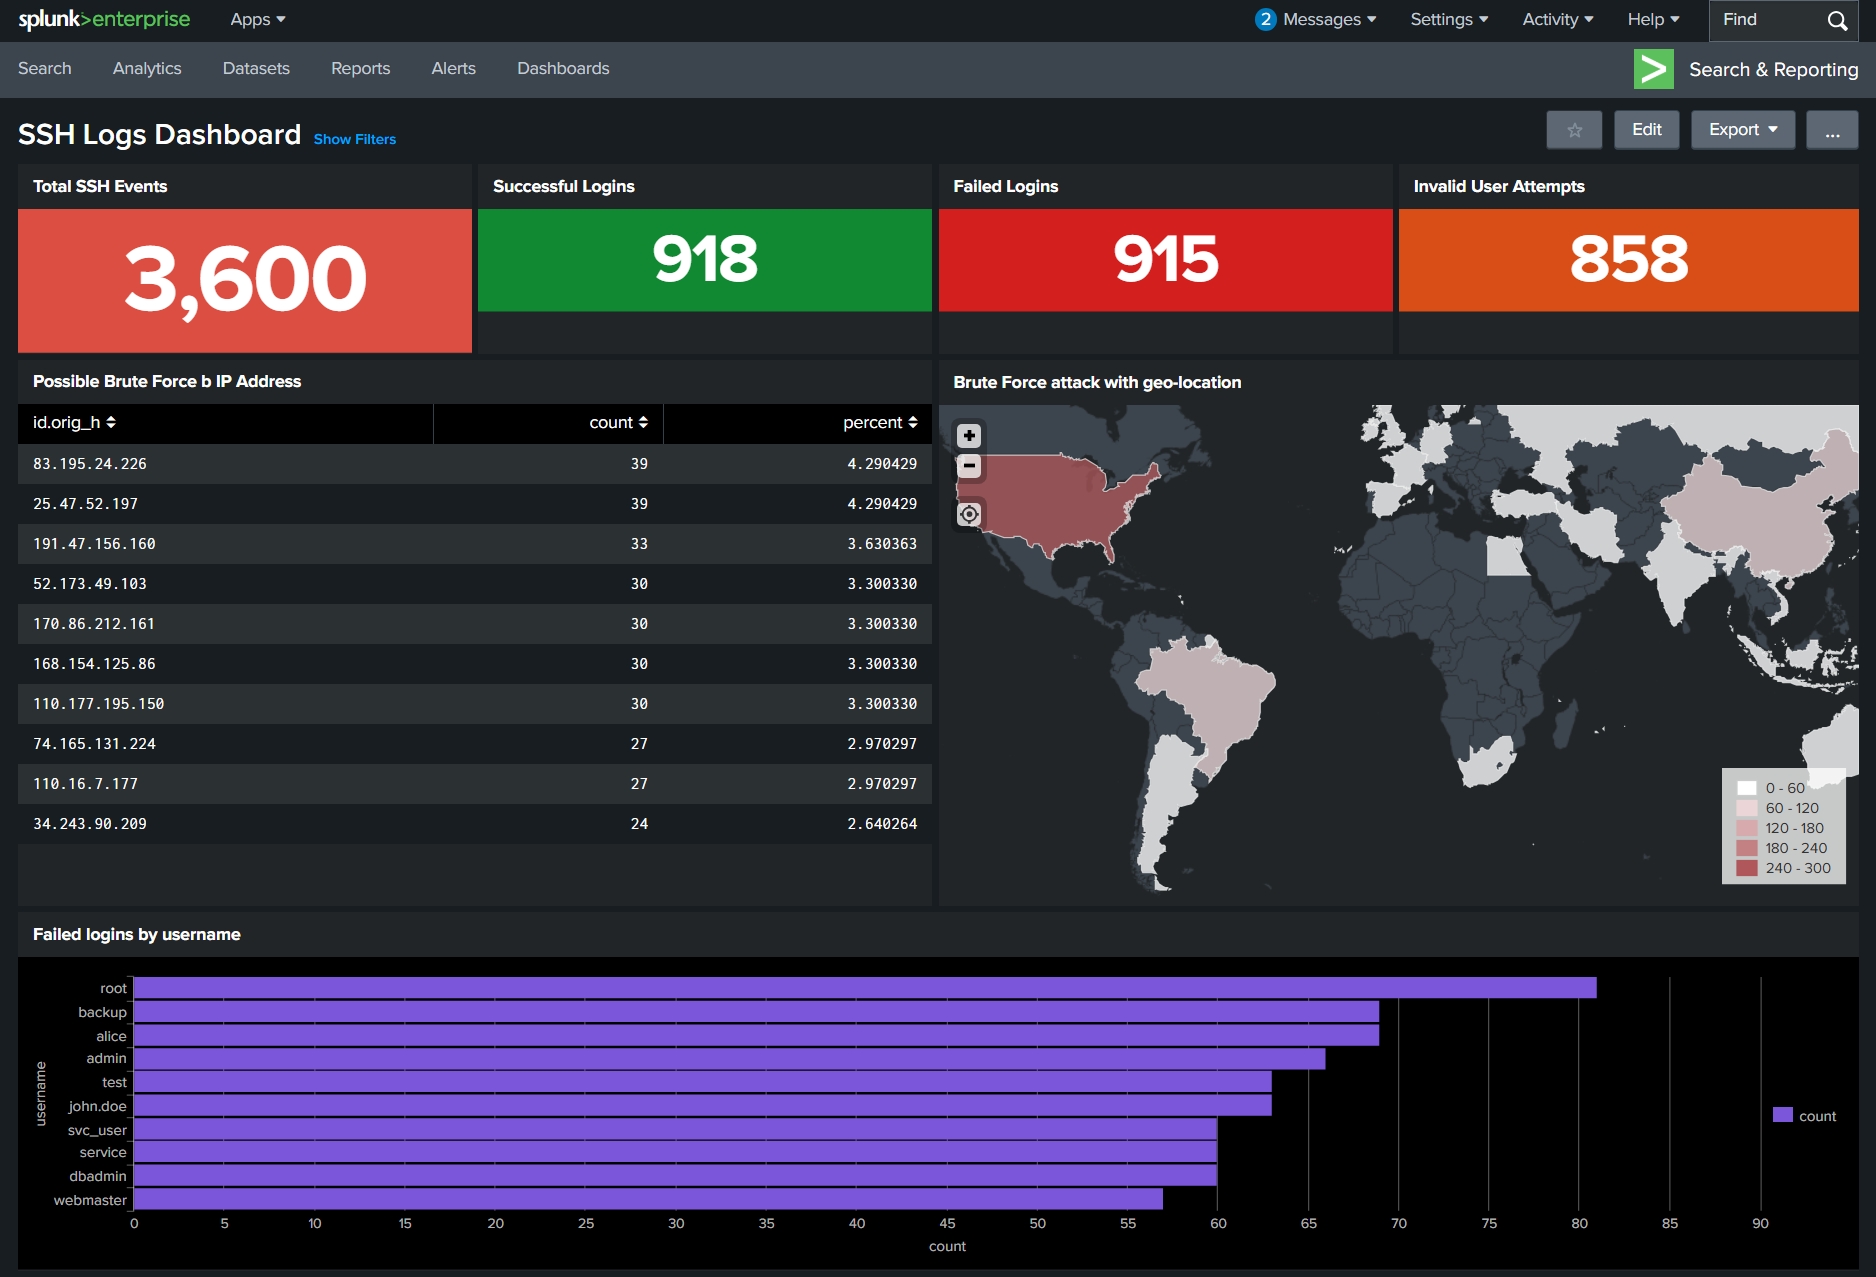
标签:Homebrew安装, SSH, 安全运营, 扫描框架, 红队行动, 运维监控