rinjanianalytics/cti-platform-api
GitHub: rinjanianalytics/cti-platform-api
一款整合 Telco-5G、AI 与区块链威胁数据的统一 CTI 后端平台,提供免费多源情报聚合、Agentic 分析与多租户联邦能力。
Stars: 3 | Forks: 1
# V3 Rinjani CTI — 后端
**现代化的独立威胁情报后端,具备直接的 feed 集成、内嵌的 BullMQ pipeline 监控以及多租户联邦层。**
由 [RinjaniAnalytics](https://rinjanianalytics.com) 开发 — 与 [cti-platform-dashboard](https://github.com/rinjanianalytics/cti-platform-dashboard) 配套使用。
[](https://www.typescriptlang.org/)
[](https://nodejs.org/)
[](https://hono.dev/)
[](https://orm.drizzle.team/)
[](https://bullmq.io/)
[](LICENSE)
## 🚀 功能
- **三域覆盖于一张图谱** — 核心差异点:**Telco-5G** (MITRE FiGHT)、**AI** (MITRE ATLAS + AI Incident Database) 和 **Blockchain** (OFAC 制裁 + ScamSniffer 欺诈 + DefiLlama 协议归因) 统一整合在单一威胁图谱和单一 Agentic 分析层中 — 而非三个孤立的工具。
- **直接 feed 同步,无中间商** — 18 个数据源,全部免费:CISA KEV · NVD · CVE.org cvelistV5 · MITRE ATT&CK · MISP Galaxy · AlienVault OTX · abuse.ch SSL/ThreatFox/URLhaus/MalwareBazaar · OpenPhish · EPSS · HIBP · **OFAC SDN 制裁加密货币** · **ScamSniffer 欺诈地址** · **DefiLlama 协议标签** · **AI Incident Database**
- **免费的多源链上归因** — 给定一个地址,扇出至我们的数据库 (OFAC/ScamSniffer/DefiLlama) + Blockscout + DefiLlama + 可选的 MistTrack,并按优先级合并,附带完整的出处信息 — **无需付费的 Arkham/Chainalysis 依赖**
- **Agentic 分析** — 基于有界 JSON-ReAct 的狩猎循环,运行于封闭、只读的工具平面(图谱 NL→Cypher、RAG、链上查询、SIEM),包含由 HITL 把关的建议写入操作
- **多语言存储** — Postgres (Drizzle ORM) 作为规范存储,OpenSearch 用于全文 + 向量搜索,Neo4j 用于威胁关系图谱,Redis 用于队列 + 缓存
- **Pipeline 编排** — BullMQ workers 配合 `FlowProducer` 父/子图,定时任务,通过 Postgres `NOTIFY` 进行工作驱动的补全
- **内嵌的 Workbench BullMQ 仪表板** — vendored 分支位于 `/admin/workbench`,具有自定义的定时任务编辑/立即运行/禁用操作,并委托给我们的控制平面 (参见 [packages/workbench-core/](packages/workbench-core/))
- **TAXII 2.1 服务器**,用于下游的 STIX 消费者,以及 REST v1、REST v2、GraphQL (Pothos) 和 WebSocket 订阅
- **多租户联邦** — 租户 schema、对等连接、信任级别评分
- **端到端类型安全** — 完整的 TypeScript、Drizzle 推断 schema、边缘处的 zod 验证
- **生产就绪** — Docker、Kubernetes Helm chart、OpenTelemetry 监测、用于安全 HA 的跨进程 bootlock
## 📸 截图
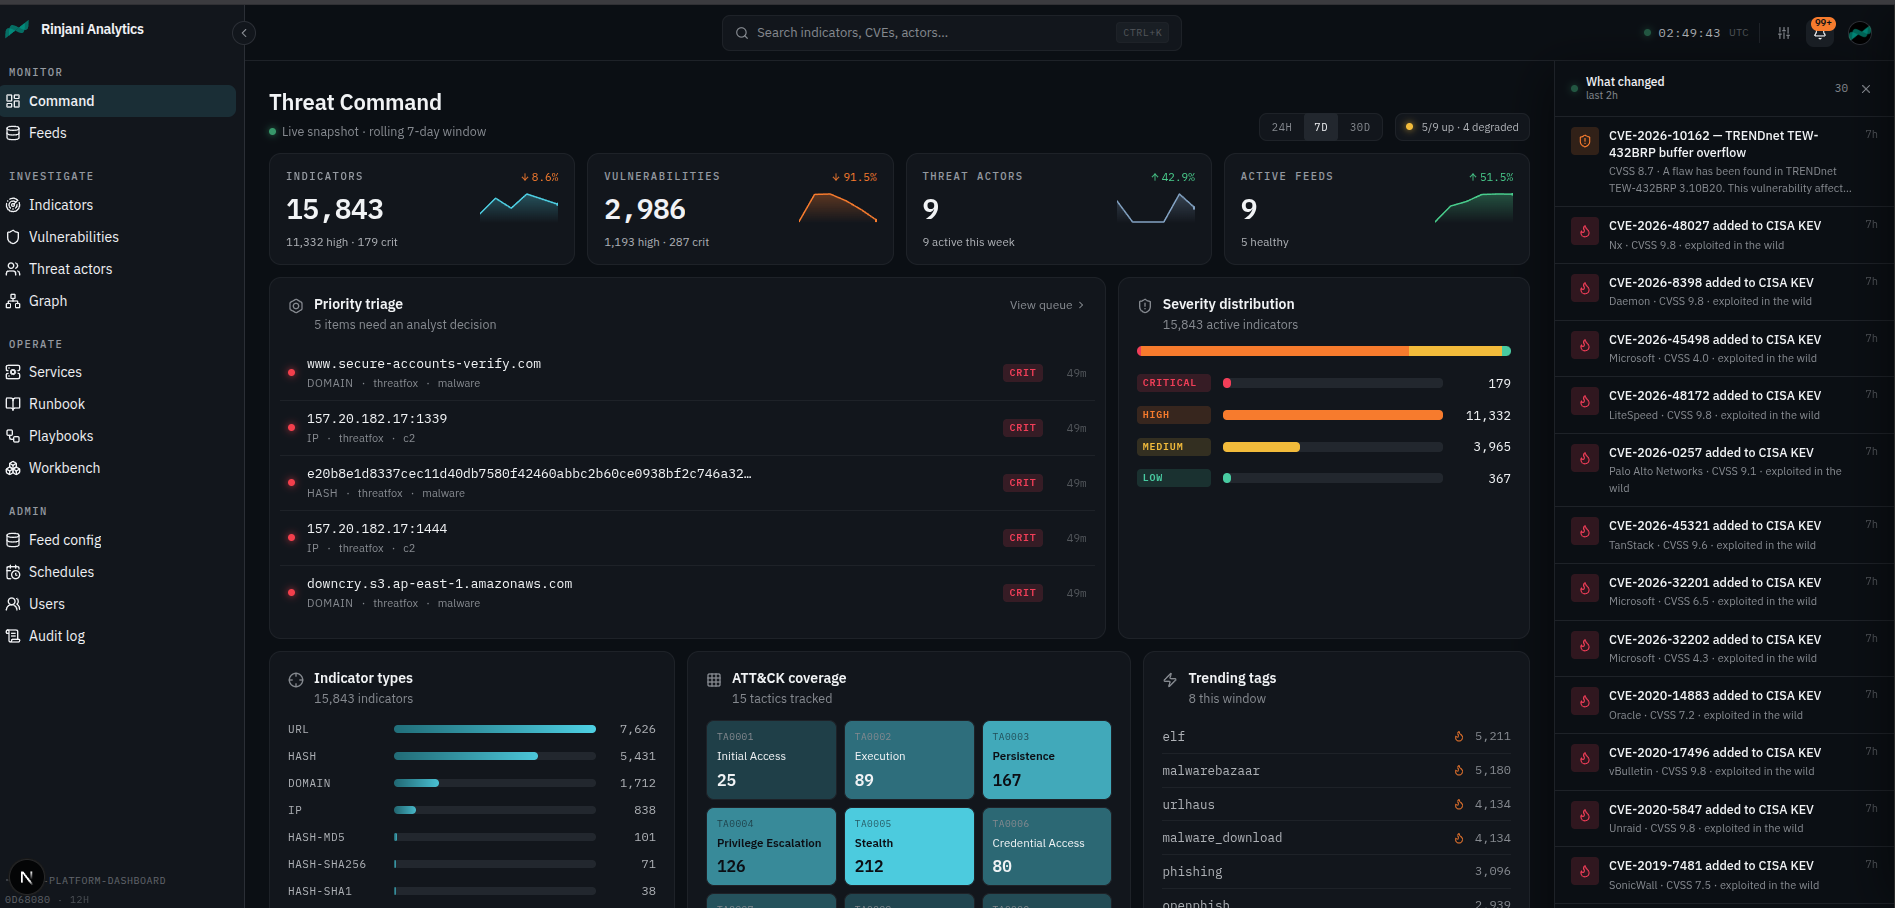
### 威胁指挥 — 分析师仪表板
`/` 是分析师的一目了然的入口。KPI 磁贴(指标、漏洞、威胁行为者、活跃 feed)配有滚动窗口的迷你图和增量百分比,其上方是一个**战略垂直领域行** — 实时的 AI 事件、Telco-5G 和链上归因计数,平台的差异化优势优先展现。下方是:框架覆盖 (FiGHT · ATLAS · ATT&CK)、最新的 AI 事件 + 链上钱包、优先级分流 / 严重性 / TTP 变更日志、指标类型 / 趋势标签 / 数据泄露,以及行为者观察列表 + 情报动态 — 此外右侧栏还有语义事件流。24小时 / 7天 / 30天切换器可限定每个窗口磁贴的范围。
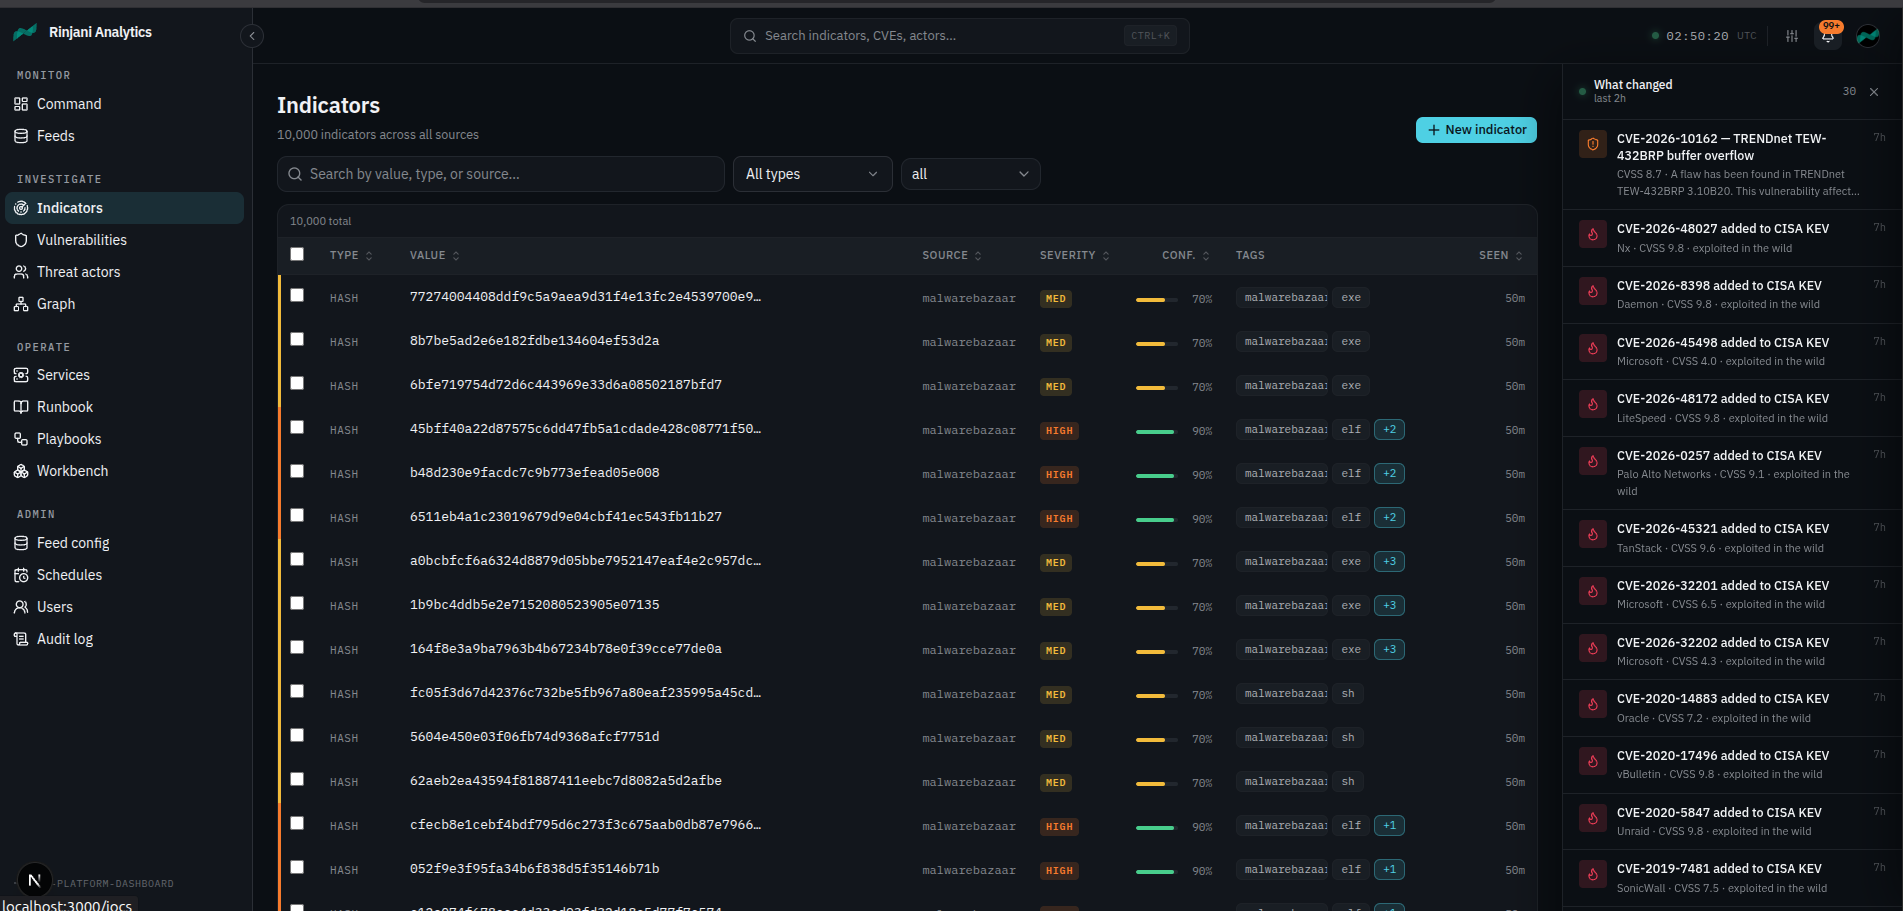
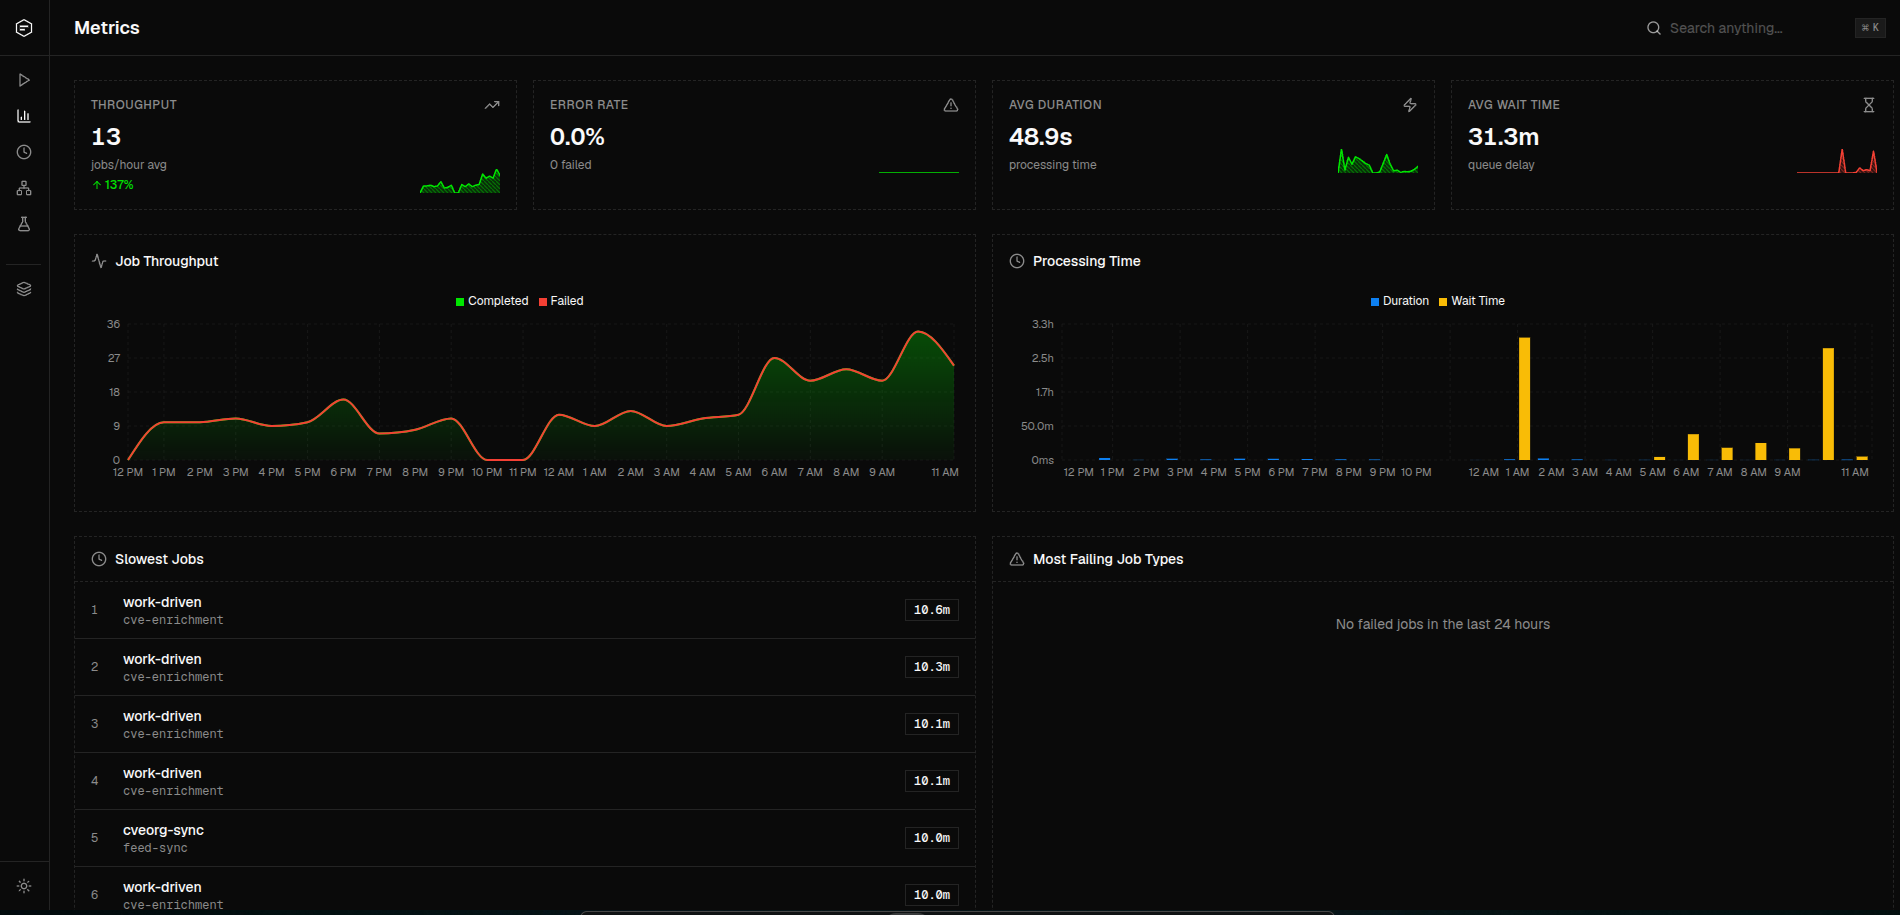
### 指标 — 分页 IOC 浏览器
`/iocs` — IP / 域名 / 哈希 / URL,具有类型过滤、严重性过滤、输入时搜索、来源/严重性/置信度/标签列、带有严重性色调的左边缘,以及包含在图谱中透视、复制和观察操作的点击穿透实体抽屉。
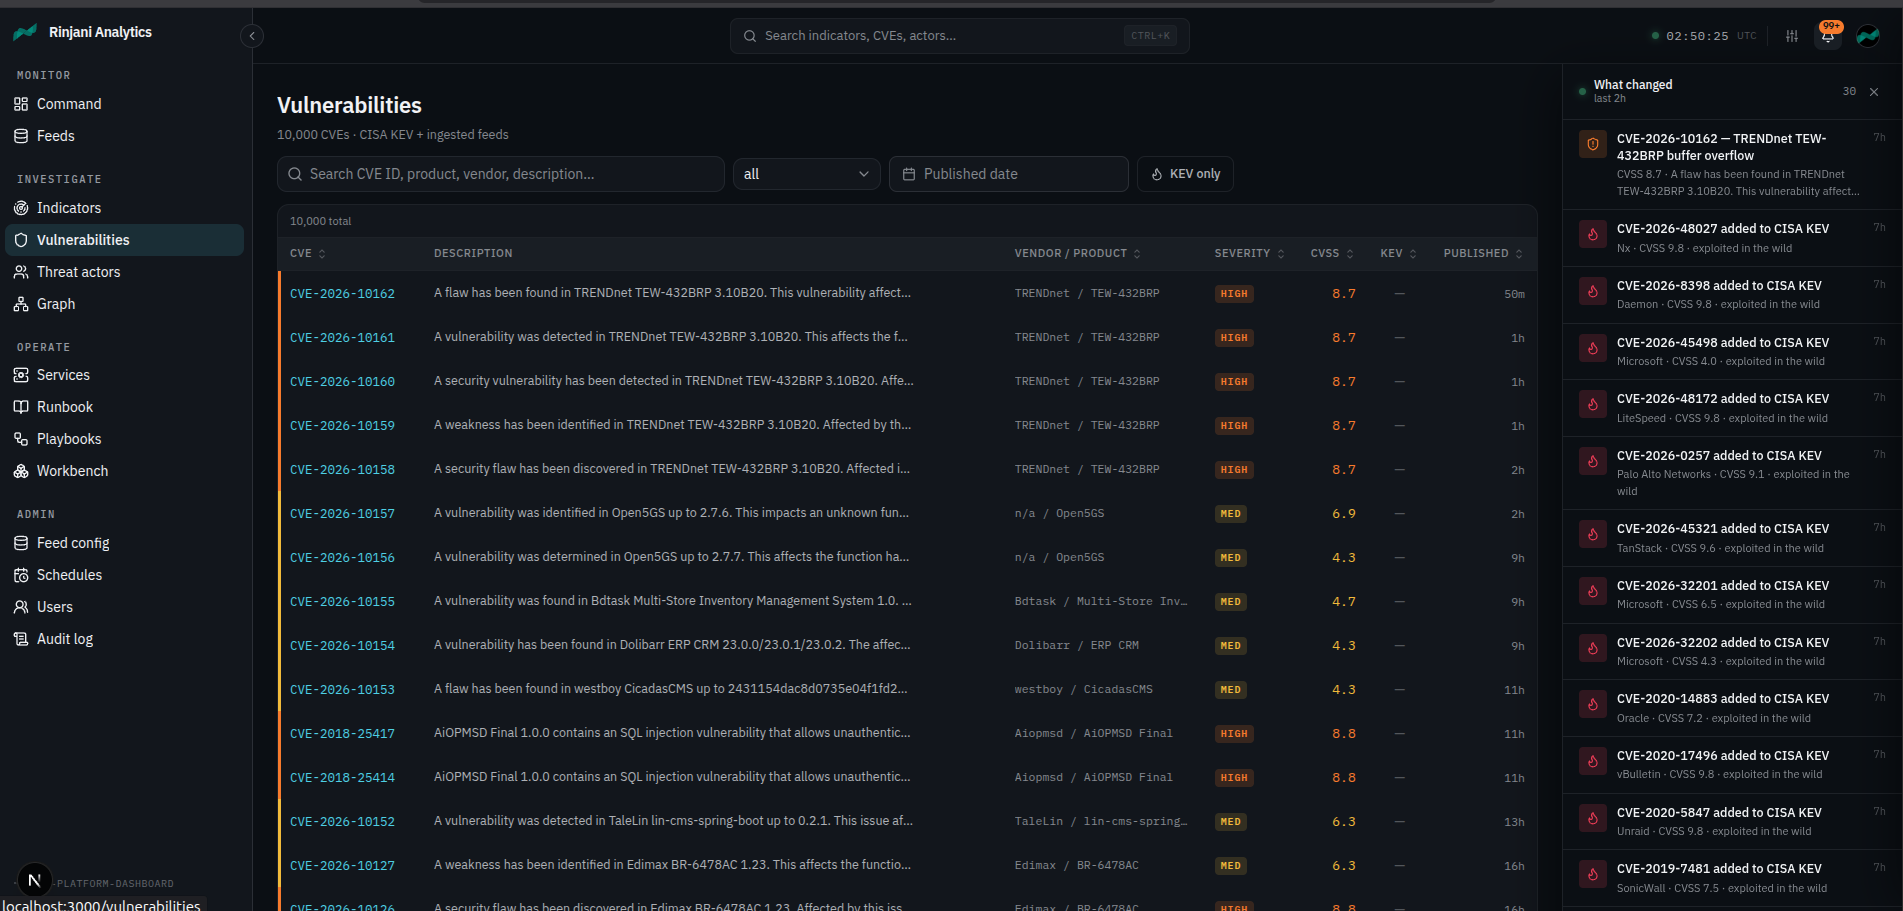
### 漏洞 — CVE / KEV 目录
`/vulnerabilities` — 供应商/产品、CVSS、仅限 KEV 切换、发布日期范围过滤器、带有严重性色调的左边缘。每行深层链接至 CVE 抽屉,包含 KEV 标签、漏洞利用标志、属性(CVSS、供应商、产品、发布、更新),以及通过向量相似性呈现的相关实体。
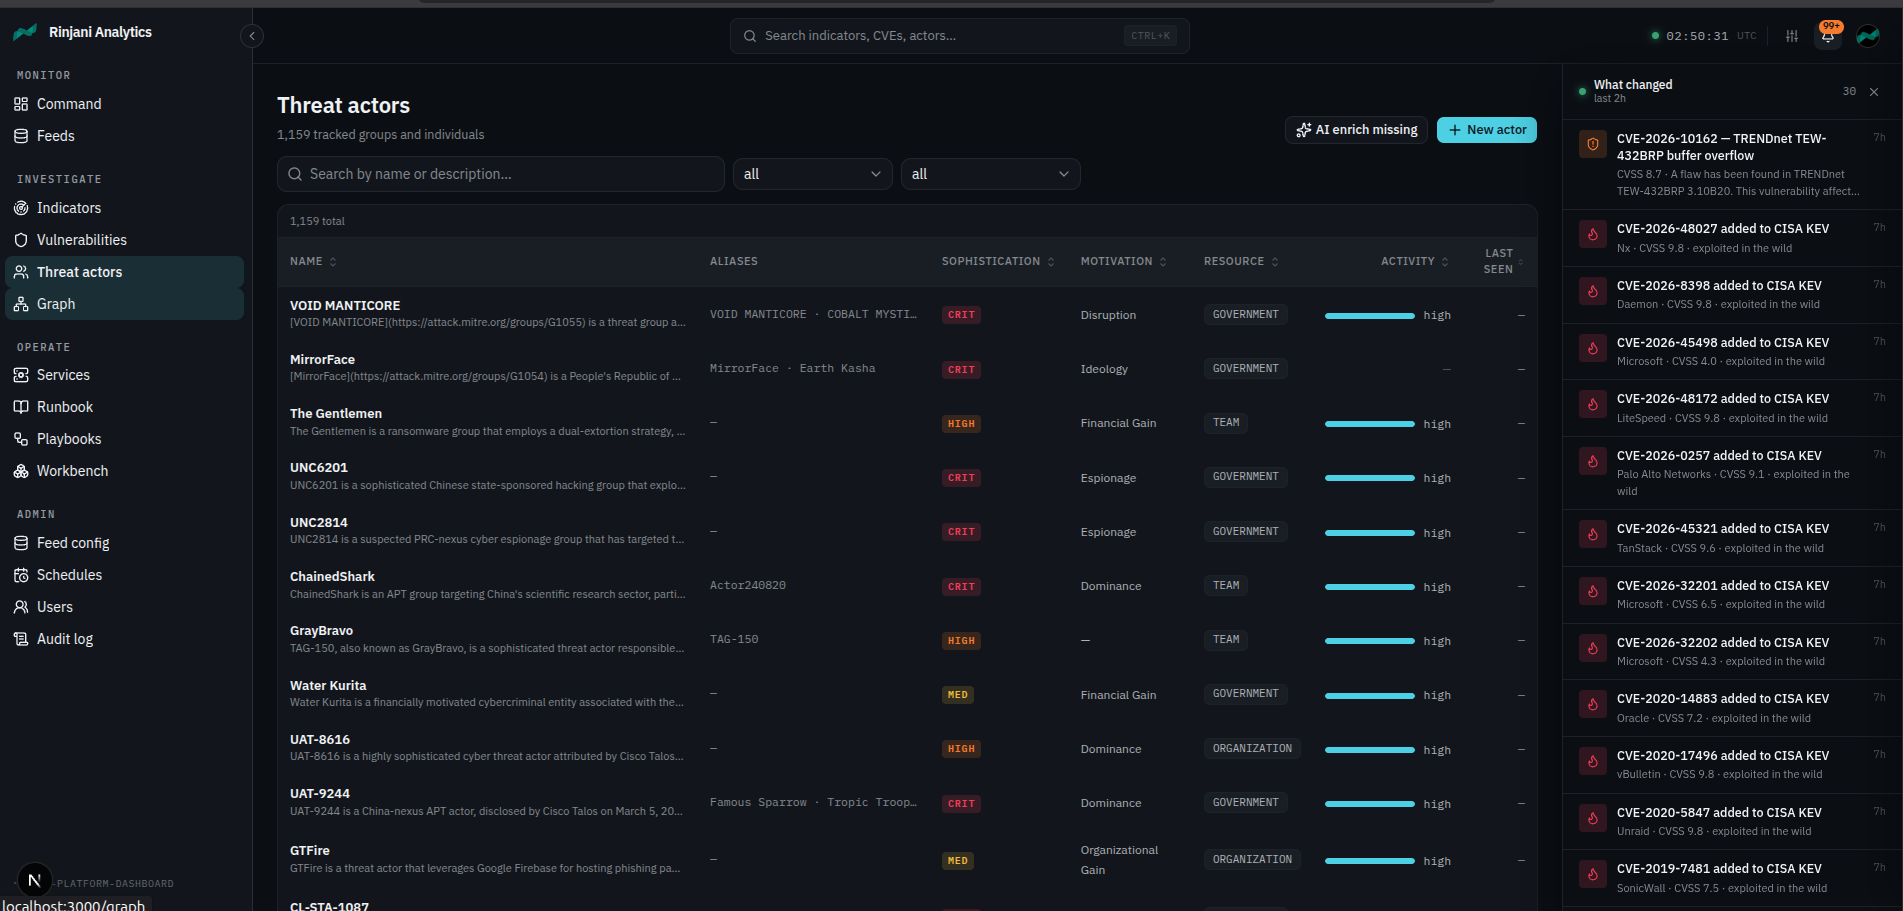
### 威胁行为者 — 复合活跃度评分的观察列表
`/actors` — APT 组织及其别名、复杂度、动机、资源水平,以及一个由综合分数(OTX 脉冲提及次数 × TTP 关系近期性 × 复杂度 × 近期性加成 — 而不仅仅是 `last_seen DESC`)驱动的**活跃度**条。“AI enrich missing” 将针对分析师标记的空白字段调用 Gemini。
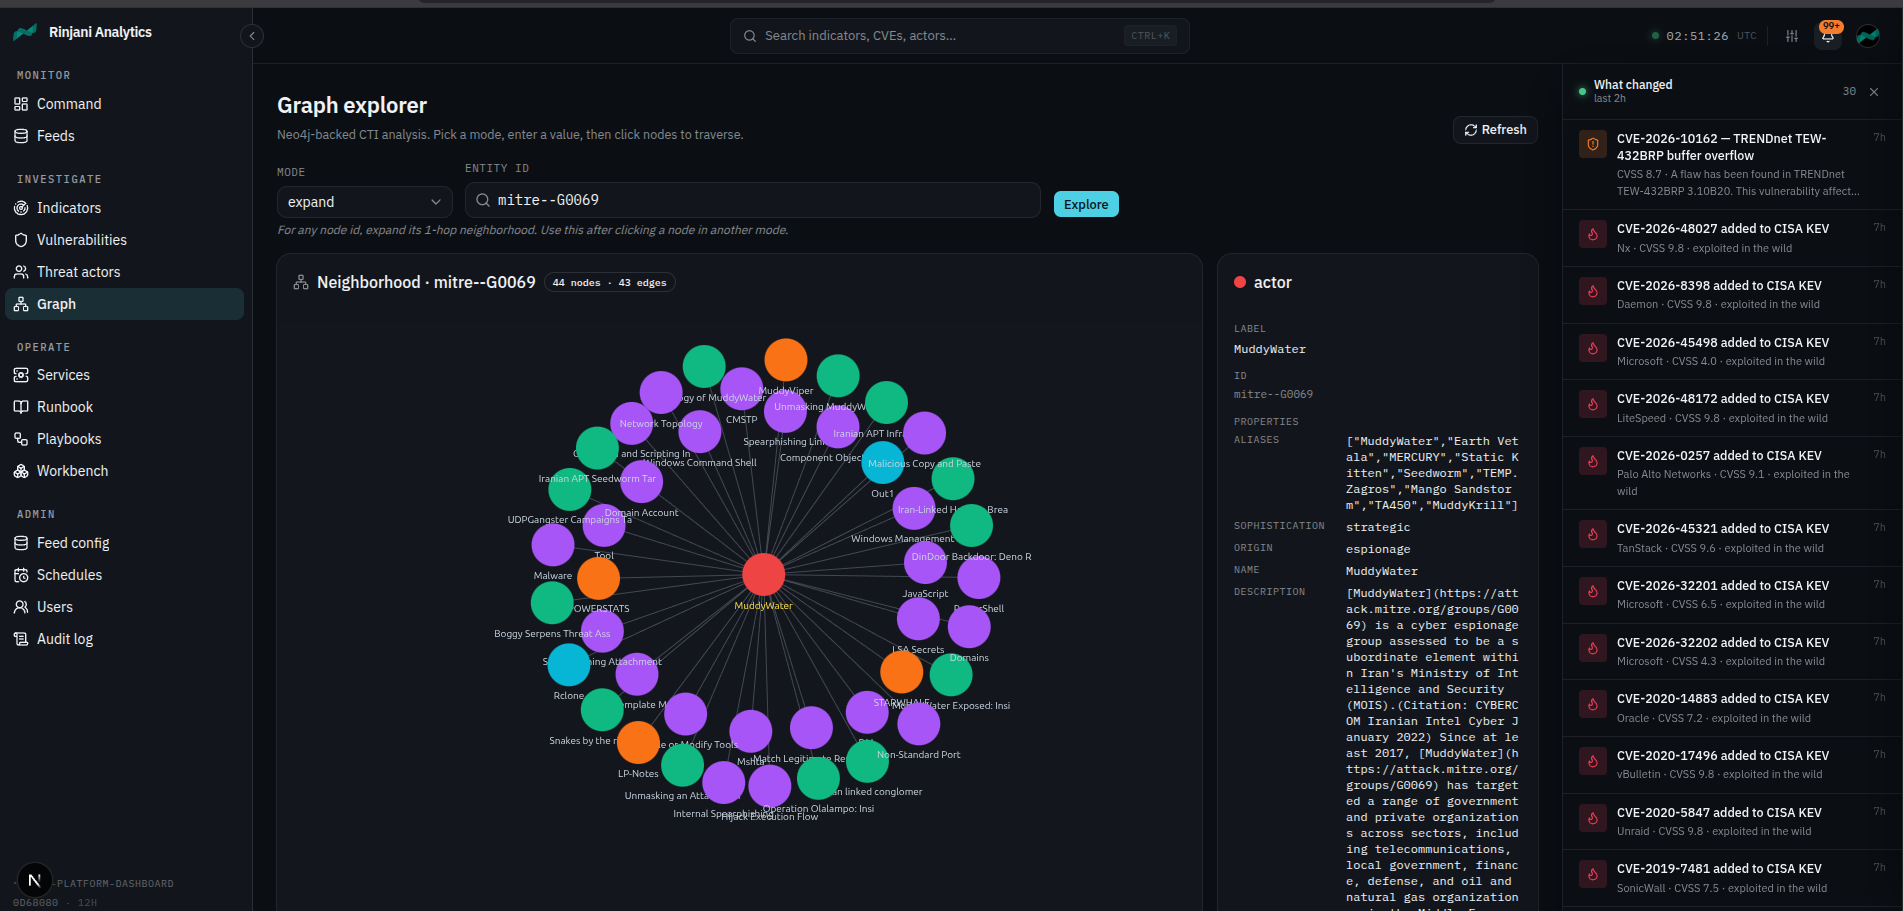
### 图谱浏览器 — 基于 Neo4j 的邻域视图
`/graph` — 输入一个种子(IOC 值、行为者名称、技术 ID)并通过 Cypher 扩展邻域。力导向视图:行为者 ↔ 技术 ↔ 恶意软件 ↔ IOC ↔ 漏洞。右侧栏显示所选节点的 STIX 属性 + 原始 payload。
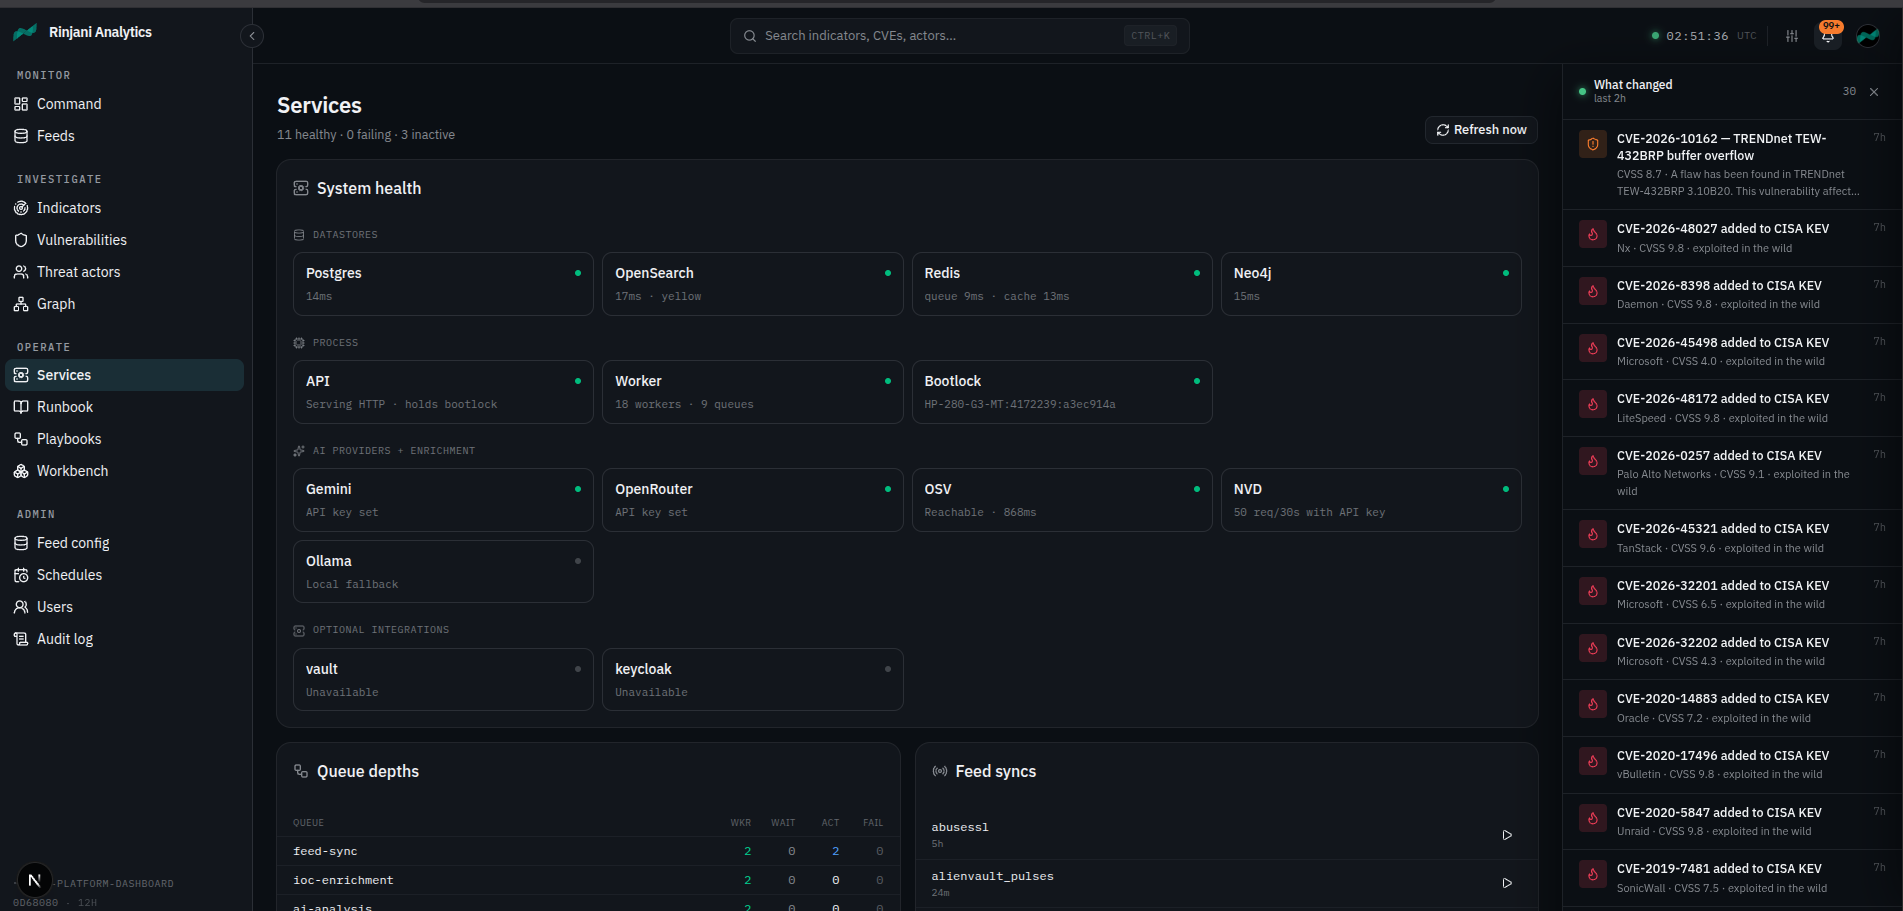
### 服务 — 单窗格运维健康状况
`/admin/services` 将每个探测整合到一个单次往返中:数据存储连通性(Postgres / OpenSearch / Neo4j / Redis × 2)、API 和 worker 存活状态、bootlock 状态(`held` / `unowned` / `error`)、feed 同步队列深度,以及最近的摄入/同步运行。同一画布还展示了 LLM 提供商配置和 OSV/NVD 补全源的健康状况。
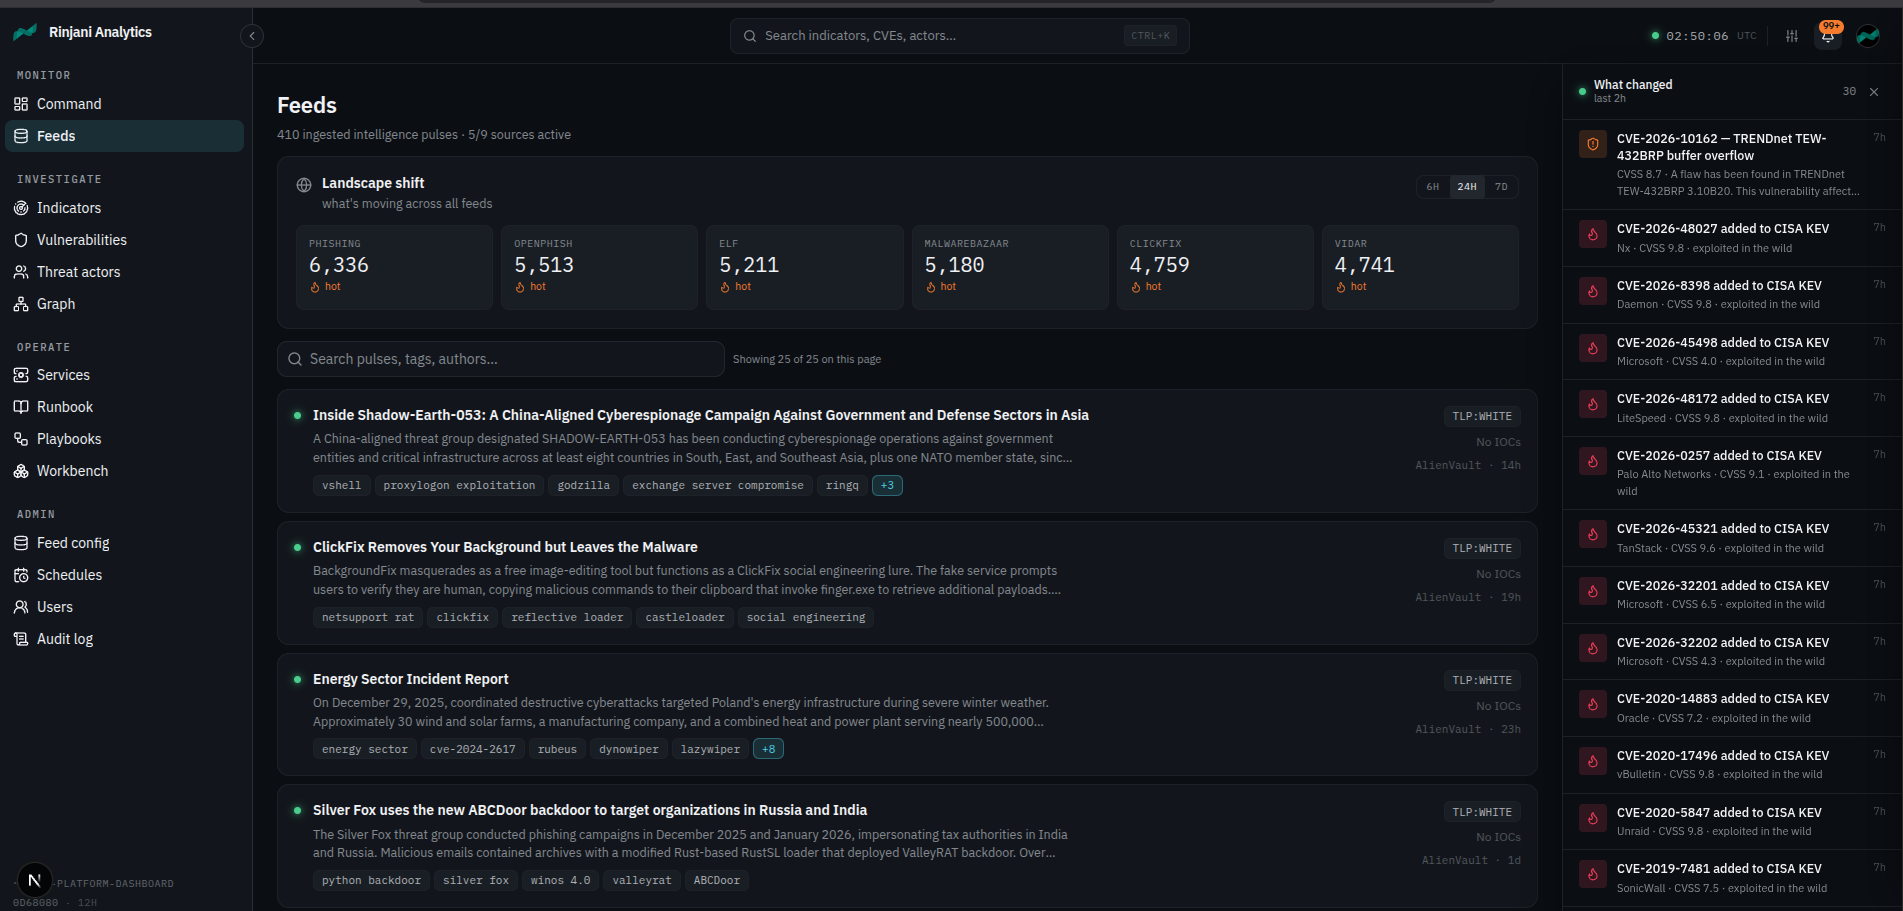
### Feeds — 摄入情报的态势轮播
`/feeds` — 面向分析师的视角:一个**战略垂直领域带**(AI 事件 · 链上钱包 · 电信欺诈方案),一个**态势变化**热门标签带,一个**按垂直领域查看最新**的选项卡视图,以及实时的脉冲流 — 标题、描述、标签、摄入时间戳 — 让你无需先打开单个 IOC 就能扫描新内容。
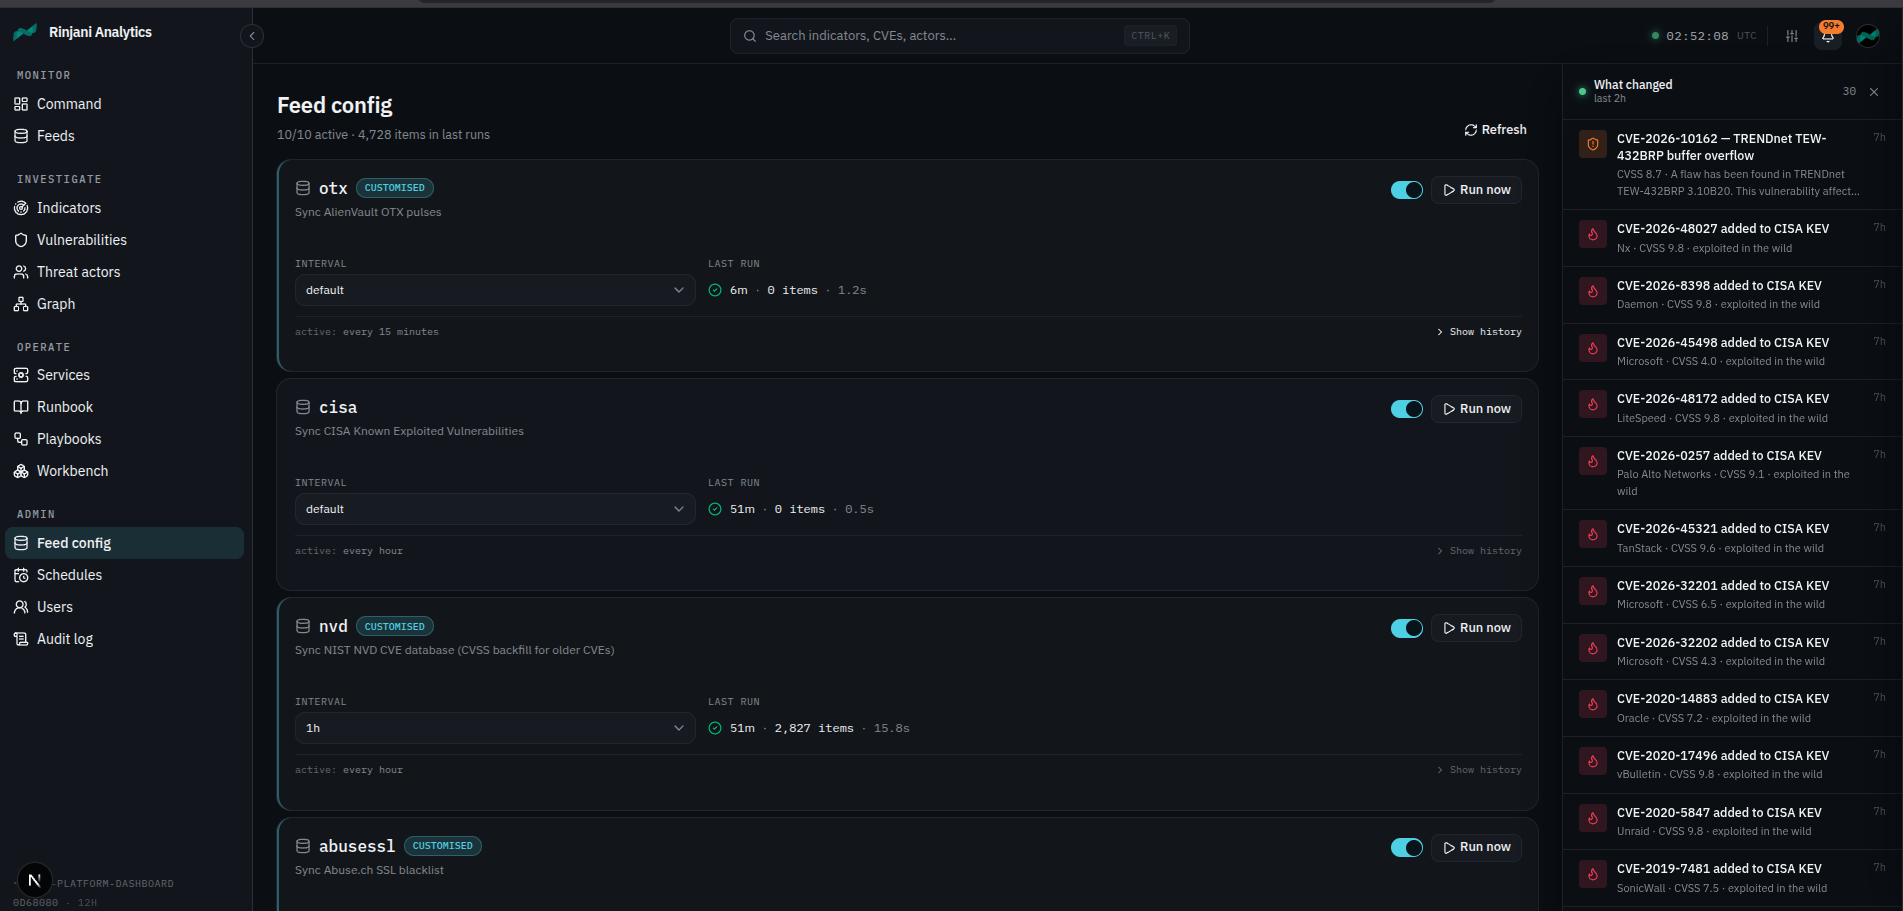
### Feed 配置 — 按源管理
`/admin/feeds` — 切换每个上游同步的开/关状态,设置轮询间隔,查看上次同步的成功/失败状态,并通过**立即运行**触发即时同步,无需等待计划。最终会通过 Workbench 使用的相同 `reconcileScheduledJob` 控制平面进行写入。
### 内嵌的 Workbench — BullMQ pipeline 检查
`/admin/workbench` 是 [Workbench](https://github.com/pontusab/workbench) 的 vendored 分支 (参见 [packages/workbench-core/](packages/workbench-core/))。概览、队列、任务、**流**(来自每个 feed 同步批次的 FlowProducer 父/子图),以及**定时任务调度器**,具有我们自定义的编辑/禁用/立即运行操作,委托给原生的 `/admin/schedules` 仪表板页面所使用的相同 `reconcileScheduledJob` 控制平面。
## 📊 数据源
| 来源 | 记录 | 更新频率 |
|--------|---------|------------------|
| **CISA KEV** | 1,501 个漏洞 | 每 6 小时 |
| **AlienVault OTX** | 50,000+ 个 IOC | 每 4 小时 |
| **MITRE ATT&CK** | 835 项技术,91 个工具 | 每日 |
| **威胁行为者** | 187 个 APT 组织 | 每日 |
| **恶意软件** | 696 个家族 | 每日 |
## 🏗️ 架构
```
┌───────────────────────────┐
│ Dashboard (3000) │
│ Next.js + shadcn/ui │
└──────────────┬────────────┘
│ (same-origin proxy)
┌─────────────────────┼─────────────────────┐
▼ ▼ ▼
┌─────────────────┐ ┌─────────────────┐ ┌─────────────────┐
│ Gateway (4000) │ │ API (3001) │ │ /admin/workbench│
│ GraphQL Mesh │ │ Hono + REST │ │ BullMQ ops UI │
│ Stitched APIs │ │ GraphQL + WS │ │ (vendored fork)│
└─────────────────┘ └────────┬────────┘ └─────────────────┘
│
BullMQ workers + scheduler
+ feed-sync daemon + work
listener — in-process (one
Node runtime, bootlock-gated)
│
┌───────────────────────────────────┼───────────────────────────────────┐
▼ ▼ ▼ ▼ ▼
┌──────┐ ┌──────────────┐ ┌────────────────┐ ┌──────────────┐ ┌────────┐
│ PG │ │ OpenSearch │ │ Neo4j │ │ Redis │ │ TAXII │
│ canon│ │ FTS+vector │ │ relationship │ │ queue + cache│ │ 2.1 │
└──────┘ └──────────────┘ └────────────────┘ └──────────────┘ └────────┘
▲
│
┌──────────┴───────────┐
│ Direct Threat Feeds │
│ CISA · NVD · CVE.org│
│ MITRE · OTX · MISP │
│ abuse.ch × 4 · etc. │
└──────────────────────┘
```
Workers 过去作为单独的 `apps/worker` 进程运行;现在它们被折叠进 API 进程中(单一的 `pnpm dev` 运行时),并带有 Redis 咨询 bootlock,以防止并发的 api+gateway 进程重复调度。`apps/worker` 作为构建目标保留,用于 `dev:standalone` 守护进程 + 一次性的 `sync:*` CLI。
## 🚦 快速开始
### 前置条件
- Node.js 20+ 或 Bun 1.0+
- PostgreSQL 16+
- Redis 7+
- Docker & Docker Compose(可选)
### 安装
```
# Clone repository
git clone https://github.com/rinjanianalytics/cti-platform-api.git
cd cti-platform-api
# Install dependencies
pnpm install
# Configure environment
cp .env.example .env
# Edit .env with your credentials (DATABASE_URL, JWT_SECRET, OAuth keys, ...)
# Start the data plane in Docker (no app containers — those run on the host
# via `pnpm dev`). This brings up 6 services: postgres, pgbouncer, redis-cache,
# redis-queue, opensearch, neo4j. See "Docker compose profiles" below for the
# opt-in extras (apps, telemetry, platform, gateway, dashboard).
docker compose up -d
# Push database schema
pnpm --filter @rinjani/db push
# Start development servers (API on :3001, gateway on :4000, workers in-process)
pnpm dev
```
**服务:**
- API: http://localhost:3001
- GraphQL: http://localhost:3001/graphql
- 健康检查: http://localhost:3001/health
## 📁 项目结构
```
cti-platform-api/
├── apps/
│ ├── api/ # Hono REST + GraphQL + WS + workers (port 3001)
│ │ └── src/
│ │ ├── routes/ # REST endpoints (v1, v2, /admin/*, /auth/*, /taxii/*)
│ │ ├── graphql/ # Pothos schema + resolvers
│ │ ├── middleware/ # Auth (JWT + cookie), CORS, rate limiting
│ │ ├── websocket/ # Real-time subscriptions
│ │ ├── queues/ # BullMQ workers + scheduler + FlowProducer wiring
│ │ └── services/ # Feed sync, enrichment, federation, neo4j, OTel
│ ├── gateway/ # GraphQL Mesh stitched-API gateway (port 4000)
│ ├── worker/ # CLI helpers + emergency standalone daemon
│ └── dashboard-static/ # Tiny static landing page (real UI lives in v304-dashboard)
├── packages/
│ ├── core/ # Shared services & types
│ ├── db/ # Drizzle ORM schemas + migrations
│ └── workbench-core/ # Vendored fork of @getworkbench/core
│ # (BullMQ ops UI mounted at /admin/workbench)
├── helm/v3-threat-intel/ # Kubernetes Helm chart
├── docker-compose.yml # Dev data plane (PG + pgbouncer + Redis ×2 + OpenSearch + Neo4j);
│ # apps/observability/SSO opt-in via --profile (see below)
└── .env.example # Environment template
```
## 🔌 API 端点
### REST API (v1)
| 端点 | 描述 |
|----------|-------------|
| `GET /v1/vulnerabilities` | 带有过滤器的 CVE/KEV 数据 |
| `GET /v1/iocs` | IOC(IP、域名、哈希、URL)|
| `GET /v1/tactics` | MITRE ATT&CK 战术 |
| `GET /v1/techniques` | MITRE 技术 |
| `GET /v1/threat-actors` | APT 组织 |
| `GET /v1/malware` | 恶意软件家族 |
| `GET /v1/tools` | 对抗工具 |
| `GET /v1/stats` | 仪表板统计信息 |
### 认证
```
# Login with API key
curl -X POST http://localhost:3001/auth/login \
-H "Content-Type: application/json" \
-d '{"apiKey": "your-api-key"}'
# Use JWT token
curl http://localhost:3001/v1/vulnerabilities \
-H "Authorization: Bearer YOUR_JWT_TOKEN"
```
### GraphQL
```
query {
vulnerabilities(limit: 10, severity: CRITICAL) {
cveId
description
severity
dateAdded
}
}
```
## 🔄 Feed 同步
### 手动同步
```
# Sync all feeds
pnpm --filter @rinjani/worker sync:feeds
# Sync specific feed
pnpm --filter @rinjani/worker sync:cisa
pnpm --filter @rinjani/worker sync:alienvault
```
### 守护进程模式
```
# Workers + scheduler + feed-sync daemon now run inside the API process.
# `pnpm dev` at the repo root starts everything as a single Node runtime.
pnpm dev
# Legacy standalone feed-only daemon (kept for emergency use, no BullMQ):
pnpm --filter @rinjani/worker dev:standalone
```
## 🐳 Docker Compose 配置
默认的 `docker compose up -d` 仅启动应用与之通信的 **6 服务数据平面**:
postgres、pgbouncer、redis-cache、redis-queue、opensearch、neo4j。
其他所有内容都由一个可选的 profile 控制,因此一个偶尔的 `up -d` 不
会从宿主机的 `pnpm dev` 窃取 `:3001`(或与正在运行的 prometheus 竞争
`:9090` 等)。
| Profile | 额外启动 | 适用场景 |
|---|---|---|
| _(默认)_ | postgres, pgbouncer, redis-cache, redis-queue, opensearch, neo4j | 在宿主机上进行正常的 `pnpm dev` 循环 |
| `apps` | `v3-api`, `v3-worker` | 将 API 和 worker 作为容器运行 _以替代_ `pnpm dev` |
| `dashboard` | `v3-dashboard` (Next.js) | 在 docker 中运行仪表板,而不是在 v304 仓库中运行 `pnpm dev` |
| `platform` | `v3-keycloak`, `v3-vault` | 测试 SSO / 基于 vault 的密钥;两者都有环境变量回退机制 |
| `gateway` | `v3-traefik` | 位于 API 前端的生产级路由 |
| `telemetry` | prometheus, grafana, loki, tempo, promtail + redis/postgres/opensearch exporters | 可观测性仪表板 |
```
# Just the data plane (the common case)
docker compose up -d
# Run API + worker in containers instead of `pnpm dev`
docker compose --profile apps up -d
# Spin up the observability stack
docker compose --profile telemetry up -d
```
### Telemetry profile — prometheus 认证
`/v1/ops/metrics/prometheus` 与 `/v1/*` 的其余部分一样,使用 API 密钥进行认证。
在启动 telemetry profile 之前,生成一个专用的抓取密钥,将其添加到
`API_KEYS`,并在 `.env` 中将其镜像到 `PROMETHEUSRAPE_API_KEY` —
prometheus 容器在启动时会将该值 `sed`-替换到
`config/prometheus/prometheus.template.yml` 中,这样密钥就永远不会以
明文形式存在于仓库中。如果缺少环境变量,compose 服务会快速失败
(`${VAR:?...}`)。
```
KEY="prom-scrape-$(openssl rand -hex 16)"
echo "PROMETHEUS_SCRAPE_API_KEY=$KEY" >> .env
# also append "$KEY:viewer" to API_KEYS in .env
docker compose --profile telemetry up -d v3-prometheus
```
### 日常 docker 命令
```
docker compose ps # what's running
docker compose logs -f v3-postgres # tail a service
docker compose down # stop the data plane
docker compose down -v # also wipe volumes (destructive)
```
## ☸️ Kubernetes 部署
```
# Install with Helm
helm install v3-ti ./helm/v3-threat-intel
# Scale API pods
kubectl scale deployment v3-ti-api --replicas=5
# View logs
kubectl logs -f deployment/v3-ti-api
```
有关详细的部署说明,请参见 [DEPLOY.md](DEPLOY.md)。
## 🧪 测试
```
# Run all tests
pnpm test
# Run specific package tests
pnpm --filter @rinjani/api test
pnpm --filter @rinjani/worker test
```
## 📊 监控
### 健康检查
```
curl http://localhost:3001/health
```
### Workbench — 内嵌的 pipeline 仪表板
挂载在 **`/admin/workbench`** (通过仪表板的 Next.js rewrite 进行同源代理,
因此已登录的管理员会话会自动对其进行身份验证 —
无需二次登录)。
[`@getworkbench/core`](https://github.com/pontusab/workbench) 的
Vendored 分支,位于 [`packages/workbench-core/`](packages/workbench-core/)
下 — 我们增加了定时任务调度器编辑/禁用/立即运行操作,这些操作委托给我们
自己的 `reconcileScheduledJob` 控制平面(原生的 BullMQ 写入操作会被
我们启动时的协调循环所覆盖)。
你将看到:
- **概览 / 队列 / 任务** — `feed-sync`、`ioc-enrichment`、`feed-batch`、`cve-enrichment`、`alerts`、
`notifications`、`neo4j-sync`、`ai-analysis`、`maintenance` 队列的深度、吞吐量、失败情况
- **流** — `FlowProducer` 父/子图(每次 feed 同步都会在 `feed-batch` 中构建一个
父 `batch-` 以及 N 个补全子任务 — 参见
[`apps/api/src/queues/workers/feedSyncWorker.ts`](apps/api/src/queues/workers/feedSyncWorker.ts))
- **定时任务调度器** — 来自 [`apps/api/src/queues/scheduler.ts`](apps/api/src/queues/scheduler.ts)
的 13 个 cron 条目,带有我们的 kebab 菜单操作(编辑间隔 / 立即运行 / 禁用)。仪表板中的原生
[`/admin/schedules`](https://github.com/rinjanianalytics/cti-platform-dashboard/blob/main/src/app/(app)/admin/schedules/page.tsx)
页面共享相同的后端,因此两个 UI 之间的编辑能保持一致
### 服务健康探测
`GET /admin/services` 返回一个包含 Postgres /
OpenSearch / Neo4j / Redis (队列+缓存) 连通性、BullMQ 队列深度、
worker 存活状态、bootlock 状态、feed 同步状态、LLM 提供商
配置和补全源健康状况的单一 JSON 信封。仪表板的
`/admin/services` 页面将所有这些内容渲染在一个窗格中。
### OpenTelemetry
```
# Enable telemetry from the API process
export OTEL_ENABLED=true
export OTEL_ENDPOINT=http://localhost:4318
# Start the local observability stack (prometheus, grafana, loki, tempo +
# the redis/postgres/opensearch exporters). Requires PROMETHEUS_SCRAPE_API_KEY
# in .env — see "Telemetry profile — prometheus auth" above.
docker compose --profile telemetry up -d
# Grafana — login admin/rinjani1 (override via GRAFANA_PASSWORD)
open http://localhost:3002
# Tempo traces query API
open http://localhost:3200
```
## 🛠️ 开发
### 命令
| 命令 | 描述 |
|---------|-------------|
| `pnpm dev` | 启动开发服务器 |
| `pnpm build` | 构建所有包 |
| `pnpm test` | 运行测试 |
| `pnpm lint` | 代码检查 |
| `pnpm db:push` | 将 schema 推送到数据库 |
| `pnpm db:studio` | 打开 Drizzle Studio |
### 添加自定义 Feed
1. 在 `apps/worker/plugins/my-feed/` 中创建插件
2. 实现 `FeedPlugin` 接口
3. 添加 manifest.json
4. 插件在启动时自动发现
请参见 `apps/worker/plugins/example-rss-feed/` 作为参考。
## 📚 文档
- [部署指南](DEPLOY.md)
- [架构](docs/ARCHITECTURE.md)
- [Feed 连接器引擎](docs/feed-engine.md) — 声明式清单、`feeds_config`/`feed_manifest` 分离、LLM 草稿映射器
- [路线图](ROADMAP.md)
- [API 文档](http://localhost:3001/docs) (运行时)
- [GraphQL Playground](http://localhost:3001/graphql)
## 🗺️ 路线图
现代 CTI 是一个不断变化的目标 — 补全深度、STIX 2.1 保真度、
检测即代码、LLM 辅助的分析师工作流。[ROADMAP.md](ROADMAP.md)
将未来约 18 个月分为六个阶段,根据单人维护者的单工程小时信号量进行优先级排序:
1. **补全与检测即代码** *(2026-06 → 2026-07)* — urlscan, GreyNoise, AbuseIPDB, Shodan, VirusTotal, PhishTank/OpenPhish; EPSS + CVSS v4; Sigma + YARA 规则库
2. **STIX 2.1 一等公民与联邦** *(2026-08 → 2026-09)* — 完整的实体 CRUD、Neo4j 中的类型化关系、bundle 导入/导出、TAXII 2.1 *推送*
3. **LLM 分析师功能** *(2026-10 → 2026-11)* — 报告转 STIX 提取、自动摘要、向量嵌入相似度 (OpenSearch 向量)、NL→Cypher、假设跟踪
4. **出站集成** *(2026-12 → 2027-02)* — Slack/Teams/PagerDuty 通知路由、SIEM 导出器 (Splunk/Elastic/Sentinel)、基于 BullMQ 流的 SOAR 风格剧本、blocklist 导出、沙箱触发器、JIRA/GitHub 双向同步
5. **表面监控** *(2027-03 → 2027-05)* — CertStream 品牌/错字域名检测、针对受监控域名的 HIBP、公开的 Telegram/Gist 观察者、Ahmia 索引的暗网搜索、MITRE TTP 变更日志
6. **平台与多租户** *(2027-06+)* — Postgres RLS、细粒度 RBAC、SCIM、审计日志流式传输、API 密钥作用域划分、数据驻留钩子
此外还有一直在进行的跨领域工作(贯穿整个 pipeline 的 OpenTelemetry、
OpenSearch ILM、IOC 衰减、TAXII 合约测试、解析器模糊测试)。
我们对**不会构建的内容**非常明确 — 没有内置的 SIEM,没有
通用的网络爬虫,没有原生的移动应用 — 因此路线图仍然保持
可交付状态。有关每个非目标背后的原因,请参见
[ROADMAP.md](ROADMAP.md#what-we-wont-build)。
**想要贡献吗?** 第一阶段的补全工具是最容易的切入点
— 模式定义明确、范围有界限、每个 PR 一个补全工具。
首先开启一个 issue 或在现有的 issue 上评论,这样我们就不会重复
工作。
## 🤝 贡献
1. Fork 该仓库
2. 创建功能分支
3. 进行更改
4. 运行测试:`pnpm test`
5. 提交 pull request
## 📄 许可证
MIT 许可证 - 有关详细信息,请参见 [LICENSE](LICENSE) 文件。
## 🙏 致谢
- **CISA** - 已知被利用漏洞目录
- **AlienVault** - 开放威胁交换
- **MITRE** - ATT&CK 框架
- **RinjaniAnalytics** - 平台开发
## 📞 支持
- **网站**: [rinjanianalytics.com](https://rinjanianalytics.com)
- **电子邮件**: [rinjanianalytics@gmail.com](mailto:rinjanianalytics@gmail.com)
- **Dashboard 仓库**: [cti-platform-dashboard](https://github.com/rinjanianalytics/cti-platform-dashboard)
- **Issues**: [GitHub Issues](https://github.com/rinjanianalytics/cti-platform-api/issues)
- **讨论**: [GitHub Discussions](https://github.com/rinjanianalytics/cti-platform-api/discussions)
标签:5G安全, MITM代理, 区块链追踪, 后端架构, 威胁情报, 子域名突变, 安全数据分析, 开发者工具, 搜索引擎查询, 数据聚合, 测试用例, 自动化攻击, 请求拦截