T0nd3/logatory
GitHub: T0nd3/logatory
一款本地优先的日志分析工具,集成了 PII 脱敏、规则检测、异常发现与 LLM 洞察,数据默认不离开本地基础设施。
Stars: 11 | Forks: 0
# Logatory
[](https://pypi.org/project/logatory/)
[](https://github.com/T0nd3/logatory/actions/workflows/ci.yml)
[](LICENSE)
[](https://pypi.org/project/logatory/)
**Local log analysis with PII redaction, rule-based threat detection, anomaly detection, LLM-powered insights, and a web dashboard — all running on your machine, no data leaves your infrastructure by default.**
Or stay in the terminal — format auto-detected, PII redacted, threats flagged:
$ logatory scan tests/data/auth.log
------------------------------------------------------------
Source : tests/data/auth.log
Format : auth_log
Events : 7
PII hits : 5 (mode: redact)
Findings : 1
------------------------------------------------------------
Events (7 of 7):
[ 1] 2026-05-18 10:00:01 INFO Accepted publickey for admin from ip_8390373f port 52341 ssh2
[ 2] 2026-05-18 10:00:15 WARNING Failed password for invalid user guest from ip_2bcf3253 port 22 ssh2
[ 3] 2026-05-18 10:00:16 WARNING Failed password for invalid user guest from ip_2bcf3253 port 22 ssh2
[ 4] 2026-05-18 10:00:17 WARNING Failed password for invalid user guest from ip_2bcf3253 port 22 ssh2
[ 5] 2026-05-18 10:01:00 INFO admin : TTY=pts/0 ; PWD=/home/admin ; USER=root ; COMMAND=/bin/systemctl restart nginx
[ 6] 2026-05-18 10:01:30 INFO new user: name=deploy, UID=1002, GID=1002, home=/home/deploy, shell=/bin/bash
[ 7] 2026-05-18 10:02:00 INFO Disconnected from ip_8390373f port 52341
Findings (1):
[LOW] 2026-05-18 10:01:00 sudo_misuse Sudo Command to Root: admin : TTY=pts/0 ; PWD=/home/admin ; USER=root ; COMMAND=/bin/systemctl restart nginx
The IP addresses above (`ip_8390373f`, …) are deterministic pseudonyms — the same IP always maps to the same token, so correlation survives while the raw value never reaches storage. This example is reproducible: the log file ships with the repo.
## Table of Contents
- [Features](#features)
- [Quick Start](#quick-start)
- [Installation](#installation)
- [CLI Reference](#cli-reference)
- [scan](#scan)
- [Docker container logs](#docker-container-logs)
- [Kubernetes pods](#kubernetes-pods)
- [Windows Event Log](#windows-event-log)
- [S3 / object storage](#s3--object-storage)
- [Syslog listener](#syslog-listener)
- [AWS CloudWatch Logs](#aws-cloudwatch-logs)
- [GCP Cloud Logging](#gcp-cloud-logging)
- [systemd journal](#systemd-journal-journald)
- [Remote servers (SSH)](#remote-servers-ssh)
- [tail](#tail)
- [serve](#serve)
- [findings](#findings)
- [errors](#errors)
- [rules](#rules)
- [anomaly](#anomaly)
- [llm](#llm)
- [opensearch](#opensearch)
- [loki](#loki)
- [graylog](#graylog)
- [fleet](#fleet)
- [export](#export)
- [demo](#demo)
- [Configuration](#configuration)
- [PII Redaction](#pii-redaction)
- [Detection Rules](#detection-rules)
- [Plugin System](#plugin-system)
- [Anomaly Detection](#anomaly-detection)
- [LLM Integration](#llm-integration)
- [Web Dashboard & REST API](#web-dashboard--rest-api)
- [Docker](#docker)
- [Contributing](#contributing)
- [Sponsoring & Enterprise](#sponsoring--enterprise)
## Features
| Capability | Details |
|---|---|
| **Format support** | Syslog, Nginx/Apache access, Apache error, HAProxy, Traefik, JSON Lines, logfmt, CEF, LEEF, plaintext — auto-detected; reads plain, gzip, and `.xlsx` files |
| **PII redaction** | Emails, IPv4/IPv6, credit cards (Luhn-checked), IBANs, German phone numbers — deterministic pseudonymisation or masking |
| **Rule engine** | YAML-based rules with `eq`, `ne`, `contains`, `startswith`, `endswith`, `re`, `gt`, `lt`, `gte`, `lte` operators; multi-field AND/OR |
| **Sigma support** | Convert Sigma rules to native format |
| **Anomaly detection** | Statistical Z-score baseline over 60-second buckets, trains automatically from historical logs |
| **LLM integration** | Ollama (default), Claude, OpenAI-compatible APIs; explain findings, summarize errors, RAG Q&A |
| **Web dashboard** | FastAPI + HTMX; findings/errors table, trend chart (ECharts), inline LLM explain, log file upload |
| **Log upload** | Drag-and-drop log upload in the browser — instant scan with PII redaction, results shown inline |
| **REST API v1** | Bearer-token auth, JSON endpoints for findings, errors, stats, live event ingestion |
| **OpenSearch** | Query and analyse logs from OpenSearch / Elasticsearch clusters |
| **systemd journal** | Read logs straight from journald via `journalctl` — scan history or follow live |
| **Docker logs** | Read container logs straight from the Docker daemon — scan or follow, no log stack required |
| **Kubernetes** | Read pod logs through `kubectl` — by namespace, label selector or pod; scan or follow, no log stack required |
| **Windows Event Log** | Analyze a JSON event export anywhere (even on Linux), or read a live log on Windows via `Get-WinEvent` |
| **S3 / object storage** | Read log objects straight from a bucket via the `aws` CLI — AWS S3 or any S3-compatible store; gzip decompressed on the fly |
| **Syslog listener** | Bind UDP/TCP 514 and receive syslog (RFC 3164 / RFC 5424) from network devices, firewalls and appliances |
| **AWS CloudWatch** | Pull events from a CloudWatch log group via the `aws` CLI — no boto3; scan or follow live |
| **GCP Cloud Logging** | Read entries via the `gcloud` CLI — no google-cloud dependency; scan or follow live with native severities |
| **Remote over SSH** | Pull logs from any SSH-reachable host — no agent on the remote box; scan or follow live with auto-reconnect |
| **Grafana Loki** | Query a Loki instance with LogQL — scan or follow live |
| **Graylog** | Query a Graylog server via its search API — scan or follow live |
| **Fleet** | Declare many log sources in one file — scan, follow, and manage a whole fleet at once |
| **Finding persistence** | SQLite store for HIGH/CRITICAL findings with retention, dedup, severity filtering |
| **FP suppression** | Dismiss rules globally or per source file; reversible |
| **Markdown export** | Automated security reports from the SQLite database |
| **Plugin system** | Drop Python files into a directory to add custom rules, PII patterns, parsers and source adapters |
| **Docker** | Multi-stage image, non-root user, `/data` volume — production-ready |
## Quick Start
# Install (core only — no external dependencies beyond PyYAML and typer)
pip install logatory
# Scan a log file
logatory scan /var/log/syslog
# Watch a file in real time
logatory tail /var/log/nginx/access.log
# Start the web dashboard
pip install 'logatory[web]'
logatory serve
That's it. Open `http://localhost:8080` in your browser.
## Installation
**Requirements:** Python 3.11+
### Core only
pip install logatory
Includes: file scanning, PII redaction, rule engine, anomaly detection, findings persistence, Markdown export, plugin system.
### Optional feature sets
pip install 'logatory[web]' # web dashboard + REST API (FastAPI, uvicorn, Jinja2)
pip install 'logatory[docker]' # read logs from local Docker containers
pip install 'logatory[opensearch]' # OpenSearch / Elasticsearch integration
pip install 'logatory[xlsx]' # read .xlsx spreadsheet log exports
pip install 'logatory[claude]' # Anthropic Claude API
pip install 'logatory[embed]' # ChromaDB for RAG (llm ask command)
Install everything:
pip install 'logatory[web,docker,opensearch,xlsx,claude,embed]'
### Shell auto-completion
logatory --install-completion # bash / zsh / fish / PowerShell
## CLI Reference
All commands accept `--config/-c ` to specify a config file. Without it, Logatory auto-discovers one from (in order) `$LOGATORY_CONFIG`, `./config.yaml`, then `~/.config/logatory/config.yaml`; if none exist, built-in defaults are used.
### scan
Parse a log file (or stdin), redact PII, run detection rules, and optionally persist errors and findings.
logatory scan [OPTIONS] [PATH]
| Option | Default | Description |
|---|---|---|
| `PATH` | stdin | Log file to scan. Use `-` explicitly for stdin. |
| `--config/-c` | `config.yaml` | Config file path. |
| `--redact` | `redact` | PII handling: `redact` (hash), `mask` (``), `dry-run` (show only). |
| `--limit/-n` | `50` | Max events to display in output. |
| `--all` | off | Display all events (ignores `--limit`). |
| `--format-only` | off | Print detection summary and exit, skip event listing. |
| `--json` | off | Emit the result as a single JSON object (machine-readable, for CI). |
| `--no-rules` | off | Skip the rule engine entirely. |
| `--rules-dir` | — | Additional YAML rules directory. |
| `--track-errors` | off | Persist error groups and HIGH/CRITICAL findings to SQLite. |
| `--detect-anomalies` | off | Run statistical anomaly detection against the trained baseline. |
| `--anomaly-source` | file stem | Override the baseline source key. |
| `--anomaly-threshold` | `3.0` | Z-score threshold for anomaly alerts. |
| `--explain-findings` | off | Ask the LLM to explain up to 3 HIGH/CRITICAL findings. |
| `--classify` | off | Ask the LLM to classify a sample of events by severity. |
**Examples**
# Basic scan with PII masking
logatory scan /var/log/auth.log --redact mask
# Scan a gzip-compressed file and persist results
logatory scan /var/log/nginx/access.log.gz --track-errors
# Read from stdin (e.g. pipe from journalctl)
journalctl -n 1000 | logatory scan -
# Scan with anomaly detection after training the baseline
logatory anomaly learn /var/log/syslog --source syslog
logatory scan /var/log/syslog --detect-anomalies --anomaly-source syslog
# Explain the worst findings with Ollama
logatory scan /var/log/auth.log --track-errors --explain-findings
### Docker container logs
No log aggregation stack (ELK, Loki, Graylog) required — if your services
run in Docker, Logatory reads their logs straight from the daemon. Install
the optional dependency and use the native `docker` command:
pip install 'logatory[docker]'
# Scan all running containers
logatory docker scan
# One container, by name; persist errors
logatory docker scan --name my-service --track-errors
# Filter by label, include stopped containers
logatory docker scan --label app=web --all
# Follow containers in real time (Ctrl+C to stop)
logatory docker tail
logatory docker tail --name my-service --alert-webhook https://hooks.example/logs
Each event is auto-detected per container (JSON, Nginx, plaintext, …),
PII-redacted, and tagged with its container name. `docker tail` polls the
daemon, so containers started after it launches are picked up automatically.
### Kubernetes pods
# Scan all pods in the current namespace
logatory kubernetes scan
# A workload by label selector; persist errors
logatory kubernetes scan --selector app=api --track-errors
# One namespace, one container; across all namespaces
logatory kubernetes scan --namespace prod --container app
logatory kubernetes scan --all-namespaces
# A single pod, a specific context and a lookback window
logatory kubernetes scan --pod api-7d9f --context staging --since 1h
# Follow pods in real time (Ctrl+C to stop)
logatory kubernetes tail --selector app=api
logatory kubernetes tail -n prod --alert-webhook https://hooks.example/logs
Each pod's containers are read individually, auto-detected (JSON, logfmt,
plaintext, …), PII-redacted, and tagged with their namespace, pod and
container. `kubernetes tail` re-lists pods every poll, so pods scheduled
after it launches are picked up automatically, and tracks each container by a
timestamp cursor so already-seen lines are never re-emitted.
### Windows Event Log
Windows event logs are most portably consumed as JSON. Export them on the
Windows host with PowerShell:
Get-WinEvent -LogName System -MaxEvents 500 |
Select-Object TimeCreated,Id,LevelDisplayName,Level,ProviderName,LogName,Message,MachineName,RecordId,Task |
ConvertTo-Json -Depth 3 > system.json
…then analyse the file **anywhere — even on Linux**:
# Scan an exported JSON file
logatory windows scan --path system.json
# Persist errors found in the export
logatory windows scan --path security.json --track-errors
On a Windows host the adapter can also read a log live by shelling out to
`Get-WinEvent` itself — no export step:
# Scan a live log (Windows only)
logatory windows scan --log System
logatory windows scan --log Security --provider Microsoft-Windows-Security-Auditing
# Follow a live log in real time (Ctrl+C to stop)
logatory windows tail --log System
logatory windows tail --log Security --alert-webhook https://hooks.example/logs
Each record's Windows level becomes a severity (Critical/Error/Warning/…),
`TimeCreated` the timestamp, and the event ID, provider, log name and machine
are kept in the event's fields. `windows tail` de-duplicates by RecordId, so
each event is delivered exactly once across polls.
### S3 / object storage
Logs shipped to object storage (S3, or any S3-compatible store like MinIO,
Cloudflare R2, Backblaze B2, Wasabi, …) can be analysed straight from the
bucket — no download-and-unzip dance. The adapter shells out to the system
`aws` CLI (no boto3 dependency), so your AWS profile, SSO session, instance
role and `~/.aws/config` all apply unchanged. Read-only — it only ever runs
`list-objects-v2` and `s3 cp`.
# Scan every object under a prefix
logatory s3 scan --bucket my-logs --prefix app/2026/06/
# Limit how many objects to read, and persist errors
logatory s3 scan --bucket my-logs --prefix app/ --max-objects 100 --track-errors
# Watch a bucket for new objects in real time (Ctrl+C to stop)
logatory s3 tail --bucket my-logs --prefix app/ --poll-interval 30
Point `--endpoint-url` at a non-AWS host to read from any S3-compatible
service (use `--region`/`--profile` as needed):
logatory s3 scan --bucket logs --endpoint-url http://minio.internal:9000
Each object's body is streamed and parsed exactly like any other source
(JSON, logfmt, plaintext, …); gzip-compressed objects (`*.gz`) are
decompressed transparently. Every event is tagged with its bucket and key.
Because S3 objects are immutable, `s3 tail` reads each new key exactly once.
### Syslog listener
Network devices, firewalls, routers and appliances rarely write a log file
you can read — they *emit* syslog over the wire. This source binds a UDP
and/or TCP port and turns every incoming message into an event, so a box
that only speaks syslog becomes just another source. Both the old BSD format
(RFC 3164) and the modern one (RFC 5424) are understood; the PRI value yields
the facility and a severity, and the hostname, app/tag and timestamp are
parsed out.
TCP framing follows RFC 6587 — both octet-counting (` `) and
newline-delimited messages are handled. Like `stdin` and `tail`, the syslog
listener is a local, stream-only source, so it isn't a fleet target.
### AWS CloudWatch Logs
# Fetch a batch from a log group, last hour, redact and run rules
logatory cloudwatch scan --log-group /app/prod --since 1h
# Narrow to a single stream and a CloudWatch filter pattern
logatory cloudwatch scan -g /app/prod -s web-1 --filter ERROR --region eu-central-1
# Follow the group live, alerting on high-severity findings
logatory cloudwatch tail --log-group /app/prod --profile prod \
--alert-webhook https://hooks.example/logs
`cloudwatch tail` advances a timestamp cursor every `--poll-interval` seconds
and de-duplicates on each event's `eventId`, so the inclusive `--start-time`
boundary never yields the same line twice.
### GCP Cloud Logging
# Fetch the last hour of entries from the default project
logatory gcp scan --since 1h
# Filter server-side and target a project
logatory gcp scan --filter 'severity>=ERROR' --project my-proj --since 2h
# Follow live, alerting on high-severity findings
logatory gcp tail --filter 'resource.type="k8s_container"' \
--alert-webhook https://hooks.example/logs
`gcp tail` AND-s a `timestamp > "…"` clause onto your filter each round and
de-duplicates on each entry's `insertId`, so only newly-arrived entries are
delivered.
### systemd journal (journald)
# Scan recent journal entries
logatory journald scan
# One unit, within a time window; persist errors
logatory journald scan --unit nginx.service --since '-1h' --track-errors
# Follow the journal in real time (Ctrl+C to stop)
logatory journald tail
logatory journald tail --unit sshd.service --alert-webhook https://hooks.example/logs
Syslog priorities map onto Logatory severities, and `journald tail` uses the
journal's native cursor — every poll resumes exactly where the last one left
off, so there are no duplicates and no gaps.
### Remote servers (SSH)
For a server reachable only over SSH, Logatory pulls its logs straight over
an existing SSH connection — **no agent on the remote box, no open port, no
daemon**. It shells out to the system `ssh` client, so your `~/.ssh/config`
(jump hosts, per-host keys, the agent) works unchanged. The remote source is
either a log file or the systemd journal:
# Scan a remote log file
logatory ssh scan user@host --path /var/log/auth.log
# Scan the remote journal, one unit
logatory ssh scan user@host --journald --unit nginx.service --since '-1h'
# Through a jump host, on a non-standard port
logatory ssh scan db01 --path /var/log/syslog --port 2222 --ssh-opt ProxyJump=bastion
# Follow a remote host in real time (Ctrl+C to stop)
logatory ssh tail user@host --path /var/log/app.log
logatory ssh tail user@host --journald --unit sshd.service --alert-webhook https://hooks.example/logs
`ssh tail` streams over a long-lived connection (`journalctl -f` / `tail -F`)
and reconnects automatically if it drops. In journald mode it resumes from
the journal cursor, so a dropped connection costs neither duplicates nor
gaps. Logs are redacted locally, after arriving over the encrypted SSH link.
### tail
Watch a log file for new lines in real time. Applies PII redaction and detection rules to every incoming event. Press **Ctrl+C** to stop.
logatory tail [OPTIONS] PATH
| Option | Default | Description |
|---|---|---|
| `PATH` | — | Log file to watch (required). |
| `--redact` | `redact` | PII mode: `redact`, `mask`, `dry-run`. |
| `--from-start` | off | Start from the beginning of the file instead of the tail. |
| `--no-rules` | off | Skip rule engine. |
| `--rules-dir` | — | Extra rules directory. |
| `--track-errors` | off | Persist new errors to SQLite. |
| `--track-findings` | off | Persist HIGH/CRITICAL findings to SQLite. |
| `--alert-webhook` | — | POST findings as JSON to this URL. |
| `--alert-min-severity` | `high` | Minimum severity for webhook: `low` \| `medium` \| `high` \| `critical`. |
| `--poll-interval` | `0.2` | File poll interval in seconds. |
Dismissed rules (see [`findings dismiss`](#findings)) are filtered out in real time — no spurious alerts for known false positives.
**Examples**
# Watch nginx access log and send critical findings to a webhook
logatory tail /var/log/nginx/access.log \
--track-findings \
--alert-webhook https://hooks.example.com/security \
--alert-min-severity high
# Read from the beginning and don't bother persisting
logatory tail /var/log/auth.log --from-start --no-rules
### Alert channels
`--alert-webhook` posts a generic JSON payload to one URL. For richer, persistent
alerting, configure named channels under `alerts:` in `config.yaml`. They apply to
**every** realtime command (`tail`, `docker tail`, `fleet tail`, the cloud
adapters, …) automatically — no per-command flags needed. Each channel has its own
`min_severity`, so you can route only `critical` findings to e-mail while Slack
gets everything `high` and above.
Supported channel `type`s: **`slack`**, **`discord`**, **`webhook`** (generic
JSON), **`email`** (SMTP).
alerts:
- type: slack
url: ${SLACK_WEBHOOK_URL} # ${ENV_VAR} is expanded — keep secrets out of the file
min_severity: high
cooldown: 300 # throttle: at most one alert per rule+source / 5 min
- type: discord
url: ${DISCORD_WEBHOOK_URL}
min_severity: high
- type: webhook
url: https://hooks.example.com/security
min_severity: medium
escalate_count: 5 # escalation: only alert once this finding
escalate_window: 120 # fires 5× within 120s (tames noisy rules)
- type: email
min_severity: critical
smtp_host: smtp.example.com
smtp_port: 587
smtp_user: alerts@example.com
smtp_password: ${SMTP_PASSWORD}
use_tls: true
sender: alerts@example.com
recipients:
- oncall@example.com
- secops@example.com
Inspect and verify your channels without waiting for a real finding:
logatory alerts list # show configured channels (secrets masked)
logatory alerts test # send a sample CRITICAL finding to every channel
logatory alerts test --webhook URL # also test an ad-hoc webhook URL
Set an optional per-channel **`cooldown`** (seconds) to tame alert storms: while
it is set, repeats of the *same* finding (identical `rule_id` + `source`) are
suppressed until the window elapses. `0` (the default) delivers every match. Only
successful deliveries arm the timer, so a channel that was down still gets the
next attempt.
Set per-channel **escalation** (`escalate_count` + `escalate_window` seconds) to
alert only on a *burst*: the channel stays silent until the same finding occurs
`escalate_count` times within `escalate_window` seconds, then fires once and
resets. Both must be set (count > 1 and window > 0) to take effect — ideal for
flaky rules where a single hit is noise but a rapid cluster is real. Escalation
and `cooldown` compose: a finding must first clear the burst threshold, then it
is still subject to the cooldown.
The legacy `--alert-webhook` flag still works and fires **in addition** to any
configured channels.
### serve
Start the Logatory web dashboard (requires `pip install 'logatory[web]'`).
logatory serve [OPTIONS]
| Option | Default | Description |
|---|---|---|
| `--host` | `127.0.0.1` | Bind address. Use `0.0.0.0` to expose on all interfaces. |
| `--port/-p` | `8080` | Port to listen on. |
| `--config/-c` | `config.yaml` | Config file. |
| `--reload` | off | Auto-reload on source file changes (development mode). |
logatory serve --port 9090
Open `http://localhost:8080` to access the dashboard, or `http://localhost:8080/api/docs` for the interactive REST API documentation.
### findings
Browse and manage HIGH/CRITICAL findings persisted by `scan --track-errors` or `tail --track-findings`.
logatory findings [list|show|summary|dismiss|undismiss|dismissed]
#### `findings list`
logatory findings list [--severity high] [--source nginx.log] [--since 7d] [-n 100]
`--since` accepts `s`, `m`, `h`, `d` suffixes: `30m`, `24h`, `7d`, `30d`.
#### `findings show `
Show all stored occurrences for a specific rule:
logatory findings show ssh_brute_force
logatory findings show ssh_brute_force -n 50
#### `findings summary`
Print counts by severity and the top 10 rules:
logatory findings summary
#### `findings dismiss `
Suppress a rule so future scans and tail sessions skip it:
# Global false-positive — suppress everywhere
logatory findings dismiss ssh_brute_force --reason "internal bastion host"
# Suppress only for one source file
logatory findings dismiss nginx_404_scan --source nginx.log --reason "internal scanner"
#### `findings undismiss `
Re-enable a suppressed rule:
logatory findings undismiss ssh_brute_force
#### `findings dismissed`
List all currently active suppressions:
logatory findings dismissed
### errors
Browse deduplicated error groups tracked by `scan --track-errors`.
logatory errors [list|show|new|regression]
#### `errors list`
logatory errors list [--sort last_seen|count|first_seen] [--severity error] [-n 50]
#### `errors show `
Show details and the 20 most recent occurrences for an error fingerprint:
logatory errors show abc123def456
#### `errors new`
Show errors first seen within a time window — useful for catching regressions after a deploy:
logatory errors new --since 1h
#### `errors regression`
Show errors that reappeared after a silence period:
logatory errors regression --silence 24h
### rules
Manage and validate detection rules.
logatory rules list [--rules-dir ./my-rules]
logatory rules validate my_rule.yml
logatory rules validate sigma_rule.yml --sigma
### anomaly
Train and manage the statistical anomaly detection baseline.
logatory anomaly [learn|status|reset]
#### `anomaly learn`
Feed a log file into the baseline. Run this several times on representative logs. At least **5 time buckets** are needed before the baseline is considered trained.
logatory anomaly learn /var/log/syslog --source syslog
logatory anomaly learn /var/log/nginx/access.log --source nginx --bucket 300
#### `anomaly status`
Show baseline training state for all known source keys:
logatory anomaly status
#### `anomaly reset`
Delete baseline data for one source key or all sources:
logatory anomaly reset --source syslog
logatory anomaly reset --all
Once the baseline is trained, enable detection during scan:
logatory scan /var/log/syslog --detect-anomalies --anomaly-source syslog --anomaly-threshold 2.5
### llm
LLM-powered log analysis. Supports **Ollama** (default, local), **Claude** (Anthropic), and any **OpenAI-compatible** API.
logatory llm [info|explain|summarize|ask|index]
#### `llm info`
Check provider connectivity and list available models:
logatory llm info
#### `llm explain `
Explain a tracked error in plain language:
logatory llm explain abc123def456
#### `llm summarize`
Generate a natural-language summary of recent errors:
logatory llm summarize --since 24h
#### `llm ask `
Ask questions about your findings and errors using RAG over the local SQLite database:
# Build the vector index first (requires pip install 'logatory[embed]')
logatory llm index
# Then ask freely
logatory llm ask "What are the most critical security issues from the past week?"
logatory llm ask "Which source files had the most brute-force attempts?"
### Agent (tool-using investigation)
While `llm ask` is a single-shot RAG query, the **agent** runs a multi-step loop:
it decides which read-only database tools to call, reads the results, and keeps
going until it can answer — automated triage instead of a one-off prompt.
logatory agent [investigate|ask|triage]
# Auto-triage the whole dataset: survey errors + findings, prioritized report
logatory agent triage
# Triage a single tracked error end-to-end (root cause + next steps)
logatory agent investigate abc123def456
# Free-form question; the agent gathers evidence with tools as needed
logatory agent ask "Why did the API start failing this afternoon?"
# Show every tool call and its result; bound the loop length
logatory agent ask "What is the most frequent critical error?" --verbose --max-steps 6
# Machine-readable output for CI / automation
logatory agent triage --json
Pass **`--allow-actions`** to additionally grant write-capable tools
(`dismiss_finding`, `undismiss_finding`, `list_dismissed`) so the agent can
suppress confirmed false-positive rules itself. This is opt-in and off by
default; a warning is printed and the agent is instructed to dismiss sparingly
and report exactly what it suppressed.
# Let the agent clean up noisy false positives (writes to the DB)
logatory agent triage --allow-actions
### opensearch
Query and analyse logs from an OpenSearch or Elasticsearch cluster.
logatory opensearch scan [OPTIONS]
logatory opensearch info
Configure the connection in `config.yaml` under the `opensearch:` key (see [Configuration](#configuration)). Credentials can be set via environment variables to avoid storing them in the config file.
# Check cluster connectivity
logatory opensearch info
# Run detection rules on the last 2 hours of logs
logatory opensearch scan --index "logstash-*" --since 2h --track-errors
### loki
Query and analyse logs from a [Grafana Loki](https://grafana.com/oss/loki/)
instance. No extra dependency — Loki is reached over plain HTTP.
# Scan the last hour, filtered by a LogQL stream selector
logatory loki scan --url http://loki:3100 --query '{job="nginx"}' --since 1h
# Multi-tenant Loki, with a bearer token
logatory loki scan --query '{namespace="prod"}' --token "$LOKI_TOKEN" --org-id team-a
# Follow Loki in real time (Ctrl+C to stop)
logatory loki tail --query '{job="app"}' --alert-webhook https://hooks.example/logs
Each Loki log line is run through format detection and parsing, just like a
local file. `loki tail` polls `query_range` and resumes from Loki's
nanosecond timestamp, so polls neither drop nor repeat entries. Credentials
can be supplied via `LOKI_USERNAME` / `LOKI_PASSWORD` / `LOKI_TOKEN`.
### graylog
Query and analyse logs from a [Graylog](https://graylog.org/) server via its
universal search API. No extra dependency — Graylog is reached over HTTP.
# Scan the last hour with an access token
logatory graylog scan --url http://graylog:9000 --token "$GRAYLOG_TOKEN" --since 1h
# Filter with a Graylog search query
logatory graylog scan --query 'source:web01 AND level:<=3' --track-errors
# Follow Graylog in real time (Ctrl+C to stop)
logatory graylog tail --query '*' --alert-webhook https://hooks.example/logs
Graylog messages keep their structured fields (source, level, timestamp).
`graylog tail` polls the search API and skips already-seen messages by id.
Authenticate with a Graylog access token (`GRAYLOG_TOKEN`) or with
`GRAYLOG_USERNAME` / `GRAYLOG_PASSWORD`.
### fleet
Most Logatory commands read one source. **Fleet** lets you declare many
sources in a `targets.yaml` and scan, follow, or manage them all at once —
each target can be any supported type (file, journald, docker, kubernetes,
windows, s3, cloudwatch, gcp, ssh, opensearch, loki, graylog).
Build the file interactively — the wizard prompts for each target's fields
and keeps secrets out of the file as `${ENV_VAR}` references:
logatory fleet init
…or write `targets.yaml` by hand:
targets:
- name: web01
type: ssh
host: web01.example
journald: true
unit: nginx.service
groups: [web, prod]
- name: prod-loki
type: loki
url: http://loki:3100
query: '{namespace="prod"}'
token: ${LOKI_TOKEN}
Then work the whole fleet:
# List the configured targets; --check probes each for reachability
logatory fleet list --check
# Scan every target once, concurrently — redact PII, run rules
logatory fleet scan
# Only the 'web' group, findings only
logatory fleet scan --group web --findings-only
# Follow the whole fleet in real time (Ctrl+C to stop)
logatory fleet tail --alert-webhook https://hooks.example/logs
Targets are fetched **concurrently**, and a target that fails is reported
without aborting the run. `fleet tail` polls every target in its own thread,
merges the events into one stream, prints findings plus a periodic heartbeat,
and keeps going if a host drops out. Select subsets with `--target NAME` or
`--group NAME` (both repeatable).
In the **web dashboard**, the *Fleet* page lists the targets and offers an
add-target form with per-type fields; the Findings and Errors pages gain a
target/group filter populated from `targets.yaml`. When an API token is set
the browser editor is read-only — manage the fleet with `fleet init` instead.
### export
Generate reports from the SQLite database.
logatory export report [OPTIONS]
| Option | Default | Description |
|---|---|---|
| `--output/-o` | `report.md` | Output file path. |
| `--since` | `168h` (7 days) | Look-back window: `24h`, `7d`, `30d`, etc. |
| `--severity` | all | Minimum severity filter. |
| `--title` | `Logatory Security Report` | Report title. |
| `--open` | off | Open the report in the system default app after writing. |
# Weekly security report
logatory export report --since 7d --output weekly.md --open
# Critical-only daily report
logatory export report --since 24h --severity critical --title "Daily Critical Alerts"
### demo
Interactive demo and database seeding using synthetic data — no real log files, Ollama, or database required for `demo run`.
logatory demo [run|seed|clear]
#### `demo run`
Guided CLI walkthrough of all 7 feature sections (log parsing, PII, rules, error tracking, findings, anomaly detection, LLM):
logatory demo run # pause after each section
logatory demo run --no-pause # print everything at once
#### `demo seed`
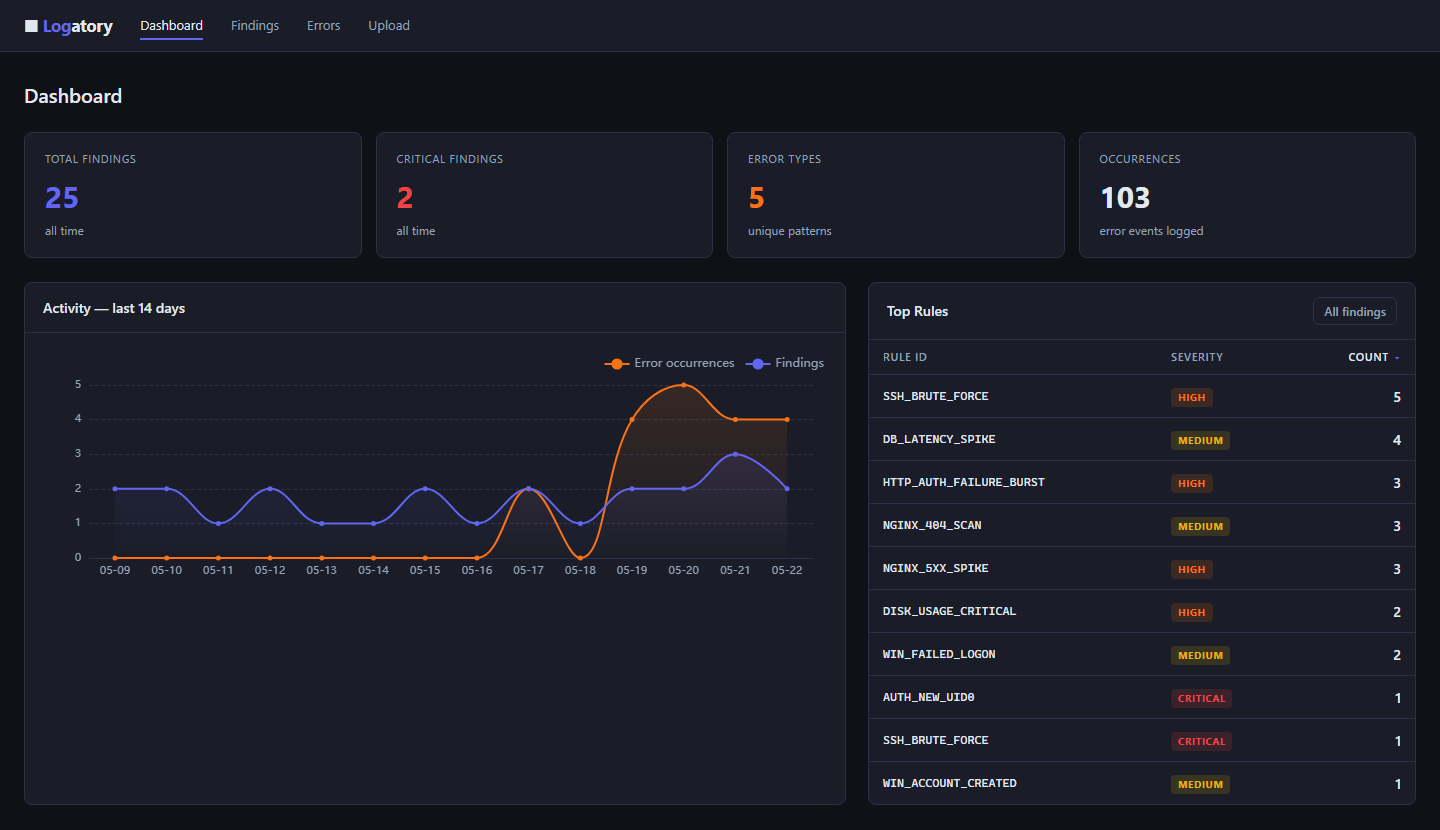
Populate the SQLite database with synthetic findings and errors so the **web dashboard** has something to display immediately. Inserts 25 findings spread over 14 days (for the trend chart) and 5 error groups. All records are tagged internally and never mixed with real data.
logatory demo seed
#### `demo clear`
Remove every record written by `demo seed`. Real findings and errors are never touched.
logatory demo clear
## Configuration
Run `logatory init` to generate a `config.yaml` (with a freshly generated PII
salt), or copy `config.yaml.example` and adapt. When no `--config` is passed,
Logatory looks for a config in `$LOGATORY_CONFIG`, `./config.yaml`, then
`~/.config/logatory/config.yaml`.
logatory init # write ./config.yaml
logatory init --minimal # smaller starter config
logatory init -o ~/.config/logatory/config.yaml
logatory doctor
logatory doctor --config ~/.config/logatory/config.yaml
# SQLite database for findings, errors, and baselines
db_path: logatory.db # use /data/logatory.db inside Docker
# Custom PII patterns file (optional)
pii_rules_path: pii_rules.yaml
# Salt for deterministic PII pseudonymisation
# Prefer env var LOGATORY_PII_SALT over storing here
pii_salt: ""
# REST API Bearer token — leave empty to disable auth (local dev)
# Prefer env var LOGATORY_API_TOKEN
api_token: ""
# Plugin directory — all *.py files here are auto-loaded at startup
# plugins_dir: plugins/
# Findings persistence behaviour
# findings_retention_days: 30
# findings_min_severity: high # low | medium | high | critical
# Alert channels — see the "Alert channels" section above.
# alerts:
# - type: slack
# url: ${SLACK_WEBHOOK_URL}
# min_severity: high
llm:
provider: ollama # ollama | claude | openai | groq | mistral
model: gemma3:4b
endpoint: http://localhost:11434
temperature: 0.1
max_context_tokens: 8000
# api_key: "" # cloud providers: set the provider's env var instead
# # claude → ANTHROPIC_API_KEY, openai → OPENAI_API_KEY,
# # groq → GROQ_API_KEY, mistral → MISTRAL_API_KEY
opensearch:
host: localhost
port: 9200
use_ssl: false
verify_certs: true
# Credentials — always prefer env vars:
# OPENSEARCH_USERNAME / OPENSEARCH_PASSWORD
# OPENSEARCH_API_KEY
# OPENSEARCH_CLIENT_CERT / OPENSEARCH_CLIENT_KEY / OPENSEARCH_CA_CERTS
default_index: "logstash-*"
timestamp_field: "@timestamp"
message_field: "message"
severity_field: "level"
source_name_field: "host.name"
### Environment variables
| Variable | Description |
|---|---|
| `LOGATORY_PII_SALT` | Salt for PII pseudonymisation |
| `LOGATORY_API_TOKEN` | Bearer token for REST API auth |
| `ANTHROPIC_API_KEY` | API key when `llm.provider: claude` |
| `OPENAI_API_KEY` | API key when `llm.provider: openai` |
| `GROQ_API_KEY` | API key when `llm.provider: groq` |
| `MISTRAL_API_KEY` | API key when `llm.provider: mistral` |
| `OPENSEARCH_USERNAME` | OpenSearch basic auth username |
| `OPENSEARCH_PASSWORD` | OpenSearch basic auth password |
| `OPENSEARCH_API_KEY` | OpenSearch API key (`id:base64key`) |
| `OPENSEARCH_CLIENT_CERT` | Path to client certificate |
| `OPENSEARCH_CLIENT_KEY` | Path to client private key |
| `OPENSEARCH_CA_CERTS` | Path to CA certificate bundle |
| `LOGATORY_CONFIG` | Config file path used by `logatory serve --reload` |
## PII Redaction
PII redaction runs on every log line before analysis. Three modes are available via `--redact`:
| Mode | Behaviour | Use case |
|---|---|---|
| `redact` (default) | Replaces PII with a salted HMAC hash: `` | Preserves correlation across events |
| `mask` | Replaces PII with a generic tag: `` | Maximum anonymity |
| `dry-run` | Reports PII hits without changing the text | Audit what would be redacted |
**Built-in patterns:** email addresses, IPv4/IPv6 addresses, credit cards (Luhn-validated), IBANs, German phone numbers (`+49` / `0049` / national `0`).
### Custom PII patterns
Add patterns in `pii_rules.yaml`:
patterns:
- name: employee_id
pattern: '\bEMP-\d{4,8}\b'
prefix: employee # produces
- name: order_id
pattern: '\bORD-[A-Z0-9]{8,12}\b'
prefix: order
Or register patterns via the [Plugin System](#plugin-system).
## Detection Rules
Rules live in `logatory/rules/builtin/` (shipped) or any YAML file you point to with `--rules-dir`.
### Built-in rules
| ID | Severity | Triggers on |
|---|---|---|
| `ssh_brute_force` | high | Multiple SSH auth failures from one host |
| `sudo_misuse` | low | A command run as root via `sudo` (`USER=root`), for audit |
| `auth_new_uid0` | critical | New UID 0 account created |
| `nginx_404_scan` | medium | High rate of 404 responses (scanner pattern) |
| `nginx_5xx_spike` | high | Multiple 5xx errors in a short window |
| `win_failed_logon` | high | Windows Event ID 4625 (failed logon) |
| `win_account_created` | medium | Windows Event ID 4720 (account created) |
### Writing custom rules
id: MY_RULE_001
title: "Sensitive file accessed"
description: "Fires when /etc/passwd is accessed via nginx"
level: high # low | medium | high | critical
detection:
match:
- field: message
op: contains
value: "/etc/passwd"
- field: message
op: re
value: 'GET\s+/etc/passwd'
condition: any # any (OR) | all (AND, default)
**Supported operators:** `eq`, `ne`, `contains`, `startswith`, `endswith`, `re` (regex), `gt`, `lt`, `gte`, `lte`.
Validate a rule before using it:
logatory rules validate my_rule.yml
### Sigma rules
Import a Sigma rule and convert it to the native format:
logatory rules validate sigma_rule.yml --sigma
## Plugin System
Drop Python files into a directory and register custom rules, PII patterns, log-format parsers and source adapters. Enable in `config.yaml`:
plugins_dir: plugins/
A plugin file must expose a `register(registry)` function:
# plugins/my_plugin.py
def register(registry) -> None:
# Custom detection rule
registry.add_rule({
"id": "MY_DB_LEAK",
"title": "Database credentials exposed in log",
"description": "Fires when a connection string appears in a log message.",
"level": "critical",
"detection": {
"match": [
{"field": "message", "op": "re", "value": r"postgresql://\S+:\S+@"},
]
},
})
# Custom PII pattern — redacts internal employee IDs
registry.add_pii_pattern(
name="employee_id",
pattern=r"\bEMP-\d{4,8}\b",
prefix="employee",
)
# Load an entire directory of YAML rule files
from pathlib import Path
registry.add_rule_dir(Path(__file__).parent / "my_rules")
# Custom log-format parser — auto-detected like any built-in format
# registry.add_parser(name="myfmt", detect=looks_like_myfmt, factory=MyParser)
# Custom source adapter — looked up by name like any built-in source
# registry.add_adapter(name="kafka", adapter_cls=KafkaAdapter)
Plugin rules participate in `logatory scan`, `logatory tail`, and the web dashboard rule engine. Plugin PII patterns apply to every redaction pass; plugin parsers and adapters register into the global parser/adapter registries, so format auto-detection and source lookup pick them up everywhere. A plugin that raises an exception is logged as a warning and skipped — it never crashes the host process.
A complete, runnable example covering all four contribution types lives in [`plugins/example_plugin.py`](plugins/example_plugin.py), and the full guide is in [`docs/PLUGINS.md`](docs/PLUGINS.md).
## Anomaly Detection
Logatory uses a statistical Z-score baseline to detect unusual log activity without writing any rules. Features tracked per 60-second bucket: total event count, error rate, warning rate.
**Training workflow:**
# Step 1: Feed representative logs (repeat for several days of data)
logatory anomaly learn /var/log/syslog --source syslog
# Step 2: Check training state
logatory anomaly status
# shows: syslog → 42 observations trained ✓
# Step 3: Enable detection in scan or tail
logatory scan /var/log/syslog --detect-anomalies --anomaly-source syslog
At least **5 time buckets** are required before the baseline is used. The baseline grows automatically every time you scan with `--detect-anomalies` — no separate training step is needed once you're in production.
Adjust sensitivity with `--anomaly-threshold` (default: `3.0` standard deviations):
# More sensitive
logatory scan /var/log/syslog --detect-anomalies --anomaly-threshold 2.0
# Less sensitive
logatory scan /var/log/syslog --detect-anomalies --anomaly-threshold 4.0
## LLM Integration
### Ollama (recommended — fully local)
# Install and start Ollama: https://ollama.ai
ollama pull gemma3:4b
# Default config already points to http://localhost:11434
logatory llm info
### Claude (Anthropic)
# config.yaml
llm:
provider: claude
model: claude-3-5-haiku-20241022
export ANTHROPIC_API_KEY=sk-ant-...
logatory llm info
### OpenAI-compatible APIs
llm:
provider: openai
model: gpt-4o-mini
endpoint: https://api.openai.com/v1
export OPENAI_API_KEY=sk-...
### Groq & Mistral
llm:
provider: groq # or: mistral
model: llama-3.3-70b-versatile
export GROQ_API_KEY=gsk-... # mistral → MISTRAL_API_KEY
## Web Dashboard & REST API
Start the server (requires `pip install 'logatory[web]'`):
logatory serve --port 8080
### Dashboard pages
| URL | Description |
|---|---|
| `/` | Overview with 14-day trend chart and quick stats |
| `/findings` | Findings table with severity filter, inline LLM explain |
| `/errors` | Error group table with frequency and recency sorting |
| `/upload` | Drag-and-drop log file upload with instant scan results |
### Log file upload
Navigate to `/upload` in the browser to scan any log file without leaving the dashboard:
- **Drag-and-drop** or click to browse — `.log`, `.txt`, `.gz`, `.json`
- Choose PII mode: **Redact** (pseudonymize), **Mask** (``), or **Dry-run**
- Results appear inline (no page reload): stat cards, findings table sorted by severity, 20-event sample
- **Nothing is persisted** — purely transient analysis; use `logatory scan --track-errors` to save results
- Maximum upload size: **10 MB**
### REST API v1
Base path: `/api/v1/`
Interactive docs: `/api/docs`
| Method | Path | Description |
|---|---|---|
| `GET` | `/api/v1/health` | Liveness probe (no auth) |
| `GET` | `/api/v1/findings` | List findings (`?severity=high&since_hours=24&source=nginx.log`) |
| `GET` | `/api/v1/findings/{id}` | Get finding by ID |
| `GET` | `/api/v1/errors` | List error groups (`?sort=count`) |
| `GET` | `/api/v1/errors/{fingerprint}` | Get error group + recent occurrences |
| `GET` | `/api/v1/stats` | Aggregate counts |
| `POST` | `/api/v1/events` | Ingest a raw log line → returns triggered findings |
**Authentication**
Set `api_token` in `config.yaml` or via `LOGATORY_API_TOKEN`. Pass it as:
Authorization: Bearer
Leave empty to disable auth (for local development or Docker with network-level access control).
**Event ingestion example**
curl -X POST http://localhost:8080/api/v1/events \
-H "Authorization: Bearer mytoken" \
-H "Content-Type: application/json" \
-d '{"raw": "Failed password for root from 1.2.3.4 port 22", "source": "sshd"}'
### Why don't my scans show up in the dashboard?
The trend chart and findings tables read **only** from the SQLite database. A scan
appears in the dashboard only if it was *persisted*, and persistence has three gotchas:
1. **`scan` persists nothing by default.** You must pass `--track-errors`:
logatory scan /var/log/app.log --track-errors
2. **Only findings ≥ `findings_min_severity` are saved** (default `high`). MEDIUM/LOW
findings are never written. Lower the threshold in `config.yaml` if needed:
findings_min_severity: low # low | medium | high | critical
3. **`scan` and `serve` must use the same database.** `db_path` defaults to
`logatory.db` *relative to the current working directory*, so running the two
commands from different folders writes to / reads from different DB files. Set an
absolute path to be safe:
db_path: /data/logatory.db
The browser **`/upload`** page is intentionally **transient** — it never persists, so
uploads there will not appear in the trend chart. Use `logatory scan --track-errors`
to populate the dashboard.
## Docker
### Quick start
docker compose up -d
The stack starts Logatory on port `8080` with a named volume for the SQLite database.
### Environment variables for Docker
# docker-compose.yml (or .env file)
LOGATORY_API_TOKEN=change-me-in-production
LOGATORY_PII_SALT=a-long-random-string
### Build and run manually
docker build -t logatory .
docker run -d \
-p 8080:8080 \
-v logatory-data:/data \
-e LOGATORY_API_TOKEN=mytoken \
-e LOGATORY_PII_SALT=mysalt \
logatory
The container runs as a non-root user (`logatory`, UID 1001). The database and config are stored in `/data`.
### Scanning log files inside Docker
Mount the host log directory and run a one-shot scan:
docker run --rm \
-v /var/log:/logs:ro \
-v logatory-data:/data \
logatory \
logatory scan /logs/syslog --track-errors
### Demo data for the web dashboard
Seed the database with synthetic findings and errors so the dashboard shows data immediately:
# Populate (25 findings over 14 days + 5 error groups)
docker compose exec logatory logatory demo seed
# Remove all demo data (real data is untouched)
docker compose exec logatory logatory demo clear
Alternatively, upload a real log file via the browser at `http://localhost:8080/upload` for an instant, transient scan.
标签:AMSI绕过, DLL 劫持, TCP/UDP协议, Web看板, 大语言模型, 威胁检测, 异常检测, 恶意代码分类, 数据脱敏, 网络测绘, 请求拦截, 逆向工具