Bhuvaneshwari-bhu/AI-Dataset-Cleaning-Pipeline-Project
GitHub: Bhuvaneshwari-bhu/AI-Dataset-Cleaning-Pipeline-Project
一个生产级AI数据集清洗与验证管道,用于解决机器学习数据质量问题。
Stars: 0 | Forks: 0
# AI 数据集清洗与验证管道
一个全栈数据质量系统,用于上传、验证、清洗、检测异常,并为 CSV 数据集生成自动化报告。
## 🌐 实时链接
前端 (Vercel):
https://ai-dataset-cleaning-pipeline-projec.vercel.app
后端 API (Render):
https://bhu-ai-dataset-cleaning-pipeline.onrender.com
## API 文档 (Swagger):
https://bhu-ai-dataset-cleaning-pipeline.onrender.com/docs
[](https://github.com/your-org/ai-dataset-pipeline/actions/workflows/ci.yml)
[](https://www.python.org/downloads/)
[](#testing)
[](#testing)
[](https://github.com/astral-sh/ruff)
一个生产级、模块化的数据质量系统,用于在数据集进入机器学习训练管道或分析工作流之前,对其进行清洗、验证和分析。该管道能够在早期发现结构性、语义性和统计性问题——在它们悄然影响下游模型之前。
## 目录
- [概述](#overview)
- [功能特性](#features)
- [技术栈](#tech-stack)
- [架构](#architecture)
- [管道阶段](#pipeline-stages)
- [项目结构](#project-structure)
- [安装说明](#installation)
- [运行应用程序](#running-the-application)
- [使用方式](#usage)
- [零配置快速启动](#zero-configuration-quickstart)
- [CLI 参考](#cli-reference)
- [编程式 API](#programmatic-api)
- [模式配置](#schema-configuration)
- [HTML 报告](#html-report)
- [漂移检测](#drift-detection)
- [测试](#testing)
- [CI 管道](#ci-pipeline)
- [路线图](#roadmap)
## 概述
现实世界的数据集是杂乱的。缺失值、类型不匹配、超出范围的数值、格式错误的字符串、重复行和统计异常值是常见问题,它们会悄然累积——在损坏数据上训练的模型会悄无声息地失败,通常是在数据问题引入很久之后。
此管道提供了一种系统化、可审计的方法,用于:
1. **验证**数据集:在任何转换之前,根据声明性模式进行验证
2. **清洗**数据:通过可配置、有日志记录的操作序列
3. **检测**异常:使用 IQR 或 Z-score 方法
4. **检测漂移**:将传入批次与已知良好的基线进行比较
5. **报告**所有发现:生成自包含的 HTML 质量报告
每个阶段都返回结构化结果(数据类,而非打印语句),使管道具有可组合性——你可以只运行需要的阶段,或将它们嵌入现有的编排框架。
## 功能特性
### 数据验证
- **基于模式的规则** —— 在 YAML 或 Python 字典中定义的每列数据类型、可空性、数值范围、允许值和正则表达式约束
- **正则表达式验证** —— 内置命名模式 (`email`, `phone`, `zip_us`, `date_iso`) 以及原始正则字符串
- **列分析** —— 与验证同时计算数据类型、空值率、唯一值数量、最小值/最大值/平均值/中位数/标准差
- **数据质量评分** —— 0–100 的综合评分,包含按比例计算的缺失/重复惩罚和每列违规的固定惩罚
- **导出无效行** —— 至少未通过一项检查的行将被写入单独的 CSV,用于下游分析
### 数据清洗
- **灵活的插补** —— 针对缺失数值的 `median`、`mean`、`mode` 或 `drop` 策略;支持每列自定义填充
- **去重** —— 精确行去重并记录计数
- **列名标准化** —— 去除空格并规范为 `snake_case`
- **字符串空格剥离** —— 修剪所有对象列的前导/尾随空格
- **完整审计日志** —— 每个转换都记录为带时间戳的消息列表
### 异常检测
- **IQR 方法** —— `Q1 − k·IQR / Q3 + k·IQR` 界限(可配置乘数 `k`);对偏斜分布具有鲁棒性
- **Z-score 方法** —— 基于标准差的阈值;最适合近似正态分布
- **非破坏性** —— `detect()` 标记异常值;`remove_outliers()` 移除它们——两个独立的操作
### 数据漂移检测
- **Kolmogorov–Smirnov 检验** (通过 `scipy`) —— 比较两个样本的无分布显著性检验
- **归一化均值偏移** —— `(new_mean − base_mean) / base_std` —— 均值移动了多少个标准差
- **标准差比率** —— `new_std / base_std` —— 分布的展宽是否发生变化
- **优雅降级** —— 当 `scipy` 不可用时,自动使用均值/标准差阈值
- **每列漂移标志** 以及 `overall_drift_score` (0–100,漂移列的比例)
### 报告
- **Great Expectations 风格的 HTML 报告** —— 质量记分卡、数据集概览、验证结果、列分析、模式/格式/范围违规表、清洗日志、异常值摘要、分布直方图、可选漂移部分
- **自包含** —— 图表作为链接的 PNG 文件嵌入;无外部 CDN 依赖
- **可选 PDF 导出** —— 安装 `weasyprint` 后可用
### 工程质量
- **兼容 Pandas 3.x** —— 无链式赋值模式;所有变更使用显式列重新赋值
- **100% 测试覆盖率** —— 6 个测试模块共 104 个测试(1 个因缺少 `openpyxl` 跳过)
- **完整的类型注解** —— 使用 `mypy --strict` 验证(除 `warn_return_any` 外)
- **Ruff 代码检查** —— 行长度 100 的 E, F, I, B, UP 规则集
- **结构化日志** —— 全程使用 `logging` 模块;无 `print()` 调用
- **5 阶段 CI** —— 语法、FutureWarning 导入检查、mypy、ruff、pytest
## 技术栈
### 后端
| 组件 | 技术 | 用途 |
| :--- | :--- | :--- |
| 语言 | Python 3.11+ | 核心运行时 |
| API 框架 | FastAPI | REST 端点、OpenAPI 文档、依赖注入 |
| 数据处理 | Pandas + NumPy | DataFrame 操作、列分析 |
| 统计计算 | SciPy | Kolmogorov–Smirnov 漂移检验 |
| 可视化 | Matplotlib + Seaborn | 分布直方图、图表生成 |
| 模式验证 | Pydantic v2 | 请求/响应模型强制 |
| ASGI 服务器 | Uvicorn | 带热重载的生产级服务器 |
| 代码检查 | Ruff | 快速代码检查工具 — E, F, I, B, UP 规则集 |
| 类型检查 | mypy | 使用 `--strict` 进行静态分析 |
| 测试 | pytest + pytest-cov | 单元 + 集成测试,行级覆盖率 |
### 前端
| 组件 | 技术 | 用途 |
| :--- | :--- | :--- |
| UI 框架 | React 18 | 基于组件的界面 |
| 构建工具 | Vite 5 | 带 HMR 的开发服务器,优化的生产包 |
| 样式 | Tailwind CSS 3 | 工具优先的 CSS — 无自定义样式表 |
| 路由 | React Router v6 | 客户端导航 (`/`, `/upload`, `/dashboard/:id`) |
| HTTP 客户端 | Axios | 带请求/响应拦截器的 API 请求 |
| 图表 | Recharts | 质量仪表、缺失值和异常值条形图 |
| 状态管理 | React hooks | `useState`, `useEffect`, `useCallback`, 自定义 hooks |
## 架构
```
src/
├── main.py ← CLI entry point (argparse) + pipeline orchestrator
├── loader.py ← I/O: CSV / JSON / Excel → DataFrame
├── validator.py ← Schema definition, profiling, validation, quality score
├── cleaner.py ← Imputation, deduplication, column name normalisation
├── anomaly_detector.py ← IQR and Z-score outlier detection
├── drift_detector.py ← KS test + mean/std shift comparison
├── report_generator.py ← HTML (+ optional PDF) quality report
└── logger.py ← Centralised logging factory
```
每个模块都有单一职责,并通过类型化的数据类进行通信——`ValidationResult`、`AnomalyReport`、`DriftReport`——而不是共享可变状态。这使得每个阶段都可独立测试,且管道可组合。
```
┌──────────┐
│ loader │ load_csv / load_json / load_excel
└────┬─────┘
│ df_raw
┌─────────▼──────────┐
│ validator │ schema rules + profiling + quality score
└─────────┬──────────┘
│ ValidationResult
┌─────────▼──────────┐
│ cleaner │ impute + deduplicate + normalise columns
└─────────┬──────────┘
│ df_clean + clean_log
┌─────────▼──────────┐
│ anomaly_detector │ IQR / Z-score outlier flags
└─────────┬──────────┘
│ AnomalyReport
┌─────────▼──────────┐ ┌──────────────────┐
│ report_generator │◄───│ drift_detector │ (optional)
└─────────┬──────────┘ └──────────────────┘
│
report.html
```
## 管道阶段
| # | 阶段 | 模块 | 输入 | 输出 |
| :--- | :--- | :--- | :--- | :--- |
| 1 | **加载** | `loader.py` | CSV / JSON / Excel 文件路径 | `pd.DataFrame` |
| 2 | **验证** | `validator.py` | 原始 DataFrame + 模式 | `ValidationResult`(分析、违规、评分、无效行) |
| 3 | **清洗** | `cleaner.py` | 原始 DataFrame | 清洗后的 `pd.DataFrame` + `list[str]` 审计日志 |
| 4 | **检测异常** | `anomaly_detector.py` | 清洗后的 DataFrame | `AnomalyReport`(每列异常值计数 + 索引) |
| 5 | **导出** | `main.py` | 清洗后的 DataFrame | `output/clean_dataset.csv`, `output/invalid_rows.csv` |
| 6 | **报告** | `report_generator.py` | 以上所有结果 | `reports/report.html` (+ 可选 `report.pdf`) |
漂移检测是可选的第七个阶段——单独运行 `DriftDetector.compare(baseline, incoming)` 并将生成的 `DriftReport` 传递给 `ReportGenerator.generate()`。
## 项目结构
```
ai-dataset-pipeline/
├── .github/
│ └── workflows/
│ └── ci.yml # 5-stage GitHub Actions CI
├── config/
│ └── schema.yaml # Column validation rules (YAML)
├── data/
│ └── sample_dataset.csv # Auto-generated sample (200 rows)
├── frontend/ # React + Vite dashboard
│ ├── src/
│ │ ├── components/ # UI primitives, charts, dashboard, upload
│ │ │ ├── charts/ # QualityGauge · MissingValuesChart · OutlierChart
│ │ │ ├── dashboard/ # OverviewCards · ProfilesTable · CleaningLog · ReportActions
│ │ │ ├── layout/ # Navbar (live API badge) · Footer
│ │ │ ├── ui/ # Button · Card · Badge · Spinner · ProgressBar · EmptyState · ErrorBoundary
│ │ │ └── upload/ # DropZone (drag-and-drop with validation)
│ │ ├── context/ # ToastContext — notification system
│ │ ├── hooks/ # useUpload · useAnalysis · useToast
│ │ ├── layouts/ # MainLayout (Navbar + Footer + Outlet)
│ │ ├── pages/ # LandingPage · UploadPage · DashboardPage · NotFoundPage
│ │ ├── services/api.js # Axios layer — all API calls in one place
│ │ └── App.jsx # BrowserRouter + route definitions
│ ├── .env.example # Copy to .env before running
│ ├── package.json
│ ├── tailwind.config.js
│ └── vite.config.js
├── output/ # Created at runtime (CLI mode)
│ ├── clean_dataset.csv
│ └── invalid_rows.csv
├── reports/ # Created at runtime (CLI mode)
│ ├── report.html
│ └── dist_*.png
├── src/
│ ├── main.py # CLI entry point (argparse)
│ ├── main_api.py # FastAPI application entry point
│ ├── api/
│ │ ├── routes/ # Endpoint handlers: health · upload · analyze · report · download
│ │ ├── schemas/ # Pydantic request/response models
│ │ └── services/ # Pipeline orchestration + StorageManager
│ ├── loader.py
│ ├── validator.py
│ ├── cleaner.py
│ ├── anomaly_detector.py
│ ├── drift_detector.py
│ ├── report_generator.py
│ └── logger.py
├── storage/ # Created at runtime (API mode)
│ ├── uploads/ # Raw uploaded CSVs
│ ├── cleaned/ # Cleaned output CSVs
│ └── reports/ # Per-upload HTML reports + chart images
├── tests/
│ ├── conftest.py # Shared fixtures (clean_df, dirty_df)
│ ├── test_loader.py
│ ├── test_validator.py
│ ├── test_cleaner.py
│ ├── test_anomaly_detector.py
│ ├── test_drift_detector.py
│ ├── test_report_generator.py
│ └── test_api.py # FastAPI integration tests (TestClient)
├── .coveragerc
├── mypy.ini
├── pytest.ini
├── ruff.toml
├── requirements.txt
└── requirements-dev.txt
```
## 安装说明
### 步骤 1 — 克隆仓库
```
git clone https://github.com/your-org/ai-dataset-pipeline.git
cd ai-dataset-pipeline
```
### 步骤 2 — 后端 (Python + FastAPI)
```
# 创建独立的虚拟环境
python3 -m venv .venv
# 激活它
source .venv/bin/activate # macOS / Linux
# .venv\Scripts\activate # Windows PowerShell
# 确认正确的 Python 已激活(应显示 3.11.x 或更高版本)
python --version
# 安装运行时依赖项(FastAPI、pandas、scipy 等)
pip install -r requirements.txt
# 安装开发工具 —— 运行测试、代码检查和类型检查所必需
pip install -r requirements-dev.txt
```
### 步骤 3 — 前端 (React + Vite)
```
cd frontend
# 复制环境模板
# 此文件设置 VITE_API_BASE_URL=http://127.0.0.1:8000
cp .env.example .env
# 安装 Node 依赖项(全新克隆时大约需要 30 秒)
npm install
# 返回项目根目录
cd ..
```
## 运行应用程序
你需要同时打开 **两个终端窗口**——一个用于后端,一个用于前端。
### 终端 1 — FastAPI 后端
```
# 首先激活虚拟环境(每个新终端会话都必须执行此操作)
source .venv/bin/activate # Windows: .venv\Scripts\activate
# 启动 API 服务器并在文件更改时自动重新加载
cd src
uvicorn main_api:app --reload --host 127.0.0.1 --port 8000
```
当终端打印以下内容时,表示服务器已就绪:
```
INFO: Uvicorn running on http://127.0.0.1:8000 (Press CTRL+C to quit)
INFO: Application startup complete.
```
**后端运行后可用的 URL:**
| URL | 用途 |
| :--- | :--- |
| `http://127.0.0.1:8000/health` | 健康检查 — 返回 `{"status":"ok","version":"1.0.0"}` |
| `http://127.0.0.1:8000/docs` | **Swagger UI** — 交互式浏览和调用每个端点 |
| `http://127.0.0.1:8000/redoc` | ReDoc — 清晰的 API 参考,包含完整的请求/响应模式 |
### 终端 2 — React 前端
```
# 打开第二个终端并导航到前端文件夹
cd frontend
npm run dev
# Vite 显示:➜ 本地:http://localhost:3000/
```
在浏览器中打开 **`http://localhost:3000`**。
### 示例工作流
```
1. Open http://localhost:3000
│
▼
2. Click "Analyse Your Dataset" → /upload page
│
▼
3. Drag & drop a .csv file onto the drop zone (or click to browse)
│
▼
4. Choose pipeline options:
├── Anomaly Method → IQR or Z-Score
├── Fill Strategy → Median / Mean / Mode / Drop Row
└── Threshold → default 1.5
│
▼
5. Click "Analyse Dataset →"
│
├── Upload progress bar (POST /upload)
└── Analysis spinner (POST /analyze/{upload_id})
│
▼
6. Dashboard loads automatically with:
├── Quality Score gauge (0–100, green / amber / red)
├── Overview cards (raw rows, clean rows, duplicates, outliers, missing)
├── Missing Values chart + Outlier chart (Recharts)
├── Column Profiles table (paginated, sortable)
└── Cleaning Log + Schema / Format / Type violation panels
│
├──► "Open Full Report" → HTML report in new tab
└──► "Download Cleaned CSV" → saves cleaned file locally
```
### 运行测试
```
# 首先激活虚拟环境
source .venv/bin/activate
# 运行完整测试套件(141 个测试)
pytest
# 运行并显示逐行覆盖率报告
pytest --cov=src --cov-report=term-missing
# 运行特定的测试文件
pytest tests/test_validator.py -v
# 运行匹配关键字的测试
pytest -k "zscore" -v
# 仅运行 API 集成测试
pytest tests/test_api.py -v
```
### 故障排除
| 症状 | 可能原因 | 解决方案 |
| :--- | :--- | :--- |
| `ModuleNotFoundError: No module named 'fastapi'` | 虚拟环境未激活或安装被跳过 | `source .venv/bin/activate && pip install -r requirements.txt` |
| `uvicorn: command not found` | Uvicorn 未安装 | `pip install "uvicorn[standard]"` |
| 导航栏显示 **API 离线** (红色) | 后端未运行或端口不匹配 | 启动终端 1;检查 `frontend/.env` 中的 `VITE_API_BASE_URL` |
| 浏览器控制台出现 CORS 错误 | `ALLOWED_ORIGINS` 环境变量不匹配 | 本地开发时,不设置 `ALLOWED_ORIGINS`——默认为 `*` |
| `npm run dev` 失败 | `node_modules` 未安装 | `cd frontend && npm install` |
| 上传时出现 `422 Unprocessable Content` | 文件不是 `.csv` 或为空 | 使用有效的 CSV 文件,至少包含一个标题行和一个数据行 |
| HTML 报告中缺少图表 | `storage/` 目录不可写 | 文件夹在首次运行时自动创建;检查文件系统权限 |
| PDF 导出错误 | 缺少 `weasyprint` 系统库 | PDF 导出是可选的——参见 [weasyprint 安装指南](https://doc.courtbouillon.org/weasyprint/stable/first_steps.html) |
## 使用方式
### 零配置快速启动
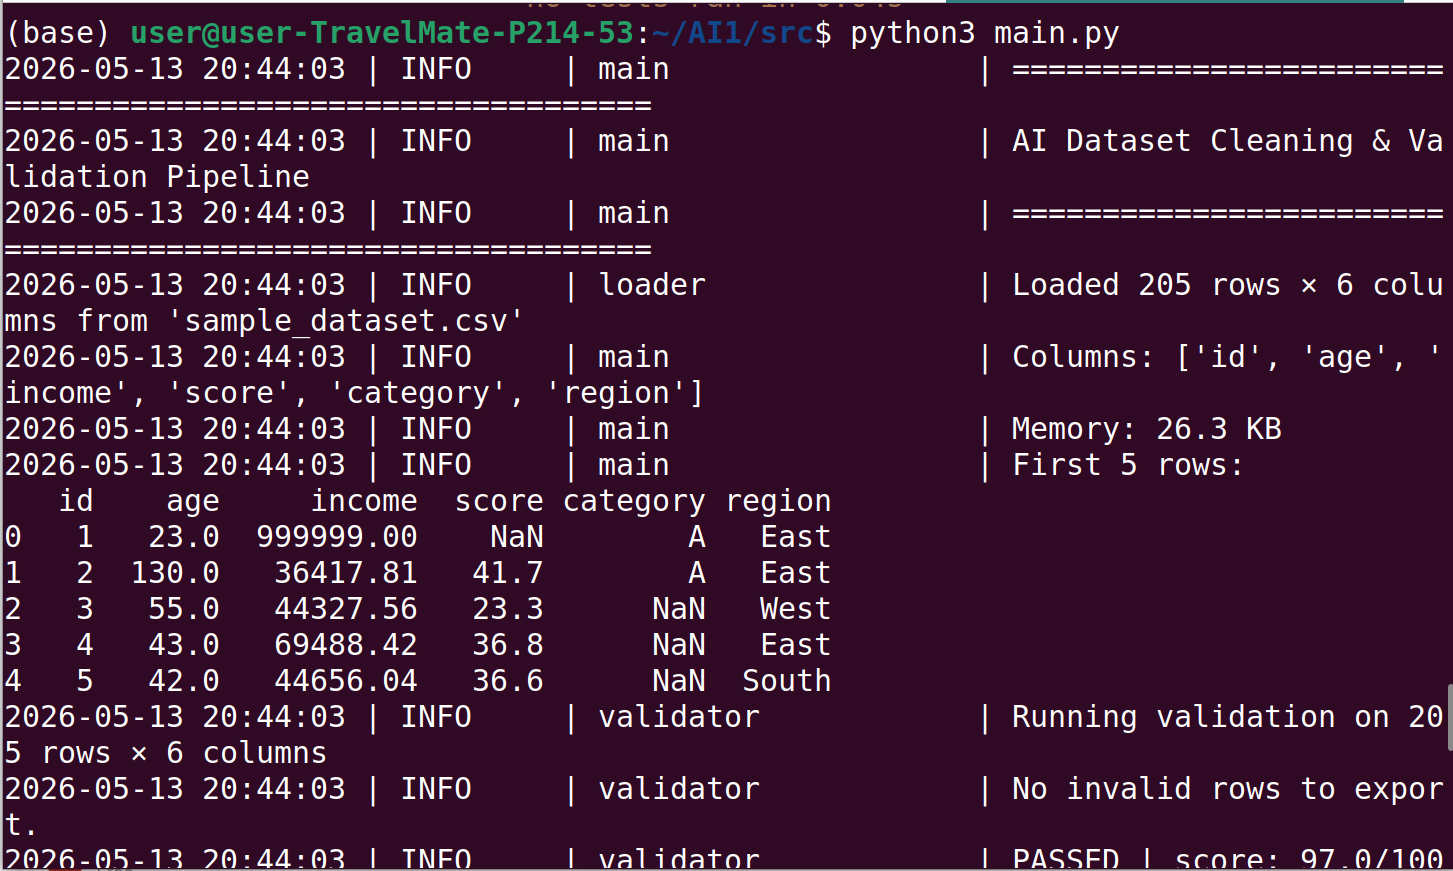
不带参数运行。将在 `data/` 中自动生成一个包含 200 行、注入了质量问题的合成数据集,并对其运行完整管道:
```
python3 src/main.py
```
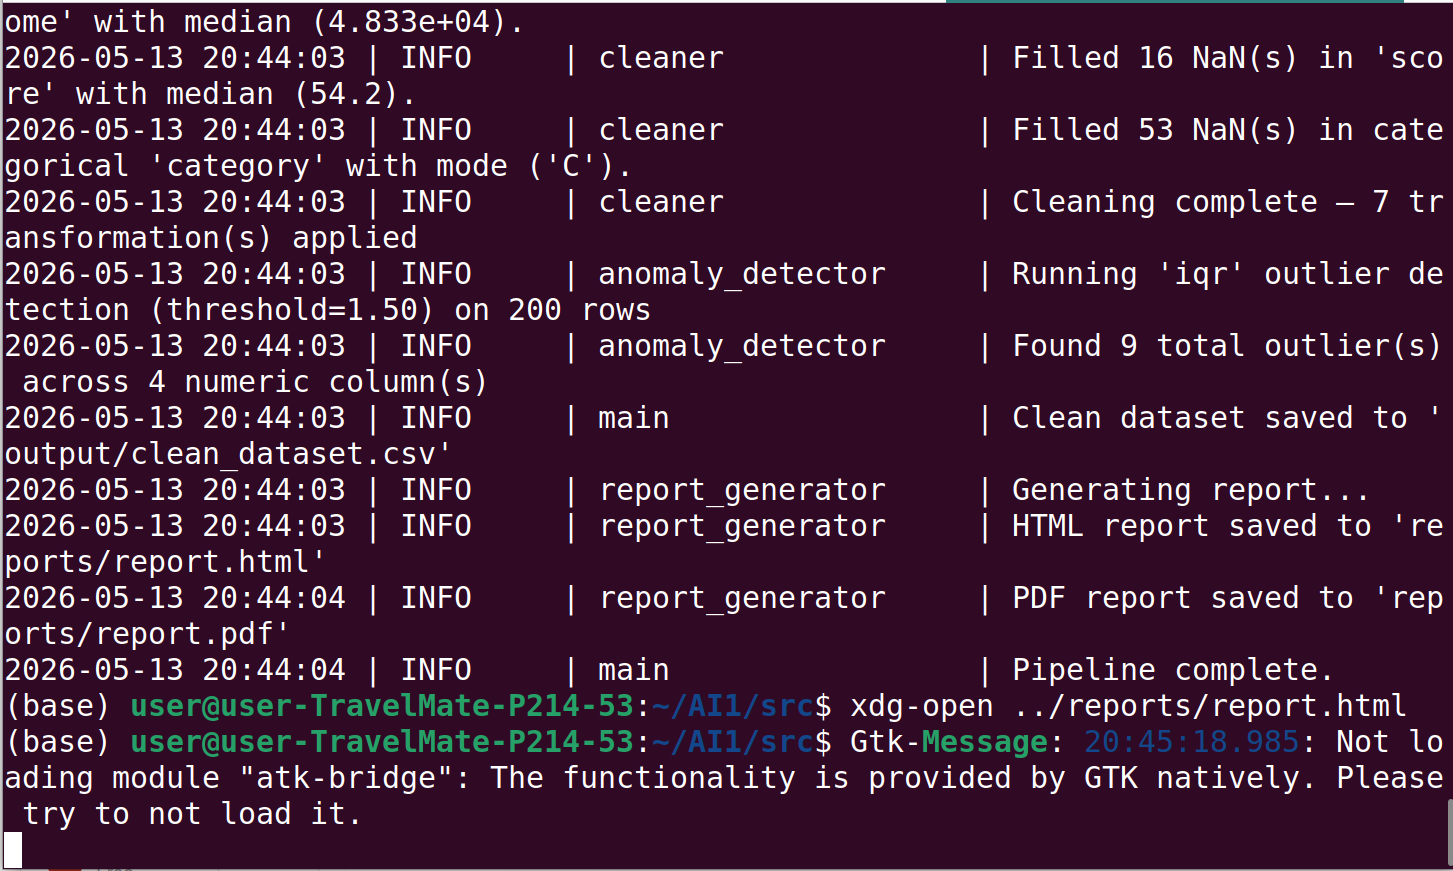
输出:
- `output/clean_dataset.csv` — 清洗后的数据
- `output/invalid_rows.csv` — 未通过验证的行
- `reports/report.html` — 完整的 HTML 质量报告
### CLI 参考
```
usage: main.py [-h] [--input FILE] [--schema FILE] [--output-dir DIR]
[--report-dir DIR] [--anomaly-method {iqr,zscore}]
options:
--input, -i FILE Path to the input CSV file. A synthetic sample is
auto-generated when the file does not exist.
(default: data/sample_dataset.csv)
--schema, -s FILE Path to a YAML schema file that defines per-column
validation rules. Silently skipped when the file
does not exist.
(default: config/schema.yaml)
--output-dir DIR Directory for clean_dataset.csv and
invalid_rows.csv. (default: output)
--report-dir DIR Directory for report.html and optional PDF.
(default: reports)
--anomaly-method {iqr,zscore} Outlier detection algorithm.
(default: iqr)
```
**CLI 示例:**
```
# 使用自定义输入文件和架构运行
python3 src/main.py --input data/my_dataset.csv --schema config/schema.yaml
# 将输出保存到带时间戳的目录中
python3 src/main.py --input data/jan_batch.csv \
--output-dir runs/jan/ \
--report-dir runs/jan/report/
# 使用 Z 分数异常值检测(更适合近正态分布)
python3 src/main.py --input data/transactions.csv --anomaly-method zscore
# 仅运行验证 —— 通过传递不存在的文件来跳过架构
python3 src/main.py --input data/raw.csv --schema /dev/null
# 短标志
python3 src/main.py -i data/raw.csv -s config/schema.yaml
```
### 编程式 API
每个组件都可以独立使用。管道是一组可组合的函数,而不是一个黑盒:
```
from src.loader import load_csv
from src.validator import DataValidator, load_schema_from_yaml
from src.cleaner import DataCleaner
from src.anomaly_detector import AnomalyDetector
from src.drift_detector import DriftDetector
from src.report_generator import ReportGenerator
# 加载
df_raw = load_csv("data/my_dataset.csv")
# 根据 YAML 架构进行验证
schema = load_schema_from_yaml("config/schema.yaml")
validator = DataValidator(schema=schema)
result = validator.run(df_raw, export_invalid_to="output/invalid_rows.csv")
print(f"Quality score: {result.quality_score}/100")
print(f"Missing values: {result.missing_summary}")
print(f"Schema violations: {result.schema_violations}")
# 清理
cleaner = DataCleaner(fill_strategy="median", drop_duplicate=True)
df_clean, log = cleaner.run(df_raw)
# 检测异常
detector = AnomalyDetector(method="iqr", threshold=1.5)
anomaly_report = detector.detect(df_clean)
print(f"Outliers found: {anomaly_report.total_outliers}")
# 与基线比较以检测漂移
drift_detector = DriftDetector(ks_alpha=0.05, mean_shift_threshold=0.5)
drift_report = drift_detector.compare(df_baseline, df_clean)
print(f"Drifted columns: {drift_report.drifted_columns}")
# 生成 HTML 报告(包含可选的漂移部分)
reporter = ReportGenerator(output_dir="reports/")
reporter.generate(
df_raw=df_raw,
df_clean=df_clean,
validation_result=result,
anomaly_report=anomaly_report,
clean_log=log,
drift_report=drift_report, # omit to skip the drift section
)
```
你也可以直接使用关键字参数调用 `run_pipeline()`,仅覆盖所需的选项:
```
from src.main import run_pipeline
df_clean = run_pipeline(
data_file="data/batch_42.csv",
schema_file="config/production_schema.yaml",
output_dir="runs/batch_42/output",
report_dir="runs/batch_42/report",
anomaly_method="zscore",
)
```
### 模式配置
列验证规则位于 `config/schema.yaml`。非工程师可以编辑此文件而无需接触 Python 源代码:
```
schema:
id:
nullable: false # NaN in this column is a hard failure
age:
dtype: float64
nullable: true
min: 0
max: 120 # 130 would be flagged as out-of-range
email:
dtype: object
nullable: false
regex: email # built-in pattern: ^[a-zA-Z0-9._%+\-]+@...
status:
nullable: false
allowed_values: # any value outside this set is a violation
- active
- inactive
phone:
regex: phone # built-in: +1-800-555-0100, (800) 555-0100, etc.
order_date:
regex: date_iso # built-in: YYYY-MM-DD
nullable: false
```
**内置正则表达式模式:**
| 键名 | 匹配示例 |
| :--- | :--- |
| `email` | `user@example.com` |
| `phone` | `+1-800-555-0100`, `(800) 555-0100`, `800.555.0100` |
| `zip_us` | `12345`, `12345-6789` |
| `date_iso` | `2024-01-31` |
也接受原始正则字符串:`regex: "^[A-Z]{2}[0-9]{4}$"`。
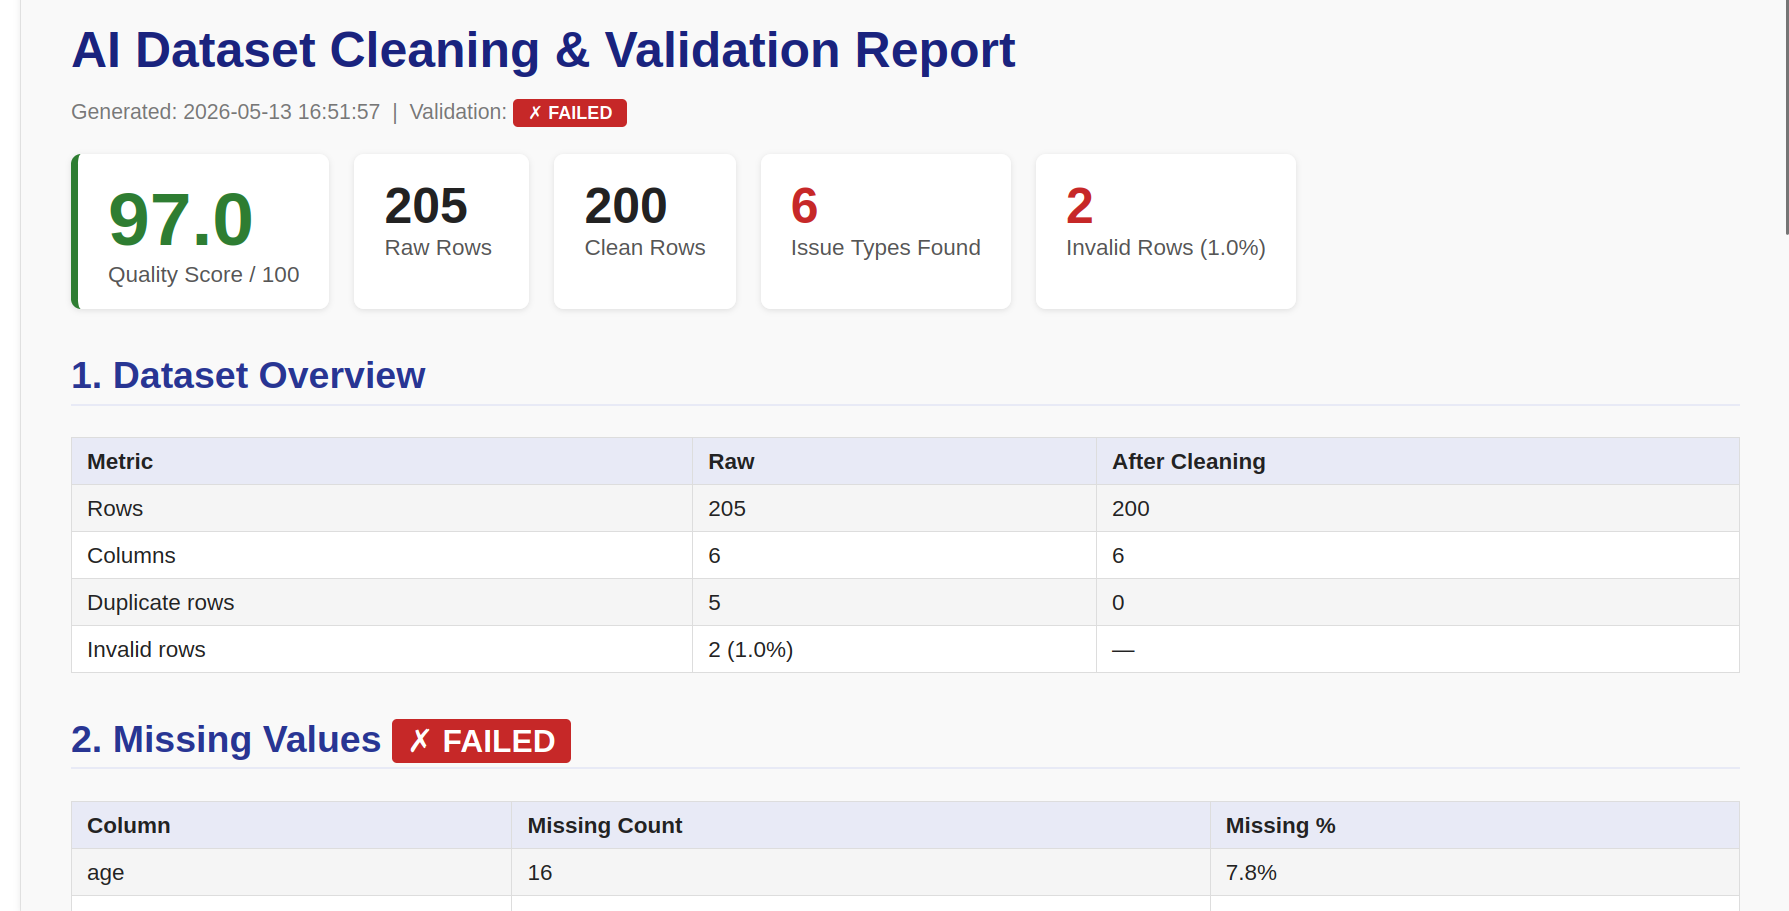
## HTML 报告
HTML 报告在每次管道运行后生成,并保存至 `reports/report.html`。它包含:
| 部分 | 内容 |
| :--- | :--- |
| **质量记分卡** | 颜色编码的 0–100 分、原始/清洗后行数、问题类型数、无效行数 |
| **数据集概览** | 处理前后的行数和列数、重复行数 |
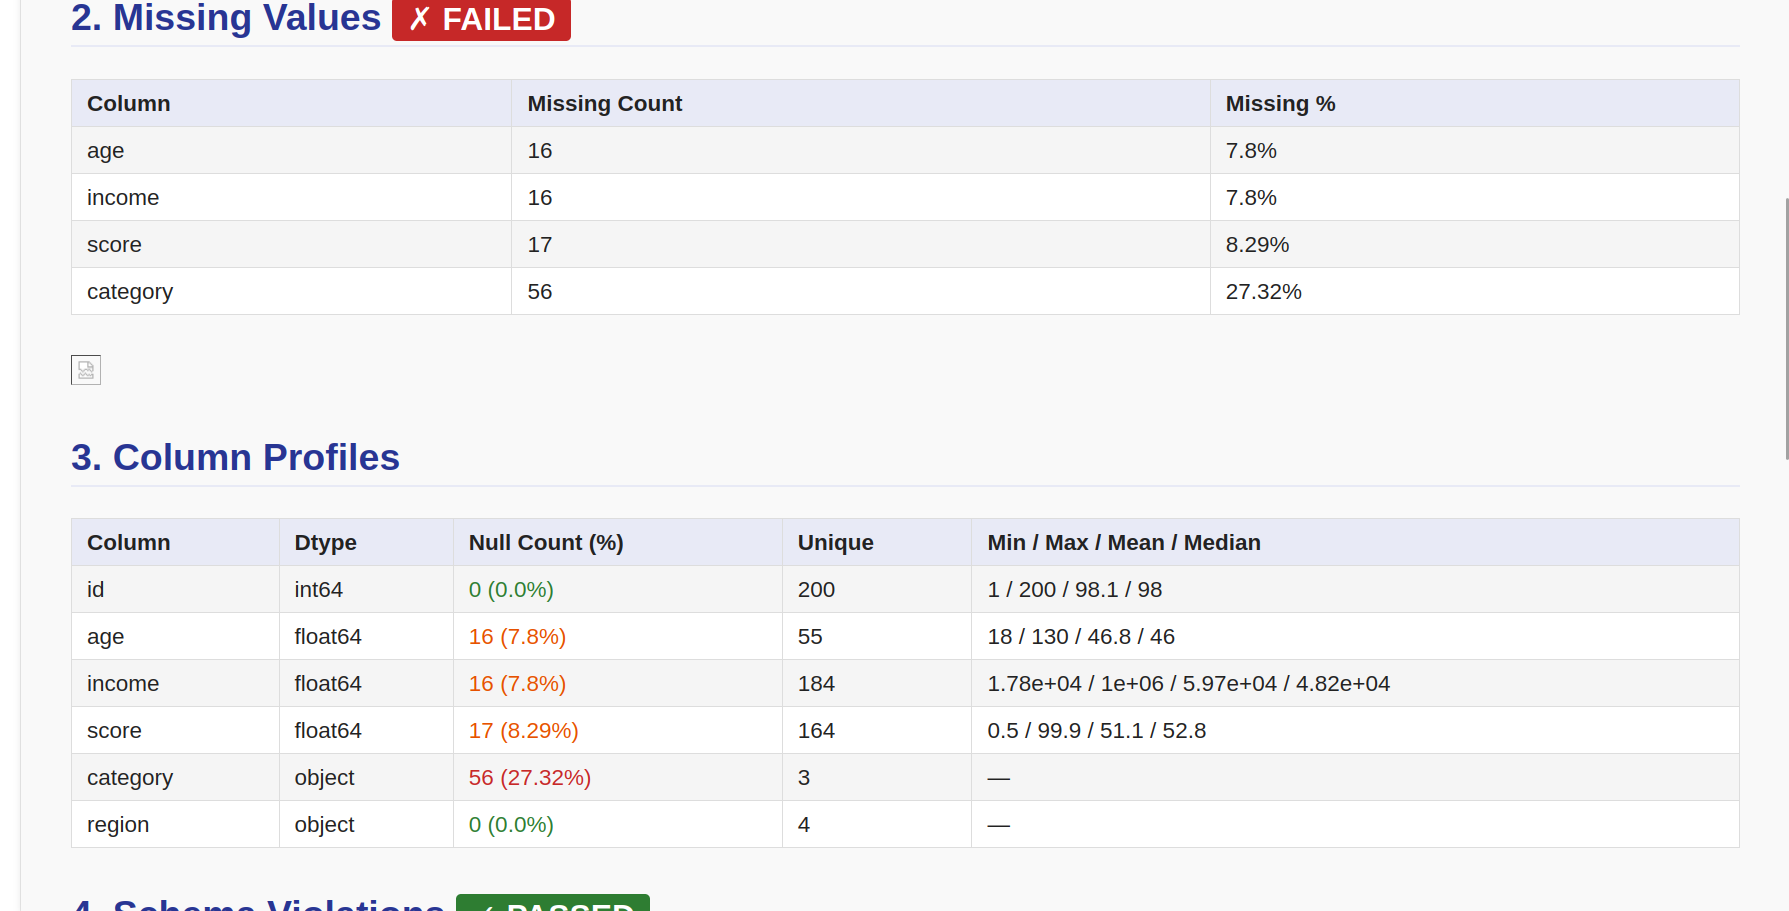
| **缺失值** | 每列的缺失计数和百分比、条形图 |
| **列分析** | 每列的数据类型、空值率、唯一值数量、最小值/最大值/平均值/中位数 |
| **模式违规** | 按列列出的允许值和可空性约束违规 |
| **格式违规** | 正则表达式检查失败及无效值样本 |
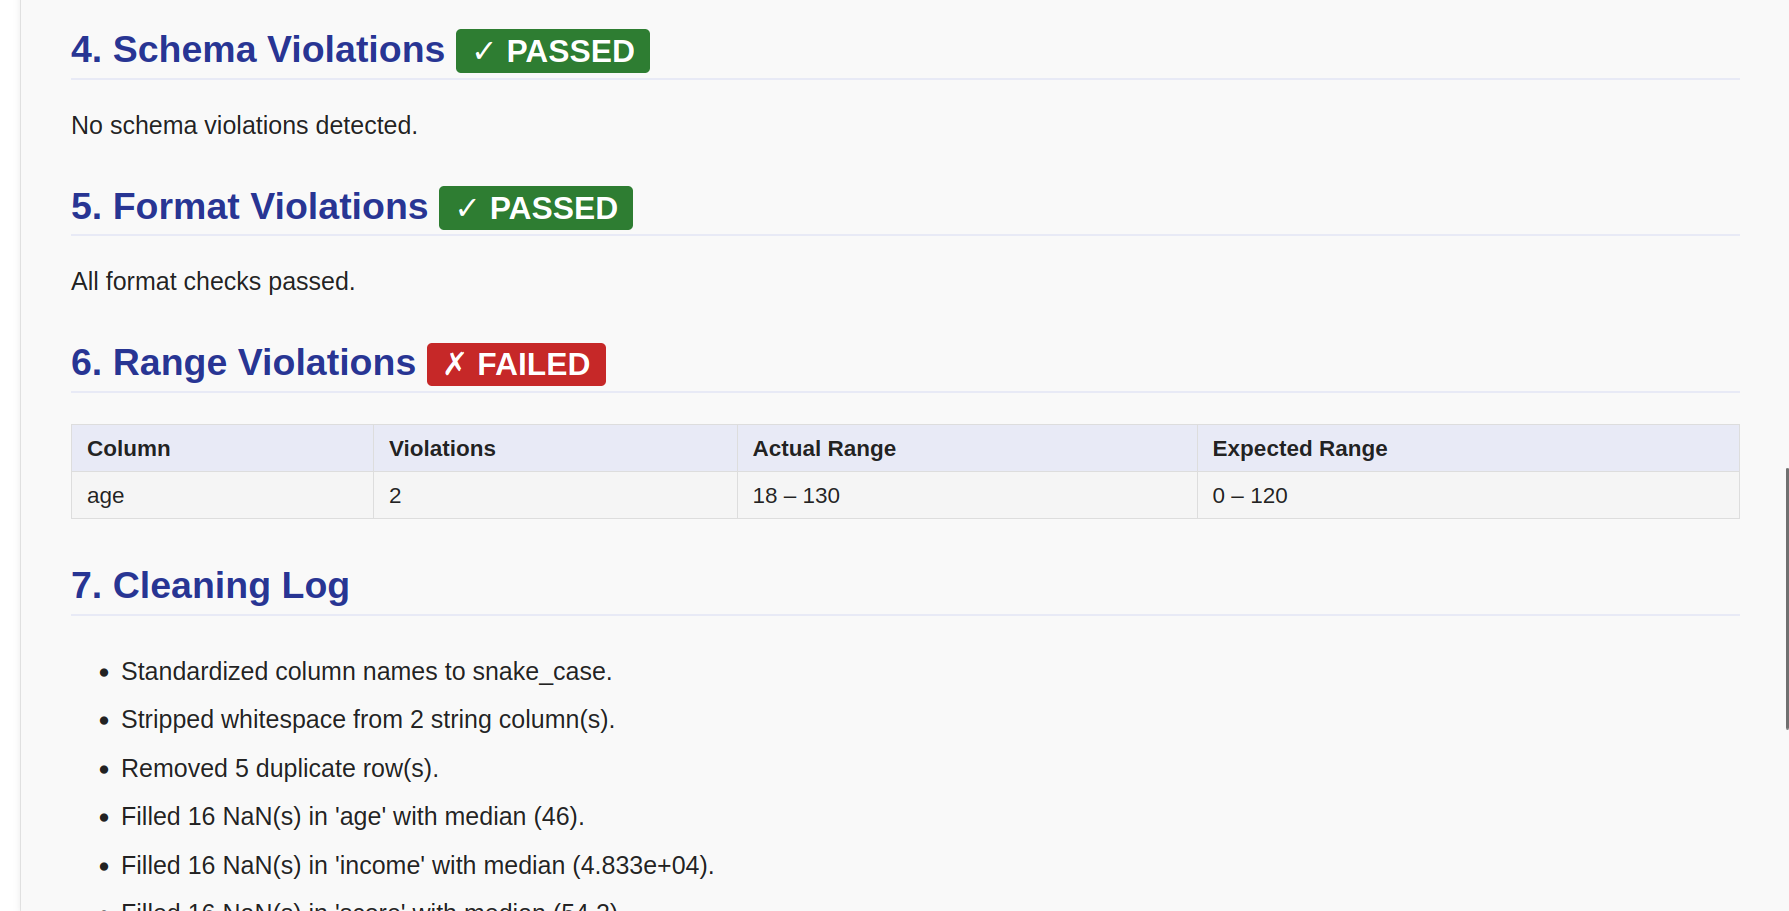
| **范围违规** | 超出范围的数值,显示实际值与期望范围 |
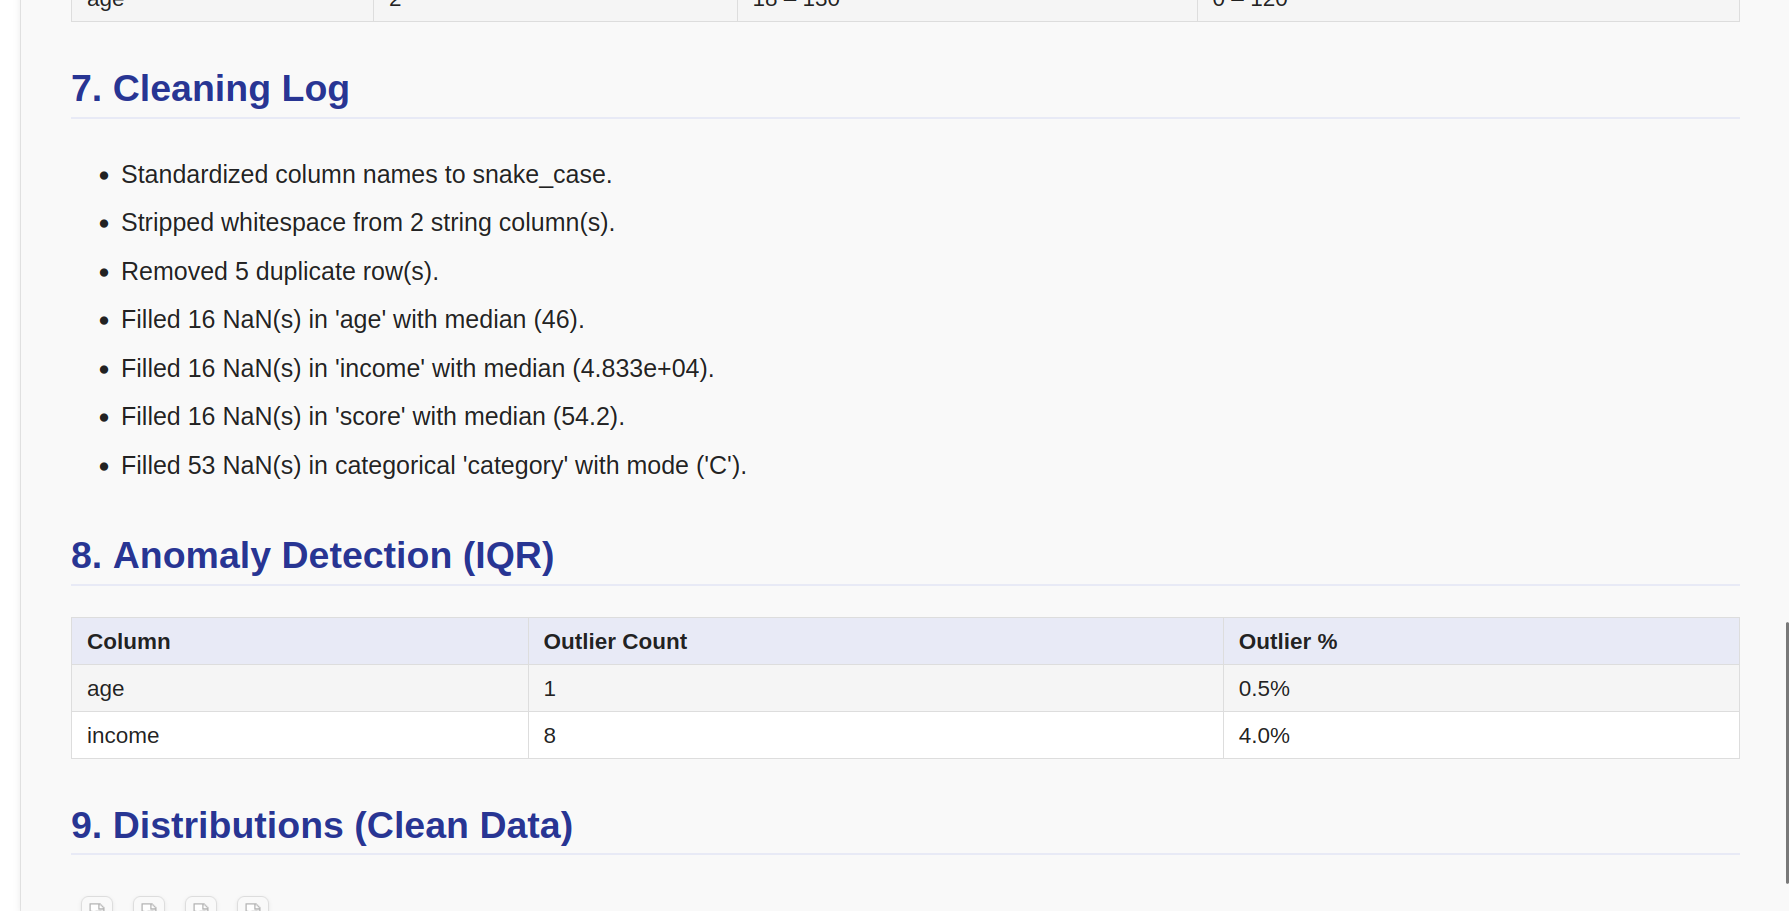
| **清洗日志** | 按顺序应用的所有转换 |
| **异常检测** | 每个数值列的异常值计数和百分比 |
| **分布图** | 清洗后数据集中每个数值列的直方图 + KDE |
| **数据漂移** *(可选)* | 每列的均值偏移、标准差比率、KS 统计量/p 值、漂移标志 |
## 漂移检测
数据漂移是指两个数据集之间特征分布的统计变化——通常是训练集(或已知良好的最后批次)与新的传入批次之间。
在一个分布上训练的模型,当输入分布发生偏移时会悄无声息地退化:没有异常,没有日志错误,只有静默的错误预测。漂移检测能在问题到达用户之前将其揭示。
### 工作原理
对于每个共享的数值列,`DriftDetector.compare(baseline, incoming)` 计算三个统计量:
```
mean_shift = (incoming_mean − baseline_mean) / baseline_std
```
归一化均值偏移:均值移动了多少个标准差。`|mean_shift| > 0.5` 的值通常显著。
```
std_ratio = incoming_std / baseline_std
```
展宽变化:超出 `(1/threshold, threshold)` 的值表明分布变得更紧密或更分散。
```
KS statistic, p-value = ks_2samp(baseline_column, incoming_column)
```
Kolmogorov–Smirnov 检验是无分布的——它不假设正态性。低于 `ks_alpha`(默认 `0.05`)的 p 值会将该列标记为漂移。
当 `scipy` 未安装时,管道会自动退回到仅使用均值偏移和标准差比率阈值。
### 示例
```
from src.drift_detector import DriftDetector
detector = DriftDetector(
ks_alpha=0.05, # KS p-value threshold
mean_shift_threshold=0.5, # σ units (fallback only)
std_ratio_threshold=2.0, # ratio bounds (fallback only)
)
report = detector.compare(df_train, df_production)
print(f"Overall drift score: {report.overall_drift_score}/100")
print(f"Drifted columns: {report.drifted_columns}")
for col, result in report.column_results.items():
print(f" {col}: mean_shift={result.mean_shift}, ks_p={result.ks_p_value}, drifted={result.drifted}")
```
```
Overall drift score: 66.7/100
Drifted columns: ['income', 'age']
age: mean_shift=0.12, ks_p=0.4821, drifted=False
income: mean_shift=3.81, ks_p=0.0001, drifted=True
score: mean_shift=-0.03, ks_p=0.9133, drifted=False
```
## 测试
测试套件使用 `pytest` 并配合 `pytest-cov` 生成覆盖率报告。
```
# 运行所有测试
pytest
# 运行并显示覆盖率(显示缺失的行)
pytest --cov=src --cov-report=term-missing
# 运行特定的测试模块
pytest tests/test_validator.py -v
# 运行匹配关键字的测试
pytest -k "drift" -v
```
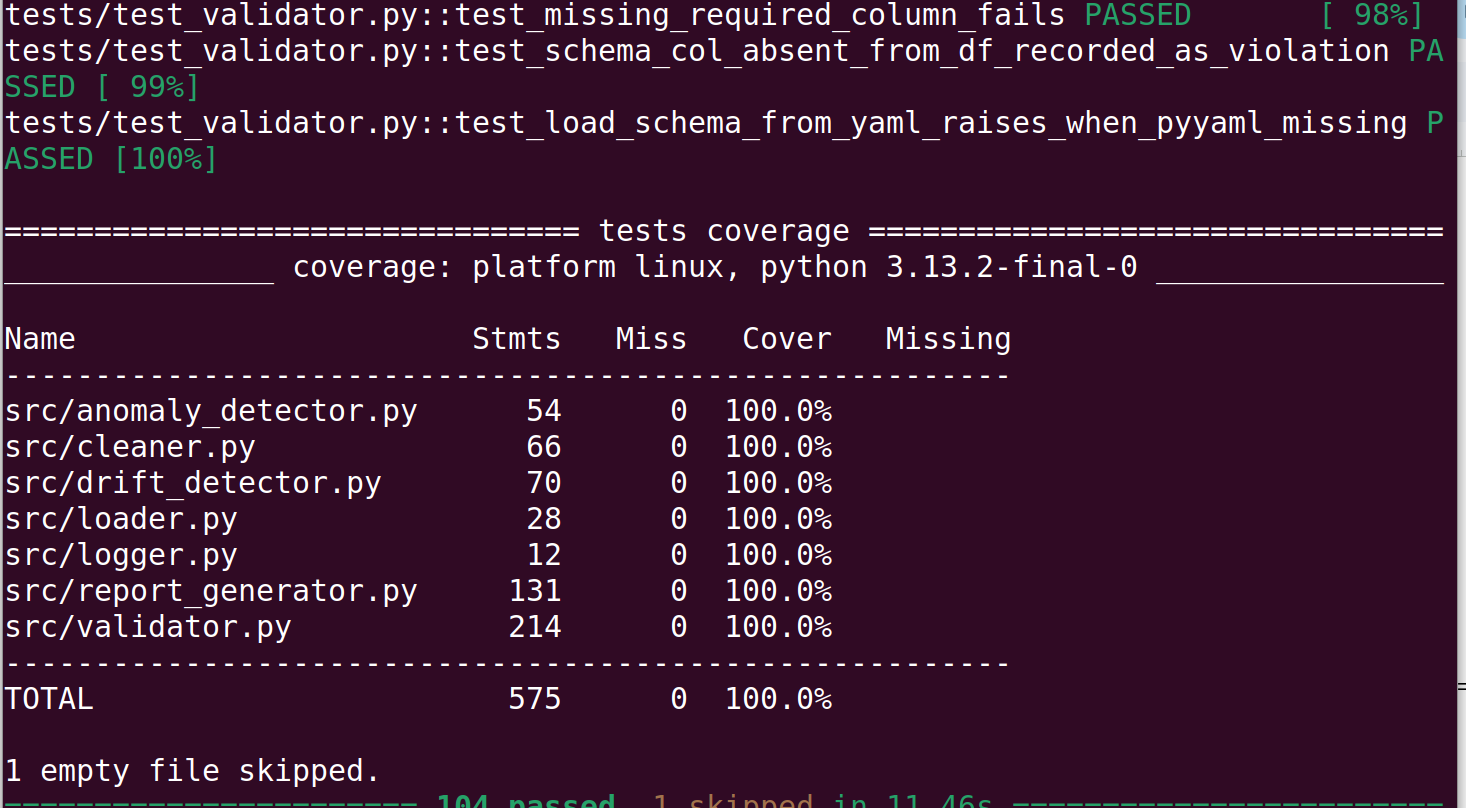
**覆盖率摘要(当前):**
```
Name Stmts Miss Cover
----------------------------------------------
src/anomaly_detector.py 54 0 100%
src/cleaner.py 66 0 100%
src/drift_detector.py 70 0 100%
src/loader.py 28 0 100%
src/logger.py 12 0 100%
src/report_generator.py 131 0 100%
src/validator.py 214 0 100%
----------------------------------------------
TOTAL 575 0 100%
```
**测试模块:**
| 模块 | 测试数 | 覆盖内容 |
| :--- | :--- | :--- |
| `test_loader.py` | 11 | CSV/JSON/Excel 加载, `get_basic_info`, 错误路径 |
| `test_validator.py` | 37 | 模式、分析、正则表达式、质量评分、YAML 加载、导出 |
| `test_cleaner.py` | 16 | 所有填充策略、去重、列标准化、不可变性 |
| `test_anomaly_detector.py` | 12 | IQR, Z-score, `remove_outliers`, 边界情况 |
| `test_drift_detector.py` | 11 | KS 检验, 无 scipy 降级, 提前返回, 分数计算 |
| `test_report_generator.py` | 18 | HTML 部分, 图表, 漂移渲染, PDF 异常处理 |
## CI 管道
每次向 `main` 分支推送或创建拉取请求时,都会运行定义在 `.github/workflows/ci.yml` 中的 5 阶段质量门禁:
```
┌──────────────────────────┐
│ 1. Syntax check │ py_compile — catches parse errors before anything runs
├──────────────────────────┤
│ 2. FutureWarning check │ imports all modules with -W error::FutureWarning
│ │ ensures pandas 3.x compatibility
├──────────────────────────┤
│ 3. Type checking │ mypy src/ — enforces type annotations
├──────────────────────────┤
│ 4. Linting │ ruff check — E, F, I, B, UP rules at line-length 100
├──────────────────────────┤
│ 5. Test suite │ pytest -q with MPLBACKEND=Agg for headless chart generation
└──────────────────────────┘
```
CI 文件:`.github/workflows/ci.yml`。所有阶段必须通过后才能合并 PR。
## 路线图
按大致优先顺序排列的计划增强功能:
- [ ] **增量验证** —— 在仅追加的数据集中只验证新行,无需重新扫描完整历史
- [ ] **基于机器学习的异常检测** —— Isolation Forest 和 Local Outlier Factor (scikit-learn 已经是依赖项)
- [ ] **流式支持** —— 通过 `pd.read_csv(chunksize=...)` 分块处理大文件,无需将完整数据集加载到内存
- [ ] **Great Expectations 集成** —— 将 `ValidationResult` 导出为原生 GE `ExpectationSuite`,以兼容现有的 GE 检查点
- [ ] **可插拔加载器** —— 通过加载器注册表支持 Parquet, Avro, Delta Lake 和数据库连接器
- [ ] **模式推断** —— 根据干净数据的样本自动建议一个模式 YAML 文件
- [ ] **漂移警报** —— 当 `overall_drift_score` 超过可配置阈值时,通过 webhook 或电子邮件发送通知
- [ ] **交互式报告** —— 用直接嵌入 HTML 的 Plotly/Altair 图表替换静态 PNG
- [ ] **REST API** —— FastAPI 封装,以便将该管道作为微服务从编排器(Airflow, Prefect, Dagster)调用
- [ ] **Docker 镜像** —— 预构建环境的单容器部署
## 贡献指南
1. Fork 仓库并创建一个特性分支:`git checkout -b feature/your-feature`
2. 安装开发依赖:`pip install -r requirements-dev.txt`
3. 进行更改,添加测试,确保覆盖率不下降
4. 在本地运行完整的质量门禁:
```
ruff check .
mypy src/
pytest --cov=src --cov-report=term-missing
```
5. 创建一个拉取请求 —— CI 会在推送时自动运行
## 管道输出
## 测试覆盖率
## HTML 报告
## 
## React 前端
一个生产级的 React + Vite 前端位于 `frontend/` 目录中。它通过 `VITE_API_BASE_URL` 连接到 FastAPI 后端,并支持拖放上传、实时进度、交互式分析仪表板、Recharts 可视化和 Toast 通知。
### 同时运行前端 + 后端
**终端 1 — FastAPI 后端**
```
# 从项目根目录开始
pip install -r requirements.txt
cd src
uvicorn main_api:app --reload --host 127.0.0.1 --port 8000
```
**终端 2 — React 开发服务器**
```
cd frontend
cp .env.example .env # VITE_API_BASE_URL=http://127.0.0.1:8000
npm install
npm run dev # → http://localhost:3000
```
打开 `http://localhost:3000`。当后端可达时,导航栏会显示 **API 在线**(绿色脉冲)。
### 前端结构
```
frontend/
├── src/
│ ├── services/ # Axios API layer (api.js)
│ ├── context/ # Toast notifications
│ ├── hooks/ # useUpload · useAnalysis · useToast
│ ├── layouts/ # MainLayout (Navbar + Footer + Outlet)
│ ├── components/
│ │ ├── ui/ # Button · Card · Badge · Spinner · ProgressBar · EmptyState · ErrorBoundary
│ │ ├── layout/ # Navbar · Footer
│ │ ├── charts/ # QualityGauge · MissingValuesChart · OutlierChart
│ │ ├── dashboard/ # OverviewCards · ProfilesTable · MissingSummary · CleaningLog · ReportActions
│ │ └── upload/ # DropZone
│ ├── pages/
│ │ ├── LandingPage.jsx
│ │ ├── UploadPage.jsx
│ │ ├── DashboardPage.jsx
│ │ └── NotFoundPage.jsx
│ └── App.jsx # BrowserRouter + routes
├── .env.example
├── vite.config.js
└── tailwind.config.js
```
### 生产构建
```
cd frontend
npm run build # outputs to frontend/dist/
npm run preview # preview the production build locally
```
### 环境变量
| 变量 | 默认值 | 描述 |
| :--- | :--- | :--- |
| `VITE_API_BASE_URL` | `http://127.0.0.1:8000` | FastAPI 后端基础 URL |
## 许可证
MIT 许可证。详情参见 [LICENSE](LICENSE)。
标签:AI数据集清理, Apex, GitHub Actions, HTML报告, ML数据工作流, ML管道, mypy, NumPy, OSV, PDF报告, pytest, Python, Render, SciPy, Swagger, Vercel, 人工智能, 安全分析, 异常检测, 数据工程, 数据清洗, 数据科学, 数据质量, 数据质量管道, 数据验证, 无后门, 机器学习, 模式验证, 漂移分析, 用户模式Hook绕过, 自动化报告, 自动化数据验证, 自动笔记, 资源验证, 逆向工具