microsoft/flint-chart
GitHub: microsoft/flint-chart
Flint 是一种面向 AI agent 的可视化中间语言,通过简单且可人工编辑的语义化图表规格自动编译为多种前端图表库的原生配置。
Stars: 1675 | Forks: 79
# Flint:面向 AI 时代的可视化语言
[](https://www.npmjs.com/package/flint-chart)
[](https://www.npmjs.com/package/flint-chart-mcp)
[](https://github.com/microsoft/flint-chart/actions/workflows/ci.yml)
[](LICENSE)
**请访问:** [**Flint 项目站点**](https://microsoft.github.io/flint-chart/) | [**MCP Server 指南**](https://microsoft.github.io/flint-chart/#/mcp)
Flint 是一种可视化中间语言,它允许 **AI agent 通过简单、易于人工编辑的图表规格,创建富有表现力且精美的可视化效果**。
Flint 编译器不再要求 agent 或开发者去调整诸如比例尺、坐标轴、间距、标签和布局等冗长的图表配置细节,而是直接从数据、语义类型、图表类型和编码中推导出优化的图表设置。其结果是一个紧凑的图表规格:agent 可以可靠地生成它,人们可以直接编辑它,并且多个后端可以将其渲染为原生的
[Vega-Lite](https://vega.github.io/vega-lite/)、
[ECharts](https://echarts.apache.org/) 或
[Chart.js](https://www.chartjs.org/) 规格。
此代码库包含两个主要组件:
- **`flint-chart`**:一个 JavaScript/TypeScript 库,可将相同的 Flint 输入编译为 Vega-Lite、ECharts 或 Chart.js 规格。
- **`flint-chart-mcp`**:一个 MCP server,可让 agent 直接在聊天或编码环境中创建、验证和渲染图表。
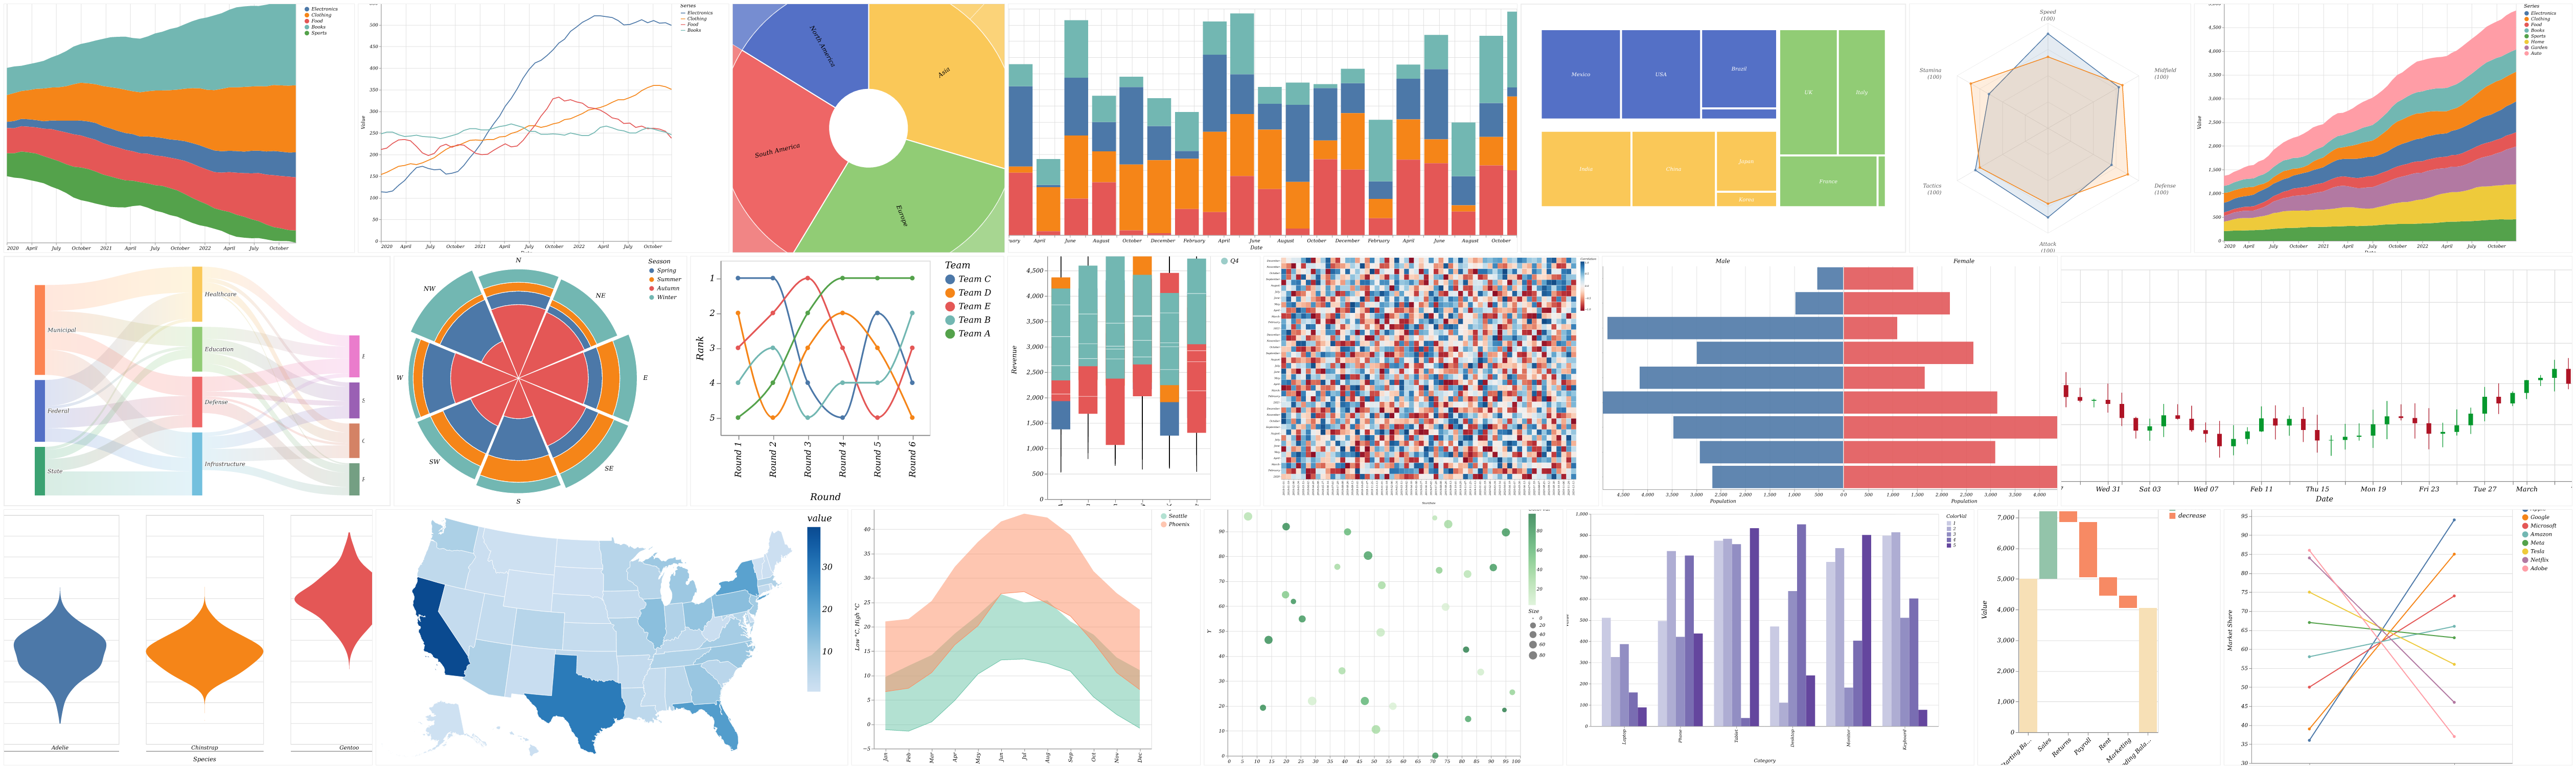
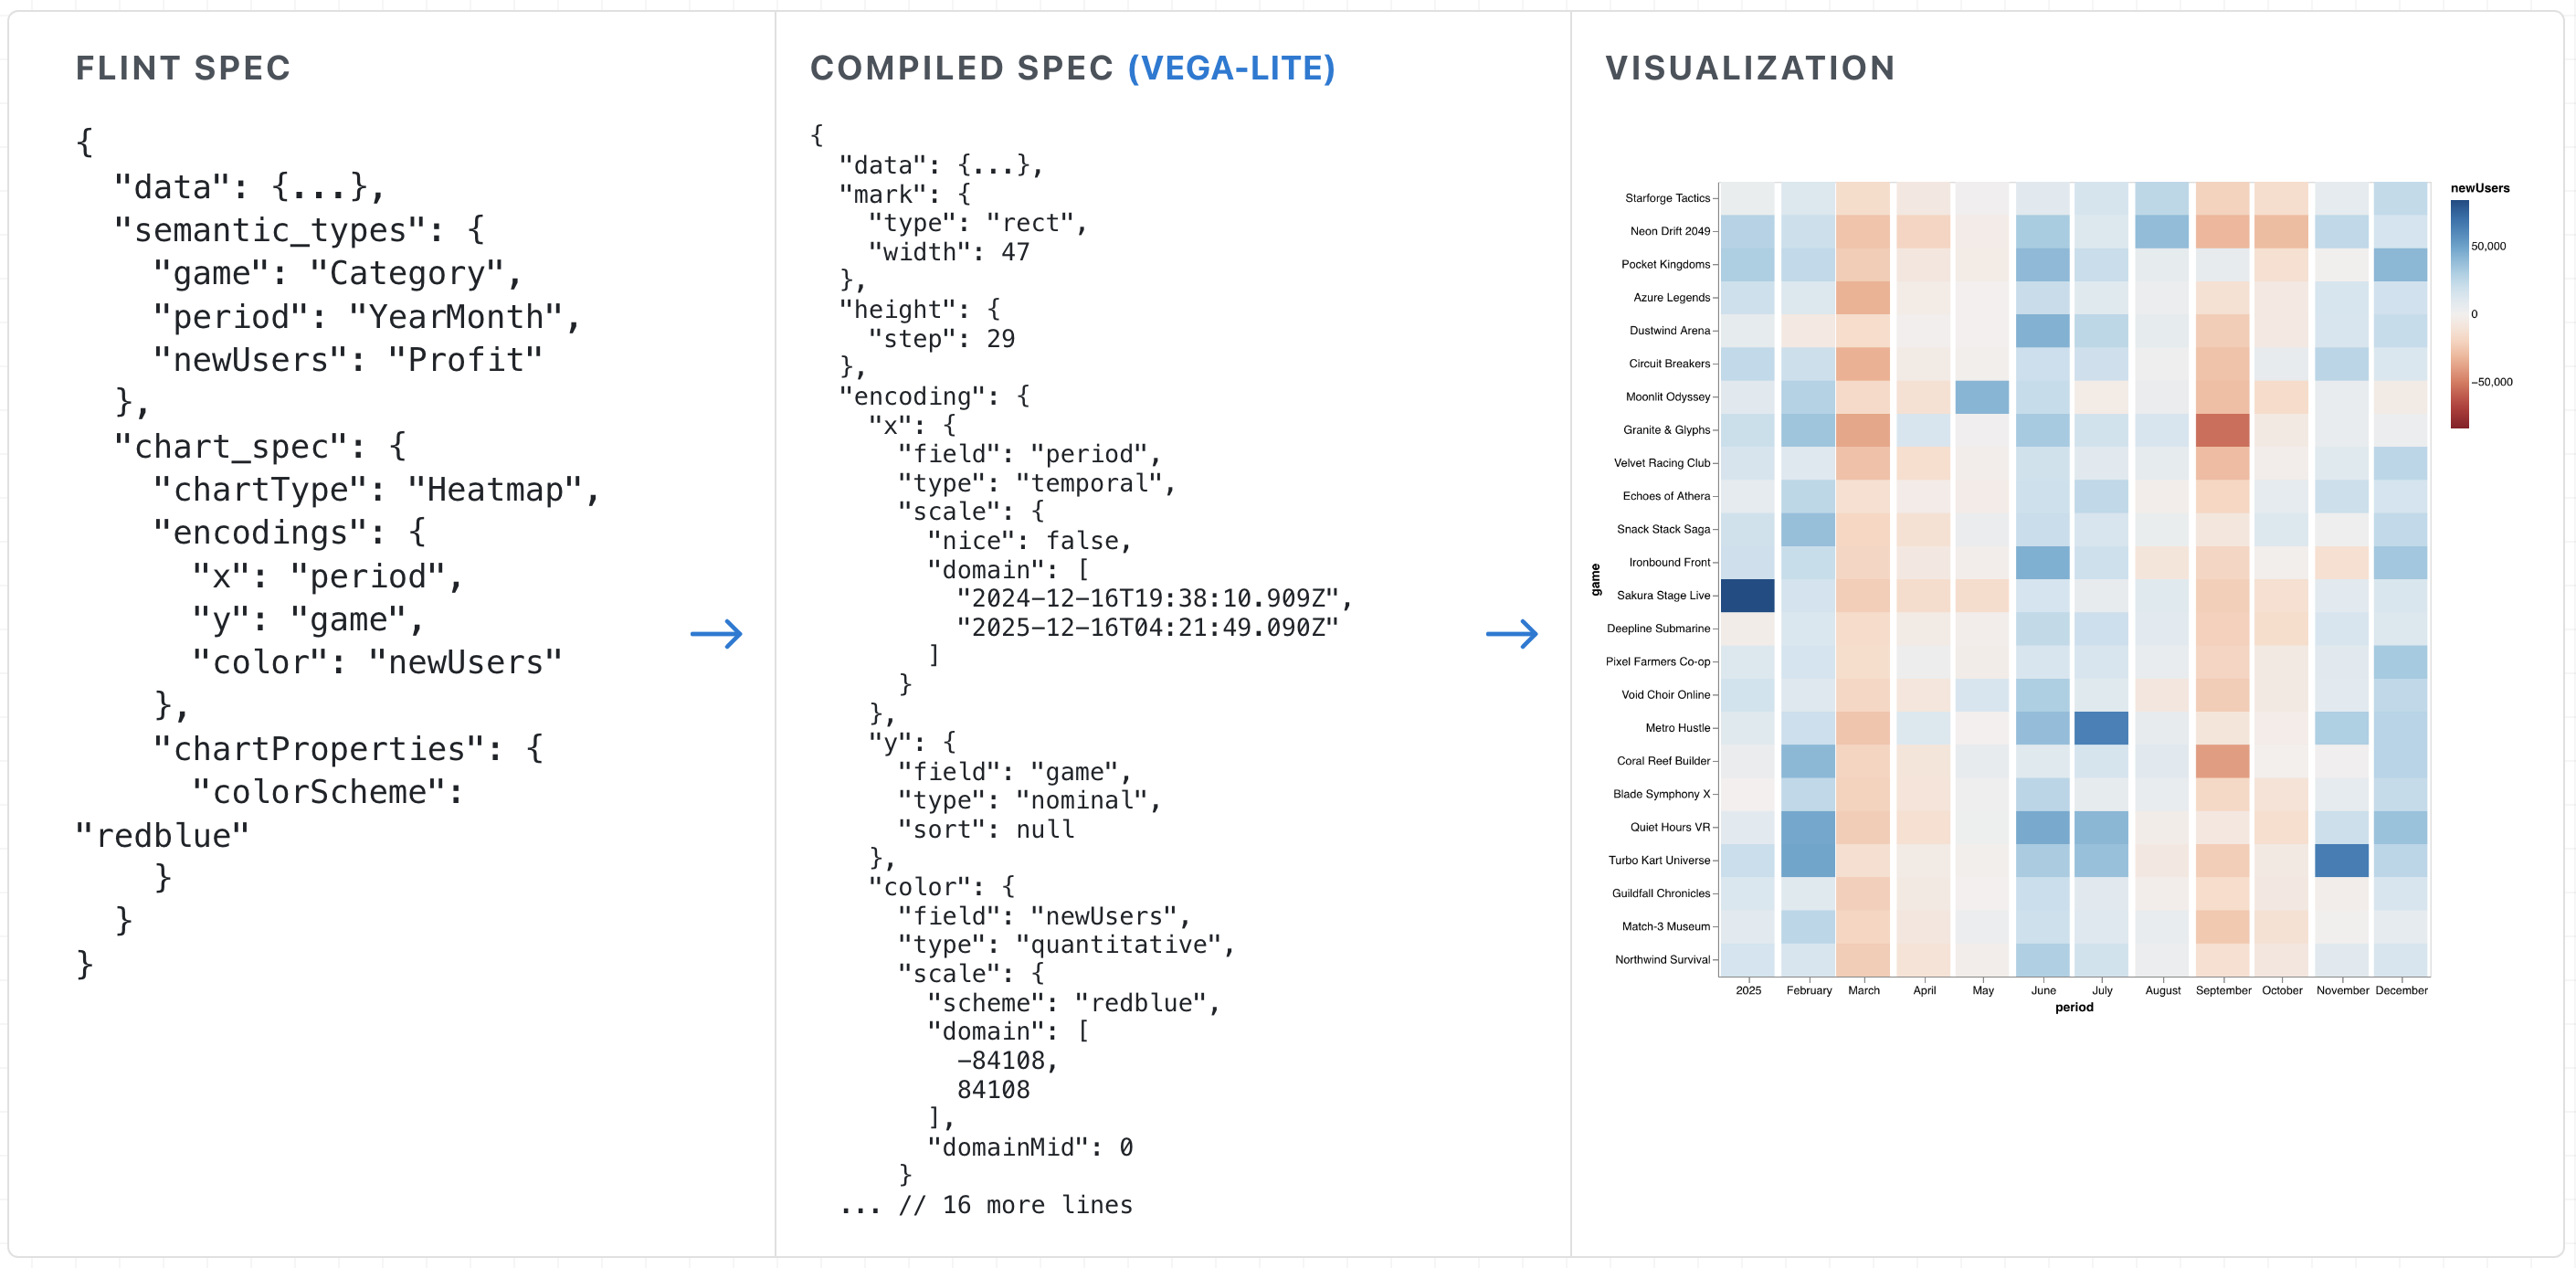
Flint turns compact chart specs into backend-native specs and rendered visualizations.
Python 包:即将发布。当前的 Python 移植版本仅为本代码库中的源码预览版。
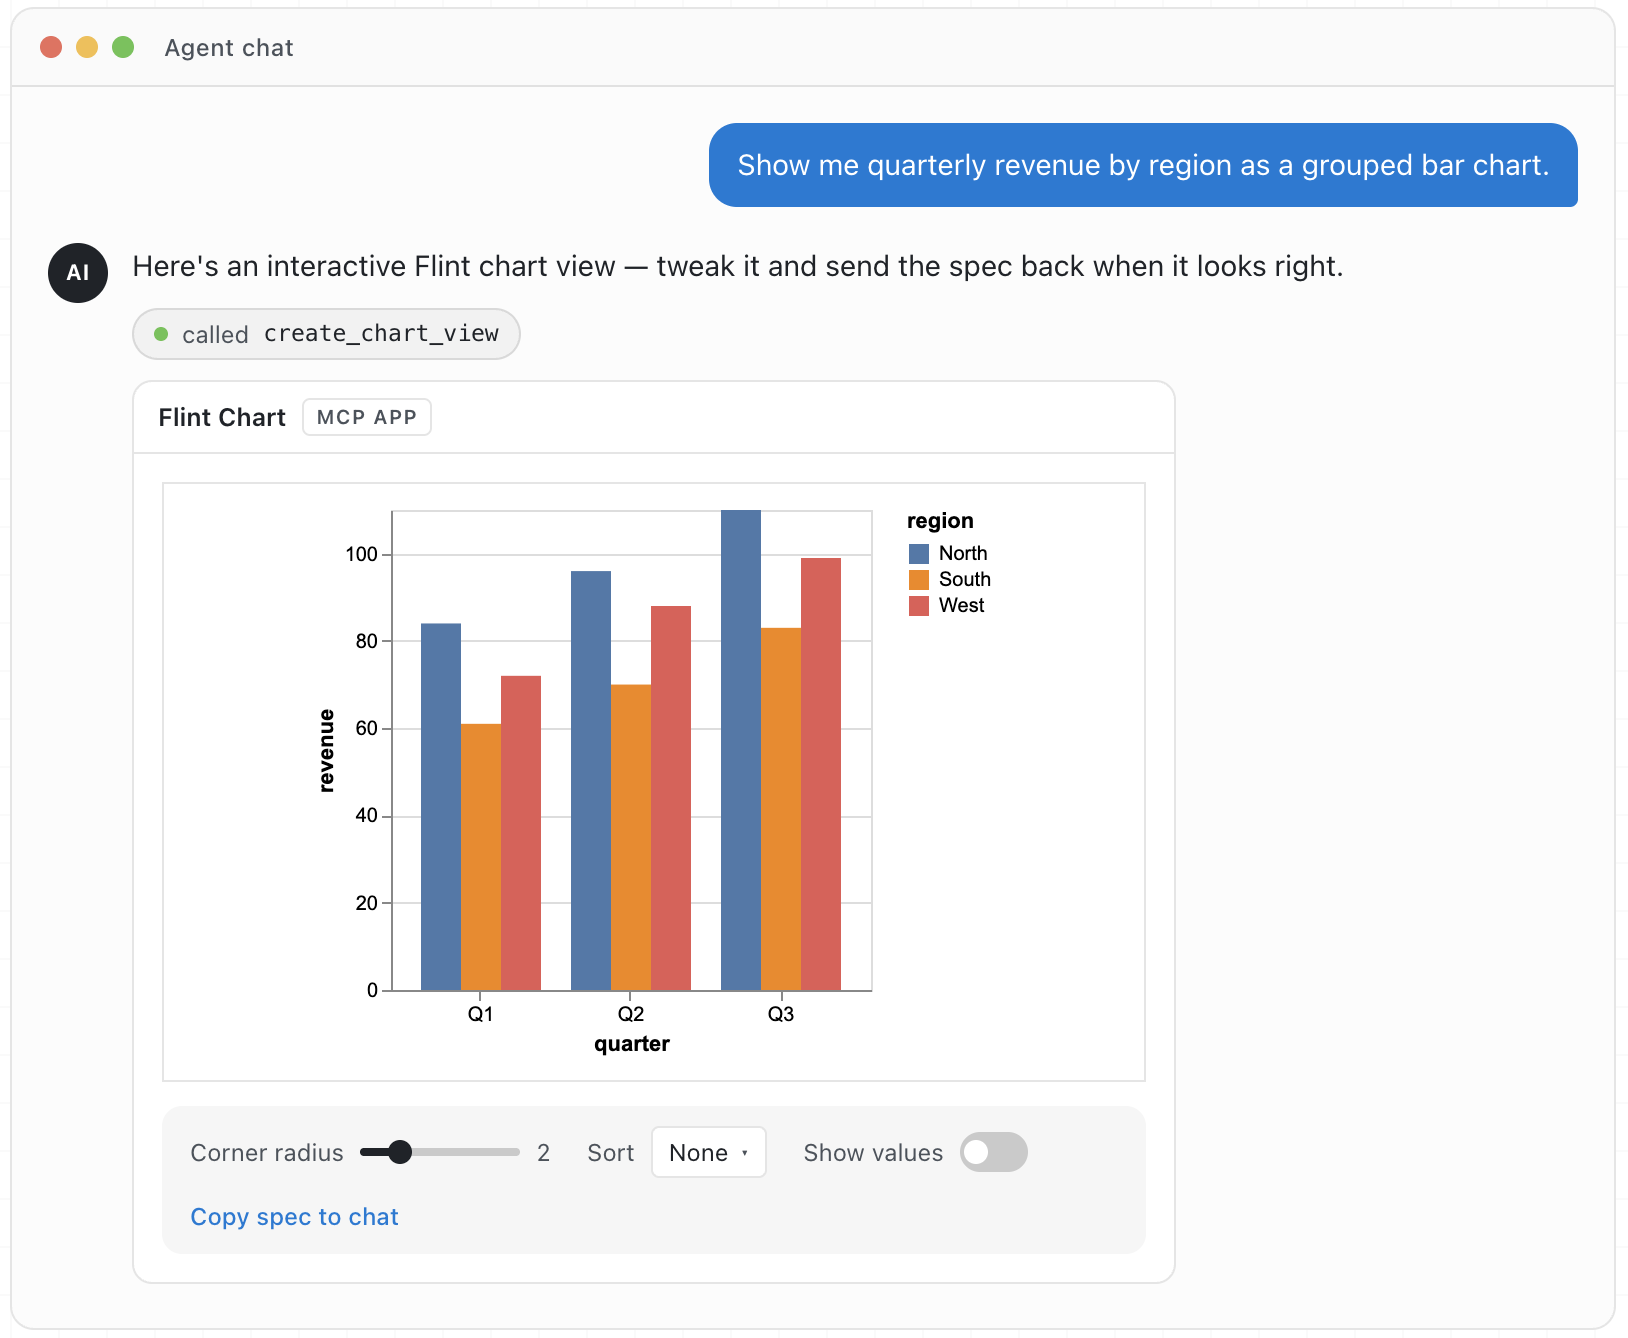
## 将 Flint 作为库使用 每个后端都接受相同的 `ChartAssemblyInput` 并返回目标库的原生 spec 对象。 ``` import { assembleVegaLite } from 'flint-chart'; const spec = assembleVegaLite({ data: { values: myData }, semantic_types: { weight: 'Quantity', mpg: 'Quantity', origin: 'Country' }, chart_spec: { chartType: 'Scatter Plot', encodings: { x: { field: 'weight' }, y: { field: 'mpg' }, color: { field: 'origin' } }, baseSize: { width: 400, height: 300 }, }, }); // → a ready-to-render Vega-Lite spec ``` 无需更改输入结构即可切换后端: ``` import { assembleECharts, assembleChartjs } from 'flint-chart'; const echartsOption = assembleECharts(input); const chartjsConfig = assembleChartjs(input); ``` 请参阅 [API 参考](docs/api-reference.md)、[后端参考](docs/reference-vegalite.md)和[在线编辑器](https://microsoft.github.io/flint-chart/#/editor)以获取更多库示例。 ## 将 Flint 作为 MCP Server 使用 当你希望 agent 在问题发起的同一对话中创建图表时,请将 `flint-chart-mcp` 安装为 [Model Context Protocol](https://modelcontextprotocol.io/) server。它可以打开交互式图表视图、返回静态 PNG/SVG 输出,或者生成后端原生的图表 spec。 要进行设置,请从 [Flint MCP 项目页面](https://microsoft.github.io/flint-chart/#/mcp)开始。其中包含客户端配置、使用示例以及深入参考资料的链接。
标签:数据可视化, 自动化攻击