tyceerickson/ai-soc-pipeline
GitHub: tyceerickson/ai-soc-pipeline
一个基于真实互联网蜜罐攻击数据的全栈 AI 驱动 SOC 管线,集成 Wazuh SIEM、威胁情报富化与本地大模型分析,提供实时安全仪表盘。
Stars: 0 | Forks: 0
# AI 驱动的 SOC Pipeline
**CMU MSISPM 作品集 — 项目 4**
Tyce Erickson · 2026 年 5 月
一个基于真实互联网攻击数据构建的全栈、AI 驱动的安全运营中心(SOC)pipeline。三个暴露在公共互联网上的蜜罐收集跨 SSH、Web 和恶意软件捕获向量的实时攻击流量。数据通过 Wazuh SIEM 处理,结合地理定位和 VirusTotal 威胁情报进行丰富,并由本地托管的大语言模型进行分析。自定义实时仪表盘提供跨三个蜜罐源的 17 个综合威胁情报面板,目前已上线并实时收集攻击数据。
**这不是模拟。此数据集中的每个告警都来自真实的攻击者。**
## 🎥 实时演示
基于真实蜜罐数据的仪表盘演示,包括攻击时间轴和地理地图、行为僵尸网络指纹识别、经 VirusTotal 验证的 WannaCry 恶意软件捕获、跨蜜罐威胁行为者关联以及按需 AI 威胁分析。
:5000
```
三台机器通过 Tailscale mesh VPN 连接。仪表盘**不可**从公共互联网访问。凭证通过环境变量提供,从不存储在源代码中。
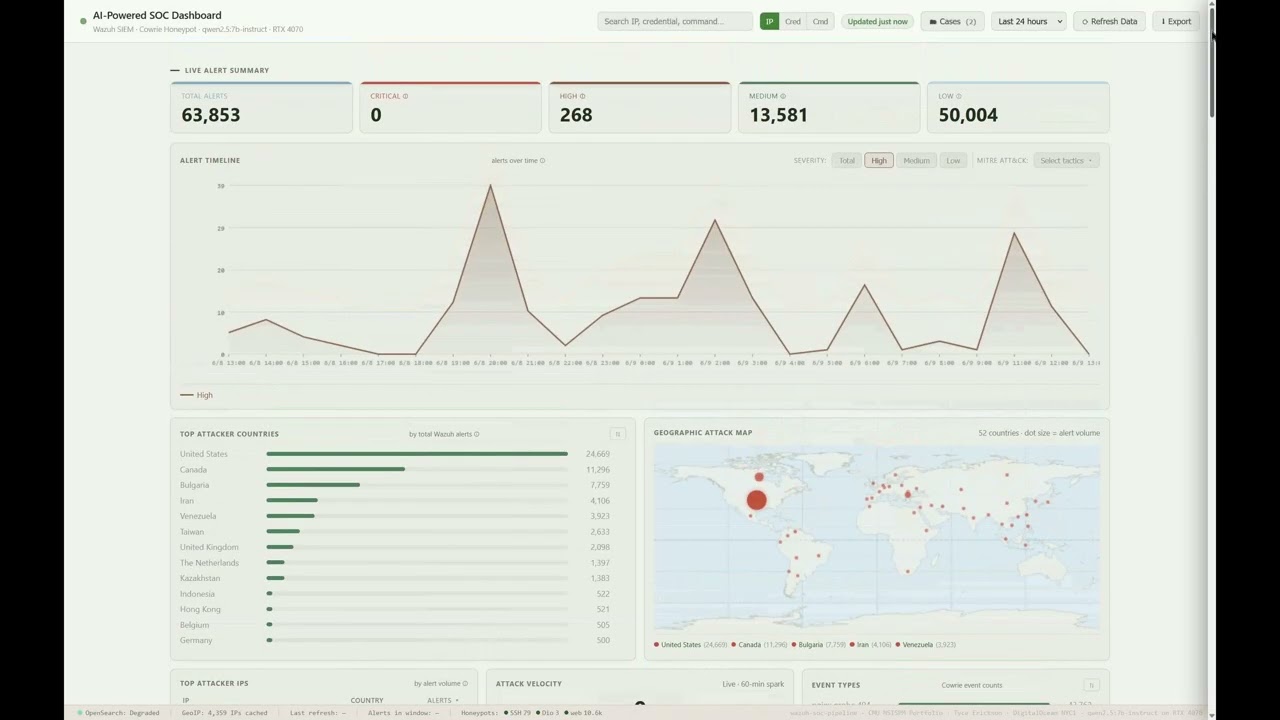
## 仪表盘
自定义 Flask 仪表盘提供跨三个部分的 **17 个实时情报面板**。所有面板都由一个全局时间范围选择器(1h / 6h / 24h / 7d / 30d / 90d)驱动,因此每个视图都保持一致,并在威胁行为者面板上提供专用的“所有时间”排名切换。
### Cowrie SSH 蜜罐
| 面板 | 描述 |
|-------|-------------|
| 告警时间轴 | 带有严重程度和 MITRE ATT&CK 覆盖层的时间序列 |
| 地理攻击地图 | 带有按数据量缩放的攻击点的 Natural Earth 世界地图 |
| 攻击链漏斗 | Kill-chain 流失:连接 → KEX → 登录 → 命令 → 下载 |
| 攻击速度 | 实时攻击次数/分钟,带有 60 分钟迷你图 |
| 攻击热力图 | 14 天,小时 × 天的强度网格 |
| 僵尸网络指纹 | 自动检测的活动,带有时间轴和点击查看的 AI 分析 |
| 凭证情报 | 成功率、协调攻击检测、僵尸网络徽章 |
| 攻击者情报 | 具有完整会话分解的威胁评分攻击者 |
| MITRE ATT&CK 框架 | 基于实时告警数据的动态战术/技术映射 |
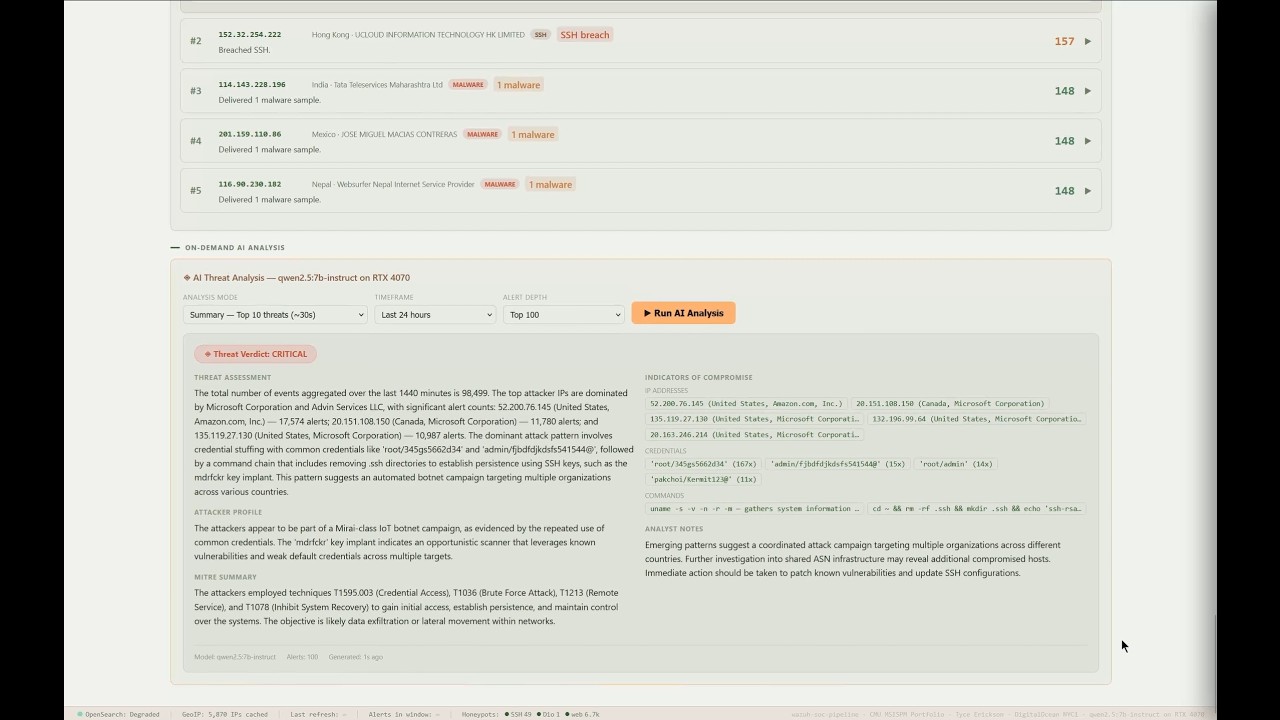
| 按需 AI 分析 | qwen2.5:7b-instruct 总结、完整和执行分流模式 |
### 多蜜罐与关联(nginx + Dionaea)
| 面板 | 描述 |
|-------|-------------|
| Dionaea 恶意软件捕获 | 捕获的二进制文件,带有 **VirusTotal 判定、恶意软件家族、来源归属、文件大小**、服务细分和活动时间轴 |
| nginx Web 蜜罐 | 扫描器指纹、CVE 探测路径、user agent、请求时间轴 |
| 跨蜜罐攻击者 | 同时攻击多个蜜罐的 IP |
| **威胁行为者关联** | 跨所有三个蜜罐的按 IP 统一配置文件,通过将 SSH、Web 和恶意软件活动链接为单一的协调行为者视图,按综合威胁评分排名。前 5 名带有可滚动的完整列表;“有史以来最持久”排名切换 |
| **最危险的攻击者** | 按破坏权重评分排名的顶级行为者(恶意软件交付、SSH 突破、持久化);延迟加载的深入分析,带有完整的跨蜜罐攻击叙述、Kill-chain 阶段、按战术划分的命令证据以及可复制的 IOC。“所有时间”排名切换 |
### 事件管理
内置案例管理(打开/调查中/已关闭、严重程度、审计日志)、告警透视和搜索,以及五个响应 playbook,由本地 SQLite 存储支持(`schema.sql`)。
## 关键发现
### 实时 WannaCry 捕获
Dionaea 蜜罐通过 SMB 捕获了 **7 个独特的恶意软件二进制文件** —— **6 个确认的 WannaCry 勒索软件变种**(每个被约 76 个 VirusTotal 引擎中的 59–66 个标记)外加一个来自美国、泰国、斯里兰卡和越南源 IP 的木马 downloader。每个样本都经过 SHA256 哈希处理、VirusTotal 验证、归属到其来源,并保存在永久的只读存档中。在 2017 年之后的几年里,WannaCry 仍在通过暴露的 SMB 自我传播,这是长尾互联网威胁活动的具体证明。
### mdrfckr 僵尸网络
观察到的最复杂的活动。通过 `~/.ssh/authorized_keys` 使用以 `mdrfckr` 结尾的独特 RSA 密钥安装持久 SSH 后门,然后使用 `chattr -ia`(不可变标志)防止密钥被删除(即使是 root 用户)。在收集窗口内,来自数百个分布式 IP 的约 90,000 次植入尝试。
### 345gs5662d34 活动
使用 `root/345gs5662d34` 的大规模凭证填充尝试了 **103,084 次,来自 357 个独立 IP**,这是数据集中最大的单一凭证攻击。
### nginx Web 蜜罐
探测数百个独特路径的请求:IoT 僵尸网络、针对 SendGrid/Twilio API 密钥的 `.env` 凭证窃取、海康威视 CVE-2021-36260 RCE 探测、TP-Link 固件漏洞利用(CVE-2021-22161)以及 Tomcat manager 暴力破解。
### 攻击规模
在峰值期,单日记录了 **约 270 万次告警**,由重叠的僵尸网络活动驱动。在大约 6 天的捕获窗口内(6 天 21 小时),系统平均每天约 190 万次告警,在持续高数据量下相当于每秒 20+ 次攻击事件。
## 仓库结构
```
ai-soc-pipeline/
├── dashboard/
│ ├── app.py # Flask backend — 31 API endpoints
│ ├── schema.sql # Incident-management SQLite schema
│ └── templates/
│ └── index.html # SOC dashboard frontend (17 panels)
├── pipeline/
│ ├── parse_nginx.py # nginx CLF → Wazuh JSON parser (wraps events as {"data":{...}})
│ ├── parse_dionaea.py # Dionaea SQLite → Wazuh JSON; SHA256 + VirusTotal + archive
│ ├── forward_cowrie.py # wraps Cowrie events as {"data":{...}} and appends to the Wazuh feed
│ ├── sync_cowrie.sh # VPS → SIEM cowrie sync (rsync --append + unreachable/rotation guard) → forward
│ ├── sync_nginx.sh # VPS → SIEM nginx access.log sync (homeserver-owned) → parse
│ ├── sync_dionaea.sh # VPS → SIEM sync (SQLite + binaries), then parse
│ └── rebuild_geoip_cache.py # MaxMind GeoLite2 cache refresh
├── triage/
│ ├── ai_triage.py # LLM threat-analysis engine
│ ├── alert_poller.py # OpenSearch alert sampler
│ └── triage_runner.py # 30-min cron orchestrator
├── scripts/
│ └── resolve_alert_ips.py # GeoIP backfill for alert IPs
├── config/
│ ├── soc-dashboard.service # Dashboard systemd unit
│ ├── cowrie-sync.service # Cowrie sync+forward systemd unit
│ ├── cowrie-sync.timer # 5-min timer for cowrie sync
│ ├── nginx-sync.service # nginx sync+parse systemd unit
│ ├── nginx-sync.timer # 5-min timer for nginx sync
│ ├── dionaea-sync.service # Dionaea sync+parse systemd unit
│ ├── dionaea-sync.timer # 15-min timer for the above
│ ├── geoip-enrich.cron # Hourly enrichment cron
│ ├── wazuh-cowrie-rules.xml # Cowrie detection rules (100100–100191, 29 rules)
│ ├── wazuh-honeypot-web-rules.xml # Dionaea + nginx rules (100200–100344, 28 rules)
│ ├── ingest-pipeline-filebeat-wazuh-alerts.json # OpenSearch ingest pipeline (data.data flatten fix)
│ ├── mitre-db-fixes.sql # Wazuh MITRE-DB tactic-mapping fix (re-apply after upgrades)
│ └── wazuh-ossec-snippet.xml # Wazuh agent localfile config
├── docs/ # 01–09 + operations runbook
├── data/samples/ # Sample alert JSON for testing
├── requirements.txt
└── README.md
```
## API Endpoints
Flask 后端暴露了 **31 个 API endpoints**(加上仪表盘根目录)。亮点:
| Endpoint | 描述 |
|----------|-------------|
| `GET /api/health` · `GET /api/honeypot_health` | 服务 + 每个蜜罐的健康检查 |
| `GET /api/stats?minutes=N` | 完整统计:时间轴、国家、IP、MITRE、凭证、命令 |
| `GET /api/attack_chain?minutes=N` | Kill-chain 漏斗阶段计数 |
| `GET /api/velocity` | 实时攻击次数/分钟 + 60 分钟迷你图数据 |
| `GET /api/heatmap` | 14 天 小时 × 天的攻击矩阵 |
| `GET /api/sessions?minutes=N` | 带有完整事件链的顶级会话 |
| `GET /api/botnets?minutes=N` | 行为僵尸网络指纹 |
| `POST /api/botnet_analysis` | 特定活动的 AI 分析 |
| `GET /api/intel?minutes=N` | 并行:攻击链 + 会话 + 僵尸网络 + 凭证情报 |
| `GET /api/cred_intel?minutes=N` | 凭证成功率 + 协调检测 |
| `GET /api/dionaea?minutes=N` | Dionaea 恶意软件统计 + VirusTotal 丰富的二进制文件 |
| `GET /api/nginx?minutes=N` | nginx Web 蜜罐统计 |
| `GET /api/honeypots?minutes=N` | 结合的 Dionaea + nginx(并行) |
| `GET /api/threat_actors?minutes=N&rank=` | 跨蜜罐威胁行为者关联(按 `score` 或 `persistence` 排名) |
| `GET /api/actor/` | 统一的跨蜜罐攻击叙述(Kill-chain、按战术划分的证据、IOC) |
| `GET /api/alert/` | 源 IP 的完整告警/上下文抽屉 |
| `GET /api/search?q=&type=` | 跨 IP、凭证、命令的透视/搜索 |
| `GET /api/playbooks` | 响应 playbook |
| `GET /api/triage` · `POST /api/analysis/run` · `GET /api/analysis/status` | AI 分流报告 / 按需分析 / 状态 |
| `POST /api/refresh` · `GET /api/refresh/status` | 触发 + 轮询数据刷新 |
| `GET /api/export` | 导出当前视图 |
| `GET /api/cases` · `POST /api/cases` · `GET·PATCH /api/cases/` · `GET /api/cases/export` | 事件案例管理(CRUD + CSV) |
## 技术栈
- **蜜罐:** Cowrie SSH/Telnet、nginx、Dionaea(在 DigitalOcean NYC1 上的 Docker)
- **传输:** 通过 Tailscale VPN 的 rsync,每个蜜罐由家用服务器拥有的 systemd 定时器执行(cowrie 和 nginx 每 5 分钟一次,dionaea 每 15 分钟一次)
- **丰富:** Python + MaxMind GeoLite2(City + ASN)+ VirusTotal API(仅哈希)
- **日志解析器:** 用于 nginx CLF 和 Dionaea SQLite 的自定义 Python
- **SIEM:** Wazuh 4.x + OpenSearch(Ubuntu Server, aarch64)
- **后端:** Python 3, Flask(最小依赖 `flask` 和 `geoip2`)
- **前端:** 原生 HTML/CSS/JS、HTML5 Canvas、Natural Earth 50m 地理数据
- **AI:** Ollama + qwen2.5:7b-instruct(在 NVIDIA RTX 4070 上进行完全本地推理)
- **网络:** Tailscale mesh VPN(无公共仪表盘暴露)
- **机密信息:** 基于环境变量;源代码中无凭证
## 设置
有关完整的部署说明,请参见 `/02-wazuh-installation.md`。概要步骤:
1. 在 VPS 上部署 Cowrie、nginx 和 Dionaea(Docker Compose)
2. 在您的 SIEM 服务器上安装 Wazuh all-in-one
3. 配置通过 Tailscale 从 VPS 到 SIEM 服务器的基于密钥的同步
4. 部署三个家用服务器拥有的同步定时器 `cowrie-sync.timer`(`sync_cowrie.sh` + `forward_cowrie.py`)、`nginx-sync.timer`(`sync_nginx.sh` + `parse_nginx.py`)、`dionaea-sync.timer`(`sync_dionaea.sh` + `parse_dionaea.py`)。每个都通过 Tailscale 使用 rsync 从 VPS 同步其蜜罐的数据,并发送 `{"data":{...}}` 包装的 Wazuh JSON。
5. 设置 GeoIP 丰富 cron(`config/geoip-enrich.cron`)
6. 添加 Wazuh 规则(`config/wazuh-cowrie-rules.xml`、`config/wazuh-honeypot-web-rules.xml`)
7. 导入 OpenSearch ingest pipeline(`config/ingest-pipeline-filebeat-wazuh-alerts.json`)并将 `config/mitre-db-fixes.sql` 应用到 Wazuh MITRE DB(在任何 Wazuh 升级后重新应用后者 — 参见 `docs/operations.md`)
8. 部署 Flask 仪表盘(`config/soc-dashboard.service`);在单元中设置 `OPENSEARCH_PASS`
9. (可选)在 `config/dionaea-sync.service` 中设置 `VT_API_KEY` 以启用 VirusTotal 丰富
10. 在您的 AI 推理机器上安装 Ollama 并拉取 `qwen2.5:7b-instruct`
## 文档
完整的项目文档位于 `docs/`:
1. **架构** — 系统设计、数据流、基础设施
2. **Wazuh 安装** — SIEM 部署和配置
3. **日志摄取** — 从蜜罐到 SIEM 的 pipeline
4. **自定义规则** — 解码器、规则、MITRE 映射
5. **AI 分流设计** — LLM 集成和 prompt 工程
6. **仪表盘指南** — 面板参考和解释
7. **告警样本** — 真实攻击会话分析
8. **经验教训** — 技术回顾(包括 Dionaea schema 错误和机密信息处理迁移)
9. **执行摘要** — CISO 级别的发现和意义
此外还有 **Operations Runbook**(`docs/operations.md`),包含一个自动化的摄取拓扑结构、在重建/升级后需要重新应用的非 git 工件(ingest pipeline、MITRE-DB 修复、fail2ban 白名单)以及弹性保障措施。
*作为 CMU MSISPM 申请作品集 4 个项目中的第 4 个构建。所有数据均收集自作者拥有和运营的基础设施上的真实互联网攻击流量。*
▶ Highlights Demo (~2 min)
▶ Full Walkthrough (~5 min)
标签:AI风险缓解, CISA项目, DLL 劫持, IP 地址批量处理, SIEM系统, Wazuh, 后端开发, 大语言模型, 威胁情报, 安全可视化, 安全运营中心, 开发者工具, 网络映射, 蜜罐, 证书利用, 逆向工具