iamajidkhan/EOC-Infrastructure-Monitoring-Alerting-Lab
GitHub: iamajidkhan/EOC-Infrastructure-Monitoring-Alerting-Lab
一个模拟企业运营中心的本地实验环境,利用Datadog实现基础设施监控告警,并通过Webhook集成ServiceNow自动创建事件工单,完整演示了从检测到响应的告警生命周期。
Stars: 0 | Forks: 0
# EOC 基础设施监控与告警实验
一个本地基础设施监控实验,模拟了**企业运营中心 (EOC)** 环境。使用 **Datadog** 进行监控和告警构建,并集成 **ServiceNow** 以通过 REST API webhook 自动创建事件。
## 架构
```
MacBook Air M1 — Monitored Host
|
| Datadog Agent v7 (collects system metrics)
|
▼
Datadog Platform (us5.datadoghq.com)
|
├── EOC Infrastructure Health Dashboard
| ├── Host Map (visual health overview)
| ├── CPU Usage by Host (timeseries)
| ├── Memory Available % (query value)
| ├── Disk Usage by Host (timeseries)
| └── Network In by Host (timeseries)
|
└── Custom EOC Monitors
├── High CPU - EOC Monitor
| └── Alert fires → Email notification
| → Webhook → ServiceNow REST API
| └── Incident auto-created (INC#)
├── Disk Space - EOC Monitor
└── Host Down - EOC Monitor
```
## 技术栈
| 组件 | 工具 | 用途 |
|---|---|---|
| 监控代理 | Datadog Agent v7 (macOS) | 收集主机指标 |
| 可观测性平台 | Datadog 免费试用 | 仪表板、监控器、告警 |
| 受监控主机 | MacBook Air M1 | 模拟受管端点 |
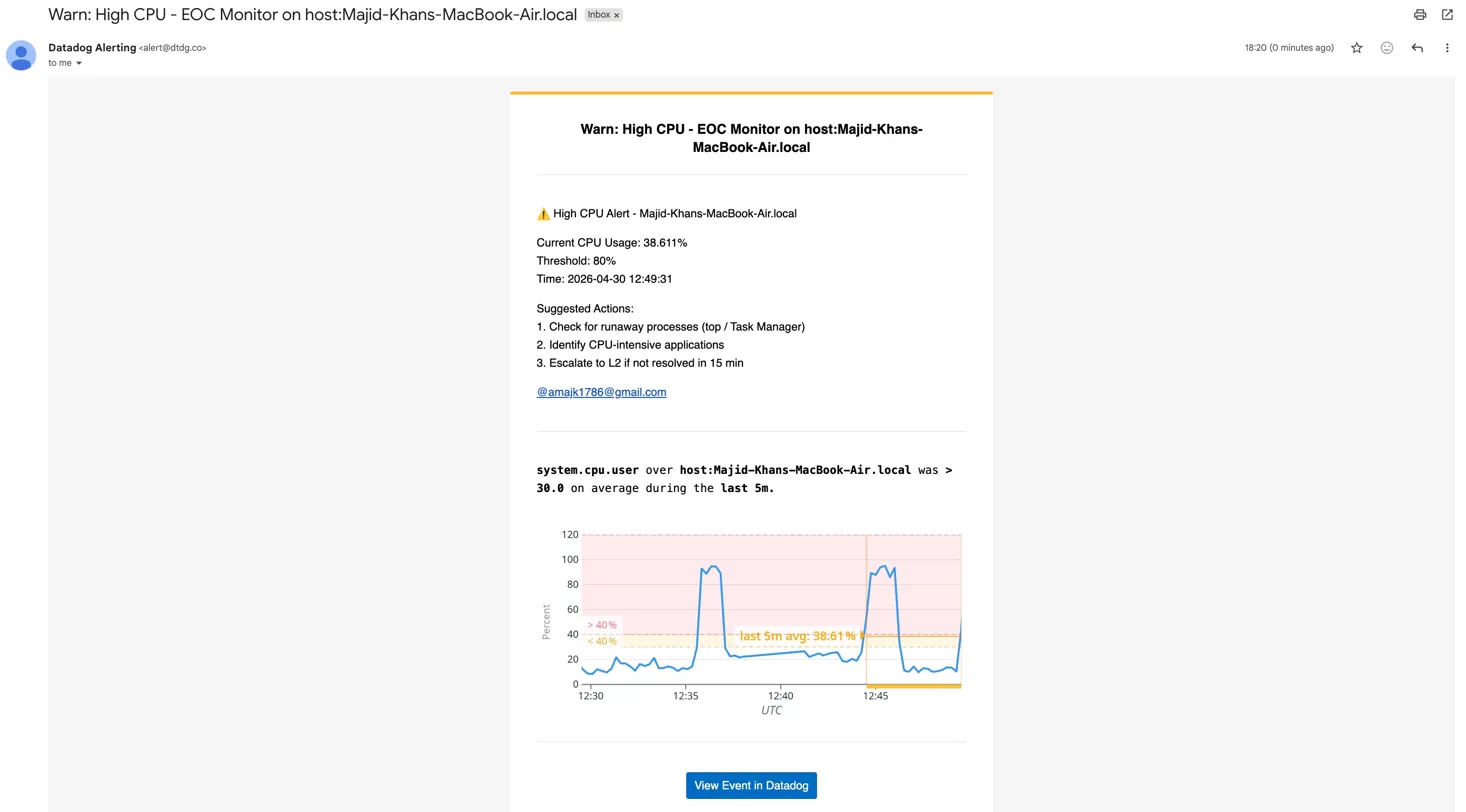
| 告警通知 | Datadog 邮件告警 | 附带嵌入 CPU 图表的告警发送 |
| 事件管理 | ServiceNow PDI (免费开发者实例) | 通过 REST API 自动创建事件 |
| 集成方式 | Datadog Webhook → ServiceNow `/api/now/table/incident` | 无需原生插件 |
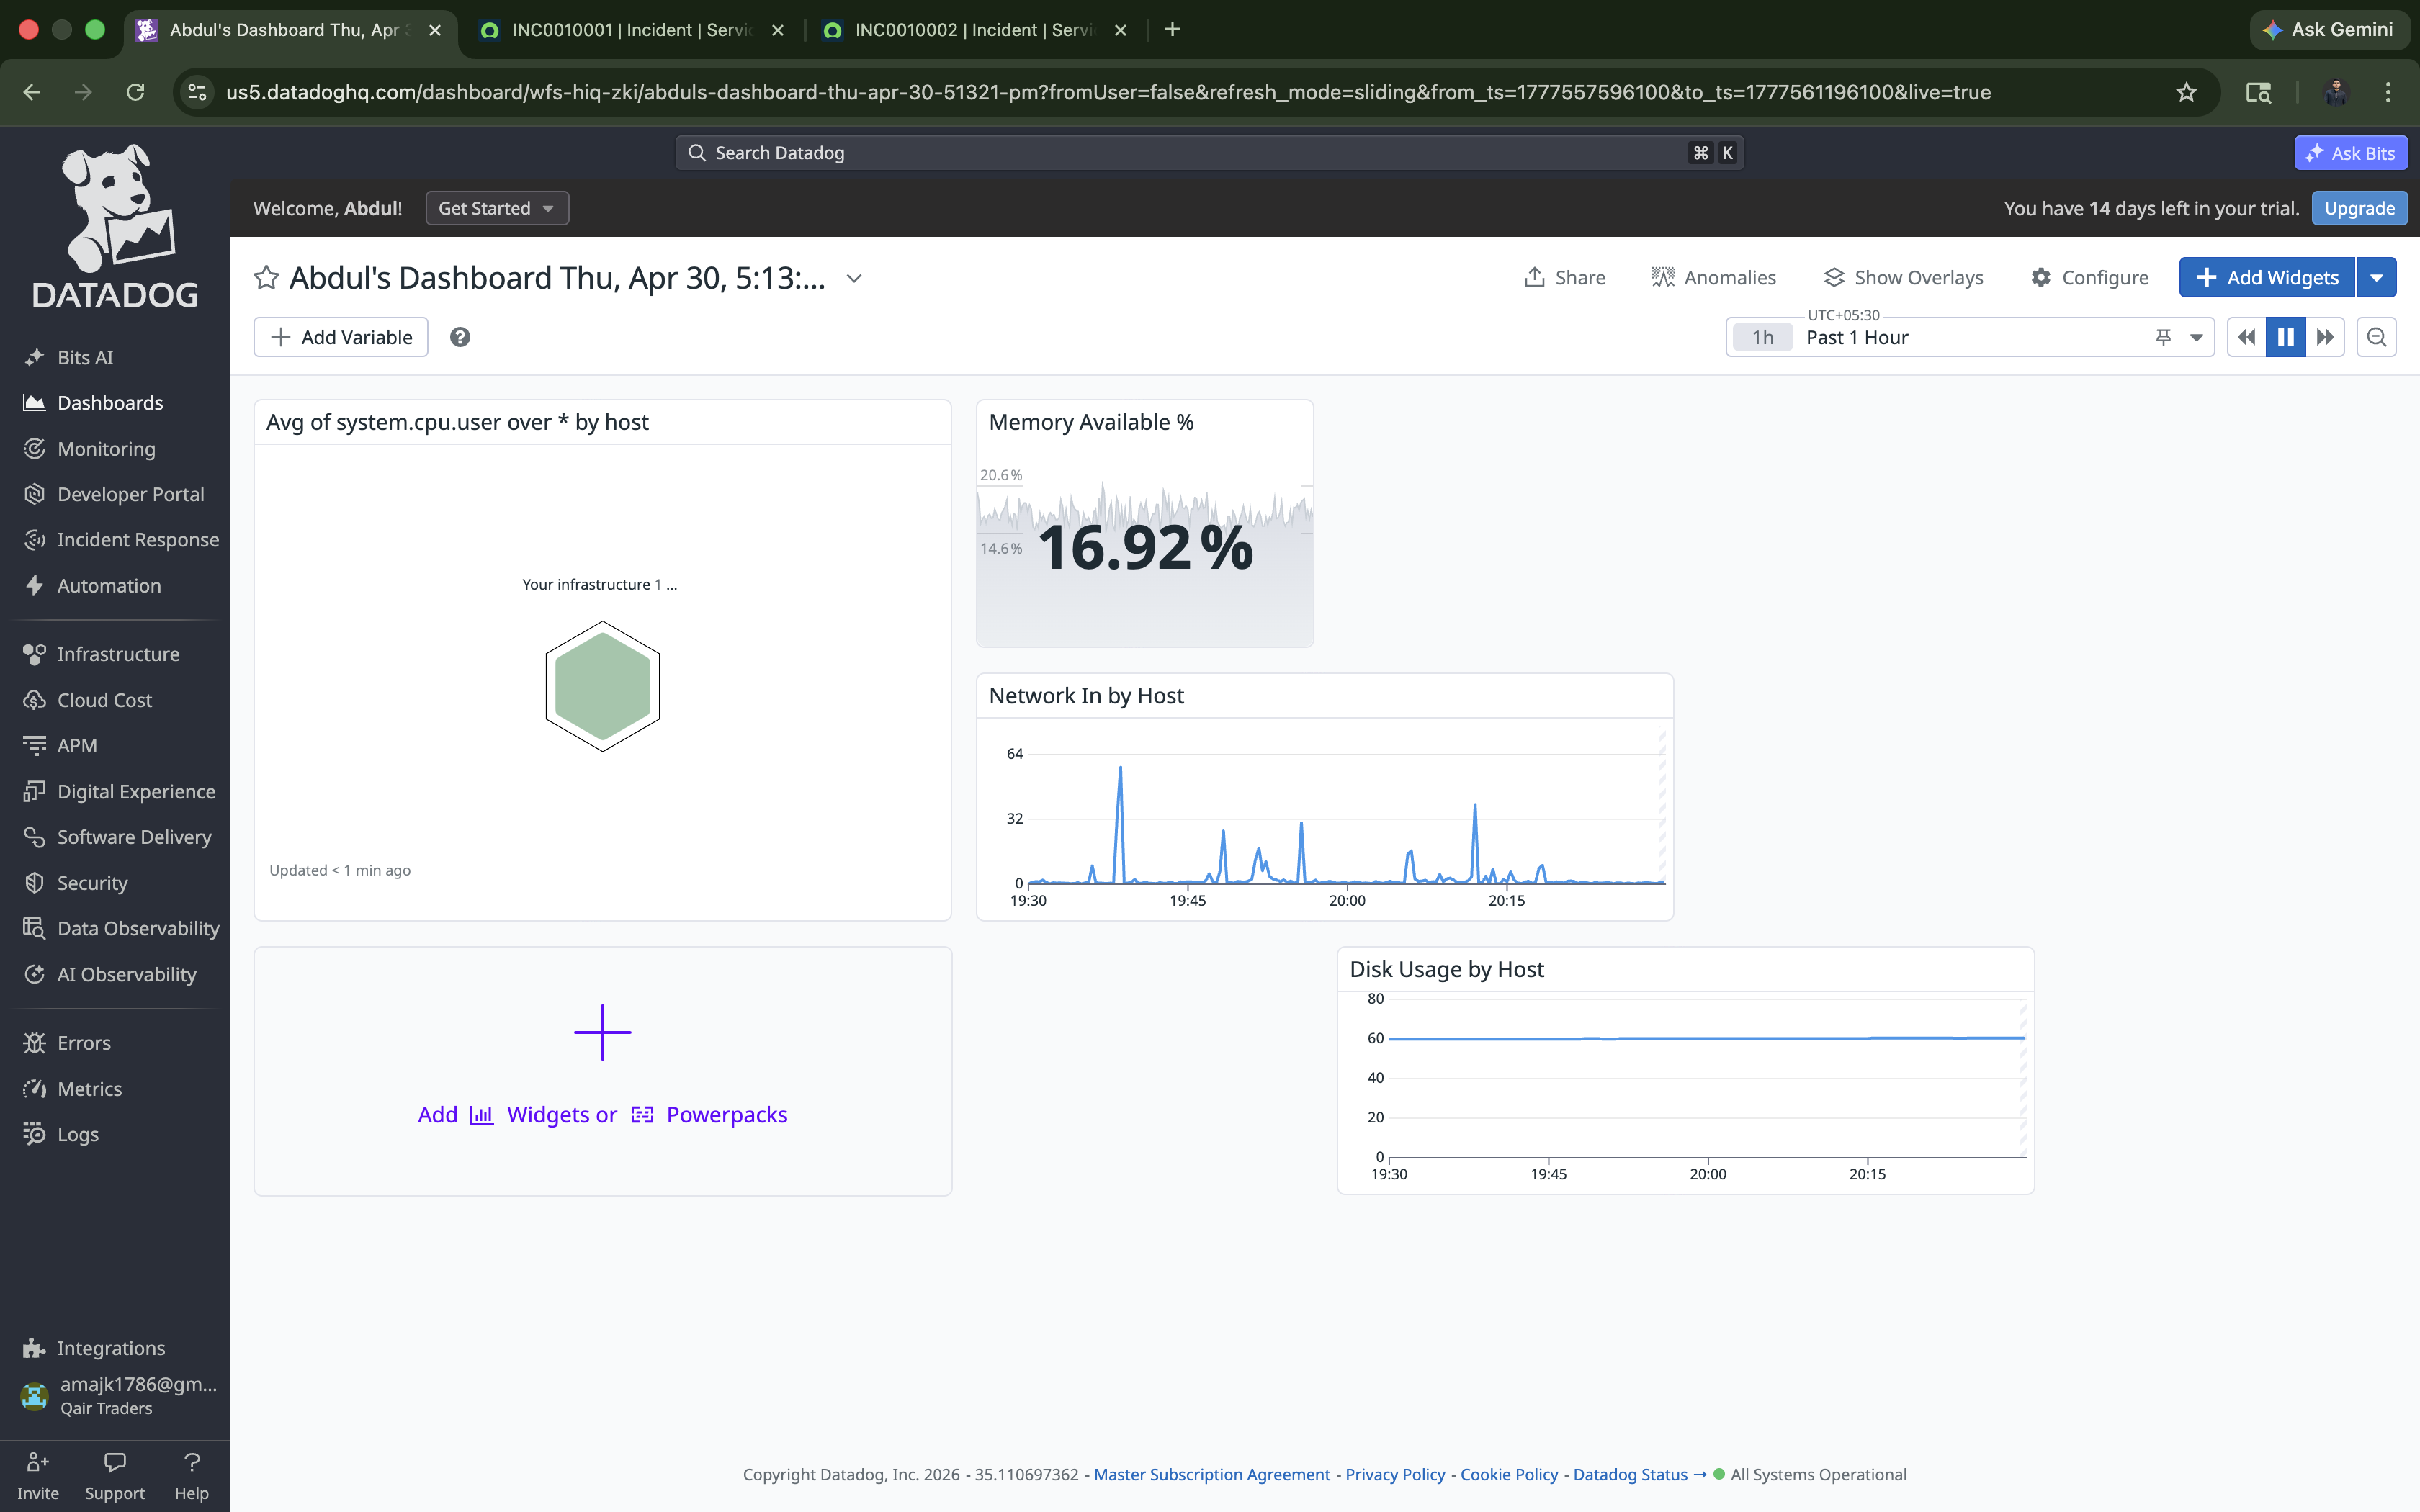
## 仪表板 — EOC 基础设施健康状况
| 组件 | 指标 | 类型 |
|---|---|---|
| 主机地图 | 所有主机 | 可视化健康状况概览 |
| CPU 使用率 | `avg:system.cpu.user` by host | 时间序列 |
| 可用内存 | `avg:system.mem.pct_usable` | 查询值 |
| 磁盘使用率 | `avg:system.disk.in_use` by host | 时间序列 |
| 网络流入 | `avg:system.net.bytes_rcvd` by host | 时间序列 |
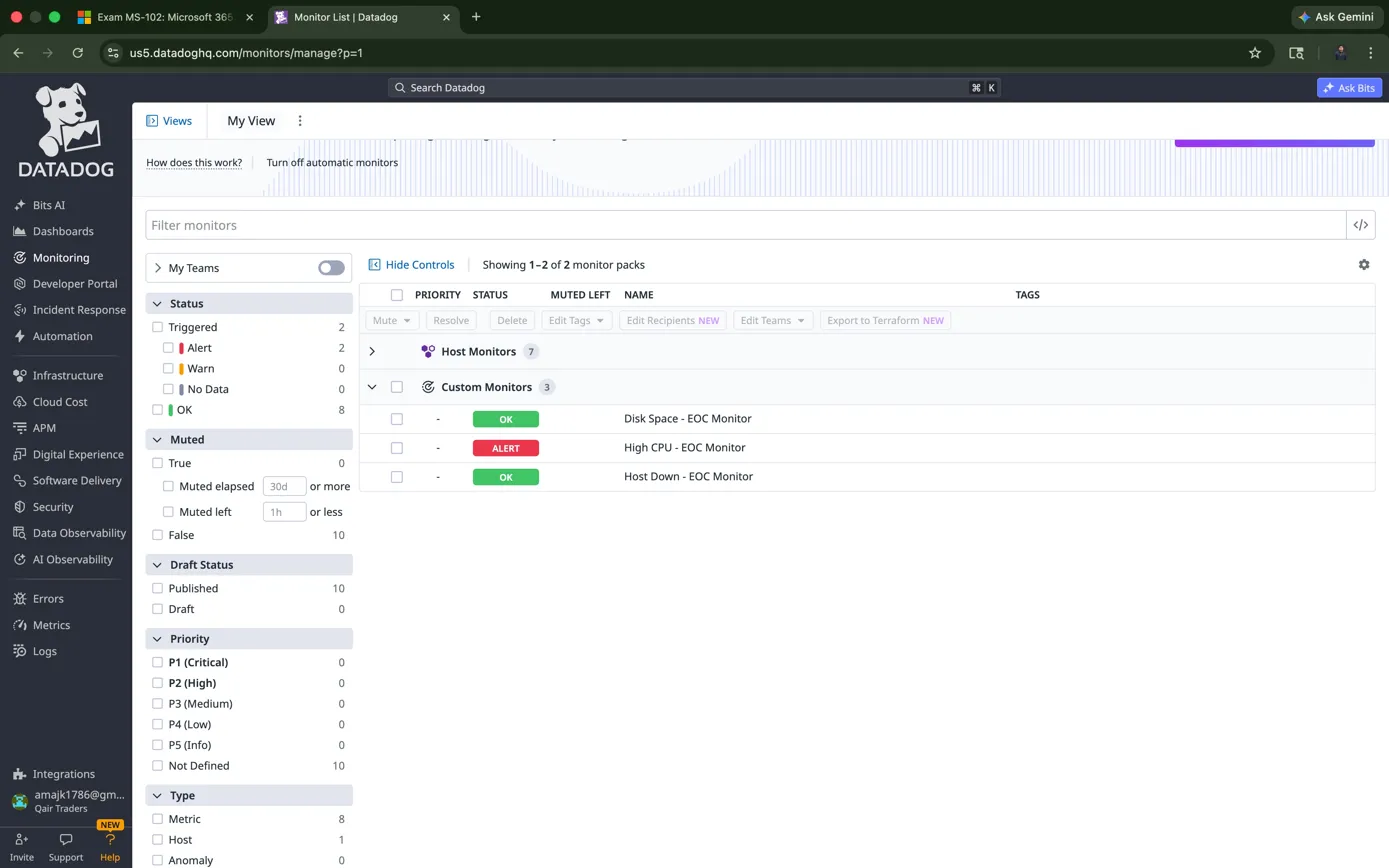
## 监控器与告警逻辑
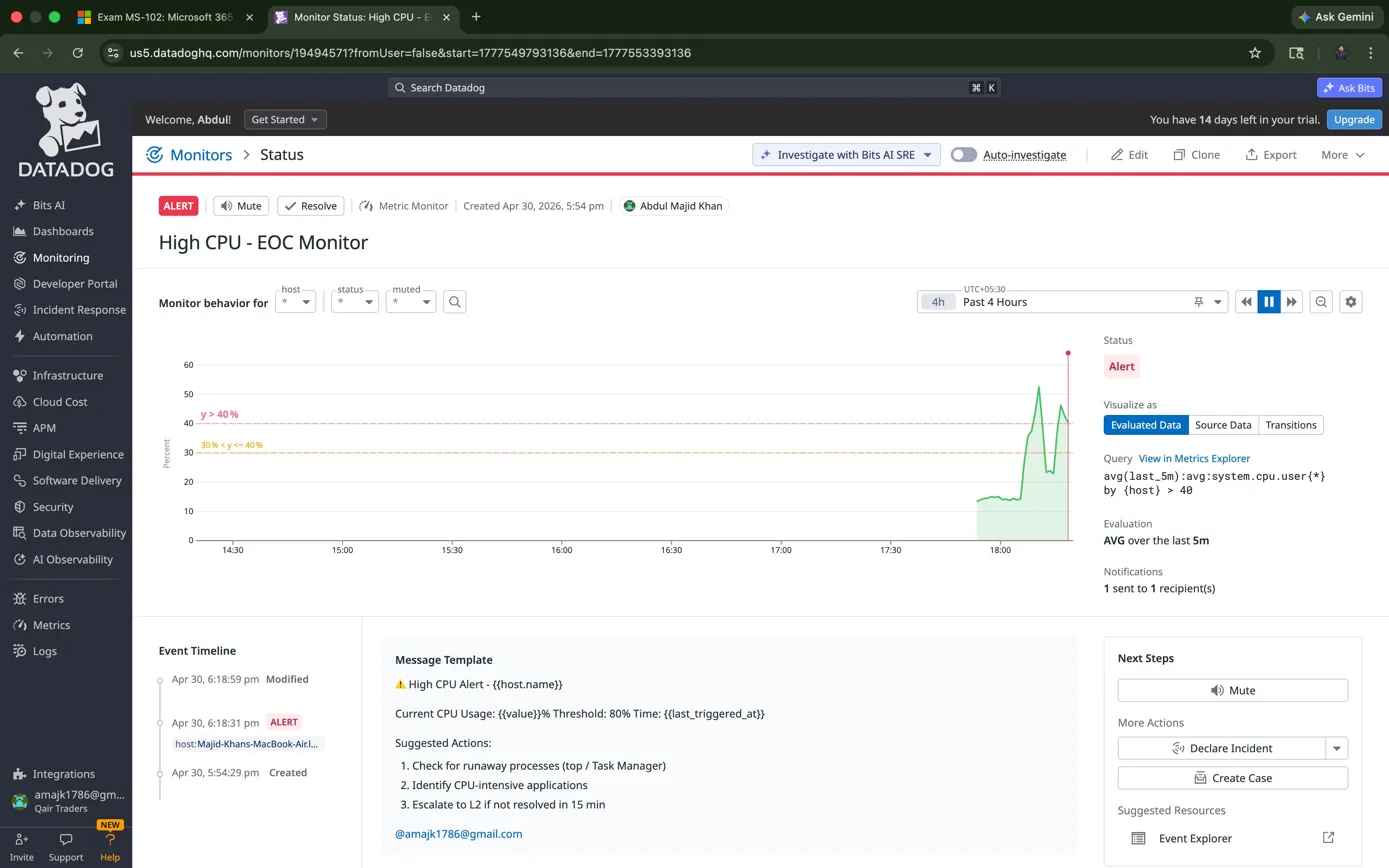
### 监控器 1 — 高 CPU - EOC Monitor
```
Query: avg(last_5m):avg:system.cpu.user{*} by {host} > 40
Warning: 30% | Critical: 40%
Notify: Email + @webhook-servicenow-incident
```
### 监控器 2 — 磁盘空间 - EOC Monitor
```
Query: avg(last_5m):avg:system.disk.in_use{*} by {host} > 0.85
Warning: 75% | Critical: 85%
```
### 监控器 3 — 主机宕机 - EOC Monitor
```
Type: Host Monitor
Trigger: Host stops reporting > 2 minutes
```
## ServiceNow 集成 — Datadog Webhook → REST API
由于 ServiceNow PDI 不提供原生的 Datadog ITOM/ITSM 应用,因此该集成是通过 **Datadog Webhook** 直接调用 **ServiceNow Table REST API** 手动构建的。
**Webhook URL:**
```
https://dev394792.service-now.com/api/now/table/incident
```
**Payload:**
```
{
"short_description": "[$EVENT_TITLE] - Datadog Alert on $HOSTNAME",
"description": "Monitor: $EVENT_TITLE\nHost: $HOSTNAME\nAlert Status: $ALERT_STATUS\nMetric Value: $ALERT_METRIC\nTime: $DATE\n\nSuggested Actions:\n1. Check for runaway processes\n2. Identify CPU-intensive applications\n3. Escalate to L2 if not resolved in 15 min",
"urgency": "2",
"impact": "2",
"category": "software",
"caller_id": "admin"
}
```
### 结果
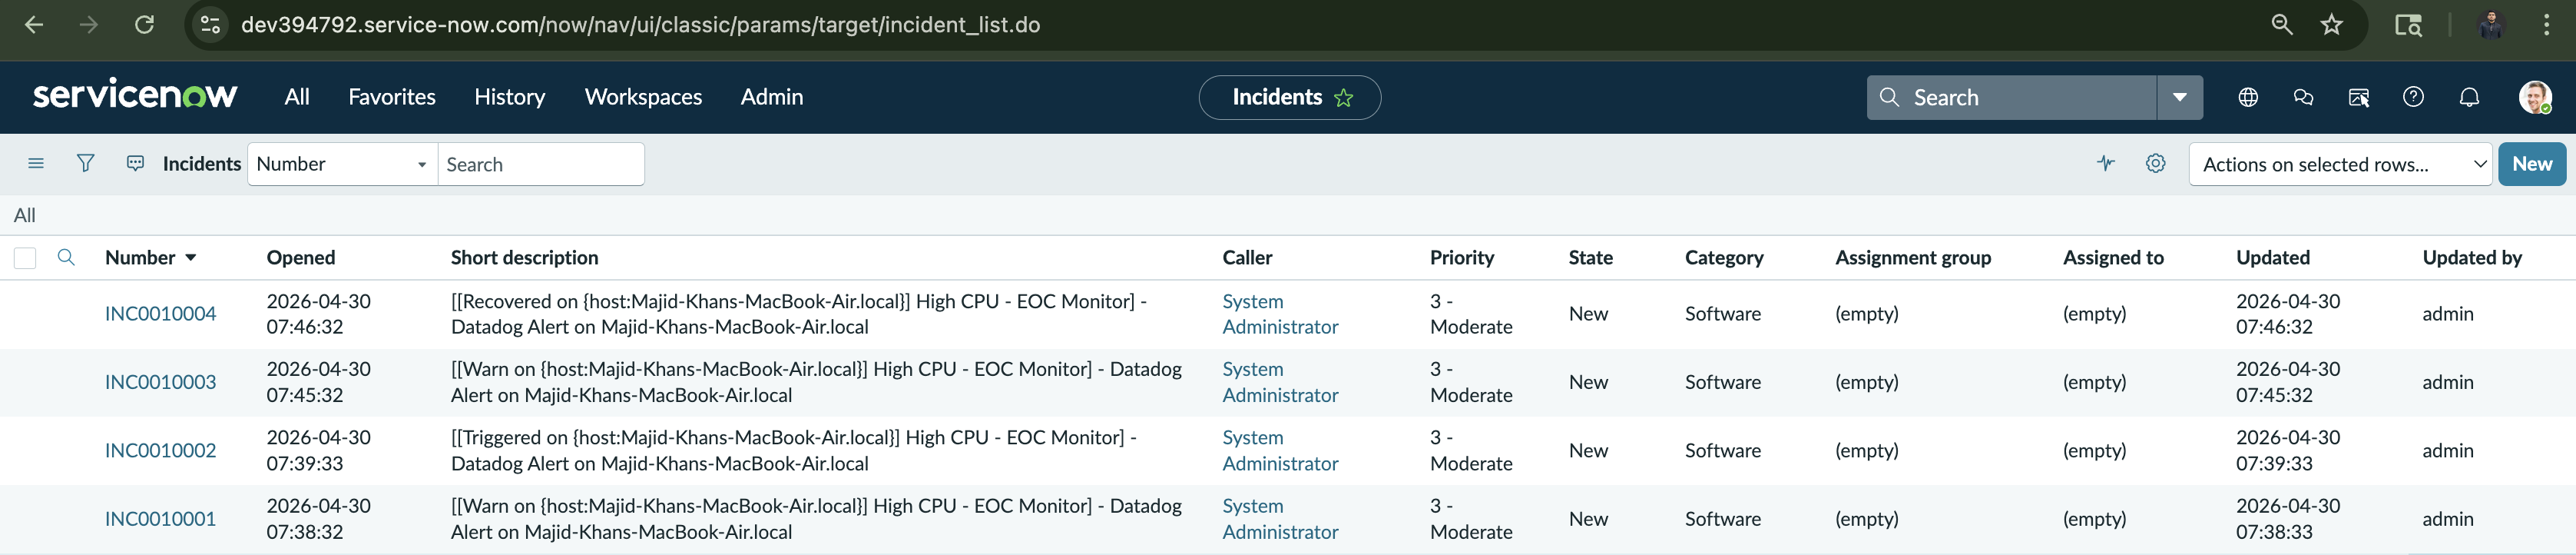
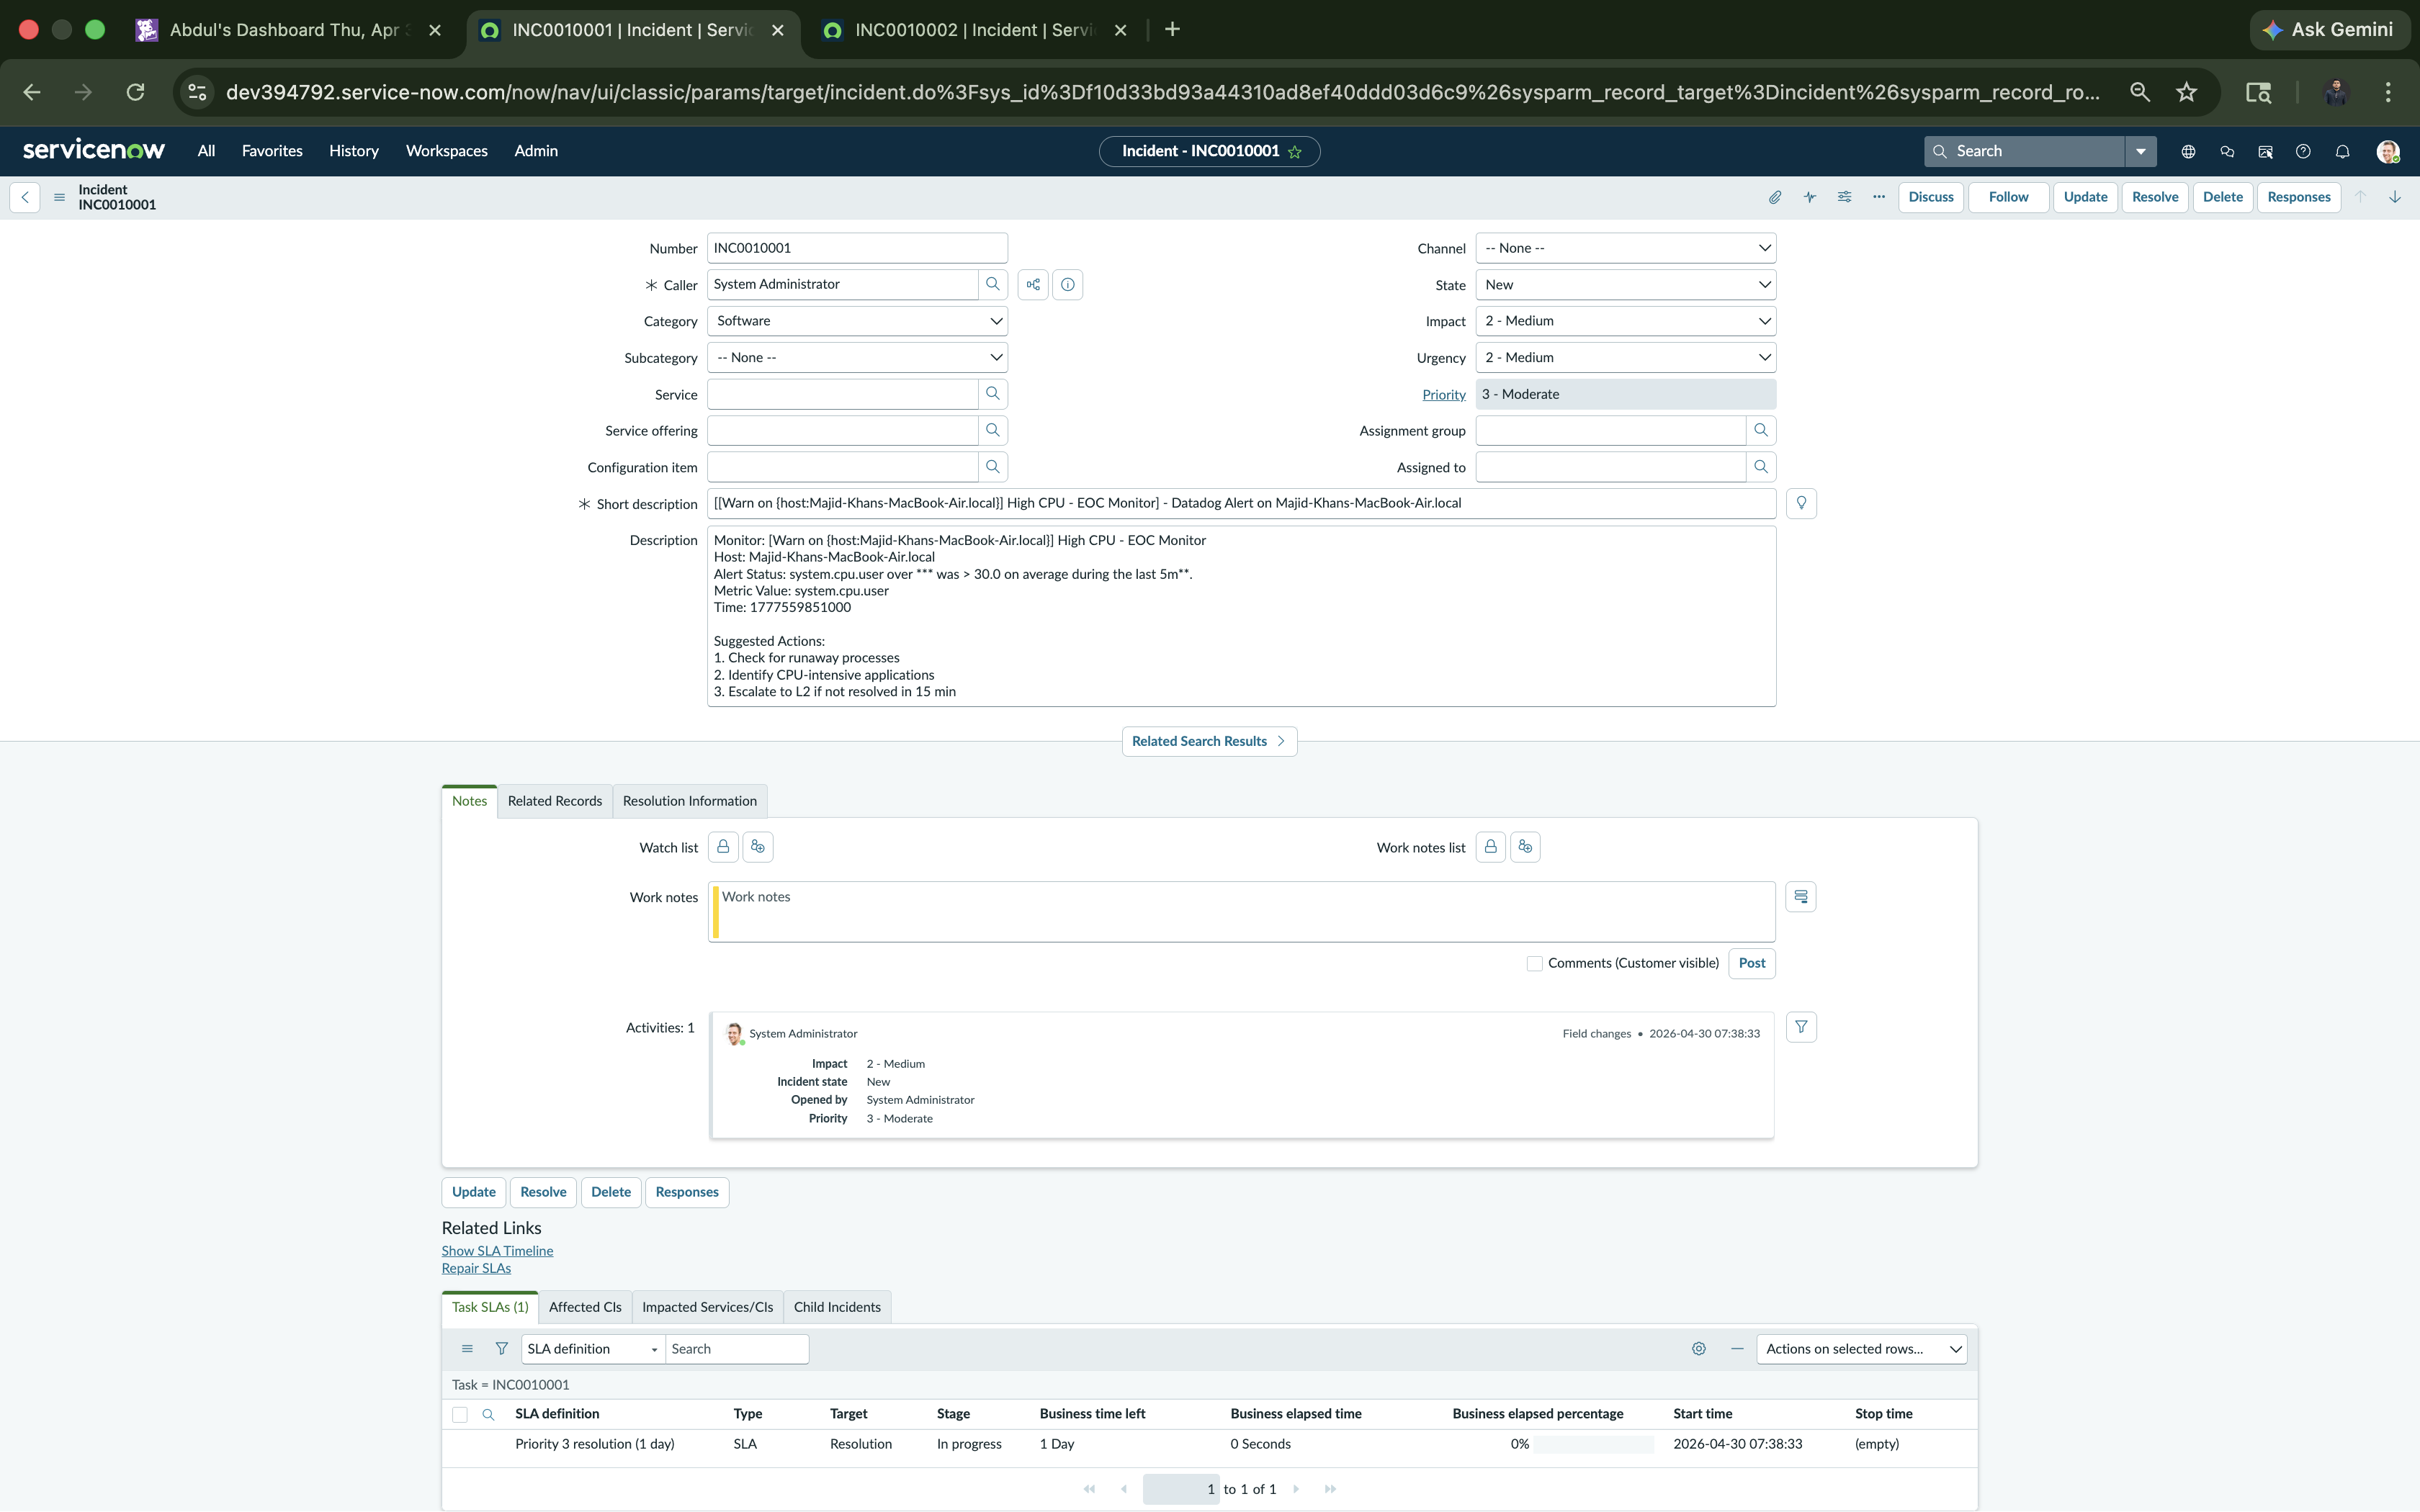
每次监控器告警都会自动创建一个 ServiceNow 事件,并预先填充主机名、告警状态、指标值、时间戳以及包含 3 个步骤的 runbook。
## 告警生命周期演示
```
1. stress --cpu 8 --timeout 300 # Simulate high CPU
2. Datadog monitor fires (OK → Alert) # Detected within 5 min
3. Email notification sent # With embedded CPU graph
4. Webhook triggers SNOW REST API # Auto-creates incident
5. INC0010001 / INC0010002 created # Full context in description
6. killall stress # Resolve the issue
7. Close incident in ServiceNow # Complete the workflow
```
## 截图
### EOC 基础设施健康状况仪表板
### 监控器列表 — 所有 3 个 EOC 监控器
### 处于 ALERT 状态的高 CPU 监控器
### 包含 CPU 图表的邮件通知
### ServiceNow 事件列表 — 自动创建
### 包含 Runbook 的 ServiceNow 事件详情
EOF
## Runbook
高 CPU 响应的完整 L1 SOP:[`docs/high-cpu-response-sop.md`](./docs/high-cpu-response-sop.md)
## 核心收获
- 在 macOS 上安装 Datadog Agent 并收集实时基础设施指标
- 构建了多组件的 EOC 仪表板以实现统一视图可见性
- 创建了带有结构化 runbook 告警消息的基于阈值的监控器
- 验证了完整的告警生命周期:检测 → 邮件 → ServiceNow 事件
- 通过 REST API webhook 集成 Datadog → ServiceNow(无需原生插件)
- 针对 M1 Mac CPU 架构校准了阈值
- 以正式的 SOP 文档化了 L1 响应流程
## 项目结构
```
eoc-monitoring-lab/
├── README.md
├── docs/
│ └── high-cpu-response-sop.md
└── screenshots/
├── dashboard.png
├── monitors-list.png
├── monitor-alert.png
├── email-alert.png
├── servicenow-incident-list.png
└── servicenow-incident-detail.png
```
## 作者
**Abdul Majid Khan**
CompTIA Security+ | Splunk Core Certified User | Google Cybersecurity Certified | Fortinet NSE3
海得拉巴,印度 | [LinkedIn](https://www.linkedin.com/in/abdul-majid-khan-b14ab7220/)
标签:AIOps, API集成, CPU监控, Datadog, EOC模拟, ITSM, IT运维, MacOS监控, Mr. Robot, REST API集成, ServiceNow, Socks5代理, SRE, Webhook自动化, 企业运营中心, 偏差过滤, 可观测性, 可视化看板, 告警工作流, 告警系统, 基础设施监控, 无线安全, 磁盘空间监控, 系统性能监控, 自动化事件创建, 运维实验室, 运维自动化