jasoncheng7115/jt-glogarch
GitHub: jasoncheng7115/jt-glogarch
为 Graylog Open 社区版提供完整的日志归档与还原方案,弥补其缺乏企业版归档功能的不足。
Stars: 32 | Forks: 7
# jt-glogarch v1.13.72
**Language**: **English** | [繁體中文](README-zh_TW.md)
**Website**: -offline.tar.gz
The bundle contains the jt-glogarch wheel **and every runtime dependency wheel**
**and the source tree** and the offline installer — everything the upgrade needs.
**Step 2 — carry `jt-glogarch--offline.tar.gz` to the target host** (USB,
internal file share, scp — whatever your air-gap policy allows).
**Step 3 — on the target host (as root):**
tar xzf jt-glogarch--offline.tar.gz
cd jt-glogarch--offline
sudo bash upgrade-offline.sh
It backs up the DB, refreshes the `/opt/jt-glogarch` source tree, installs the
package + any missing dependencies **from the bundled wheels only** (no network),
restarts the service, and verifies `GET /api/health` reports the new version.
### Uninstall
sudo bash /opt/jt-glogarch/deploy/uninstall.sh
Stops the service, removes the systemd unit, and `pip uninstall`s the
package. Then asks **separately** before deleting any of:
- `/data/graylog-archives` (the actual archive `.json.gz` files)
- `/etc/jt-glogarch` (config dir, if you used it)
- `/opt/jt-glogarch` (source + DB + certs — losing this means losing the
job/audit history and SSL keypair)
- the `jt-glogarch` system user
Defaults to **keep** for every destructive prompt. If you also wired
nginx to forward audit syslog into port 8991, remove the corresponding
`access_log syslog:server=...` line from your Graylog nodes' nginx
config and reload nginx.
### Setup Operation Audit (nginx)
jt-glogarch includes a built-in Operation Audit feature that tracks who did what on Graylog. It works by receiving access logs from nginx reverse proxies on your Graylog servers. **Enabled by default** — just configure nginx.
**On each Graylog server**, install and configure nginx as a reverse proxy:
# 1. Install nginx (skip if already installed)
sudo apt install -y nginx
# 2. Create SSL certificate (skip if you already have one)
sudo openssl req -x509 -newkey rsa:2048 -nodes \
-keyout /etc/ssl/private/graylog.key \
-out /etc/ssl/certs/graylog.crt \
-days 3650 -subj "/CN=$(hostname)"
# 3. Add audit log format to /etc/nginx/nginx.conf
# Add INSIDE the http { } block, BEFORE any "include" lines:
log_format graylog_audit escape=json
'{'
'"time":"$time_iso8601",'
'"remote_addr":"$remote_addr",'
'"method":"$request_method",'
'"uri":"$uri",'
'"args":"$args",'
'"status":$status,'
'"body_bytes_sent":$body_bytes_sent,'
'"request_body":"$request_body",'
'"http_authorization":"$http_authorization",'
'"http_cookie":"$cookie_authentication",'
'"user_agent":"$http_user_agent",'
'"request_time":$request_time,'
'"server_name":"$server_name"'
'}';
# 4. Create Graylog site config: /etc/nginx/sites-available/graylog
server {
listen 443 ssl;
server_name graylog.example.com;
ssl_certificate /etc/ssl/certs/graylog.crt;
ssl_certificate_key /etc/ssl/private/graylog.key;
location / {
proxy_pass http://127.0.0.1:9000/;
proxy_http_version 1.1;
proxy_set_header Host $host;
proxy_set_header X-Real-IP $remote_addr;
proxy_set_header X-Forwarded-For $proxy_add_x_forwarded_for;
proxy_set_header X-Graylog-Server-URL https://$host/;
proxy_pass_request_headers on;
proxy_buffering off;
client_max_body_size 8m;
}
# Operation Audit — send access logs to jt-glogarch
access_log syslog:server=JT_GLOGARCH_IP:8991,facility=local7,tag=graylog_audit graylog_audit;
client_body_buffer_size 64k;
}
# Optional: redirect HTTP to HTTPS
server {
listen 80;
return 301 https://$host$request_uri;
}
# 5. Replace JT_GLOGARCH_IP with your jt-glogarch server IP in the config above
# 6. Enable the site and test
sudo ln -sf /etc/nginx/sites-available/graylog /etc/nginx/sites-enabled/
sudo nginx -t && sudo systemctl reload nginx
# 7. Open UDP port 8991 on the jt-glogarch server firewall
# (run this on the jt-glogarch server, not the Graylog server)
sudo ufw allow 8991/udp
# 8. IMPORTANT: Block direct access to Graylog port 9000
# Only allow localhost (nginx) and other Graylog cluster nodes.
# This forces all users through nginx, ensuring complete audit coverage.
# Replace CLUSTER_NODE_IP with each Graylog node IP in your cluster.
sudo ufw deny 9000
sudo ufw allow from 127.0.0.1 to any port 9000
sudo ufw allow from CLUSTER_NODE_IP to any port 9000
# Repeat the above line for each Graylog cluster node
After setup, open the jt-glogarch Web UI → **Operation Audit** page to verify data is flowing in.
## Installation Details
### Manual Installation
If you prefer not to use `install.sh`:
# 1. Install Python dependencies
pip install --no-build-isolation --no-cache-dir /opt/jt-glogarch
# 2. Create system user
useradd -r -s /bin/false -d /opt/jt-glogarch jt-glogarch
# 3. Create archive storage
mkdir -p /data/graylog-archives
chown -R jt-glogarch:jt-glogarch /data/graylog-archives
# 4. Generate self-signed SSL certificate
mkdir -p /opt/jt-glogarch/certs
openssl req -x509 -newkey rsa:4096 -nodes \
-keyout /opt/jt-glogarch/certs/server.key \
-out /opt/jt-glogarch/certs/server.crt \
-days 3650 -subj '/CN=jt-glogarch'
# 5. Copy config template
cp /opt/jt-glogarch/deploy/config.yaml.example /opt/jt-glogarch/config.yaml
chown jt-glogarch:jt-glogarch /opt/jt-glogarch/config.yaml
# 6. Install systemd unit
cp /opt/jt-glogarch/deploy/jt-glogarch.service /etc/systemd/system/
systemctl daemon-reload
systemctl enable --now jt-glogarch
### Verifying the Installation
# Service status
systemctl status jt-glogarch
# Live logs
journalctl -u jt-glogarch -f
# Test Web UI (should return HTTP 200)
curl -sk https://localhost:8990/login -o /dev/null -w '%{http_code}\n'
# Health check (should return version + healthy)
curl -sk https://localhost:8990/api/health
### Upgrading
When a new version is available on GitHub, upgrade with one command:
sudo bash /opt/jt-glogarch/deploy/upgrade.sh
The upgrade script automatically: backs up DB → git pull → pip install → restart service → verify version.
## Configuration
The config file lives at `/opt/jt-glogarch/config.yaml` and **must be owned by `jt-glogarch`**.
After installation, just fill in the Graylog connection info. Everything else can be configured from the Web UI.
# === Required: Graylog connection ===
servers:
- name: log4
url: "http://YOUR_GRAYLOG_IP:9000"
auth_token: "YOUR_GRAYLOG_API_TOKEN"
default_server: log4
# === Required: archive storage path ===
export:
base_path: /data/graylog-archives
# === Optional: OpenSearch direct mode (skip if not using) ===
opensearch:
hosts:
- "http://YOUR_OS_IP:9200"
username: admin
password: "YOUR_OS_PASSWORD"
# === Optional: DB path (default is fine) ===
database_path: /opt/jt-glogarch/jt-glogarch.db
### Archiving Multiple Sources
jt-glogarch can archive **multiple Graylog servers**, each with its **own OpenSearch cluster**. List every server under `servers:`, then create **one export schedule per server** (the export and schedule dialogs in the Web UI let you pick which server to archive).
servers:
# Server A — with its own OpenSearch cluster (for OpenSearch-mode export).
- name: graylog-main
url: "http://192.168.1.10:9000"
auth_token: "TOKEN_A"
verify_ssl: false
opensearch: # per-server cluster; `hosts` are
hosts: # failover NODES of THIS one cluster
- "http://192.168.1.10:9200"
- "http://192.168.1.11:9200"
username: admin
password: "OS_PASSWORD_A"
verify_ssl: false
# Server B — a different site with a different OpenSearch cluster.
- name: graylog-siteB
url: "http://10.0.0.5:9000"
auth_token: "TOKEN_B"
verify_ssl: false
opensearch:
hosts:
- "http://10.0.0.5:9200"
username: admin
password: "OS_PASSWORD_B"
verify_ssl: false
default_server: graylog-main
# Global fallback — used by any server WITHOUT its own `opensearch:` block.
opensearch:
hosts:
- "http://192.168.1.10:9200"
username: admin
password: "OS_PASSWORD_A"
verify_ssl: false
**Notes:**
- **Graylog API mode** needs no OpenSearch at all — just list each server under `servers:` and schedule one export per server.
- **OpenSearch Direct mode** uses the server's own `opensearch:` block if present, otherwise the global `opensearch:` block. The `hosts` list within a block is the **failover nodes of a single cluster**, *not* separate clusters — to archive separate clusters, give each its own server entry.
- CLI: `glogarch export --server graylog-siteB --mode opensearch` and `glogarch test-opensearch --server graylog-siteB` operate on that server's cluster.
## Web UI Guide
The Web UI is the **primary interface**. CLI is available for automation and scripting.
Login uses your Graylog credentials — there is no separate user database. Authentication is delegated to the Graylog REST API.
### Dashboard
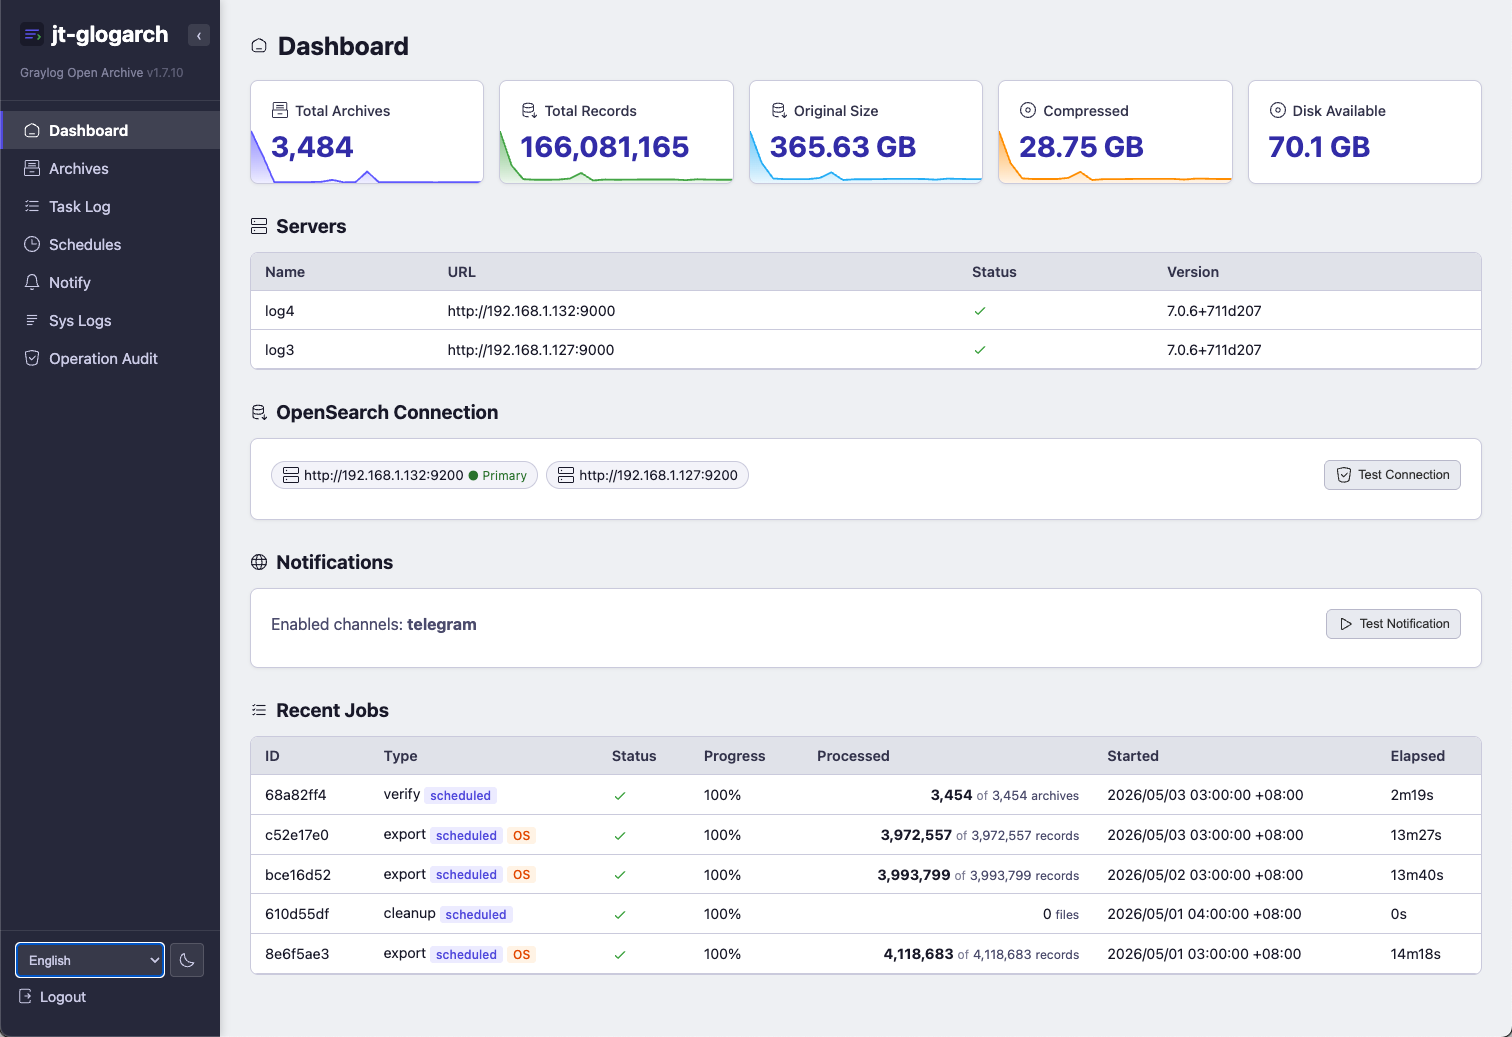
The home page shows five key statistics with sparkline charts:
| Card | What it shows |
|---|---|
| **Total Archives** | Number of completed archive files |
| **Total Records** | Total log records archived |
| **Original Size** | Pre-compression total size |
| **Compressed** | On-disk total size (after gzip) |
| **Disk Available** | Free space on the archive volume |
The sparkline behind each card shows the last 30 days of daily activity.
Hover over any bar to see exact values for that day.
Below the cards:
- **Servers** — Connected Graylog servers and their status
- **OpenSearch** — Connection test status (right-click a host to make it primary)
- **Notifications** — Active notification channels with a "Send test" button
- **Recent Jobs** — Last 5 jobs with progress, source/mode badges, elapsed time
### Archive List
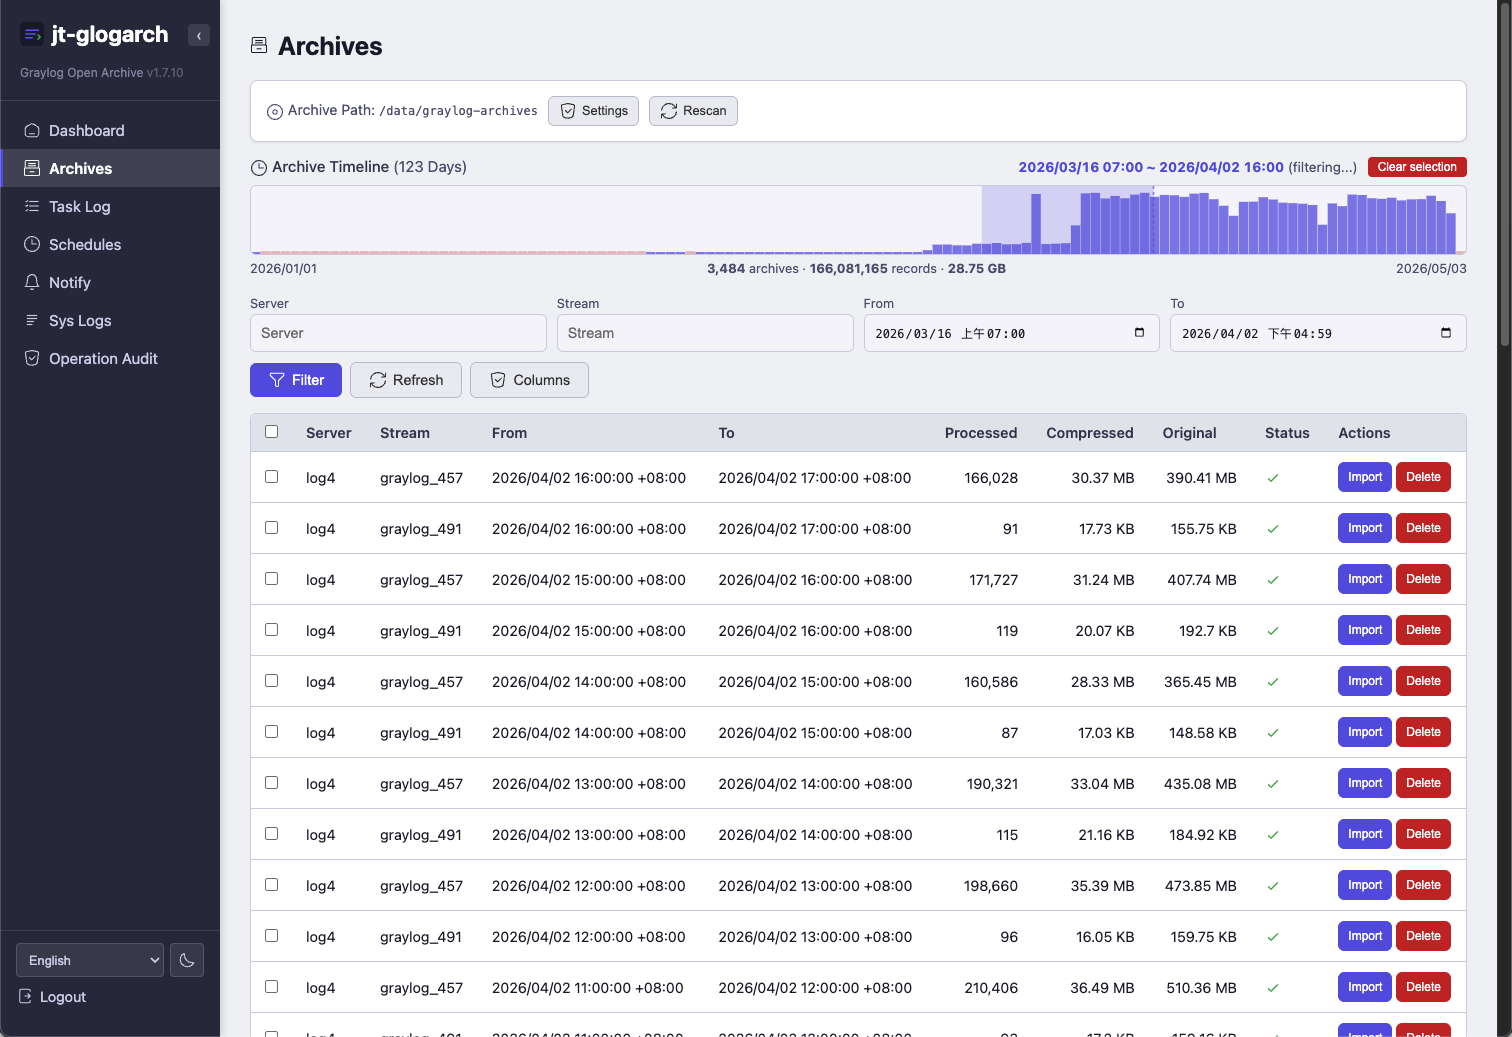
This is where you manage all your archives.
**Top section:**
- **Archive Path** — Current storage location with "Settings" (change path) and "Rescan" (sync from disk)
- **Archive Timeline** — A daily distribution chart showing the entire history of your archives
- Bar height = number of records that day
- **Drag** to select a time range (hour-level precision) — auto-fills the filter and applies it
- **Hover** any column to see day, archives, records, size
- Red marks = days with no archives (gaps)
- Click **Clear selection** to reset
**Filters:** Server, Stream, Time From, Time To. Click "Filter" to apply.
**Table:**
- Sortable columns (server-side sort, persists across pages)
- **Batch select** — Use checkboxes, Shift+select-all for cross-page batch
- **Per-row actions:** Import (single), Delete
**Batch actions** (when rows are selected):
- **Batch Import** — Opens import modal with GELF settings + flow control
- **Batch Delete** — Removes files from disk and marks records as deleted
**Column settings** — Toggle columns on/off (saved in localStorage)
### Job History
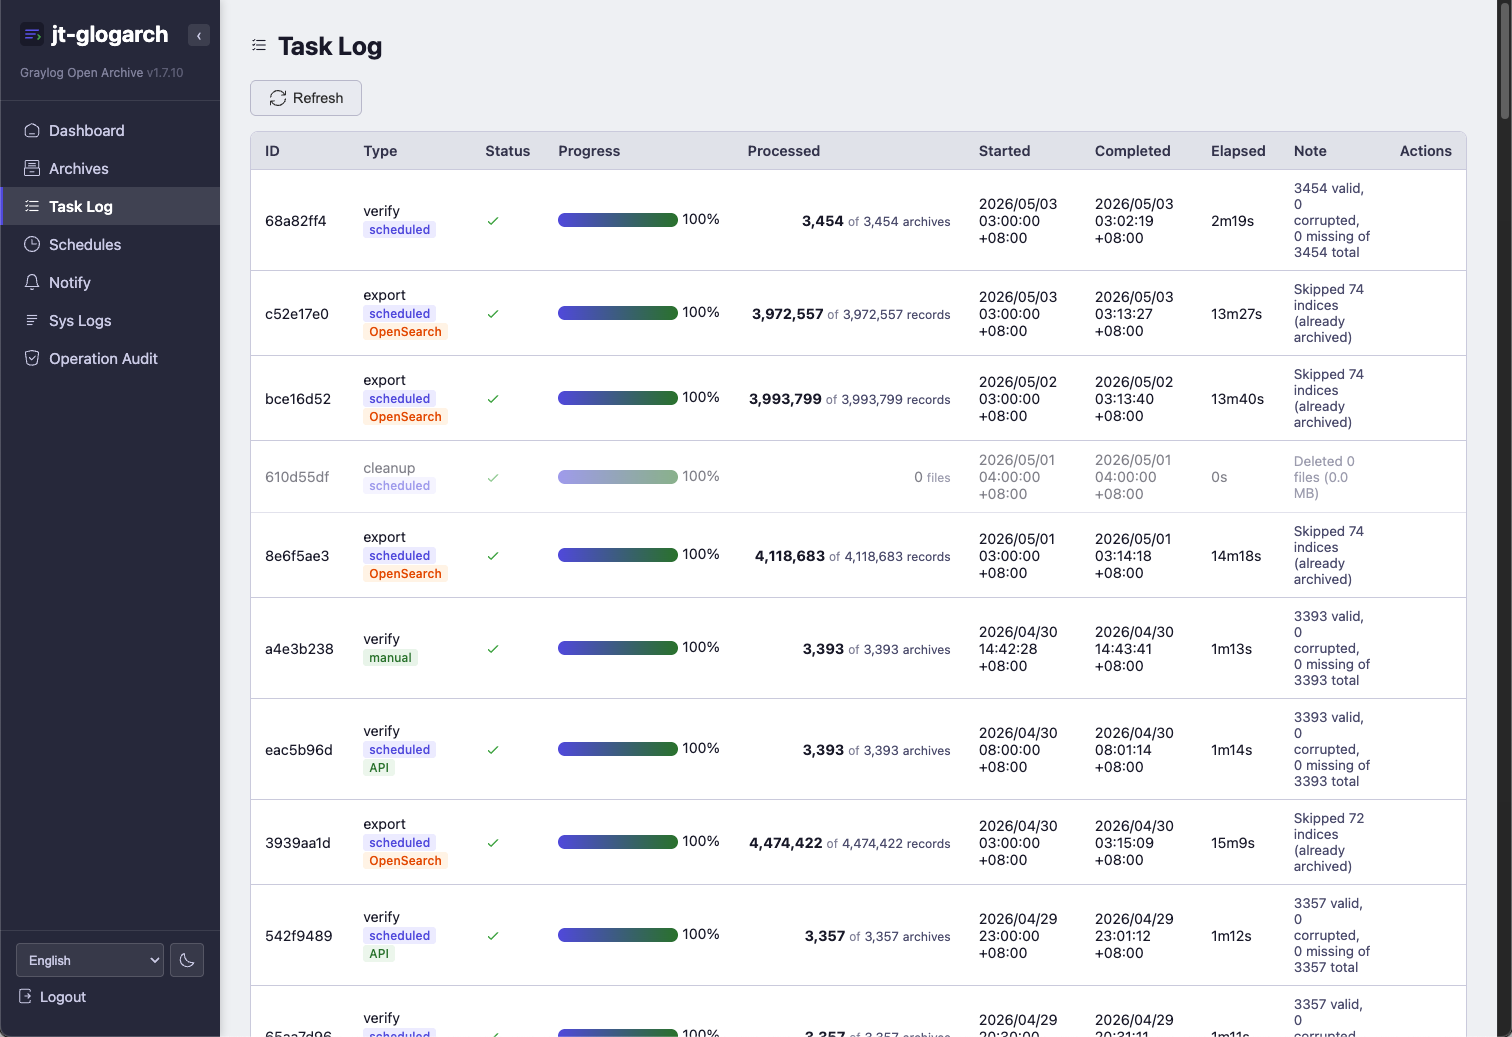
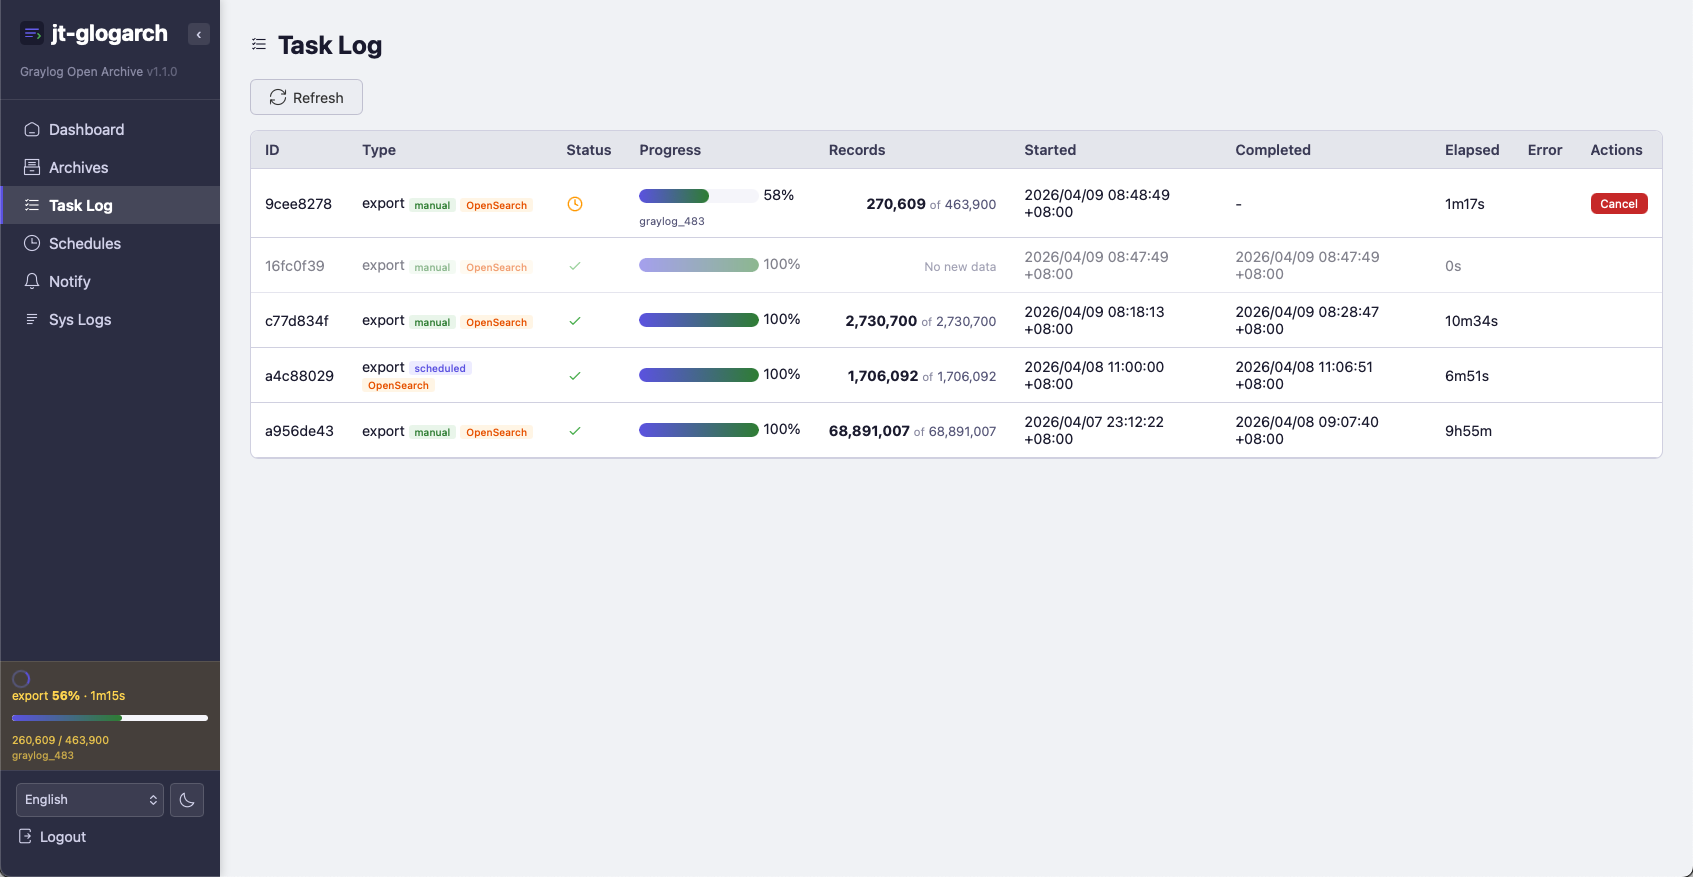
Shows all export, import, cleanup, and verify jobs.
| Column | Description |
|---|---|
| ID | First 8 chars of job UUID |
| Type | export / import / cleanup / verify with badges (manual/scheduled, API/OpenSearch) |
| Status | running / completed / failed / cancelled |
| Progress | Inline bar + percentage; running jobs show current chunk/index |
| Records | done / total with bold/dimmed format |
| Started | Job start time |
| Completed | Job end time |
| Elapsed | Duration |
| Error | Error message if failed |
| Actions | Cancel button for running jobs |
Jobs that completed with **0 new records** are dimmed and show "no new data" — this
is normal for scheduled exports when nothing new accumulated.
### Schedules
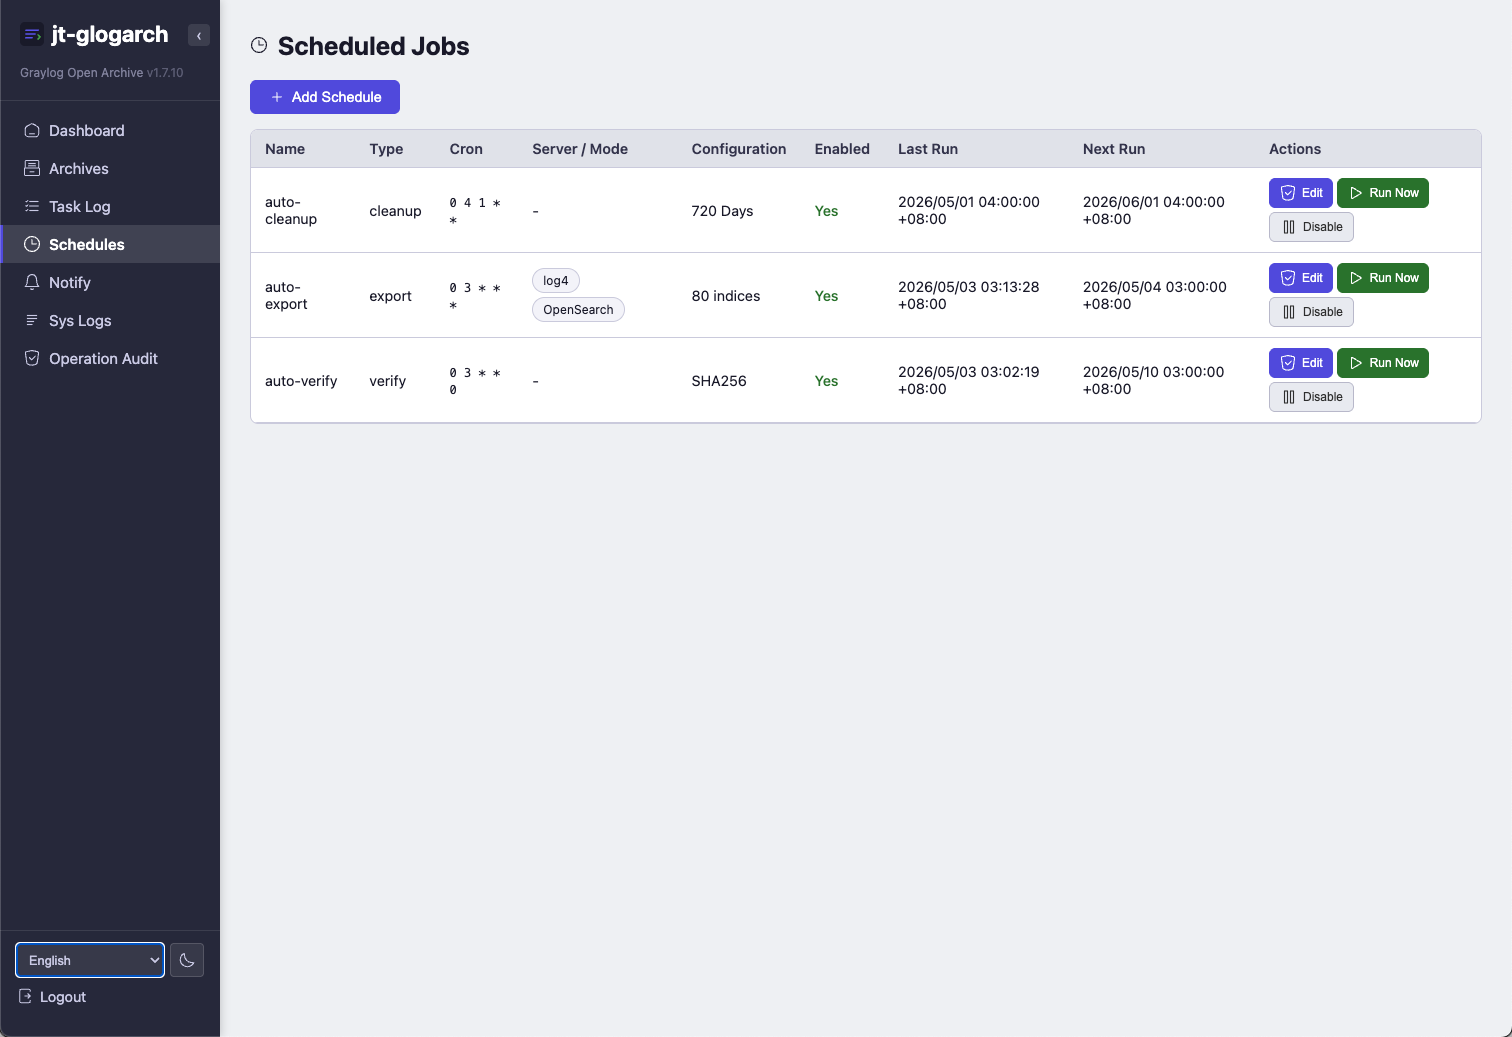
Manage automated jobs. Three types are supported:
#### Export Schedule
Name: auto-export
Type: Export
Frequency: Daily 03:00
Mode: OpenSearch Direct
Retention: Last 60 indices ← Or "N days" for API mode
For OpenSearch mode, you choose **how many recent indices** to export. The
"available indices" timeline at the bottom shows which indices exist (and which
is the active write index, which is always excluded).
#### Cleanup Schedule
Name: auto-cleanup
Type: Cleanup
Frequency: Monthly day 1 04:00
Retention: 1095 days
Removes archive files older than the retention period and updates the DB.
#### Verify Schedule
Name: auto-verify
Type: Verify
Frequency: Monthly first Saturday 03:00
Re-verifies SHA256 checksum of all archives. Failed checksums are marked as
**corrupted** in the DB and shown in the Archive List with a red warning icon.
**Run Now button** — All schedule types support manual immediate execution.
For export jobs, the inline progress is shown directly on the schedule row.
### Notification Settings
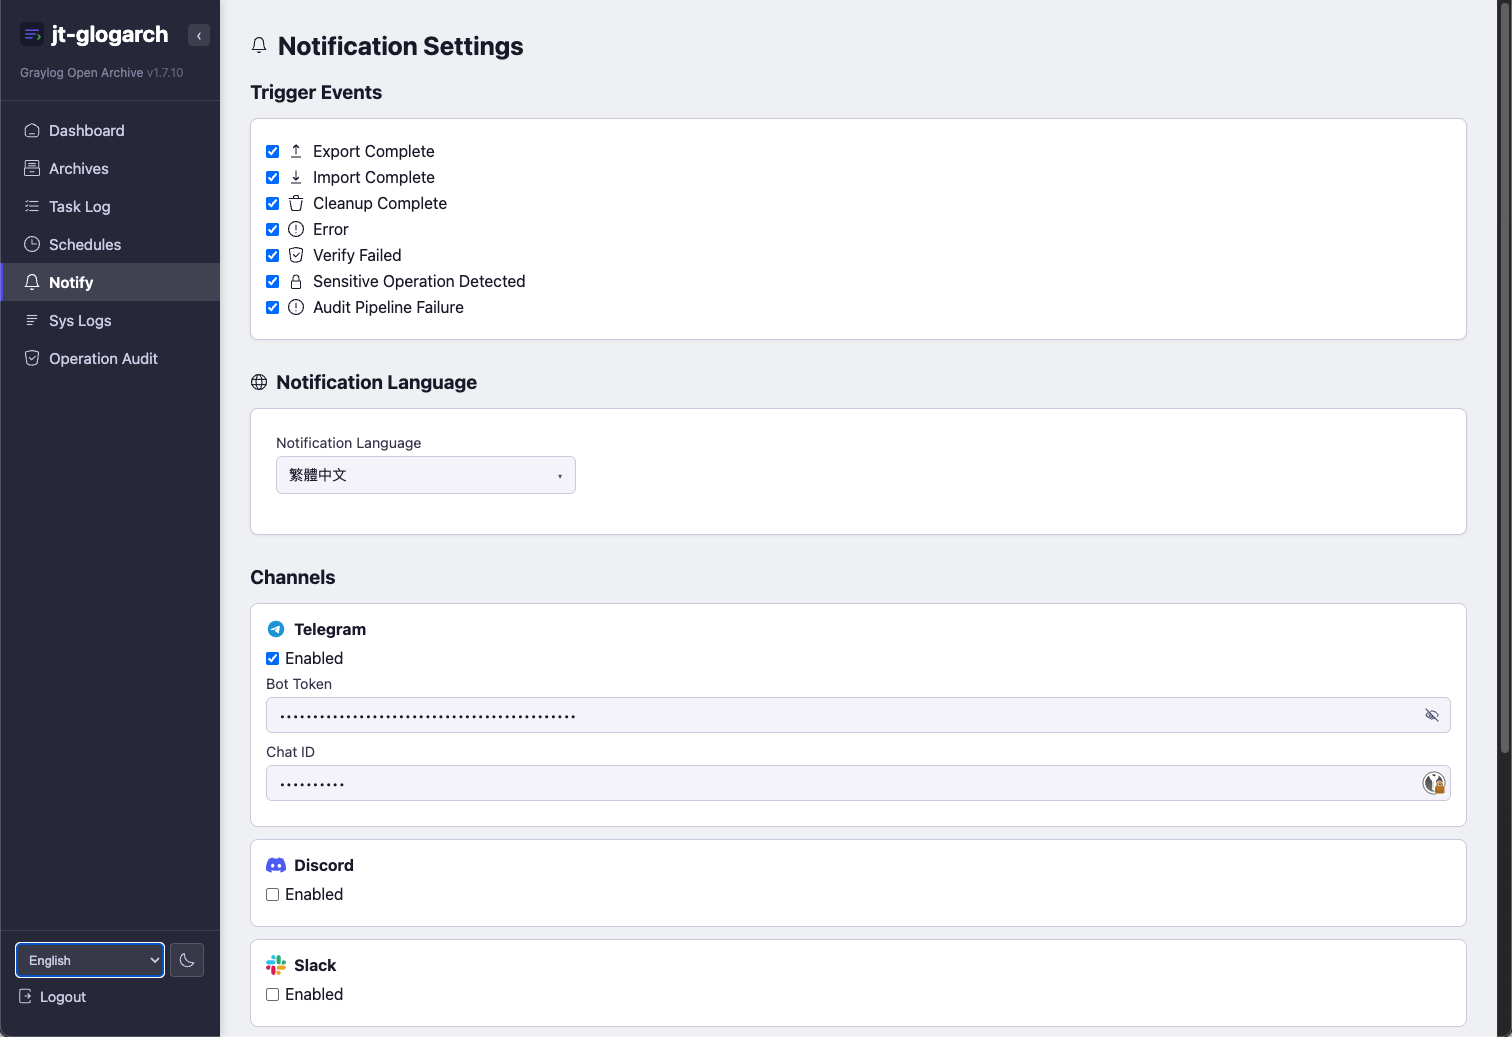
Configure where notifications are sent.
**Notification Language** — Choose between English and 繁體中文. This applies to
**all** notification messages (test notification, export complete, errors, etc.).
**Trigger Events** — Check which events should send notifications:
- Export complete
- Import complete
- Cleanup complete
- Error
- Verify failed
- Sensitive operation (Operation Audit — user deletion, auth changes, etc.)
- Audit alert (Operation Audit — no syslog received for 10+ minutes)
**Channels** — Configure each channel. **Unchecking "Enabled"** automatically
collapses the channel's settings to keep the page tidy.
| Channel | Required Fields |
|---|---|
| Telegram | Bot token, Chat ID |
| Discord | Webhook URL |
| Slack | Webhook URL |
| Microsoft Teams | Webhook URL |
| Nextcloud Talk | Server URL, Token, Username, Password |
| Email (SMTP) | Host, Port, TLS, User, Password, From, To |
Click **Send test notification** to verify all enabled channels work. Test messages
are sent in the configured language.
### System Logs
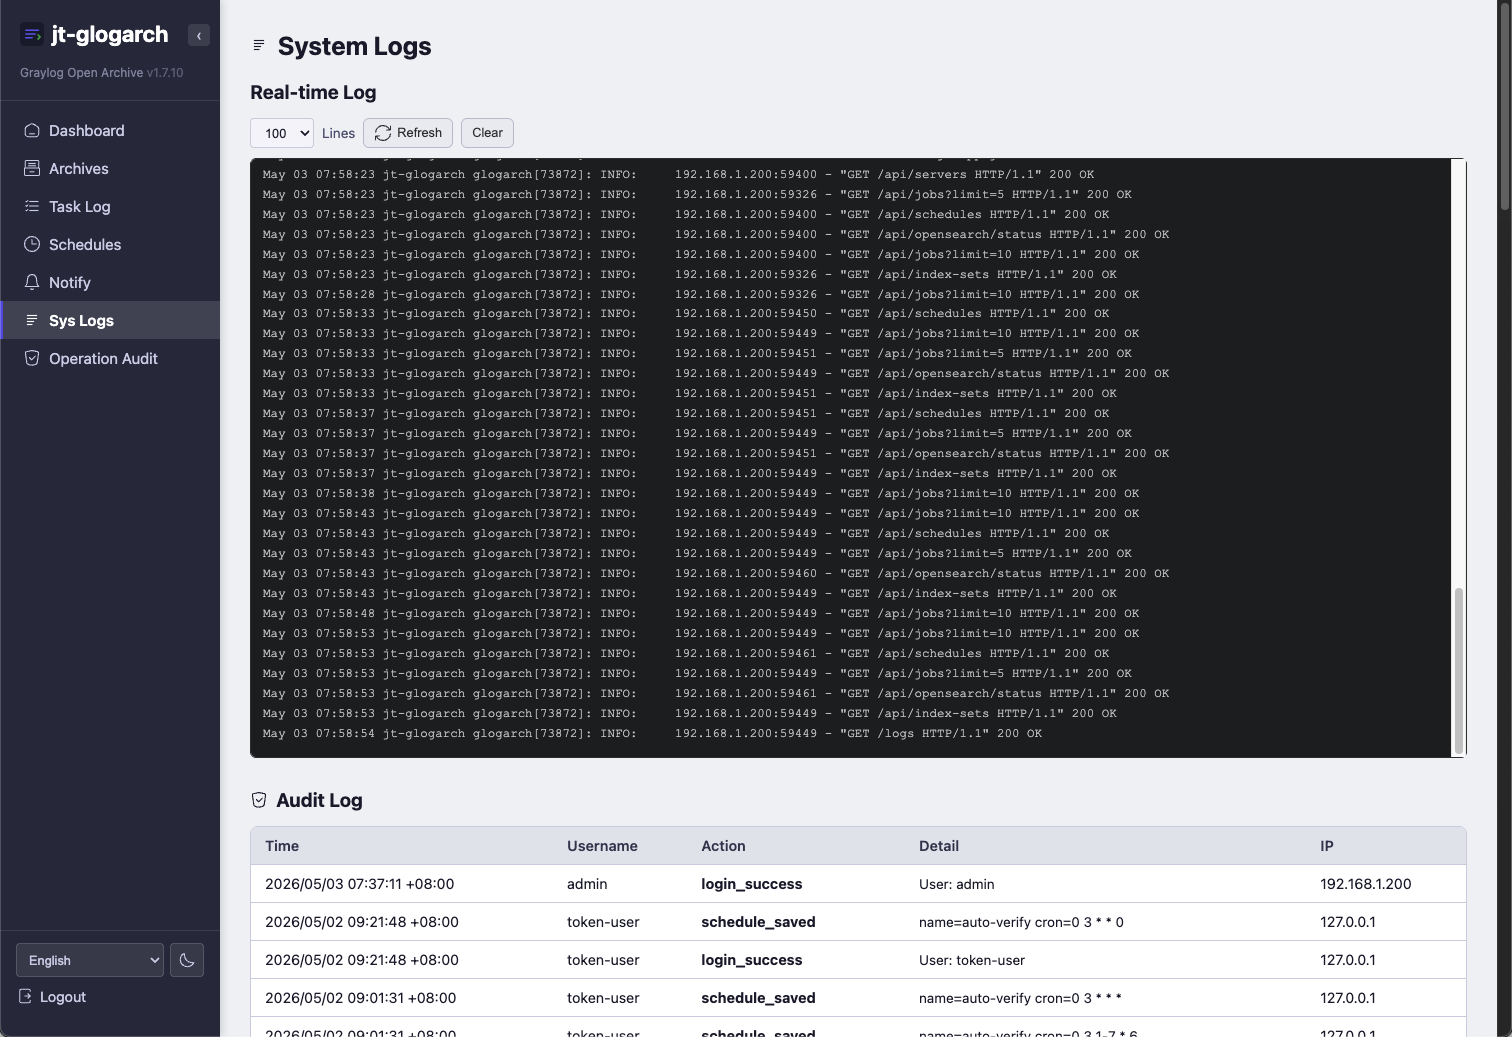
Real-time tail of `journalctl -u jt-glogarch` plus an audit log of user actions
(login, export started, settings saved, etc.).
### Operation Audit
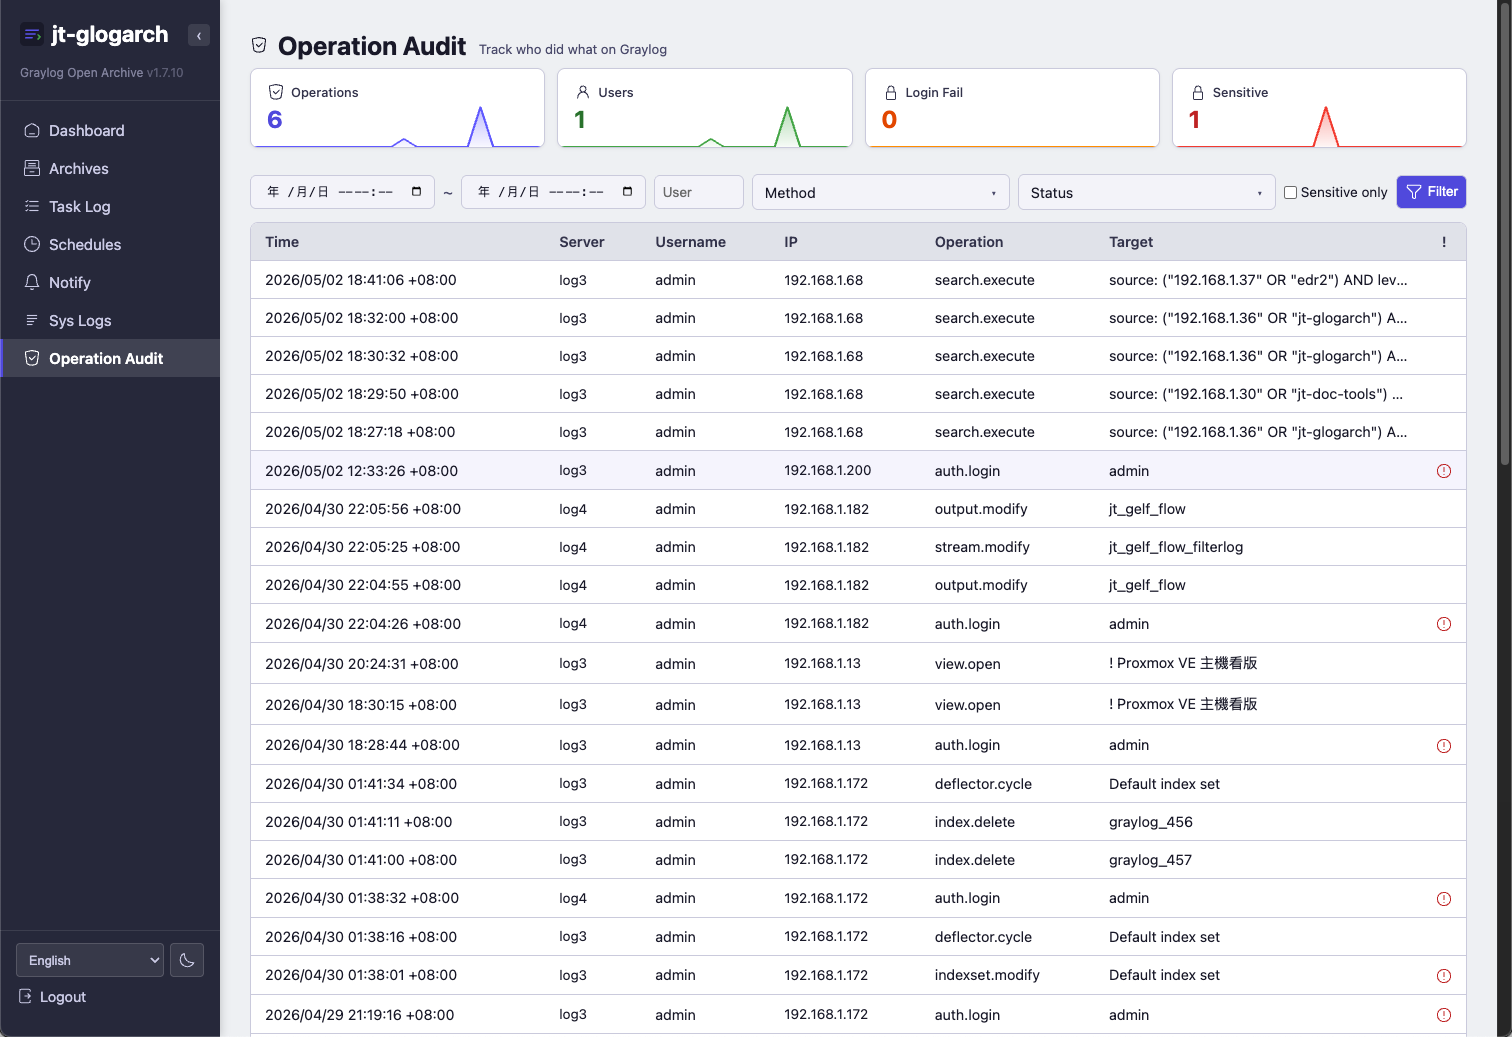
Track who did what on Graylog — compliance-grade auditing independent from Graylog itself.
**Key advantages:**
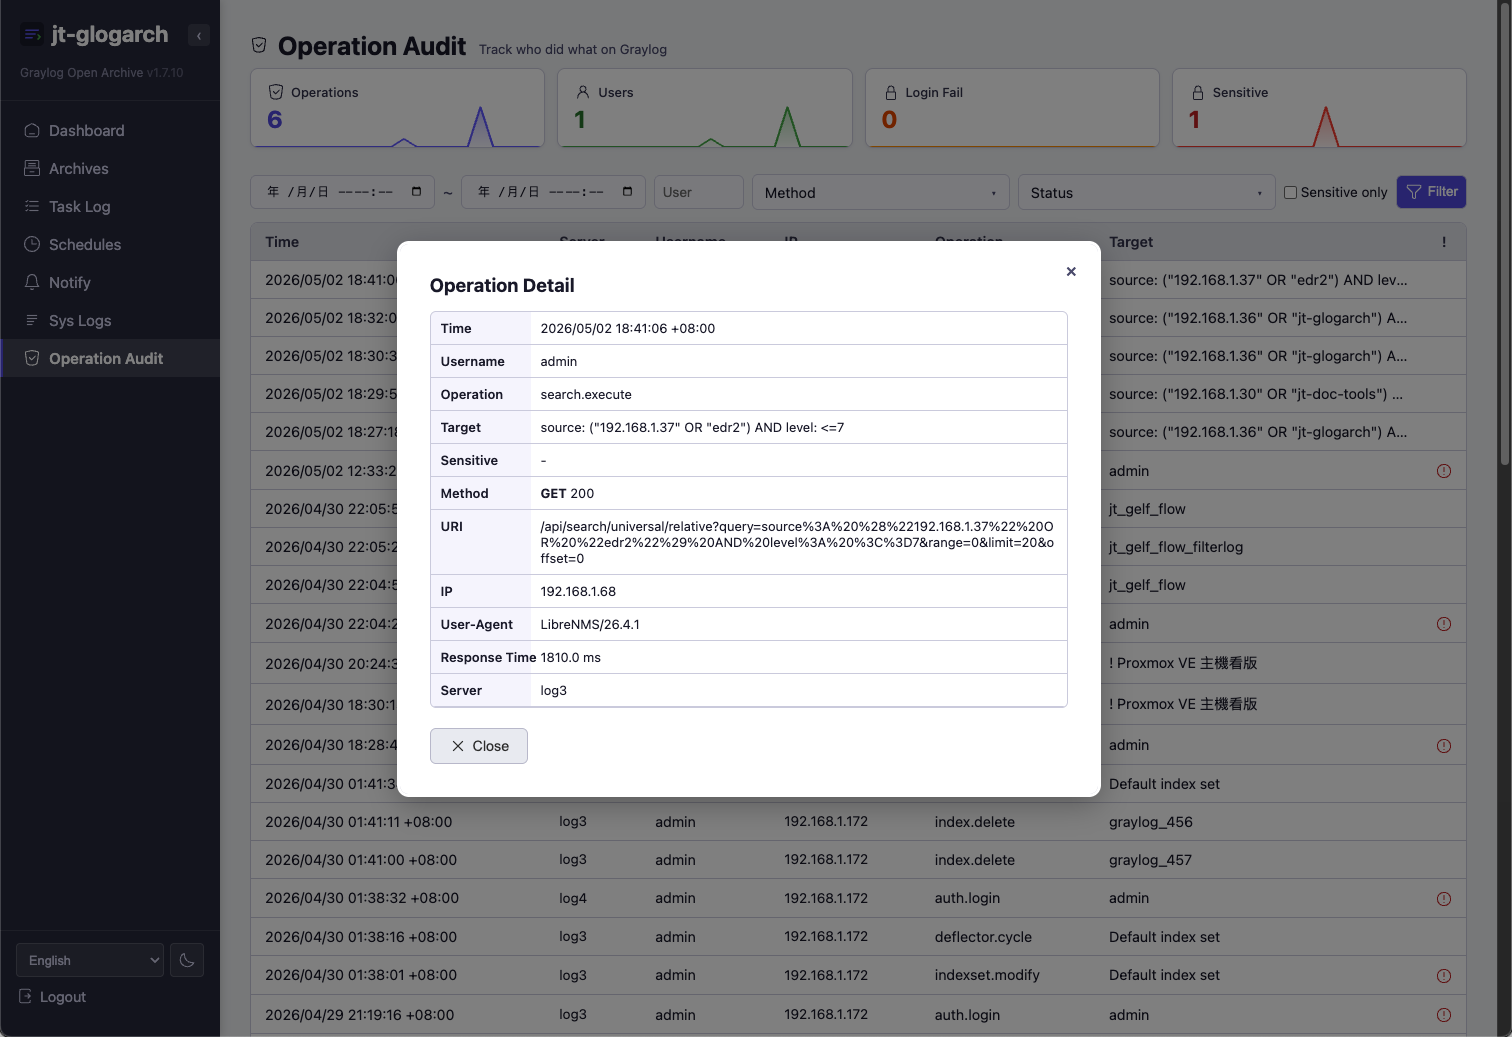
- Records full request body — you can see exactly what was changed, what query was searched, what account was created
- Audit records stored independently from Graylog — administrators cannot delete their own audit trail
**How it works:**
- nginx on each Graylog node sends JSON access logs via UDP syslog to jt-glogarch (port 8991)
- jt-glogarch receives, parses, classifies into 60+ operation types, resolves usernames, and stores in SQLite
- IP allowlist auto-built from Graylog Cluster API — zero configuration needed
- Only meaningful operations are recorded; background polling, static assets, metrics are automatically filtered
**Page layout:**
1. **Status bar** — Listener status (running/disabled), UDP port, last received timestamp, record count, retention days, heartbeat alert
2. **Stat cards** (last 24h) — Total operations, unique users, login failures, sensitive operations, with sparkline trends
3. **Filter bar** — Time range, username, HTTP method, URI pattern, status code, sensitive only toggle
4. **Results table** — Time, server, username, method (color-coded badge), URI, status (color-coded), operation type, target name (human-readable resource name), sensitive marker
5. **Detail modal** — Click any row to see full detail including formatted JSON request body with syntax highlighting and copy button
6. **Settings section** — nginx configuration snippet with copy button, listener toggle
**Username resolution chain:**
| Method | Description |
|--------|-------------|
| Basic Auth | Username extracted from `Authorization` header |
| Token Auth | Resolved via per-user Graylog token API, cached by prefix |
| Session Auth | Session ID from `Authorization` header, resolved via Graylog Sessions API |
| Cookie Session | Session ID from `$cookie_authentication` cookie in nginx log |
| IP Cache | Falls back to client IP → last known user mapping |
| Single User | When only one human account exists, auto-attributed |
**Target name resolution:**
Resource IDs in URIs are automatically resolved to human-readable names via the Graylog API cache (refreshed every 6 minutes):
inputs, streams, index sets, dashboards/views, pipelines, pipeline rules, event definitions, event notifications, lookup tables/adapters/caches, content packs, authentication services, outputs, users, roles.
**Sensitive operation alerts:**
When `op_audit.alert_sensitive` is enabled, sensitive operations (user deletion, stream deletion, authentication changes, system shutdown, etc.) trigger notifications via all configured channels.
**Heartbeat monitoring:**
If the listener is running and Graylog is reachable but no syslog has been received for 10+ minutes, an alert is triggered — indicating a silent failure in the audit pipeline (e.g., nginx misconfiguration, network issue).
**Config:**
op_audit:
enabled: true # enabled by default
listen_port: 8991 # UDP syslog port
retention_days: 180 # independent from archive retention (default 180 days)
max_body_size: 65536 # max request body size to store (64KB)
alert_sensitive: true # send alerts on sensitive operations
**Retention:** Audit records are automatically cleaned up by the scheduled cleanup job. The `op_audit.retention_days` setting (default 180 days) is independent from the archive retention policy (default 1095 days). Estimated storage: ~2 KB per record, ~360 MB per year at 1000 operations/day.
## Import (Restore) Workflow
The import flow is built around a **compliance pipeline** designed to guarantee
**zero message loss + zero indexer failures**. Key safeguards (all run automatically
before any GELF send):
1. **Cluster health check** — refuses to import into a RED OpenSearch cluster
2. **GELF input verification** — must exist on the configured port and be RUNNING
3. **Capacity check** — calculates how many indices the import will create from
the rotation strategy and aborts if the target's deletion-based retention
policy would erase data we just wrote
4. **Field mapping conflict resolution** — reads each archive's recorded `field_schema` from the DB, finds fields where archives have intra-conflict types or where the target's current mapping is numeric while archives have string values, and **automatically pins those fields as `keyword` on the target** via Graylog's custom field mappings API
5. **OpenSearch field-limit override** — automatically PUTs an OpenSearch index
template that raises `index.mapping.total_fields.limit` to 10000, eliminating
the rotation failure that hits Graylog's default 1000-field limit when many
custom mappings are set
6. **Index rotation** — issues a single deflector cycle so the new mappings
take effect on the new active write index
7. **GELF send** with TCP backpressure + Graylog journal monitoring (auto-pause
when uncommitted entries exceed 500K)
8. **Post-import reconciliation** — queries Graylog's indexer-failures count
and compares against the pre-import baseline; any non-zero delta is recorded
as a compliance violation in the job's `error_message`
### Required: Target Graylog API credentials
Since v1.3.0, the import dialog **requires** a Graylog API URL + token (or
username/password). The same credentials power preflight, journal monitoring,
and reconciliation. There is no longer a "no monitoring" option.
### Two import modes (since v1.3.0)
The import dialog has a **mode selector** at the top:
| Mode | Speed | Goes through | Use when |
|---|---|---|---|
| **GELF (Graylog Pipeline)** (default) | ~5,000 msg/s | Graylog Input → Process buffer → Output buffer → OpenSearch | You need Graylog rules (pipelines, extractors, stream routing, alerts) to run on the imported data |
| **OpenSearch Bulk** | ~30,000-100,000 msg/s | Direct OpenSearch `_bulk` API | You're restoring already-processed historical data and want maximum speed |
**Bulk mode trade-offs:**
- ✅ **5-10x faster** (no GELF framing, no Graylog journal write, no buffer pressure)
- ✅ **Per-document precise reconciliation** from `_bulk` response (no reliance on Graylog's circular failure buffer)
- ✅ **No alert side-effects** (messages don't go through stream routing)
- ❌ **Skips ALL Graylog processing rules** — pipelines, extractors, stream routing, alerts. The data lands in OpenSearch as-is from the archive.
- ❌ **Needs OpenSearch credentials** in addition to the Graylog API ones (auto-detected by default).
**Where bulk-imported data goes:**
- Bulk mode writes to a **dedicated index pattern** (default `jt_restored_*`),
not the live `graylog_*` indices. This keeps restored data fully isolated from
live traffic.
- Each daily index is named `_YYYY_MM_DD` based on the message
timestamp. So importing 4/7 + 4/8 produces `jt_restored_2026_04_07` and
`jt_restored_2026_04_08`.
- During preflight, jt-glogarch automatically:
1. Writes an OpenSearch index template for `_*` with
`total_fields.limit: 10000` and all string-typed fields pinned as
`keyword` (avoids type-conflict rejections)
2. Pre-creates each daily index (Graylog clusters typically have
`action.auto_create_index = false`)
3. **Auto-creates a Graylog Index Set** for the prefix so the restored
data is searchable from the Graylog UI immediately. No manual
"System / Indices" configuration needed.
**Deduplication:**
- Archives preserve `gl2_message_id`, which bulk mode uses as the OpenSearch
document `_id`. Re-importing the same archive overwrites existing documents
instead of creating duplicates.
- Two other strategies are available: `none` (allow duplicates) and `fail`
(abort if a duplicate is detected).
### Step 1 — Select Archives
Go to **Archive List**, optionally filter by time range or stream, then select
archives via checkboxes. Click **Batch Import**.
### Step 2 — Configure GELF Target
GELF Host: 192.168.1.10
Port: 32202 ← Default for TCP. Switches to 32201 if you select UDP.
Protocol: TCP ← Default. Reliable, has backpressure
UDP ← Faster but can drop messages on buffer overflow
Target Name: log-recovery
### Step 3 — Set Initial Speed
Use the **Batch Delay (ms)** slider to set how long to wait between batches.
- 5-50ms = aggressive (use only with monitoring)
- 100ms = balanced default
- 500-1000ms = conservative
### Step 4 — Provide Target Graylog API Credentials (REQUIRED)
This is **mandatory** since v1.3.0. The same credentials are used for preflight,
journal monitoring, and post-import reconciliation.
Graylog API URL: http://192.168.1.10:9000
API Token: YOUR_TOKEN ← either Token...
— OR —
Username: admin ← ...or Username + Password
Password: ******
### Step 5 — Start & Monitor
After clicking **Start Import**, the modal switches to a control panel:
- **Pause / Resume** — Halt the import without losing progress
- **Speed slider** — Adjust delay in real-time without restarting
- **Journal badge** — Shows current Graylog journal status:
- 🟢 normal — full speed
- 🟡 slow — uncommitted entries 100K-500K, delay tripled
- 🟠 paused — uncommitted entries 500K-1M, auto-pause 30s
- 🔴 stop — uncommitted entries >1M, import aborted + admin notification
### Auto-throttling Rules
| Journal `uncommitted_entries` | Action |
|---|---|
| < 100,000 | Normal speed (your set delay) |
| 100,000 — 500,000 | Slow mode (3× delay) |
| 500,000 — 1,000,000 | Pause 30 seconds |
| > 1,000,000 | Stop import + send notification |
## Performance & Tuning
### Hardware sizing (co-located single VM)
The most common deployment puts jt-glogarch on the **same VM** as the target
Graylog + OpenSearch (+ MongoDB). RAM is the binding constraint: two JVMs plus
the page cache OpenSearch depends on will exceed a small box, and a heavy import
then tips it into **swap** (imports crawl) or the **OOM killer** (jobs die as
"Interrupted by service restart").
**jt-glogarch computes the recommendation for your own box** — see the
**Hardware Sizing** card on the Dashboard (or `GET /api/sizing`). It reads
`/proc/meminfo`, the CPU count and the running Graylog/OpenSearch `-Xmx`, and
sizes against your archive count. Rough guide:
| Deployment | RAM | Cores |
|---|---|---|
| Archive-only node (Graylog/OpenSearch elsewhere) | 4 GB | 4 |
| Co-located, light (< 10K archives) | 16 GB | 8 |
| Co-located, heavy (≥ 10K archives / large imports) | **32 GB** | **16+** |
Rules that matter more than the table:
- **Never let the box swap.** Sustained swap use means imports will crawl — add
RAM or lower the heaps. It is the single best predictor of a bad import.
- **Both JVM heaps together ≤ 50% of RAM.** OpenSearch needs file cache roughly
equal to its heap (Lucene reads through the page cache); starving it is why
indexing and search crawl even when there appears to be free RAM.
- **Pin `-Xms` = `-Xmx`** on both JVMs, each ≤ 31 GB (compressed oops).
- Leave 2–3 GB headroom for MongoDB, the kernel and agents.
jt-glogarch itself is modest (~200 MB steady — it streams archives rather than
loading them) and throttles automatically on target backpressure and low host
memory, shrinking its own batch size when RAM gets tight instead of stopping.
### Benchmarks (with default config)
| Mode | batch_size | delay | Speed | 1 Hour (~175K records) |
|---|---|---|---|---|
| Graylog API | 1,000 | 5ms | ~730 rec/s | ~4 minutes |
| OpenSearch Direct | 10,000 | 2ms | ~3,300 rec/s | ~1 minute |
### When to use which mode
**Use Graylog API mode when:**
- You need stream-level filtering
- Your OpenSearch is locked down (no direct access)
- You want JVM memory protection (auto-stop at 85% heap)
**Use OpenSearch Direct mode when:**
- You need to export large historical volumes quickly
- You have OpenSearch credentials
- You want index-level granularity
### Tuning Tips
**For Graylog API mode** — If your Graylog cluster has plenty of headroom:
export:
batch_size: 2000 # Default 1000
delay_between_requests_ms: 0 # Default 5ms
jvm_memory_threshold_pct: 90.0
**For OpenSearch Direct mode** — Already aggressive by default. You can push
batch_size to 20000+ on a beefy OpenSearch cluster.
## CLI Reference
The CLI is provided for automation and scripting. The Web UI is the primary
interface for day-to-day operations.
glogarch --help
| Command | Description |
|---|---|
| `glogarch server` | Start the Web UI + scheduler (this is what systemd runs) |
| `glogarch export` | Manual export (`--mode api|opensearch --days 180`) |
| `glogarch import` | Import archives (`--archive-id N --target-host HOST`) |
| `glogarch list` | List archives with filters |
| `glogarch verify` | Verify all archives — SHA256, plus keyed HMAC (reports `TAMPERED`) when integrity is enabled |
| `glogarch cleanup` | Remove expired archives |
| `glogarch integrity-init` | Generate the HMAC key for tamper-evidence (optional feature) |
| `glogarch integrity-seal` | Seal existing archives with an HMAC (compute + ledger) |
| `glogarch integrity-manifest` | Export the integrity ledger (hashes) for off-box safekeeping |
| `glogarch status` | Show system status |
| `glogarch schedule` | Manage scheduled jobs |
| `glogarch config` | Print a config template |
### Example: One-shot CLI export
sudo -u jt-glogarch glogarch export \
--mode opensearch \
--days 30
### Example: Restore archives from CLI
**GELF mode (default, goes through Graylog pipeline):**
sudo -u jt-glogarch glogarch -c /opt/jt-glogarch/config.yaml import \
--archive-id 42 \
--target-api-url http://192.168.1.20:9000 \
--target-api-username admin \
--target-api-password 'YOUR_PASSWORD' \
--target test-restore
**OpenSearch Bulk mode (5-10x faster, skips Graylog processing):**
sudo -u jt-glogarch glogarch -c /opt/jt-glogarch/config.yaml import \
--archive-id 42 \
--mode bulk \
--target-api-url http://192.168.1.20:9000 \
--target-api-username admin \
--target-api-password 'YOUR_PASSWORD' \
--target-index-pattern jt_restored \
--dedup-strategy id \
--target test-restore
In bulk mode, the OpenSearch URL is auto-detected (`port 9000 → 9200`).
Pass `--target-os-url`, `--target-os-username`, `--target-os-password`
to override.
**Time-range bulk import:**
sudo -u jt-glogarch glogarch -c /opt/jt-glogarch/config.yaml import \
--from 2026-04-07 --to 2026-04-09 \
--mode bulk \
--target-api-url http://192.168.1.20:9000 \
--target-api-username admin \
--target-api-password 'YOUR_PASSWORD' \
--target full-restore
## Troubleshooting / FAQ
### Cleanup deletes far earlier than my retention setting — or the disk fills up
`retention.retention_days` defaults to **1095 (3 years)**, which almost no archive
disk can actually hold. Whichever limit is reached first wins, and the loser is
silent:
- **Disk too small for the policy.** At a measured ~557 GB/month, three years
needs ~19.6 TB. On a 2.8 TB disk the cleanup job effectively expires data at
~5 months — nowhere near the configured policy, and nothing used to say so.
The Dashboard's **Hardware Sizing** card now reports exactly this: what the
configured retention needs, how many months the disk really holds, and a
warning when they disagree. Either expand the disk or lower `retention_days`
so the policy is honest.
- **Check what is actually in force.** The Schedules page shows the cleanup
schedule's own `retention_days`. Before v1.13.56 that number was displayed but
never applied — the value from `config.yaml` was used instead. On upgrade, a
displayed value SHORTER than the one really in force is reconciled to the value
in force (logged as a warning), so the upgrade cannot delete archives the
previous version was keeping. Set it again in the UI if you do want the shorter
retention.
The default is deliberately left at 1095: lowering it would silently shorten
retention for every site that never set it explicitly, and the next cleanup run
would delete data those sites still expect to have.
### Service won't start after an OS upgrade — `ModuleNotFoundError: No module named 'glogarch'`
An OS major upgrade (e.g. **Ubuntu 22.04 → 24.04**) changes the system Python
(3.10 → 3.12). Packages are installed per-Python-version, so the old install is
left behind and the service can't import `glogarch`. This affects any
pip-installed app, not just this one. **Fix: re-run the installer** — it
reinstalls under the new Python:
sudo bash /opt/jt-glogarch/deploy/install.sh
(On 24.04 the installer auto-retries with `--ignore-installed` if pip aborts on a
Debian-managed dependency such as PyYAML.)
### Can't reach Graylog — how do I log in / set an admin password?
On first run with no servers configured, opening the Web UI redirects to the
**setup wizard**. Its order is ① Graylog server → ② OpenSearch (optional) →
③ archive path → ④ **backup admin account** → ⑤ done; the local admin password
you set in the last step is the `localadmin` account. You can also generate the
hash manually:
sudo -u jt-glogarch glogarch hash-password # put the hash in config.yaml → web.localadmin_password_hash
You normally sign in with your Graylog account; `localadmin` works even when
Graylog is offline.
### How do I factory-reset (re-initialize)?
Three things are stored **independently** — know which you're clearing:
| Item | Location | Contents |
| --- | --- | --- |
| Settings | `/opt/jt-glogarch/config.yaml` | connections, schedules, notifications, `localadmin` password, paths |
| Database | `/opt/jt-glogarch/jt-glogarch.db` | archive records, job history, audit |
| Archive files | `/data/graylog-archives/` | the actual log files (the real data) |
**Reset settings only, keep archives (most common):**
sudo systemctl stop jt-glogarch
sudo mv /opt/jt-glogarch/config.yaml /opt/jt-glogarch/config.yaml.bak # back up, then remove
sudo systemctl start jt-glogarch
On restart `servers` is empty → the Web UI redirects to the setup wizard (initial
state). Notes:
- **You must restart the service** — settings are cached in memory at startup, so
deleting the file without a restart does nothing (this is why it can look like
"deleting config.yaml had no effect").
- Search order is `/opt/jt-glogarch/config.yaml` → (else) `~/.jt-glogarch/config.yaml`
→ `/etc/jt-glogarch/config.yaml`; if another copy exists it loads that — remove it too.
- Your archive **files are untouched**. But the default DB path (`glogarch.db`)
may differ from your original, so the archive list can **look empty** — the old
DB and files are still there. After setting the archive path back in the wizard,
rebuild the DB from disk and the list returns:
sudo -u jt-glogarch glogarch db-rebuild
**Full wipe (also deletes archived data — irreversible):**
sudo systemctl stop jt-glogarch
sudo rm -f /opt/jt-glogarch/config.yaml
sudo rm -f /opt/jt-glogarch/jt-glogarch.db /opt/jt-glogarch/glogarch.db* # archive records, job history, audit
sudo rm -rf /data/graylog-archives/* # ⚠ this deletes the archived log files themselves!
sudo systemctl start jt-glogarch
### "Permission denied" when writing to `/data/graylog-archives/`
The service runs as the `jt-glogarch` user. Make sure the archive directory is owned by it:
sudo chown -R jt-glogarch:jt-glogarch /data/graylog-archives
### Web UI shows "Not authenticated" but I just logged in
Self-signed certificate issue. Browser may have rejected the cookie. Try:
1. Click "Advanced" → "Proceed to site" on the SSL warning
2. Open in incognito window
3. Or use a real certificate via Let's Encrypt
### Pip install shows `Successfully installed UNKNOWN-0.0.0`
Old `setuptools` cannot read `pyproject.toml` metadata. Fix:
pip install --upgrade setuptools wheel
rm -rf /opt/jt-glogarch/build /opt/jt-glogarch/*.egg-info
pip install --no-build-isolation --no-cache-dir --force-reinstall /opt/jt-glogarch
### Scheduled job didn't run at the expected time
`jt-glogarch` uses APScheduler, which **inherits the system timezone**. If your
system is set to UTC and you wrote `cron: "0 3 * * *"` thinking "3 AM local time",
it will actually fire at 03:00 UTC (e.g. 11:00 in Asia/Taipei).
**Check the system timezone:**
timedatectl
**Set it to your local timezone:**
sudo timedatectl set-timezone Asia/Taipei
sudo systemctl restart jt-glogarch
After restart, the scheduler picks up the new timezone. You can verify the next
fire time with:
python3 -c '
from apscheduler.triggers.cron import CronTrigger
from apscheduler.schedulers.asyncio import AsyncIOScheduler
from datetime import datetime
s = AsyncIOScheduler()
print("scheduler tz:", s.timezone)
t = CronTrigger.from_crontab("0 3 * * *", timezone=s.timezone)
print("next fire:", t.get_next_fire_time(None, datetime.now(s.timezone)))
'
### Scheduled export reports "0 records" for the OpenSearch mode
Most likely the resume point jumped past your indices. This was fixed in v1.0.0 —
OpenSearch mode now relies on per-chunk dedup instead of resume points to avoid gaps.
Make sure you're on v1.0.0+.
### API export pauses or stops due to JVM heap pressure
When using API mode, jt-glogarch monitors Graylog's JVM heap usage. If heap exceeds the threshold (default 85%), the export **pauses automatically** and waits up to 5 minutes for GC to recover. If heap drops below the threshold, the export resumes. If it stays high for 5 minutes, the export stops.
**Option 1 — Reduce query pressure** (no Graylog restart needed):
export:
batch_size: 300 # default 1000 — lower = less heap per query
delay_between_requests_ms: 100 # default 5 — higher = more time for GC
**Option 2 — Increase Graylog heap** (recommended if server has ≥16 GB RAM):
# Edit /etc/default/graylog-server (or graylog-server.conf)
GRAYLOG_SERVER_JAVA_OPTS="-Xms8g -Xmx8g"
sudo systemctl restart graylog-server
At 8 GB heap, the 85% threshold leaves ~1.2 GB headroom — enough for export + normal operations.
**Option 3 — Use OpenSearch Direct mode** (best for large exports):
OpenSearch mode bypasses Graylog entirely — zero JVM impact, 5× faster. Use this when your OpenSearch is directly accessible (not behind Graylog Data Node).
### Archive timeline shows red marks (gaps)
Red marks indicate days where no archives exist. This is informational. Run a
manual export with the appropriate time range to fill those gaps.
### Import is too slow / too fast
Use the **speed slider** in the import modal during the import. You can adjust
the batch delay in real-time. For very large imports, enable journal monitoring
so it auto-throttles.
### Verify reports archives as "corrupted"
Either the file was modified after archiving (rare) or there's bit-rot on the
storage. The corrupted archives can still be inspected manually, but they will
not pass integrity checks. Re-export the affected time range to replace them.
### Can I run two jt-glogarch instances against the same Graylog?
Yes, but use different archive paths. The DBs are independent.
### What's the difference between "stream" and "index"?
- **Stream** = a Graylog logical filter (e.g. "all auth logs")
- **Index** = an OpenSearch storage unit (rotated periodically)
API mode operates on streams. OpenSearch Direct mode operates on indices.
### Can I run jt-glogarch in Docker?
Not officially supported yet, but the project is a standard Python package
without OS-specific dependencies — a Dockerfile would be straightforward to add.
## License & Author
**License:** [Apache License 2.0](LICENSE)
**Author:** Jason Cheng — [Jason Tools](https://github.com/jasoncheng7115)
**Repository:** https://github.com/jasoncheng7115/jt-glogarch
### Third-Party Licenses
- [Iconoir](https://iconoir.com) — MIT License (embedded SVG icons)
- [FastAPI](https://fastapi.tiangolo.com) — MIT License
- [APScheduler](https://apscheduler.readthedocs.io) — MIT License
See [THIRD-PARTY-LICENSES.md](THIRD-PARTY-LICENSES.md) for details.
Alternative: run the on-disk script
sudo bash /opt/jt-glogarch/deploy/upgrade.sh Works too, but note that on the **first** run this executes the *old* script already on your box: - If you're on **< 1.10.4**, prefer the `curl | sudo bash` form above — the old script's git-stash step could disturb untracked files. From 1.10.4 the script ignores `config.yaml` / `certs/` / the DB before any git operation. - If you're on **< 1.10.0**, run it a **second** time so the now-updated script installs the PDF-report deps (look for `=== PDF Reports runtime deps (Chromium + CJK font) ===`). Upgrades between 1.10.x versions install everything in a single run.标签:Graylog, OISF, Python, 数据归档, 数据恢复, 无后门, 日志管理, 逆向工具