AhmedDAH1/log_threat_detector
GitHub: AhmedDAH1/log_threat_detector
一个基于Python的轻量级SIEM风格CLI工具,用于解析服务器日志以检测暴力破解、端口扫描及多向量关联攻击。
Stars: 0 | Forks: 0
# 🔍 Log Threat Detector


一个 SIEM 风格的威胁检测 CLI,用于解析 SSH、Apache 和 syslog 文件以检测暴力破解攻击、端口扫描和可疑活动——具备实时监控、电子邮件警报、关联多向量攻击的关联引擎,以及通过 AbuseIPDB 提供的实时威胁情报。
## 架构

## 演示

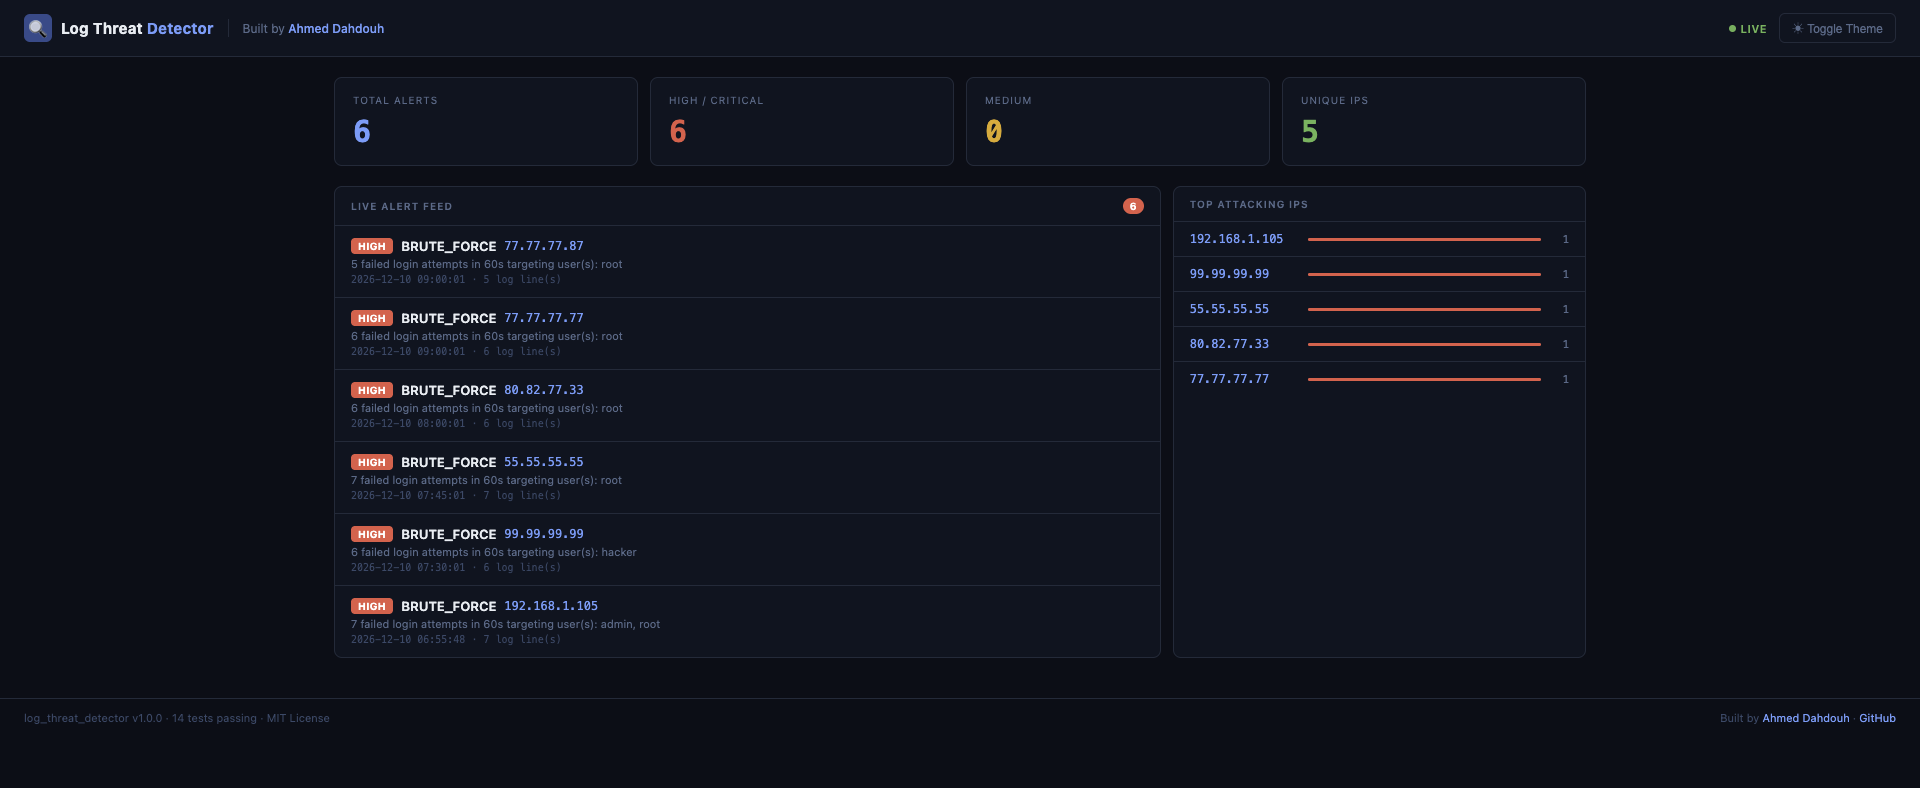
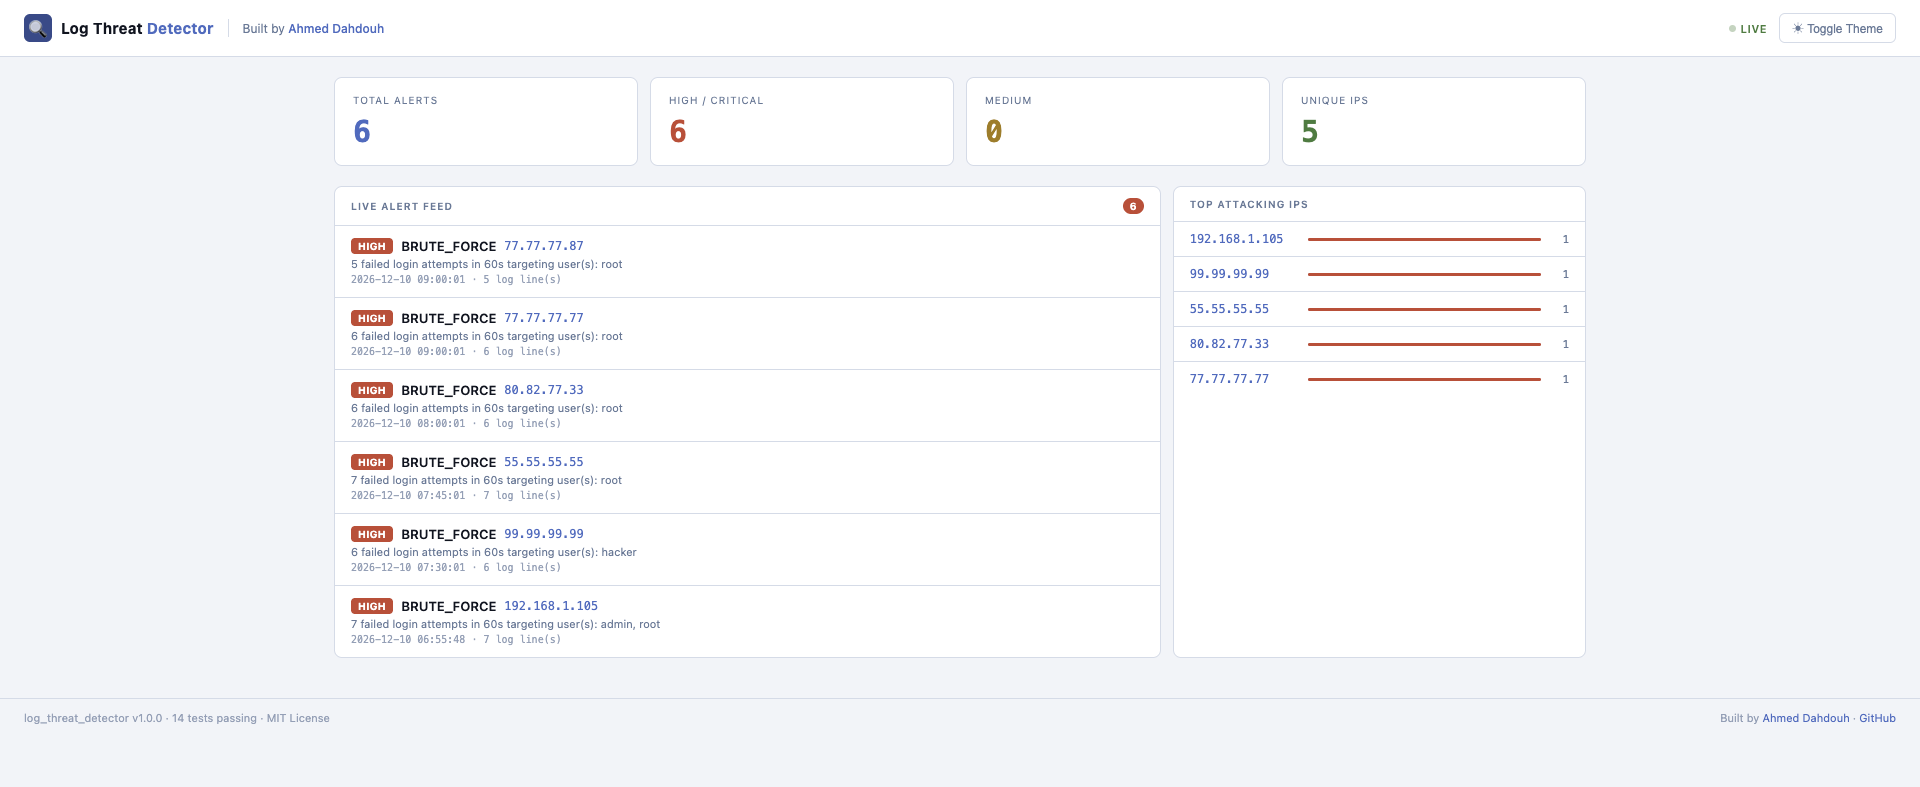
## Web 仪表板
使用 `--dashboard` 标志运行以启动实时 Web 界面:
```
python3 main.py --watch logs/ssh.log --dashboard
```
然后在浏览器中打开 http://localhost:5000。
## 功能
| 检测项 | 日志来源 | 严重程度 |
|---|---|---|
| 暴力破解登录尝试 | SSH 日志 | HIGH |
| 端口扫描检测 | Syslog (UFW/iptables) | HIGH |
| 可疑 User Agent | Apache 日志 | MEDIUM |
| 异常 / 高请求率 | Apache 日志 | MEDIUM |
| 多向量关联引擎 | 所有来源 | CRITICAL |
| AbuseIPDB 威胁情报 | 所有警报 | — |
| 实时监控 (`--watch`) | 任何受支持的日志 | — |
| 电子邮件警报 | 监视模式 (HIGH/CRITICAL) | — |
| 警报持久化 | SQLite 数据库 | — |
## 警报持久化 (SQLite)
所有检测到的警报都会自动保存到本地 SQLite 数据库 (`alerts.db`) 中。
这允许进行历史分析和跨多次运行的威胁跟踪。
### 查看警报历史
```
python3 main.py --history
```
## 关联引擎的工作原理
大多数日志解析器会触发独立的警报。该工具更进一步——它根据源 IP 对所有日志来源的警报进行分组,并检测协调的攻击模式:
| 模式 | 警报类型 | 触发条件 |
|---|---|---|
| 端口扫描 + 可疑 User Agent | `RECONNAISSANCE` | 同一 IP 探测端口并使用攻击工具 |
| 暴力破解 + 端口扫描 | `COORDINATED_ATTACK` | 同一 IP 进行扫描并尝试登录 |
| 暴力破解 + 可疑 User Agent | `TARGETED_ATTACK` | 同一 IP 使用工具并强行登录 |
| 三者皆有 | `FULL_COMPROMISE_ATTEMPT` | 同一 IP 触发所有攻击向量 |
当匹配到模式时,所有相关警报将合并为一个包含综合证据的 `CRITICAL` 级别警报——这正是 Splunk 等商业 SIEM 工具的运作方式。
## 威胁情报
每个警报都会自动通过 AbuseIPDB 的实时威胁情报进行丰富。已知的恶意 IP 会被立即标记:
```
[HIGH] BRUTE_FORCE — 80.82.77.33
6 failed login attempts in 60s targeting user(s): root
🌐 Threat Intel: KNOWN MALICIOUS (abuse score: 100% | reports: 8209 | country: NL | ISP: FiberXpress BV)
```
在 `config.py` 中进行配置:
```
"threat_intel": {
"enabled": True,
"abuseipdb_api_key": "YOUR_API_KEY_HERE",
"min_abuse_score": 50,
"cache_ttl_seconds": 3600,
}
```
## 项目结构
```
log_threat_detector/
├── main.py # CLI entry point
├── config.py # Central thresholds and settings
├── Makefile # Shortcuts for common commands
├── parser/
│ ├── base.py # Shared LogEntry data model
│ ├── ssh_parser.py # OpenSSH log parser
│ ├── apache_parser.py # Apache Combined Log Format parser
│ └── syslog_parser.py # UFW/iptables syslog parser
├── detection/
│ ├── base.py # Shared Alert data model
│ ├── brute_force.py # Brute force detection (sliding window)
│ ├── port_scan.py # Port scan detection (sliding window)
│ ├── user_agent.py # Suspicious user agent detection
│ ├── anomaly.py # High request rate anomaly detection
│ ├── correlation.py # Multi-vector attack correlation engine
│ ├── watch_mode.py # Real-time log tailing engine
│ └── threat_intel.py # AbuseIPDB threat intelligence integration
├── output/
│ ├── alert_output.py # Colored terminal output with severity filter
│ ├── json_report.py # JSON report generator
│ ├── email_alert.py # Email notifications for HIGH/CRITICAL alerts
│ └── db.py # SQLite alert persistence and history
├── logs/ # Sample log files
├── tests/ # Unit tests (14 tests)
└── requirements.txt
```
## 安装
```
git clone https://github.com/AhmedDAH1/log_threat_detector.git
cd log_threat_detector
pip install -r requirements.txt
```
## 用法
```
# 在所有默认日志文件上运行所有检测
python3 main.py --all
# 仅显示 HIGH 和 CRITICAL 告警
python3 main.py --all --severity HIGH
# 在特定 SSH 日志上仅运行暴力破解检测
python3 main.py --ssh logs/ssh.log --brute-force
# 在 Apache 日志上运行 User Agent 和异常检测
python3 main.py --apache logs/apache.log --user-agent --anomaly
# 运行端口扫描检测并保存自定义报告
python3 main.py --syslog logs/syslog.log --port-scan --report output/report.json
# 实时监控日志文件以进行实时威胁检测
python3 main.py --watch logs/ssh.log
# 从数据库查看告警历史
python3 main.py --history
```
## CLI 选项
```
Log file inputs:
--ssh FILE Path to SSH log file
--apache FILE Path to Apache log file
--syslog FILE Path to syslog file
Detection modules:
--brute-force Detect brute force login attempts
--user-agent Detect suspicious user agents
--anomaly Detect high request rate anomalies
--port-scan Detect port scan attempts
--all Run all detections on all default log files
Live monitoring:
--watch FILE Tail a log file in real time and detect threats as they appear
--dashboard Launch web dashboard at http://localhost:5000
History:
--history Show the last 20 alerts from the database
Output options:
--severity LEVEL Minimum severity: LOW | MEDIUM | HIGH | CRITICAL (default: LOW)
--report [FILE] Save JSON report (default: output/report.json)
```
## Makefile
```
make run # run all detections on default log files
make test # run all 14 unit tests
make watch # start live monitoring on ssh log
make clean # remove cache and generated reports
```
## 电子邮件警报
在 `--watch` 模式下运行时,该工具会针对 HIGH 和 CRITICAL 级别的警报发送电子邮件通知。在 `config.py` 中进行配置:
```
"email": {
"enabled": True,
"smtp_host": "smtp.gmail.com",
"smtp_port": 587,
"sender_email": "your_gmail@gmail.com",
"sender_password": "your_app_password",
"recipient_email": "alerts@yourdomain.com",
}
```
## 示例输出
```
🔍 Log Threat Detector — Starting Analysis
── SSH: logs/ssh.log (28 entries) ───────────────
[HIGH] BRUTE_FORCE — 80.82.77.33
6 failed login attempts in 60s targeting user(s): root
First seen : 2026-12-10 08:00:01
Evidence : 6 log line(s)
🌐 Threat Intel: KNOWN MALICIOUS (abuse score: 100% | reports: 8209 | country: NL | ISP: FiberXpress BV)
── Apache: logs/apache.log (11 entries) ─────────
[MEDIUM] SUSPICIOUS_USER_AGENT — 45.33.32.156
Malicious tool detected in User-Agent: 'nikto'
── Syslog: logs/syslog.log (13 entries) ─────────
[HIGH] PORT_SCAN — 45.33.32.156
11 unique ports probed in 10s: [22, 25, 80, 443, 3306, ...]
── Correlation Engine ────────────────────────────
[CRITICAL] RECONNAISSANCE — 45.33.32.156
Same IP performed port scanning and used a known attack tool.
Contributing alerts: SUSPICIOUS_USER_AGENT (MEDIUM), PORT_SCAN (HIGH)
First seen : 2026-12-10 07:10:00
Evidence : 12 log line(s)
========== SUMMARY ==========
Total alerts : 9
High/Critical: 6
Medium : 3
Low : 0
==============================
```
## 配置
所有阈值都位于 `config.py` 中——无需修改检测逻辑即可进行调整:
```
CONFIG = {
"brute_force": {
"max_failed_attempts": 5,
"time_window_seconds": 60,
},
"port_scan": {
"max_ports": 10,
"time_window_seconds": 10,
},
"anomaly": {
"request_rate_per_minute": 100,
},
"threat_intel": {
"enabled": True,
"abuseipdb_api_key": "YOUR_API_KEY_HERE",
"min_abuse_score": 50,
"cache_ttl_seconds": 3600,
},
}
```
## 技术栈
- **语言**:Python 3.10+
- **库**:`colorama` 用于终端输出
- **外部 API**:AbuseIPDB 用于实时威胁情报
- **架构**:模块化——解析器、检测器和输出完全解耦
- **CI**:GitHub Actions —— 每次推送自动运行 14 个测试
## 作者
## 作者
**Ahmed Dahdouh**
软件工程专业学生 · 网络安全爱好者
[](https://github.com/AhmedDAH1)
[](https://www.linkedin.com/in/ahmed-dahdouh)
[](https://tryhackme.com/p/AhmedDAH1)
## 许可证
MIT —— 参见 [LICENSE](LICENSE)
标签:AbuseIPDB, Apache日志, PB级数据处理, Python, SQLite, SSH日志, Syslog, Web仪表板, WSL, 免杀技术, 关联分析, 威胁情报, 安全运维, 开发者工具, 无后门, 暴力破解检测, 端口扫描检测, 红队行动, 网络安全, 逆向工具, 邮件告警, 隐私保护