jesse12-21/splunk-siem-analysis
GitHub: jesse12-21/splunk-siem-analysis
基于 Splunk 平台对 3340 万条真实安全事件进行 SIEM 威胁检测工程的实战项目,融合风险评分告警与检测即代码方法论。
Stars: 0 | Forks: 1
# 📊 使用 Splunk 进行 SIEM 威胁检测与日志分析
### 基于 3340 万条真实安全事件的风险驱动检测工程
[](https://www.splunk.com/)
[](https://ubuntu.com/)
[](https://docs.splunk.com/Documentation/Splunk/latest/SearchReference)
[](https://attack.mitre.org/)
[](docs/rba-guide.md)
[](../../actions/workflows/validate-content.yml)
*一个展示 SIEM 实际操作的网络安全实战项目——涵盖从 Splunk 安装与日志接入,到编写 SPL 检测查询、构建安全仪表盘、创建告警规则,以及调查跨关联日志源的真实多阶段 Web 攻击场景。*
[接入与导入](#part-1---splunk-setup--log-ingestion) · [SPL 基础](#part-2---spl-search-fundamentals) · [威胁检测](#part-3---threat-detection-queries) · [仪表盘](#part-4---security-monitoring-dashboards) · [告警](#part-5---alert-rules--automated-detection) · [调查](#part-6---attack-investigation--incident-timeline)
## 📋 项目概述
SIEM(安全信息与事件管理)平台是安全运营中心(SOC)的神经中枢。它从整个环境中收集日志,关联事件,并使分析师能够检测和调查威胁。本项目使用业界领先的 Splunk 平台展示了实用的 SIEM 技能——通过处理来自 Boss of the SOC 数据集的 **3340 万条真实安全事件**,检测 Web 攻击、权限变更,并重建攻击者的完整活动时间线。
### 本项目涵盖的内容
| 章节 | 展示的技能 | 使用的工具 |
|---|---|---|
| **接入与导入** | Splunk 安装、数据输入、index 管理 | Splunk Enterprise, `inputs.conf` |
| **SPL 基础** | 搜索处理语言查询与数据探索 | SPL, `stats`, `table`, `timechart` |
| **威胁检测** | 针对真实攻击模式编写检测查询 | SPL, `where`, `eval`, `search` |
| **仪表盘** | 构建运营安全监控仪表盘 | Splunk 经典仪表盘 |
| **告警规则** | 利用告警动作创建自动化检测 | 定时搜索, 触发器 |
| **调查** | 关联事件以重建攻击时间线 | 跨 sourcetype 关联, `timechart` |
| **Risk-Based Alerting** | 对实体进行评分,而不是针对每次检测触发告警 | Risk 数据模型, `action.risk`, ES 8.x |
| **Detection-as-Code** | 在 CI 中编译和验证带版本控制的 YAML 检测规则 | `contentctl`, GitHub Actions |
| **CIM 与加速** | 基于规范化数据模型的可移植检测规则 | `tstats`, Authentication/Web/Change/Intrusion_Detection |
| **Pipeline 集成** | 从配套项目接入传感器输出 | Suricata EVE JSON, Sigma 转换 |
## 🏗️ 实验环境
该实验在 VirtualBox 内的 Ubuntu 24.04 上运行 Splunk Enterprise,分析了来自 Boss of the SOC (BOTS) v1 数据集的超过 3300 万条跨 26 种不同日志源的安全事件。
### 架构
```
+----------------------------------------------------------------+
| Splunk SIEM Lab |
| |
| +----------------------+ +-------------------------+ |
| | BOTS v1 Dataset | | Splunk Enterprise | |
| | (33.4M events) | | (Ubuntu 24.04 VM) | |
| | | | | |
| | - Windows Security | ----> | Index: botsv1 | |
| | - Fortinet Firewall | ----> | | |
| | - Suricata IDS | ----> | Source Types: 26 | |
| | - Stream HTTP/TCP | ----> | | |
| | - Sysmon | ----> | Time Range: Aug 2016 | |
| | - Stream DNS | ----> | | |
| +----------------------+ +-------------------------+ |
+----------------------------------------------------------------+
```
### 日志源(按事件数量排名前 10)
| Source Type | 事件数量 | 用途 |
|---|---|---|
| **WinEventLog:Security** | 14,131,490 | Windows 身份验证、进程创建、权限事件 |
| **fgt_traffic** | 7,675,023 | Fortinet 防火墙流量日志 |
| **suricata** | 5,078,376 | IDS/IPS 告警和网络检测 |
| **stream:tcp** | 1,754,601 | TCP 连接元数据 |
| **stream:ip** | 1,435,025 | IP 层数据包元数据 |
| **stream:dns** | 1,369,998 | DNS 查询/响应记录 |
| **XmlWinEventLog:Microsoft-Windows-Sysmon/Operational** | 559,792 | 详细的进程/网络 Sysmon 遥测数据 |
| **stream:smb** | 448,008 | SMB 文件共享活动 |
| **fgt_utm** | 257,477 | Fortinet UTM 安全事件 |
| **stream:http** | 39,010 | HTTP 请求/响应流数据 |
### 🎯 检测覆盖范围 — MITRE ATT&CK 映射
每个检测规则都在结构化的 YAML 中包含了 ATT&CK 技术,因此覆盖范围是可以通过编程测量的,而不仅仅是看表格。如果任何检测规则缺少 technique ID 或 risk object,CI 就会失败。
| 对手技术 | ATT&CK ID | 战术 | 检测规则 | 风险评分 |
|---|---|---|---|---|
| **Brute Force: Password Guessing** | [T1110.001](https://attack.mitre.org/techniques/T1110/001/) | Credential Access | 来自单一来源的过多失败登录 | 30 / 20 |
| **Brute Force: Password Guessing** | [T1110.001](https://attack.mitre.org/techniques/T1110/001/) | Credential Access | 爆发式失败登录后的成功登录 | 70 |
| **Account Manipulation** | [T1098](https://attack.mitre.org/techniques/T1098/) | Persistence | 特权组成员身份更改 | 40 |
| **Exploit Public-Facing Application** | [T1190](https://attack.mitre.org/techniques/T1190/) | Initial Access | Web SQL 注入尝试 | 60 |
| **Active Scanning: Wordlist Scanning** | [T1595.003](https://attack.mitre.org/techniques/T1595/003/) | Reconnaissance | 通过 Not Found 响应进行 Web 扫描 | 35 |
| **Active Scanning** | [T1595](https://attack.mitre.org/techniques/T1595/) | Reconnaissance | 高严重性 Suricata IDS 告警 | 45 |
### 📂 Repository 结构
*一个展示 SIEM 实际操作的网络安全实战项目——涵盖从 Splunk 安装与日志接入,到编写 SPL 检测查询、构建安全仪表盘、创建告警规则,以及调查跨关联日志源的真实多阶段 Web 攻击场景。*
[接入与导入](#part-1---splunk-setup--log-ingestion) · [SPL 基础](#part-2---spl-search-fundamentals) · [威胁检测](#part-3---threat-detection-queries) · [仪表盘](#part-4---security-monitoring-dashboards) · [告警](#part-5---alert-rules--automated-detection) · [调查](#part-6---attack-investigation--incident-timeline)
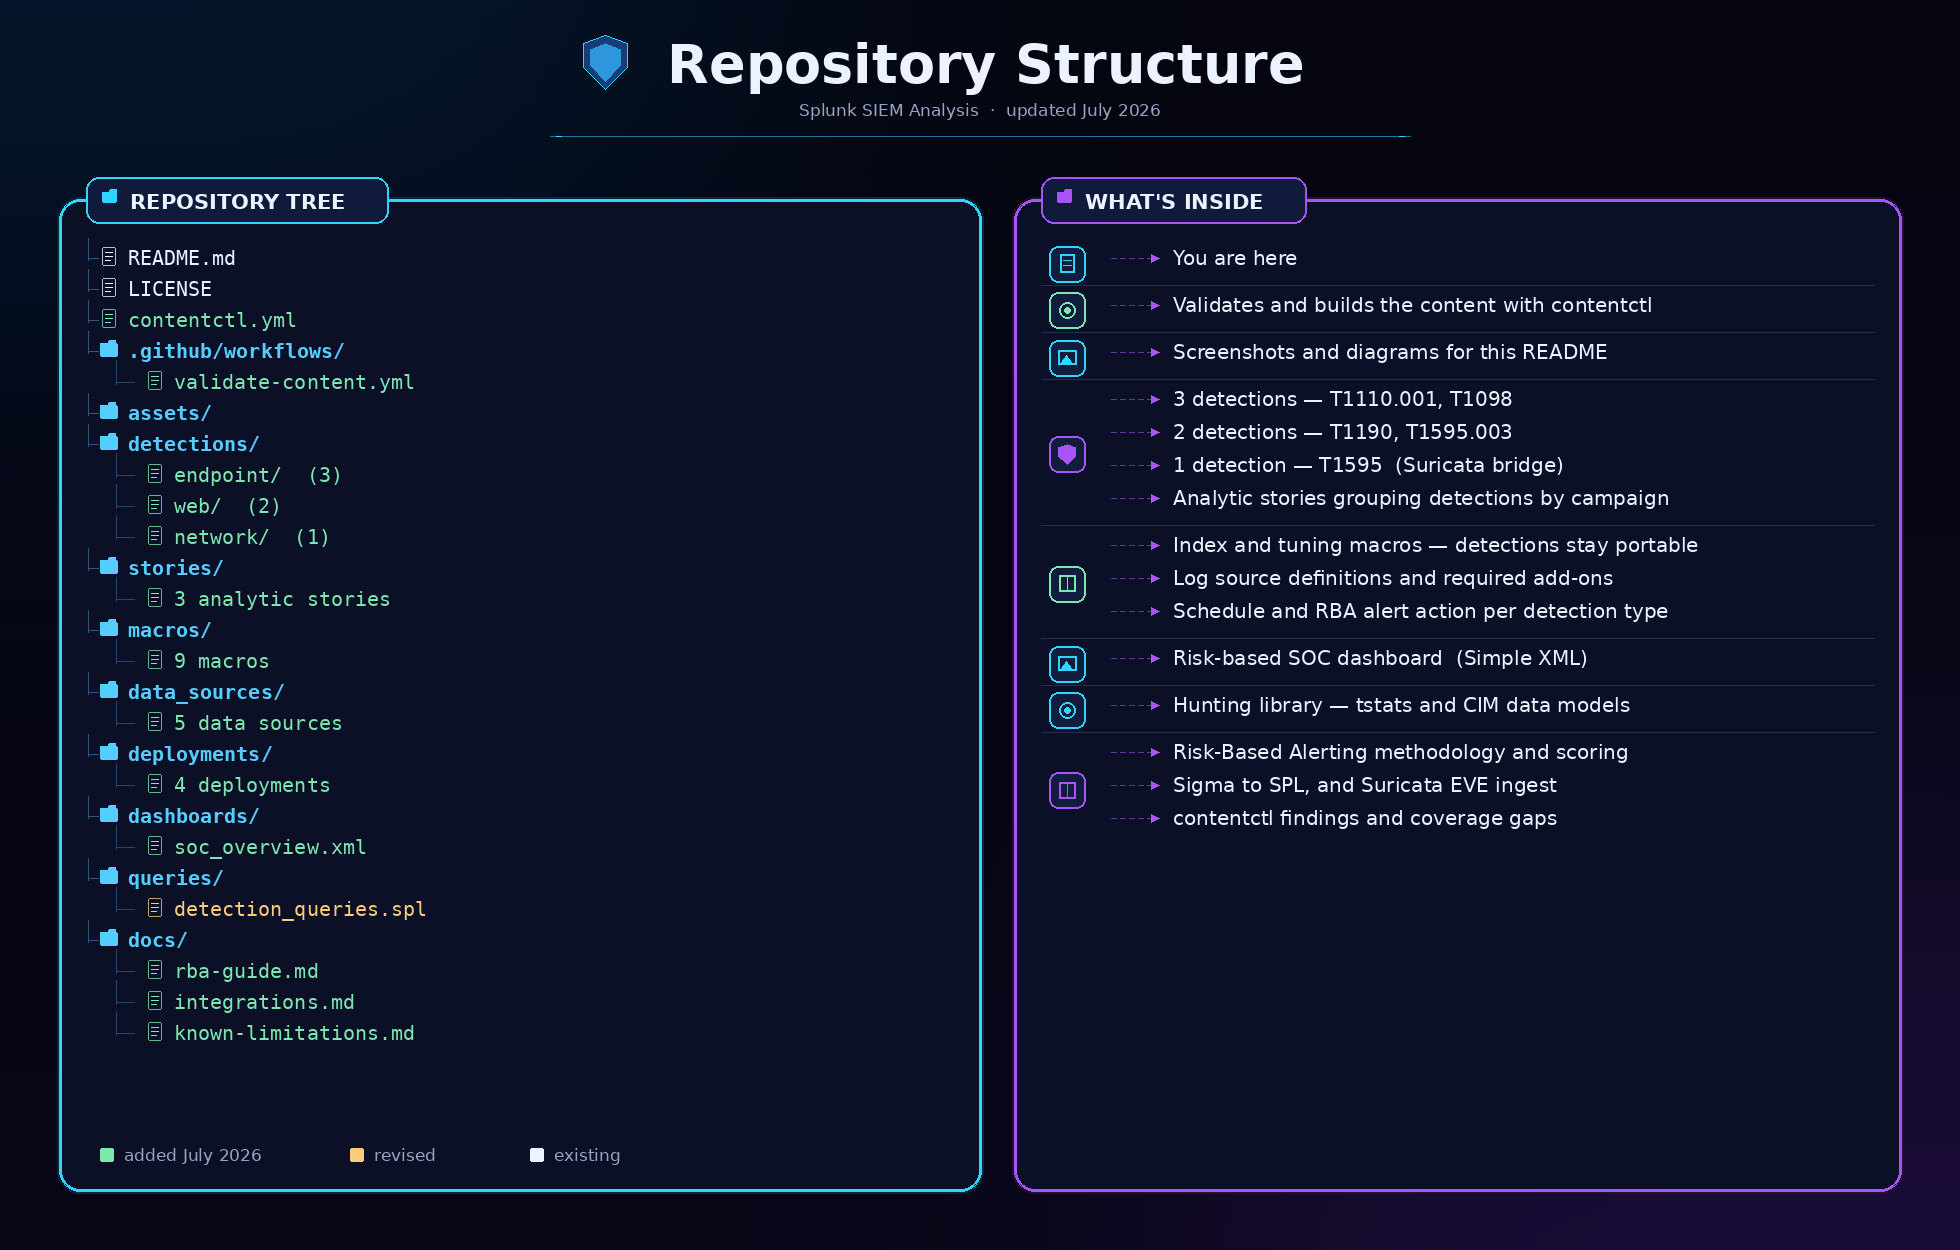
文本版本(点击展开)
``` . ├── README.md ← You are here ├── LICENSE ├── contentctl.yml ← Detection-as-code project config ├── .github/workflows/ │ └── validate-content.yml ← CI: contentctl validate + build ├── assets/ ← Screenshots referenced in this README ├── detections/ ← Detection-as-code source of truth │ ├── endpoint/ ← 3 detections — T1110.001, T1098 │ ├── web/ ← 2 detections — T1190, T1595.003 │ └── network/ ← 1 detection — T1595 (Suricata bridge) ├── stories/ ← 3 analytic stories grouping detections ├── macros/ ← 9 macros: index abstraction + tuning filters ├── data_sources/ ← 5 log source definitions and required add-ons ├── deployments/ ← Schedule + RBA alert action per detection type ├── dashboards/ │ └── soc_overview.xml ← Risk-based SOC dashboard (Simple XML) ├── queries/ │ ├── detection_queries.spl ← Hunting library — tstats + CIM data models │ └── alert_configs.spl ← Migration map to the generated savedsearches └── docs/ ├── rba-guide.md ← Risk-Based Alerting methodology and scoring ├── integrations.md ← Sigma→SPL and Suricata EVE ingest └── known-limitations.md ← contentctl findings and coverage gaps ```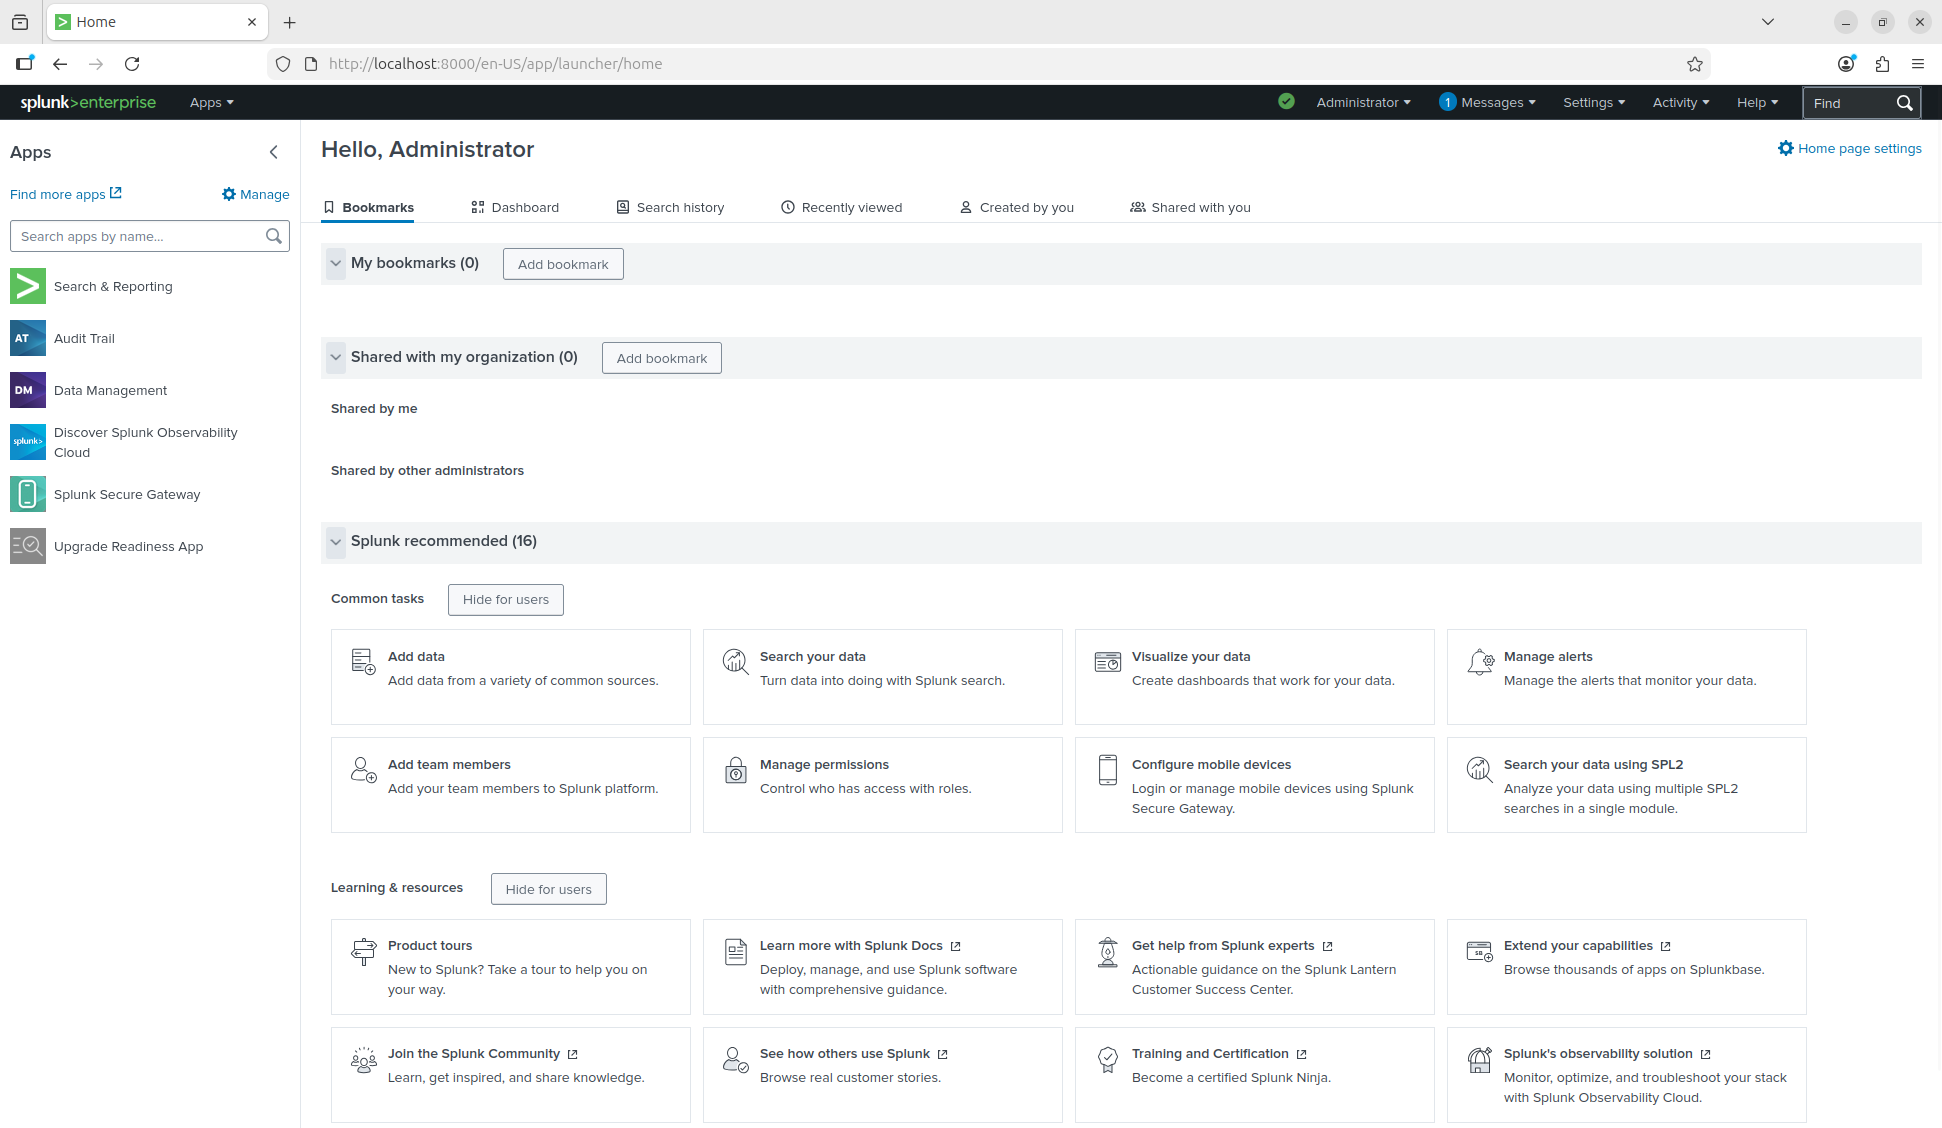
Splunk Enterprise 10.2.2 home screen showing available apps, bookmarks, and common tasks — the starting point for all SIEM operations
### 验证 botsv1 Index 我通过将 BOTS v1 数据集解压到 `/opt/splunk/etc/apps/` 中将其作为 Splunk app 安装,然后重启 Splunk 以加载 index。重启后,我验证 index 已加载并包含数据: ``` | eventcount summarize=false index=botsv1 | table index, count ```
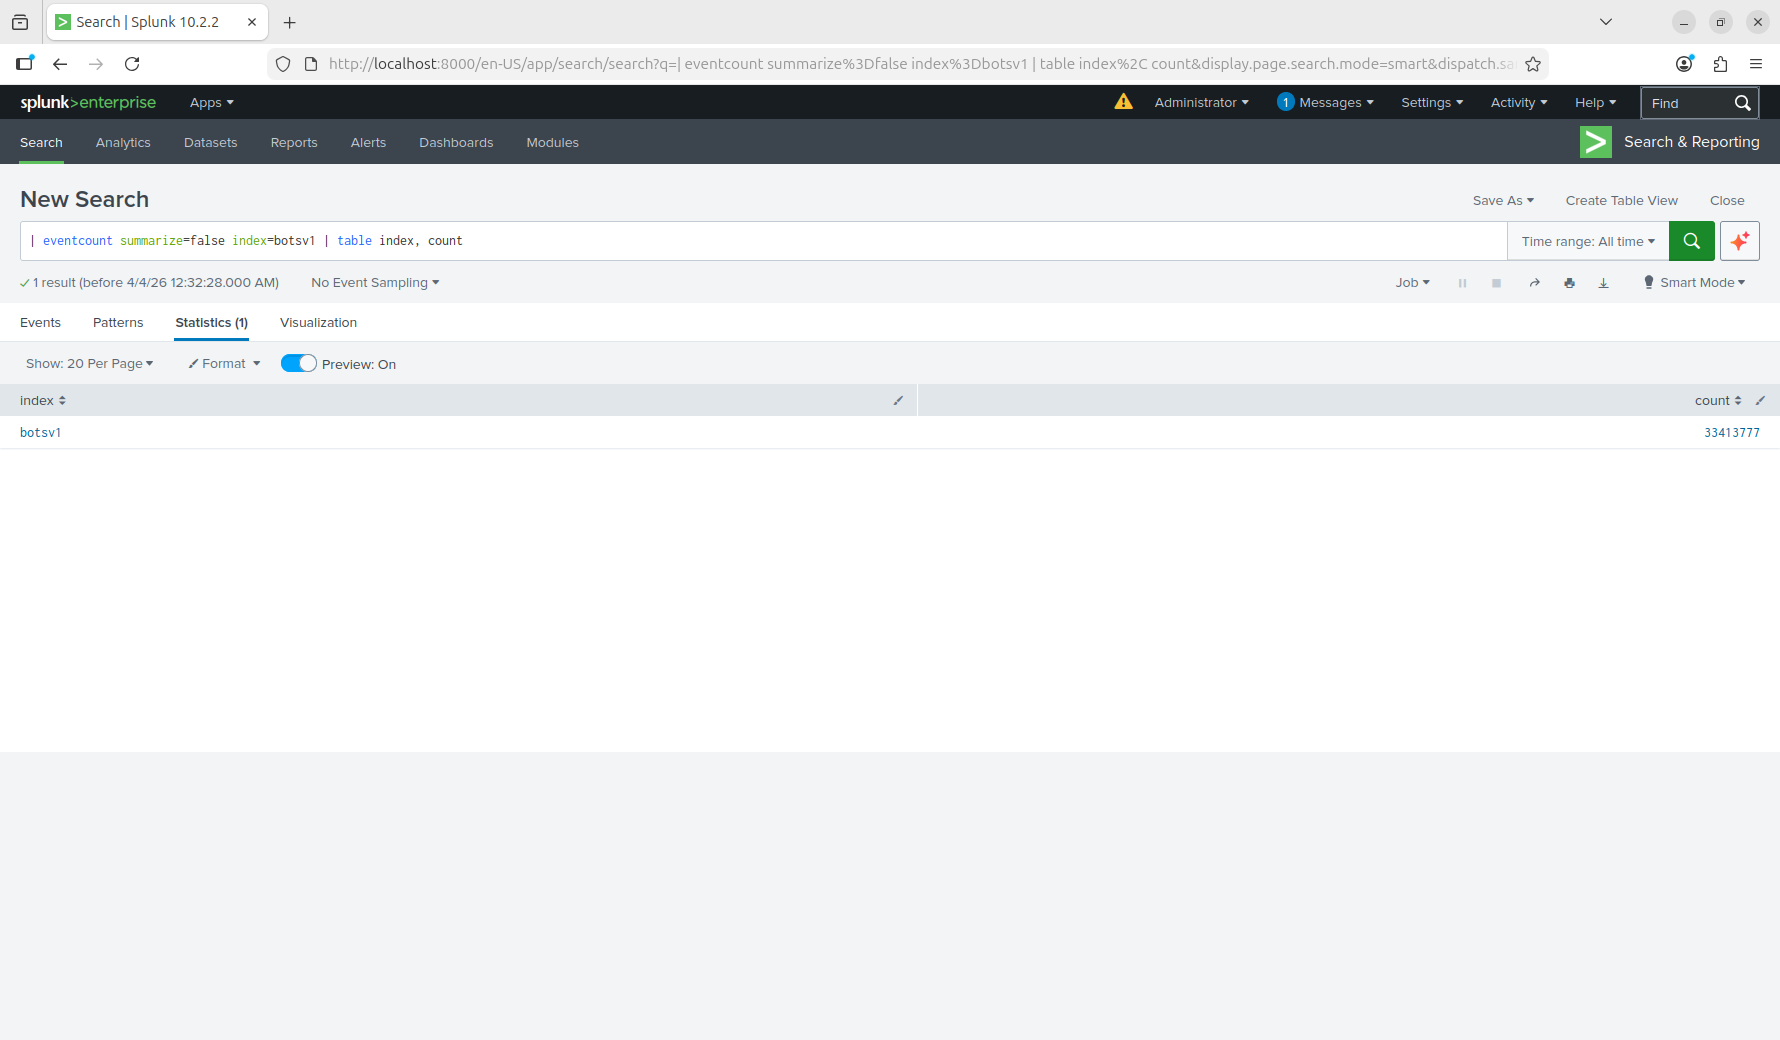
The botsv1 index loaded with 33,413,777 events — successful data ingestion confirmed
### 验证跨 Source Types 的数据接入 我探索了数据集中各种日志源: ``` index=botsv1 | stats count by sourcetype | sort -count ```
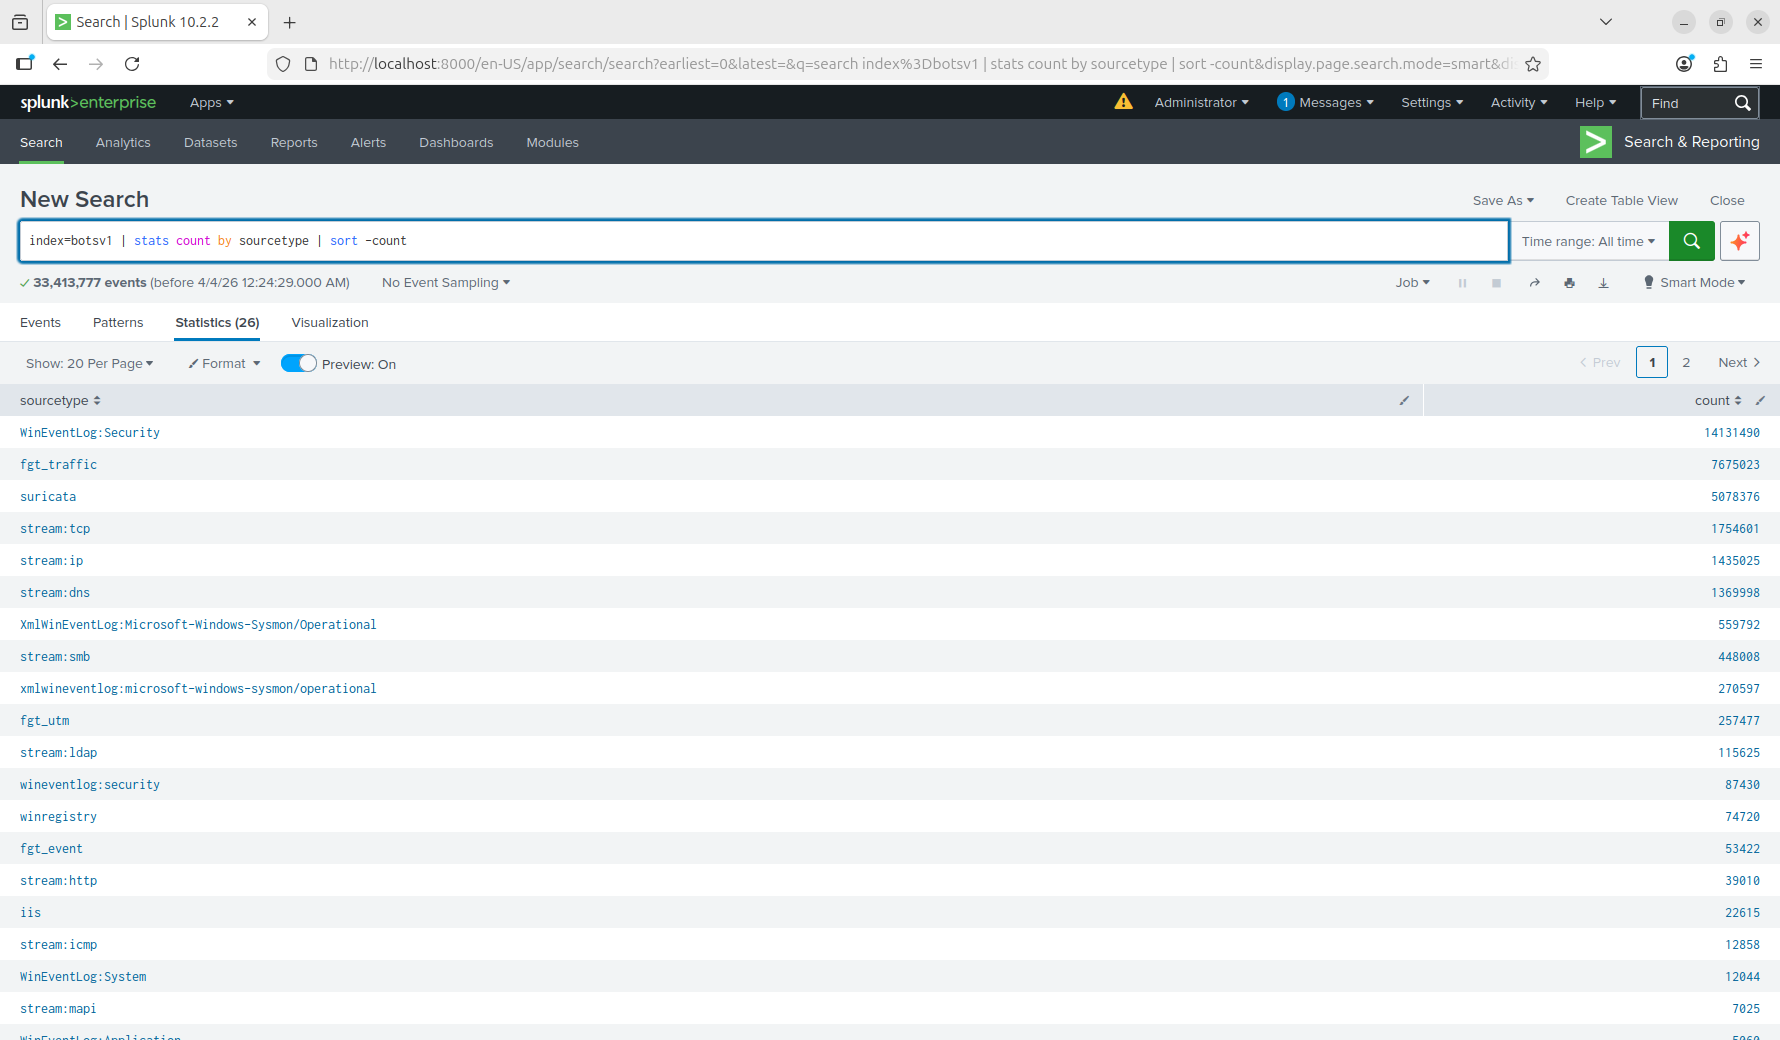
26 distinct source types ingested — from Windows Security events (14.1M) and Fortinet firewall logs (7.6M) to Suricata IDS alerts (5M) and stream data across multiple protocols
## 第 2 部分 - SPL 搜索基础 ### 探索 Windows 安全事件代码 在寻找威胁之前,我探索了 Windows 安全事件代码的分布,以了解数据集捕获了哪些活动: ``` index=botsv1 sourcetype="WinEventLog:Security" | stats count by EventCode | sort -count | head 20 ```
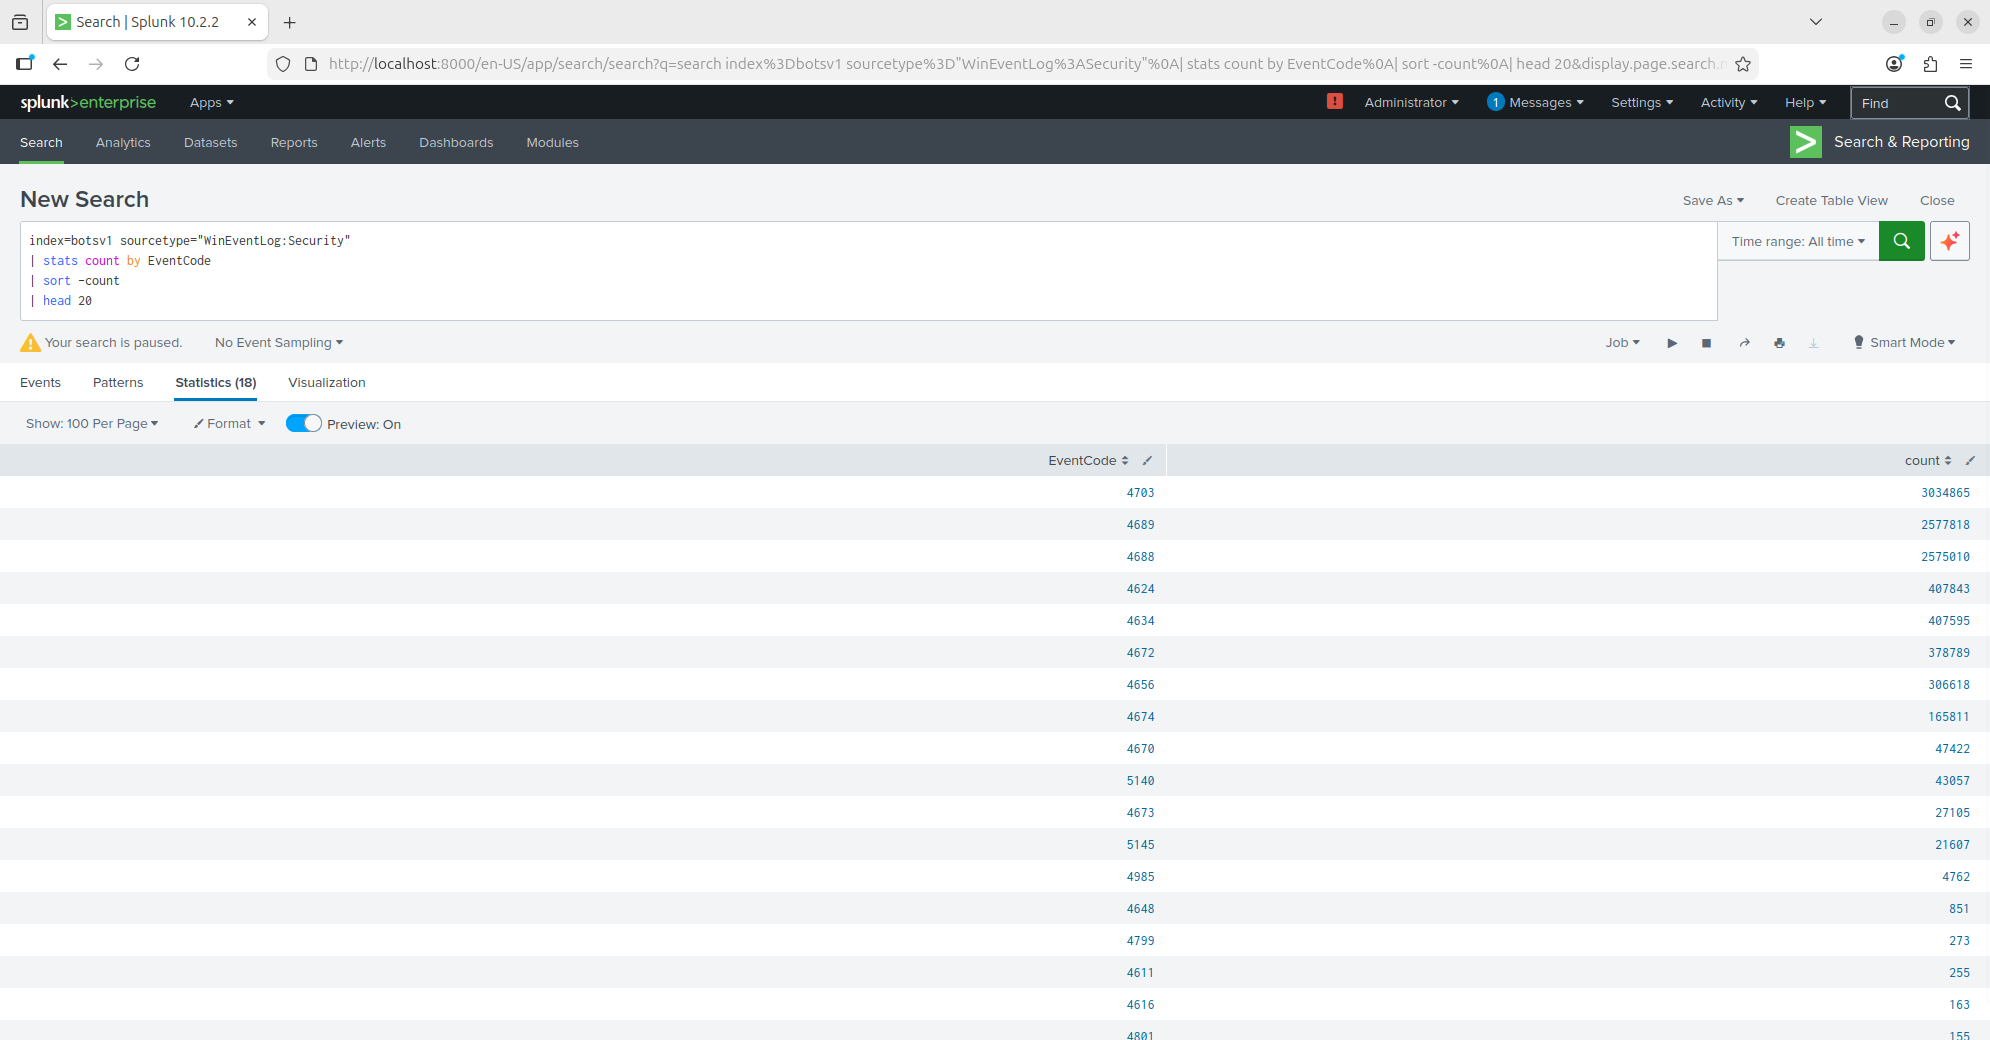
Top Windows EventCodes — 4703 (token rights adjusted), 4689 (process exited), 4688 (process created), and 4624 (successful logon) dominate the dataset, providing rich telemetry for behavioral detections
**数据集中识别出的关键 EventCode:** | EventCode | 描述 | 数量 | 检测用途 | |---|---|---|---| | **4703** | Token 权限已调整 | 3,034,865 | 权限操纵 | | **4689** | 进程已退出 | 2,577,818 | 进程执行跟踪 | | **4688** | 创建了新进程 | 2,575,010 | 基于执行情况的威胁狩猎 | | **4624** | 账户成功登录 | 407,843 | 身份验证监控 | | **4634** | 账户已注销 | 407,595 | 会话跟踪 | | **4672** | 分配了特殊权限 | 378,789 | 权限提升检测 | | **4656** | 请求对象句柄 | 306,618 | 文件/注册表访问监控 | ### 使用的关键 SPL 命令 | 命令 | 用途 | 示例 | |---|---|---| | `stats` | 汇总数据 | `stats count by src_ip` | | `table` | 显示特定字段 | `table _time, user, src_ip` | | `timechart` | 基于时间的汇总 | `timechart span=1h count` | | `where` | 使用表达式过滤 | `where count > 100` | | `eval` | 创建计算字段 | `eval source_type=sourcetype` | | `search` | 使用搜索词过滤 | `search uri_path="*passwd*"` | | `sort` | 对结果排序 | `sort -count` | | `head` | 限制结果数量 | `head 10` | ## 第 3 部分 - 威胁检测查询 ### 进程执行异常检测 进程创建事件 (EventCode 4688) 提供了最丰富的威胁狩猎来源之一。我搜索了最常执行的进程以建立基准并识别异常值: ``` index=botsv1 sourcetype="WinEventLog:Security" EventCode=4688 | stats count AS executions by New_Process_Name | where executions > 100 | sort -executions | head 20 ```
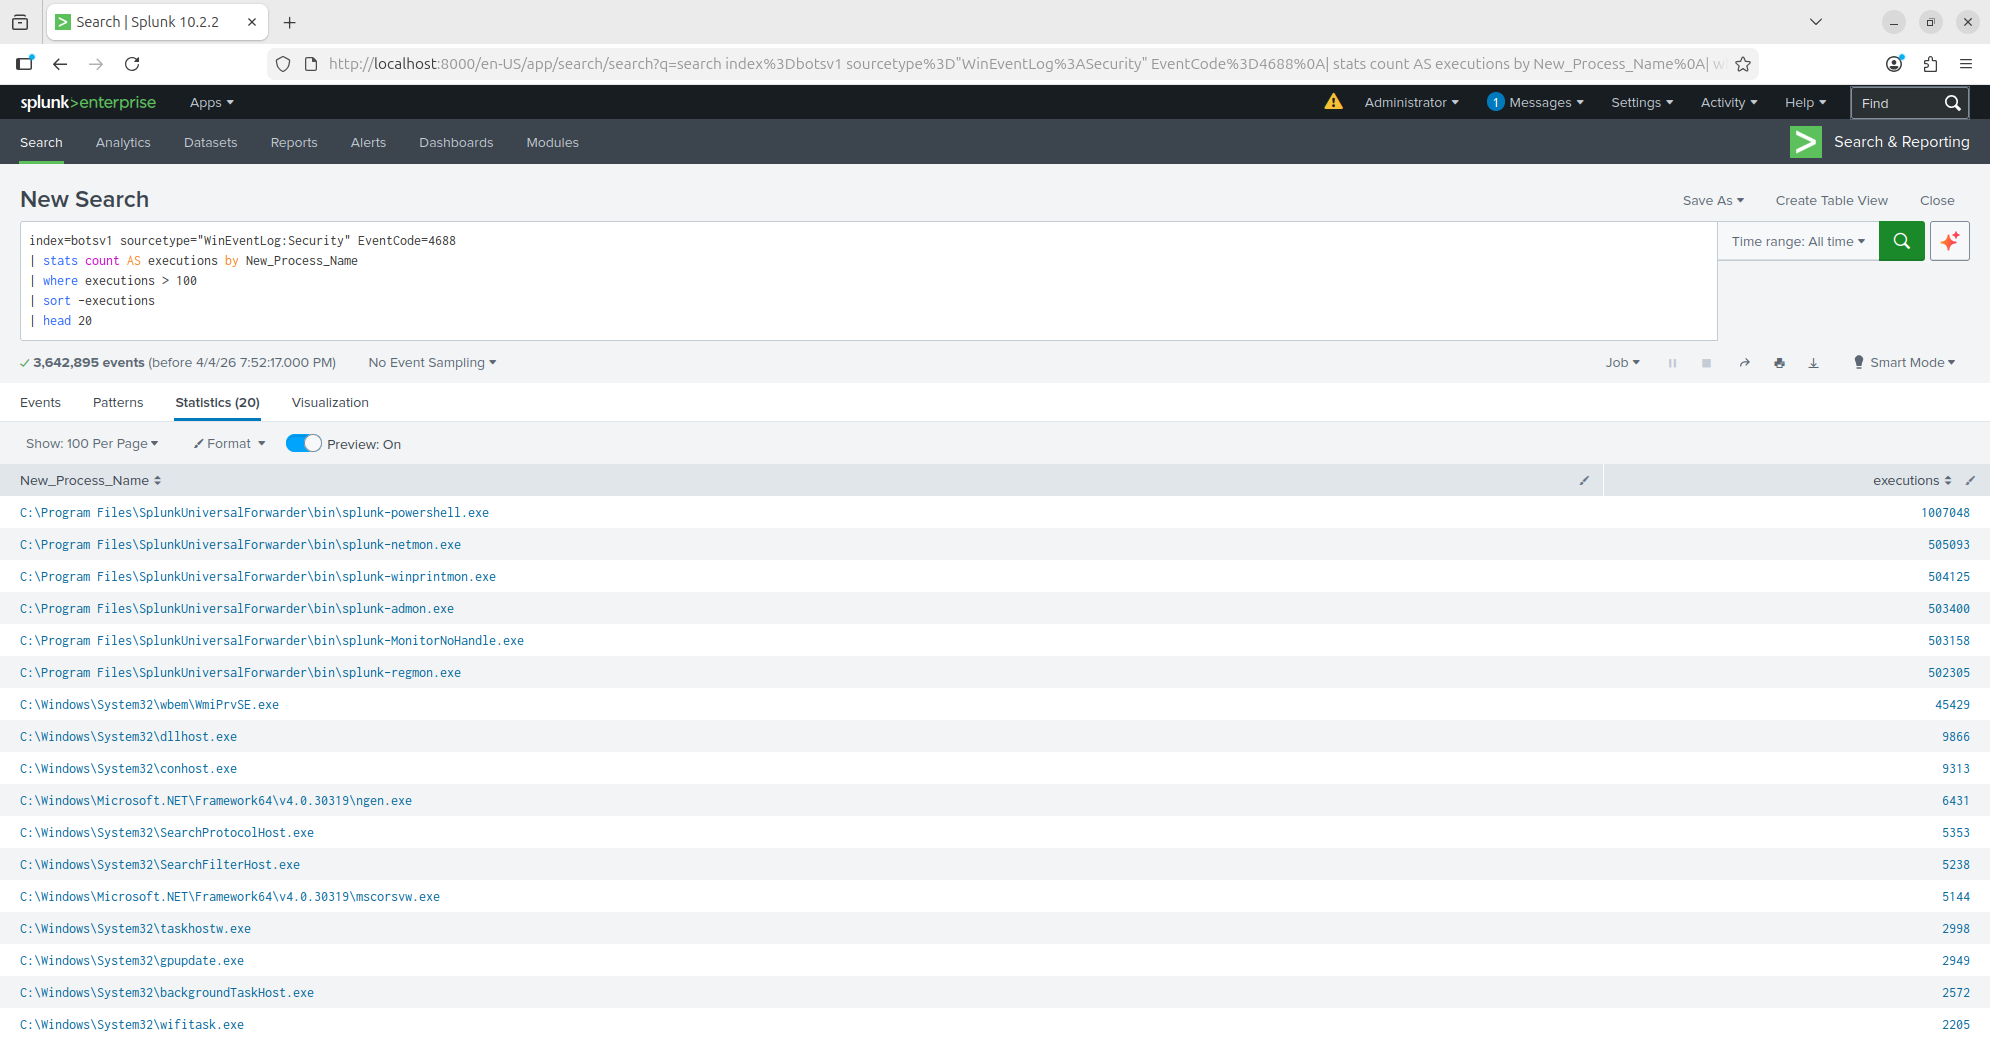
Process execution baseline — Splunk Universal Forwarder components dominate (expected), while spikes in wmiprvse.exe (45,429), dllhost.exe (9,866), and conhost.exe (9,313) warrant investigation as these are commonly abused by attackers for lateral movement and command execution
### Web 应用攻击检测 我在 HTTP 流数据中搜索常见的 Web 攻击模式——路径遍历、本地文件包含(LFI)和远程命令执行尝试: ``` index=botsv1 sourcetype="stream:http" | search uri_path="*SELECT*" OR uri_path="*UNION*" OR uri_path="*../*" OR uri_path="*passwd*" | stats count by src_ip, uri_path | sort -count ```
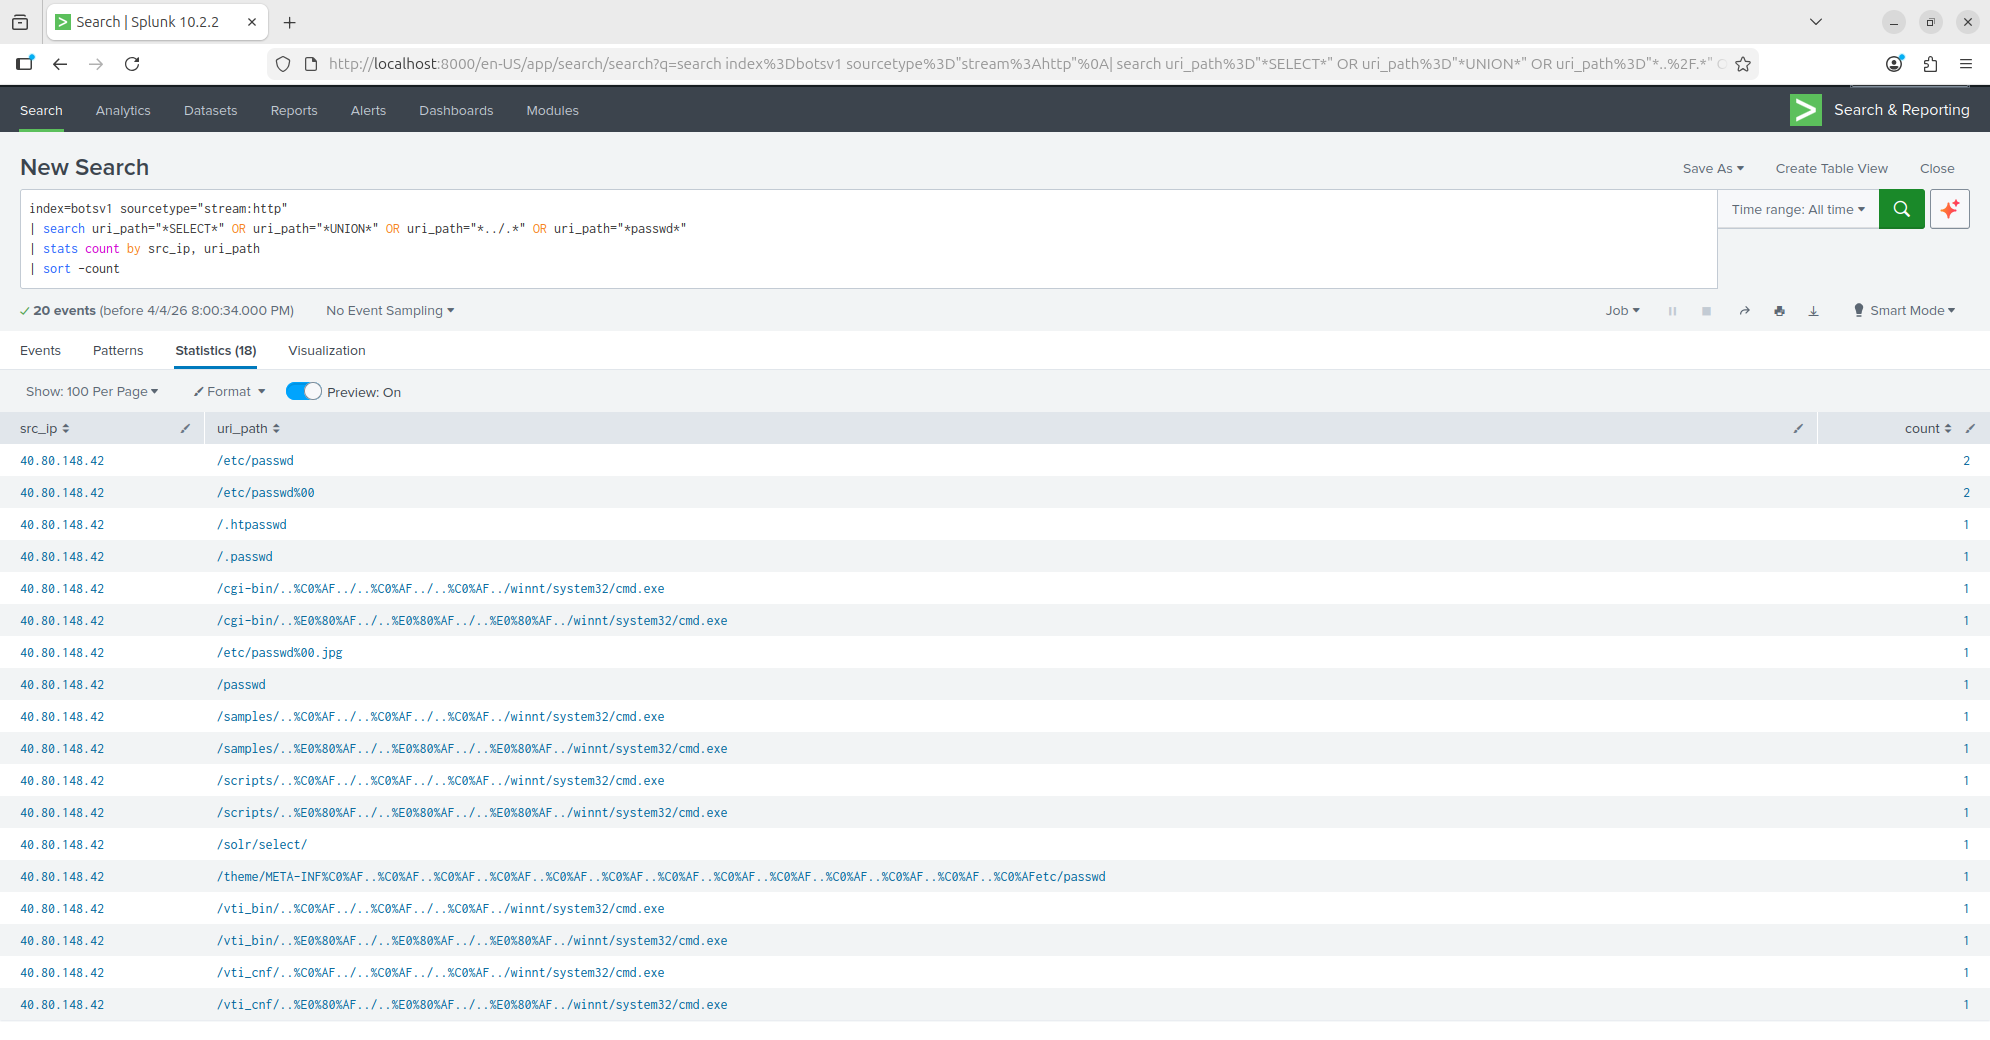
Web attack detection revealing a single attacker (40.80.148.42) attempting path traversal, local file inclusion (/etc/passwd, /.htpasswd), and Windows command execution via cgi-bin — using UTF-8 overlong encoding bypass techniques (%C0%AF, %E0%80%AF) to evade web application filters
**从单一源 IP (40.80.148.42) 识别出的攻击技术:** | 攻击类别 | 示例 Payload | 技术 | |---|---|---| | **本地文件包含** | `/etc/passwd`, `/etc/passwd%00` | 用于路径绕过的空字节注入 | | **凭据文件访问** | `/.htpasswd`, `/.passwd` | 敏感文件枚举 | | **远程命令执行** | `/cgi-bin/../../winnt/system32/cmd.exe` | 经典的 IIS 目录遍历 | | **编码绕过** | `%C0%AF`, `%E0%80%AF` | UTF-8 超长编码 | | **应用程序目标探测** | `/vti_bin/`, `/samples/`, `/scripts/` | 已知易受攻击路径探测 | 这一次扫描将 **40.80.148.42** 确定为主要攻击者——这个 IP 成为第 6 部分调查的焦点。 ## 第 4 部分 - 安全监控仪表盘 ### 构建 SOC 概览仪表盘 我构建了一个四面板的安全监控仪表盘,让分析师能够立即查看关键安全指标:
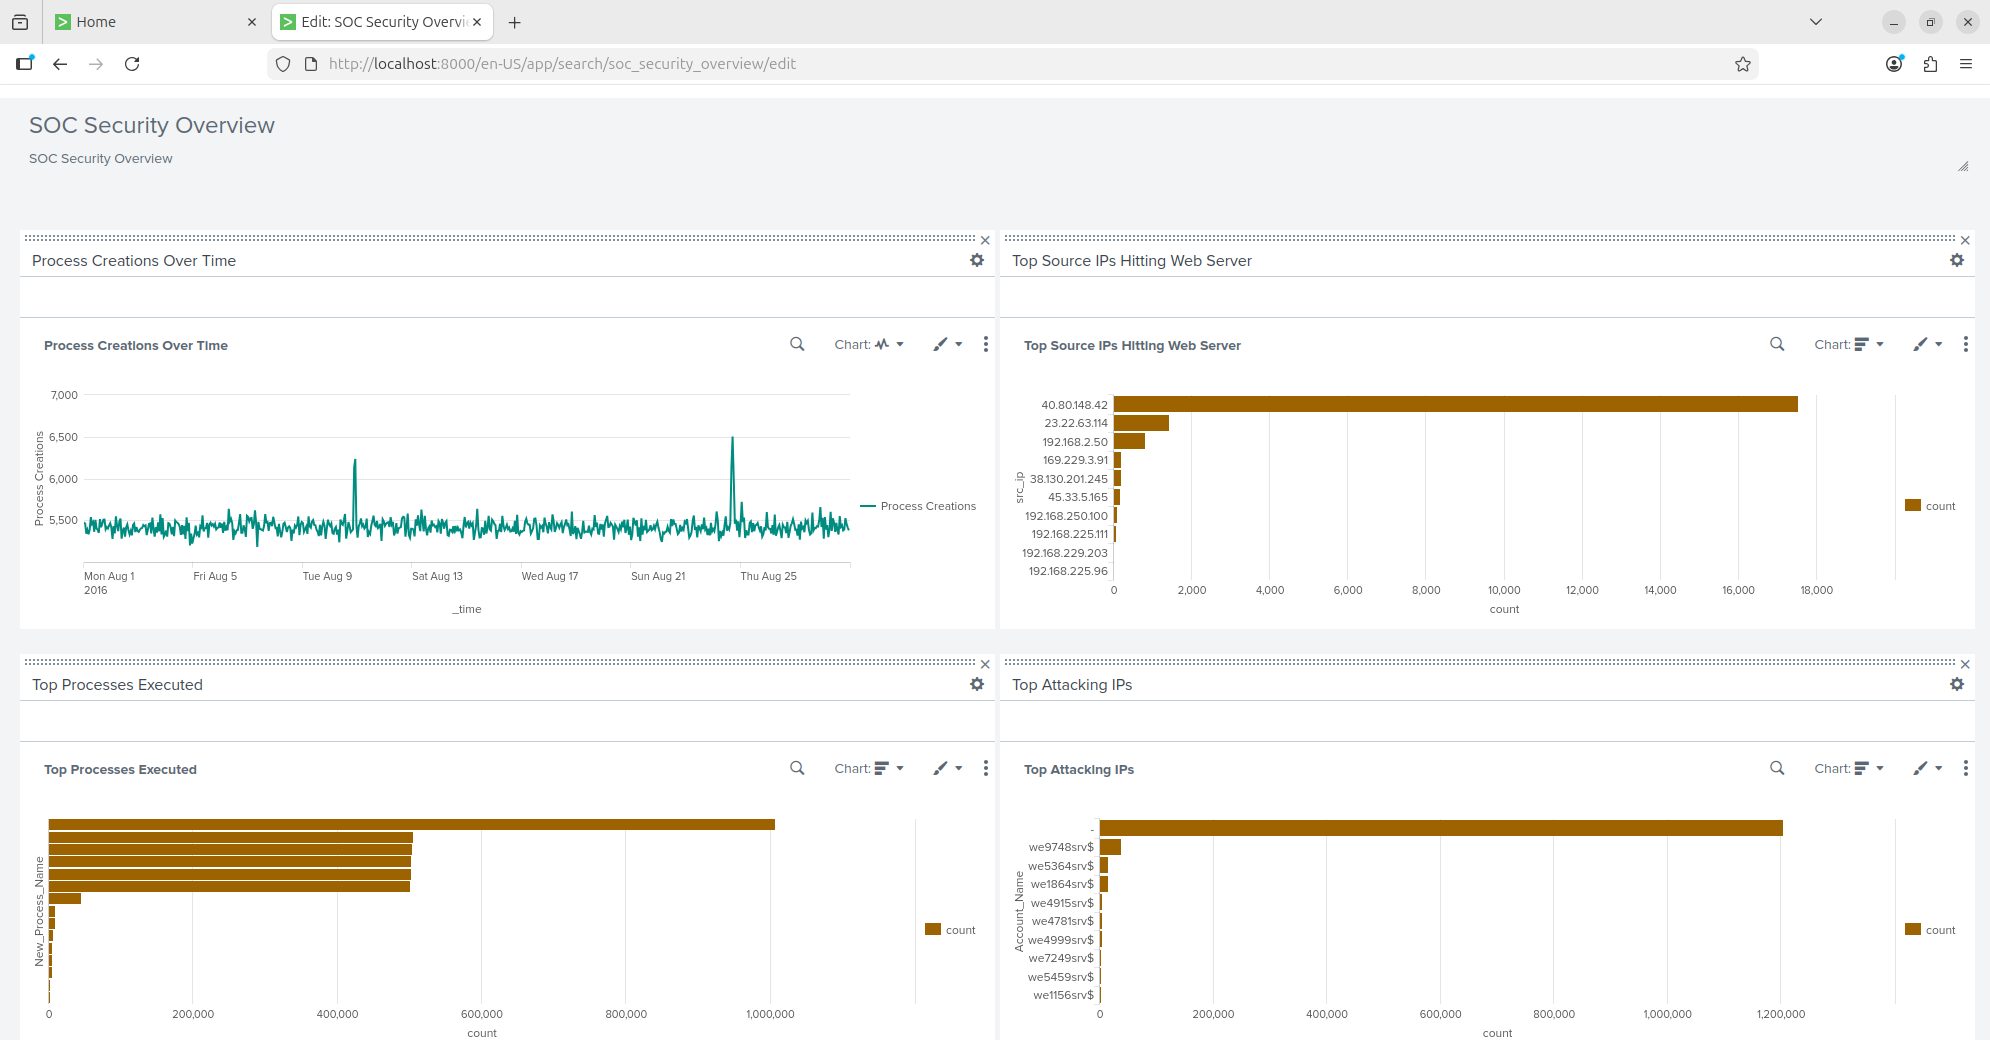
SOC Security Overview dashboard showing process creation trends, top web attackers (with 40.80.148.42 dominating at ~17K requests), most-executed processes, and top accounts by activity — combining multiple data sources into a single analyst view
**仪表盘面板:** **面板 1 — 随时间变化的进程创建(折线图):** ``` index=botsv1 sourcetype="WinEventLog:Security" EventCode=4688 | timechart span=1h count AS "Process Creations" ``` **面板 2 — 访问 Web 服务器的顶级源 IP(柱状图):** ``` index=botsv1 sourcetype="stream:http" | stats count by src_ip | sort -count | head 10 ``` **面板 3 — 执行的顶级进程(柱状图):** ``` index=botsv1 sourcetype="WinEventLog:Security" EventCode=4688 | stats count by New_Process_Name | sort -count | head 15 ``` **面板 4 — 活动量最高的账户(柱状图):** ``` index=botsv1 sourcetype="WinEventLog:Security" EventCode=4688 | stats count by Account_Name | sort -count | head 10 ``` ### 地理位置面板 我添加了一个地理分析面板,显示访问服务器的 Web 请求的国家和城市: ``` index=botsv1 sourcetype="stream:http" | iplocation src_ip | where isnotnull(Country) | stats count by Country, City | sort -count | head 20 ```
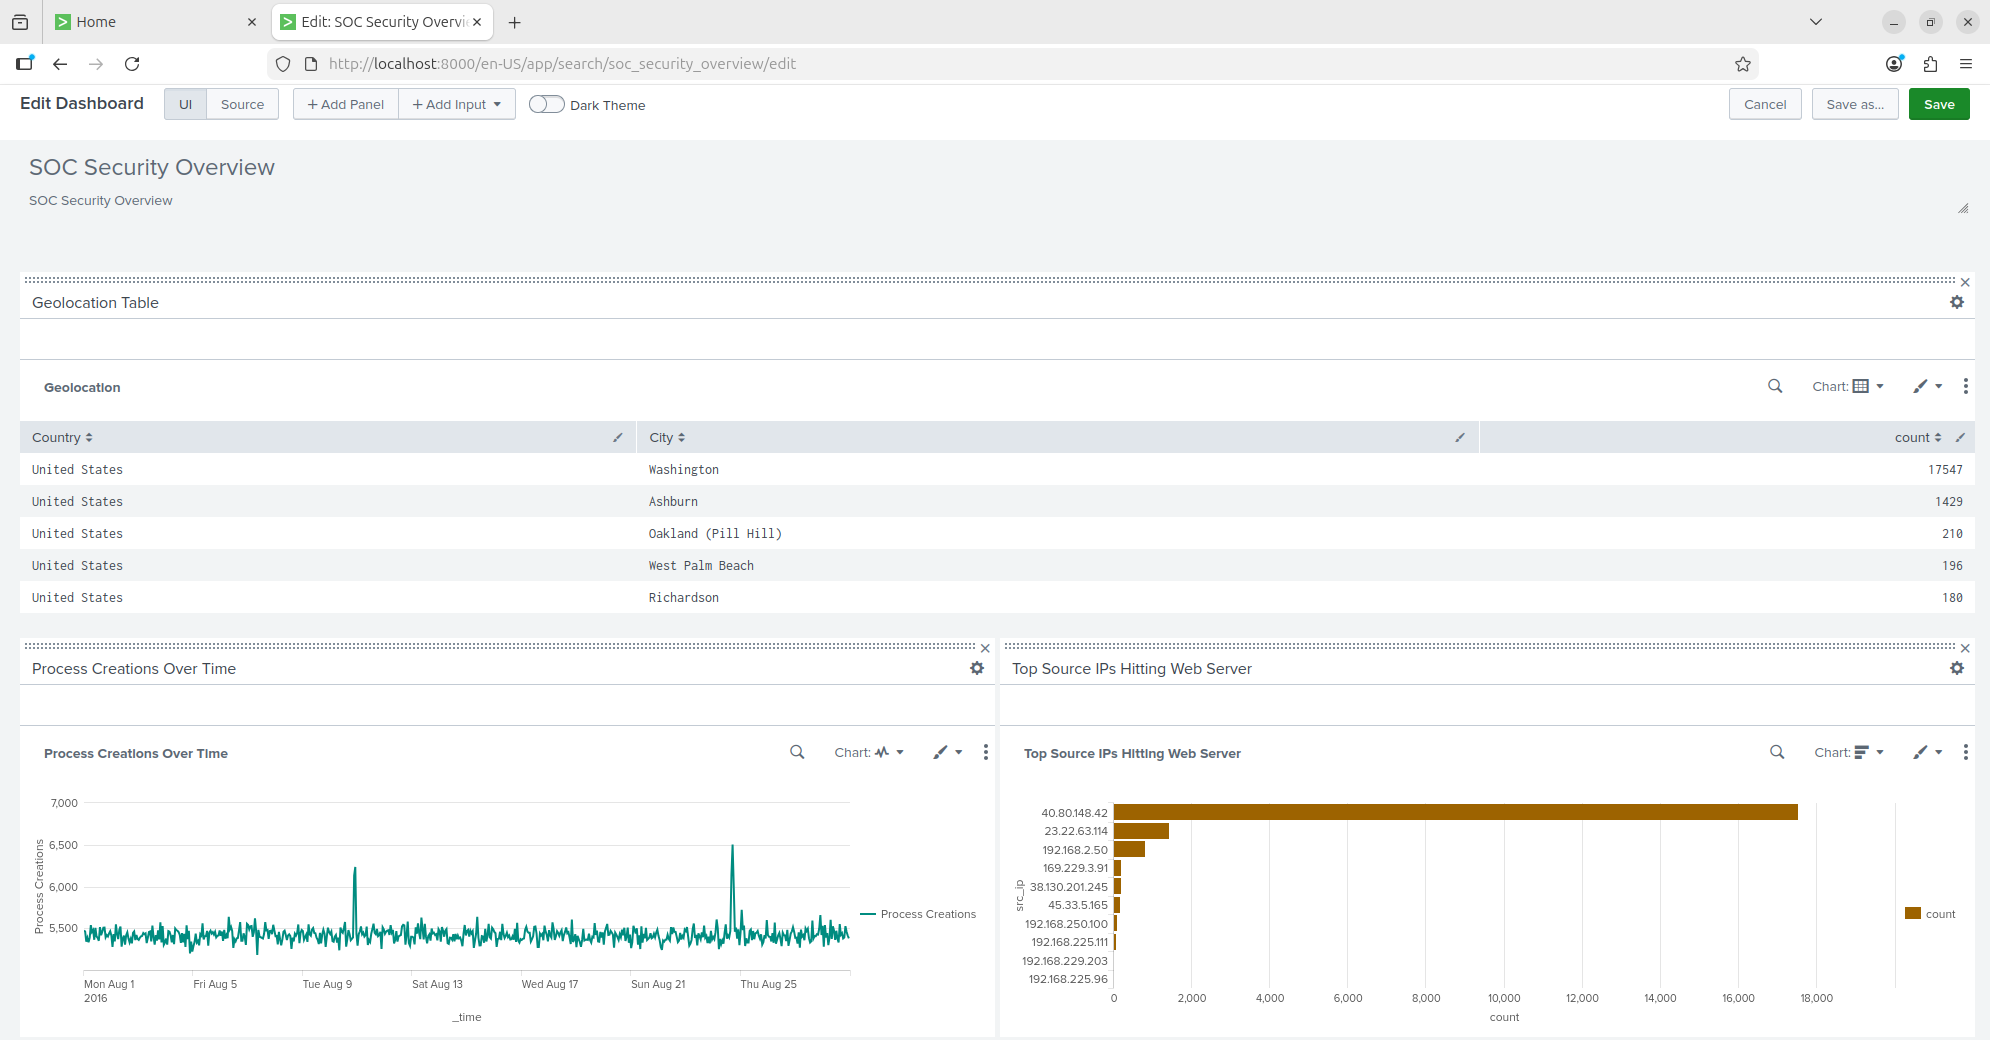
Geolocation analysis revealing Washington, D.C. as the top source of web traffic (17,547 requests) — traced to the attacker IP 40.80.148.42 — followed by Ashburn, Oakland, and other U.S. cities
## 第 5 部分 - 告警规则与自动化检测 ### 创建 Web 攻击告警 我配置了一个自动化告警,用于实时检测路径遍历和本地文件包含尝试:
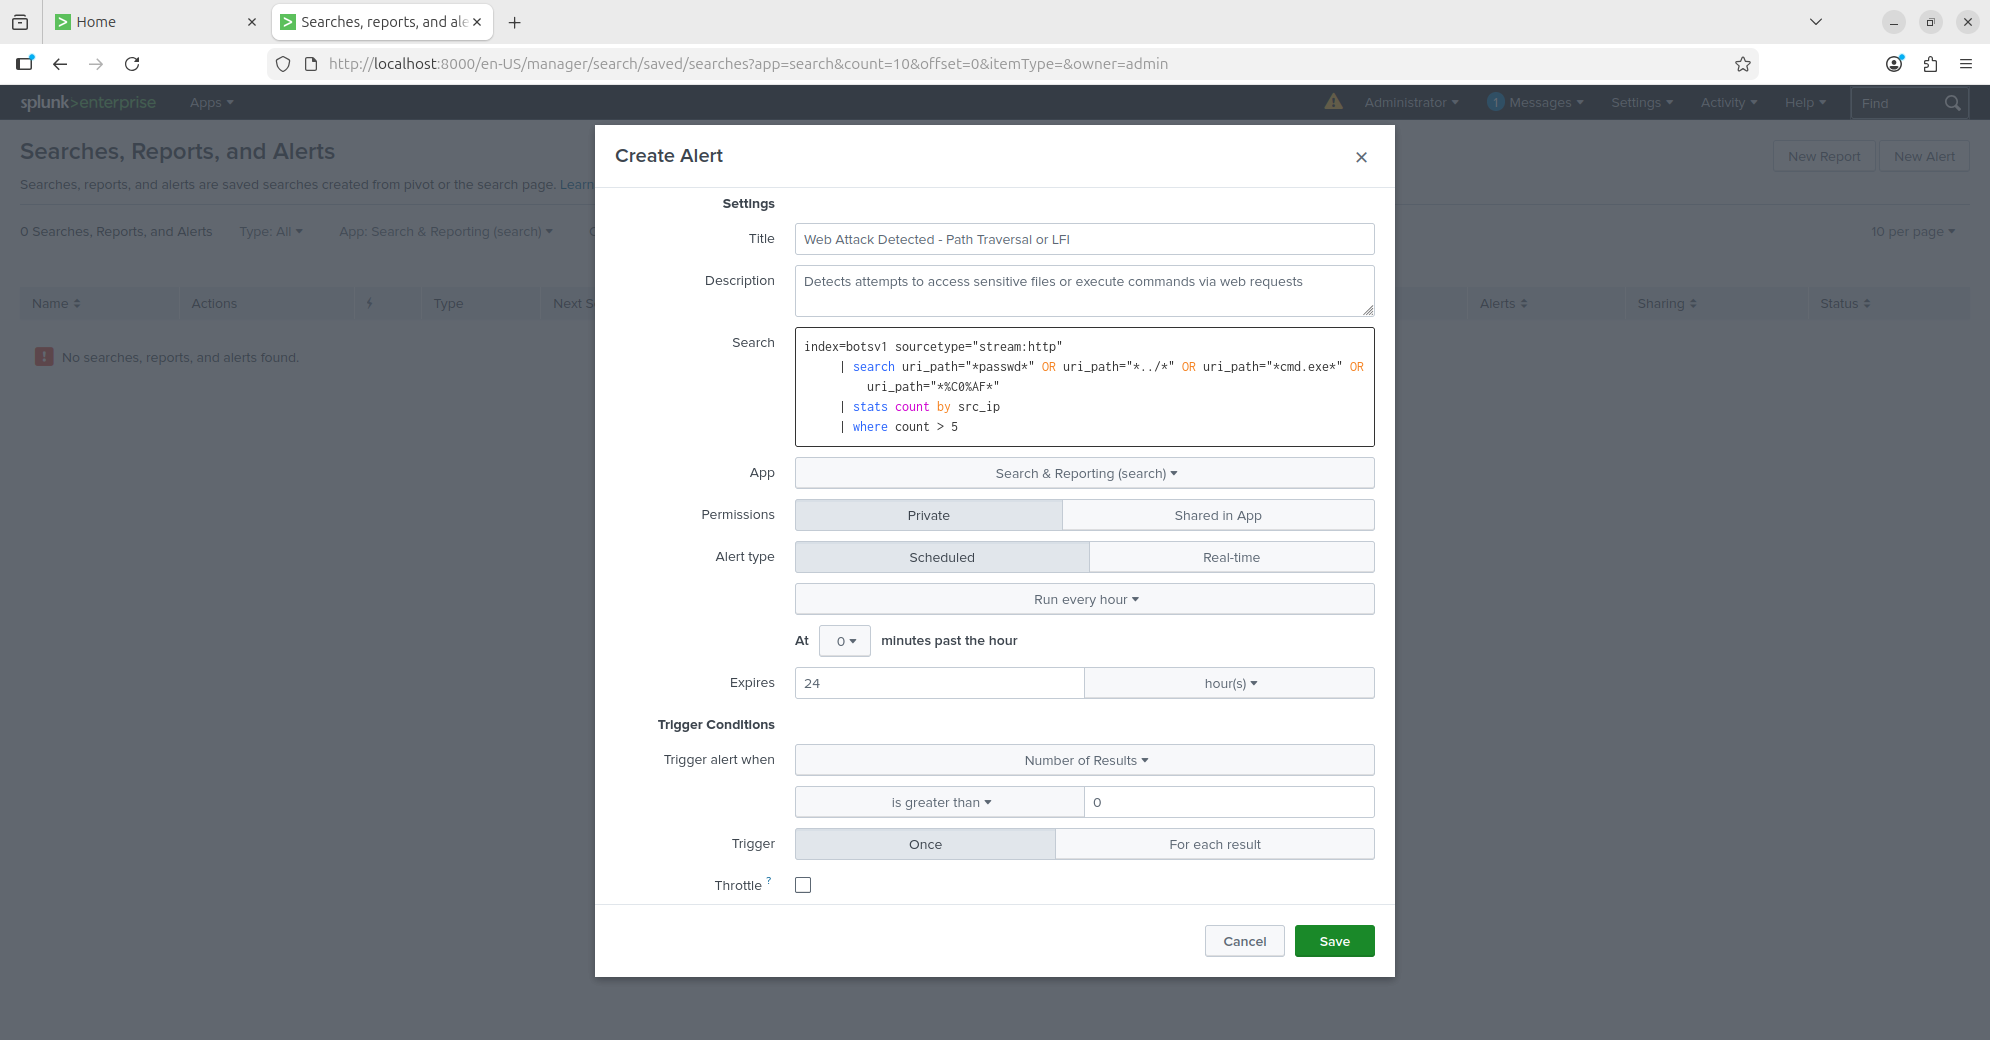
Automated web attack alert configuration — detects path traversal, LFI, and command execution attempts via SPL pattern matching, scheduled to run every hour
**告警配置:** - **标题:** 检测到 Web 攻击 - 路径遍历或 LFI - **搜索:** index=botsv1 sourcetype="stream:http" | search uri_path="*passwd*" OR uri_path="*../*" OR uri_path="*cmd.exe*" OR uri_path="*%C0%AF*" | stats count by src_ip | where count > 5 - **时间表:** 每小时 - **触发器:** 结果数量 > 0 - **严重性:** 高 ### 告警规则库
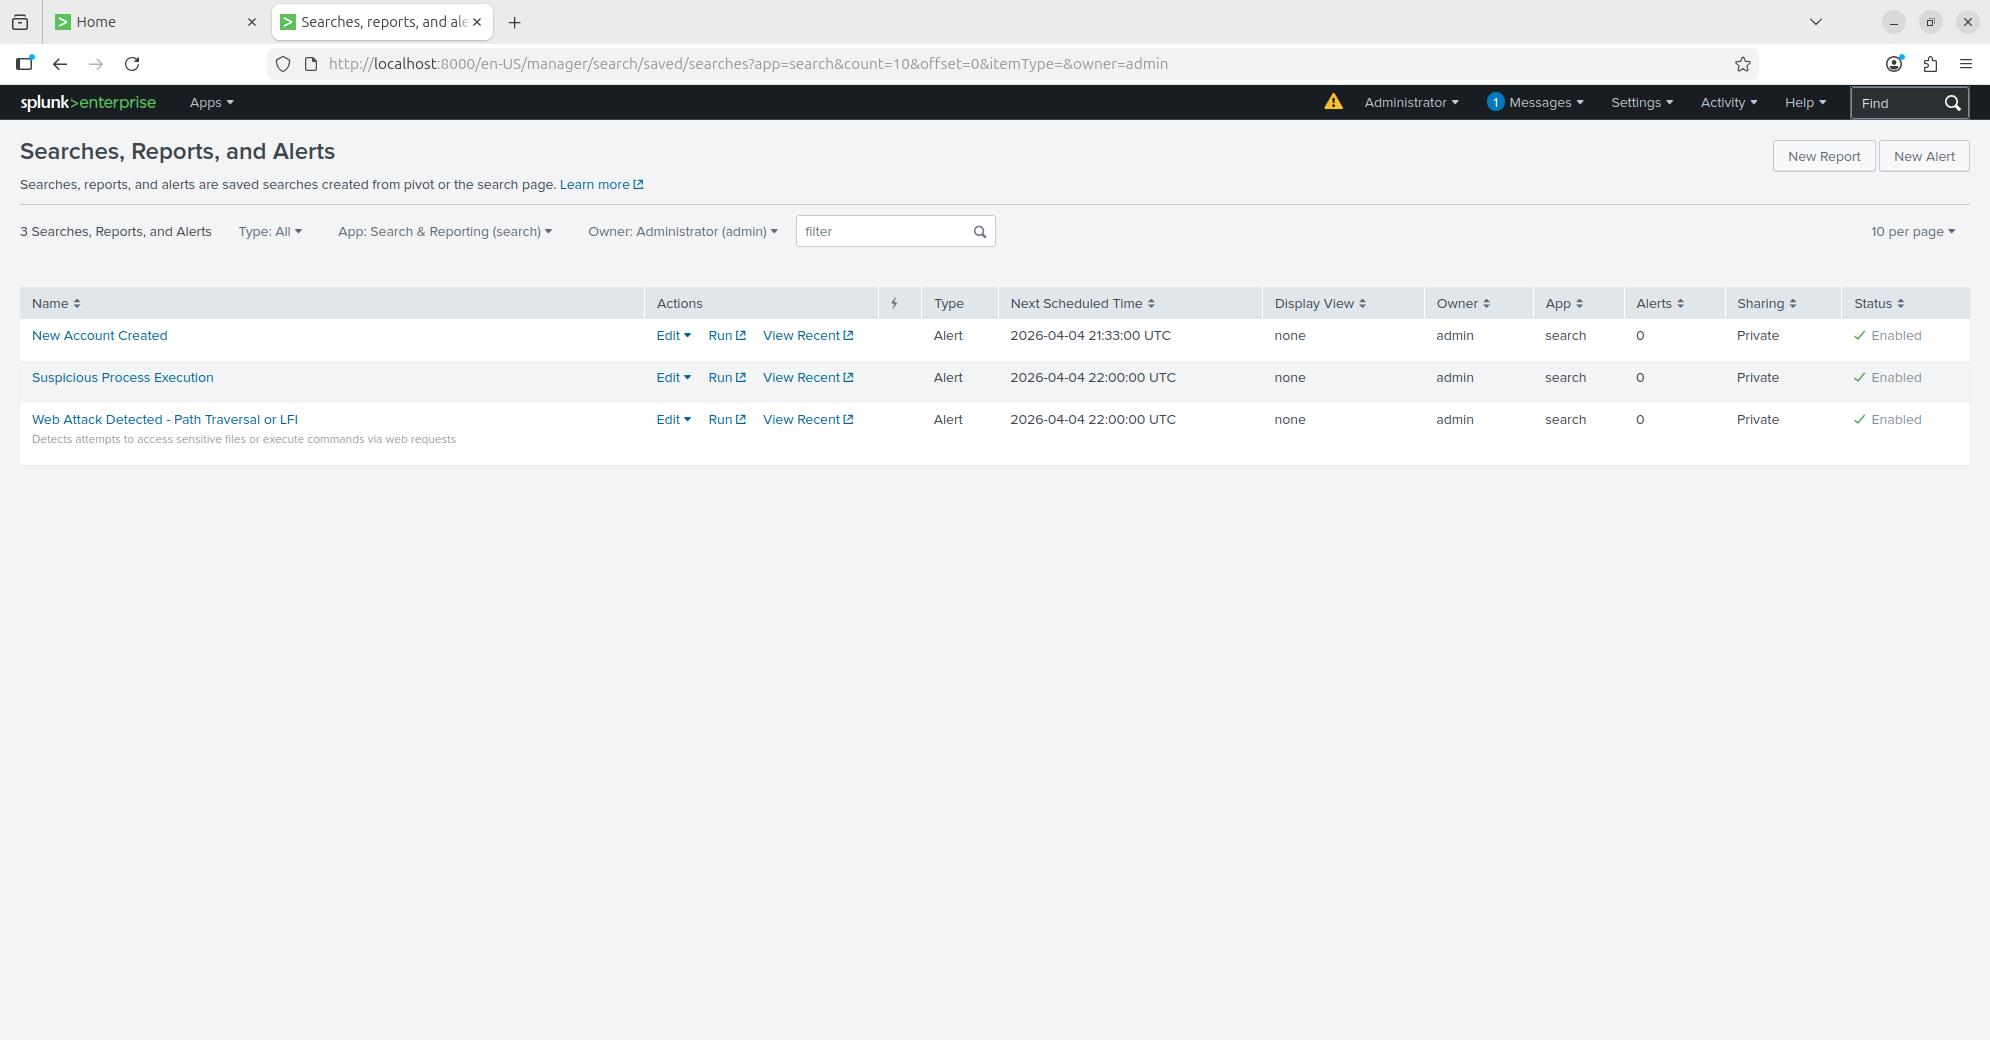
Configured security alerts providing layered automated detection — web attacks (High), suspicious process execution (Medium), and new account creation (High) — all scheduled and enabled
| 告警名称 | 条件 | 严重性 | 时间表 | |---|---|---|---| | **检测到 Web 攻击 - 路径遍历或 LFI** | 来自单一 IP 的 >5 个恶意 URI 模式 | 高 | 每小时 | | **可疑的进程执行** | 同一账户 >10次异常执行 cmd.exe/powershell.exe | 中 | 每小时 | | **已创建新账户** | 检测到 EventCode 4720 | 高 | 每小时 | ## 第 6 部分 - 攻击调查与事件时间线 ### 调查攻击者的完整活动 使用在第 3 部分中确定的攻击者 IP (**40.80.148.42**),我关联了他们在所有日志源中的活动,以重建完整的攻击时间线: ``` index=botsv1 (src_ip="40.80.148.42" OR src="40.80.148.42") | eval source_type=sourcetype | timechart span=5m count by source_type ```
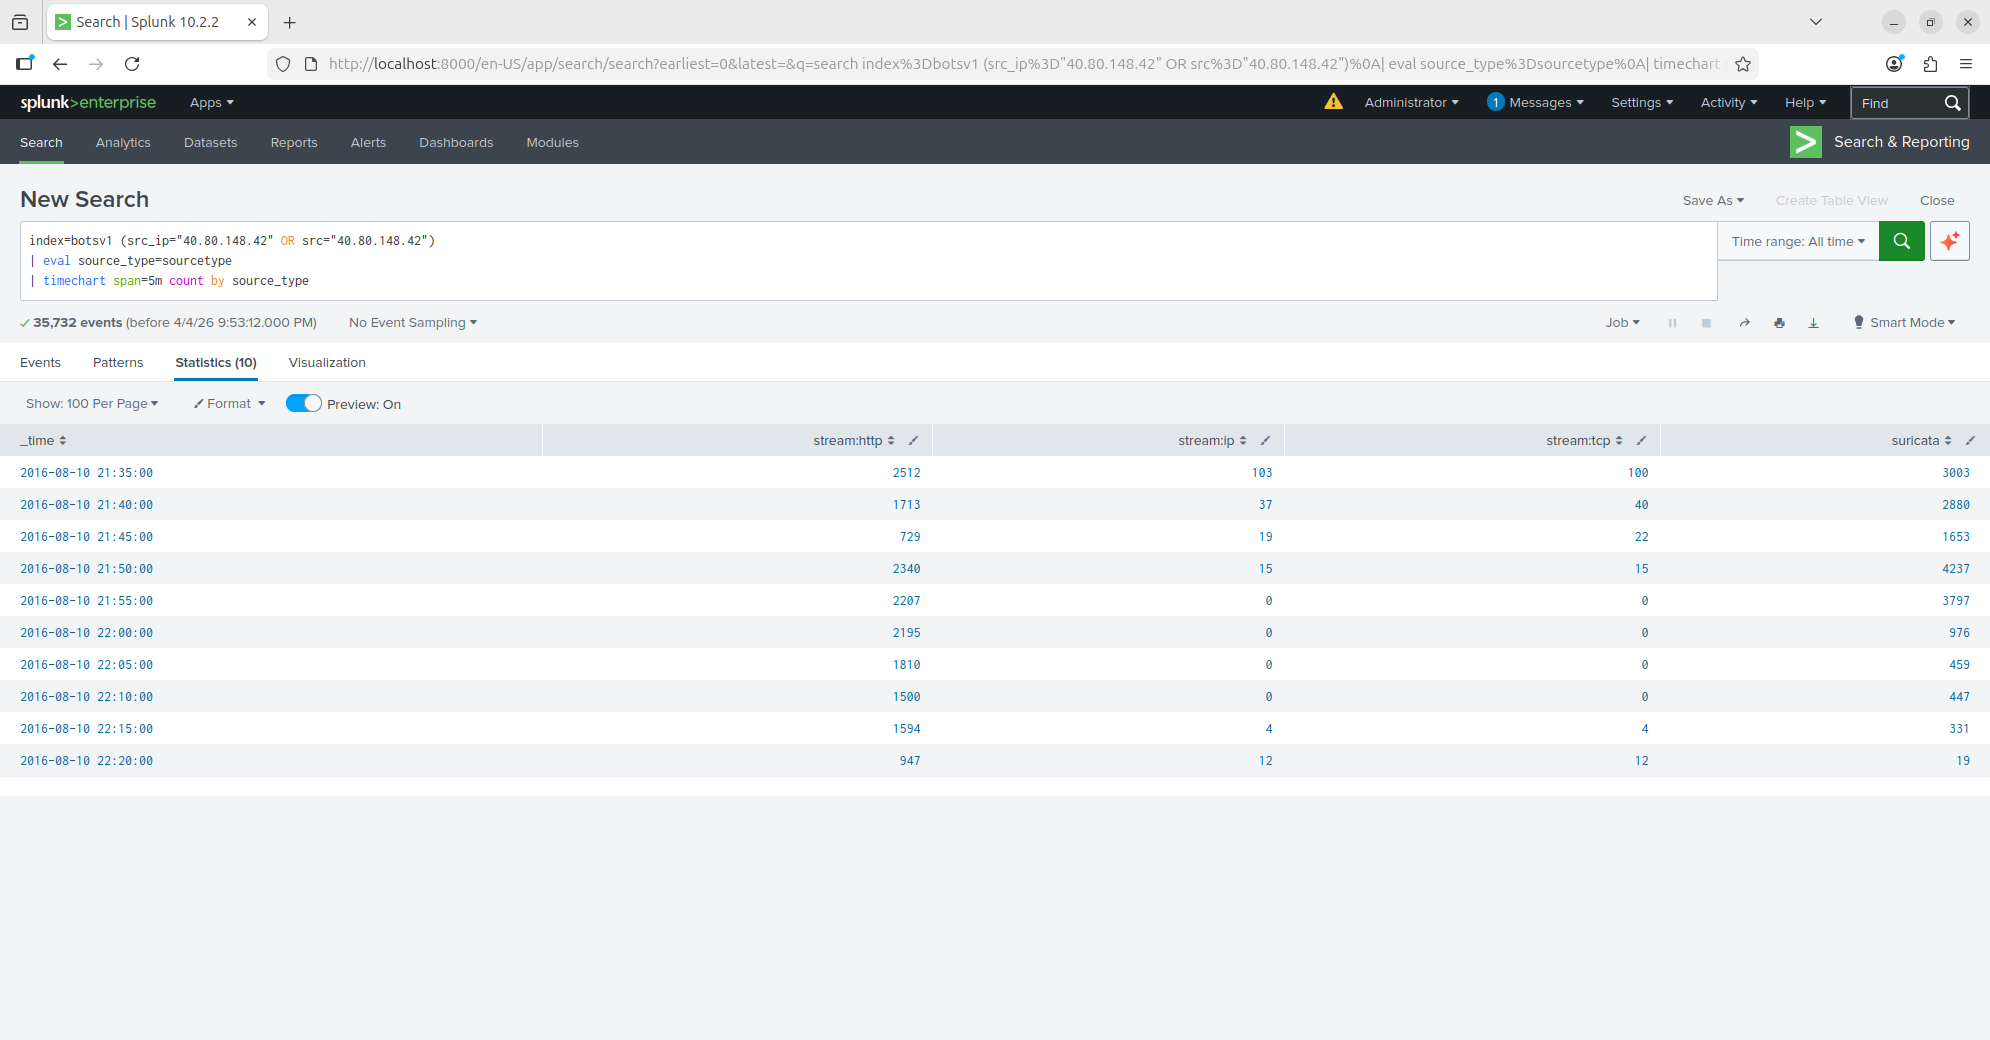
Cross-source correlation of attacker 40.80.148.42 — revealing 35,732 total events spanning HTTP stream data, IP/TCP connections, and Suricata IDS alerts, all clustered into a 45-minute attack window starting at 21:35 on August 10, 2016
### 重建的攻击时间线 将 `stream:http`、`stream:ip`、`stream:tcp` 和 `suricata` 中的事件进行关联,揭示了攻击者的活动模式: | 时间 (UTC) | 阶段 | 主要证据 | 活动 | |---|---|---|---| | **21:35** | 侦察 | stream:http (2,512 个事件) + suricata (3,003 个告警) | 初始 Web 扫描 — IDS 立即检测到攻击模式 | | **21:40** | 主动利用 | stream:http (1,713) + suricata (2,880) | 发送路径遍历 + LFI payload | | **21:45** | 漏洞利用 | stream:http (729) + suricata (1,653) | 攻击继续,探索攻击面 | | **21:50** | 活动高峰 | stream:http (2,340) + suricata (4,237 个告警) | 攻击加剧 — IDS 告警量最高 | | **21:55** | 漏洞利用 | stream:http (2,207) + suricata (3,797) | 持续的激进扫描 | | **22:00-22:10** | 持久化尝试 | stream:http (~1,500-1,800/5min) | TCP/IP 层活动停止,仅 HTTP 继续 | | **22:15-22:20** | 收尾 | stream:http (~947-1,594) | 攻击活动减少 | **关键调查发现:** 1. **明确的攻击特征:** 攻击者在不到 15 分钟内产生了超过 10,000 条 Suricata IDS 告警——这是一个巨大的数量,任何 SOC 都会捕捉到 2. **多层检测:** 相同的恶意活动同时出现在 HTTP 流、TCP/IP 流和 IDS 日志中——展示了纵深防御 3. **攻击持续时间:** 整个攻击持续了大约 45 分钟,这是自动化扫描工具的典型特征 4. **攻击范围:** 来自单一源 IP 的总共 35,732 个事件——用于检测的信噪比高 5. **攻击者技术特征:** 大量使用 UTF-8 超长编码(`%C0%AF`, `%E0%80%AF`)表明使用的是自动化扫描器或自定义工具,而不是手动漏洞利用 ## 第 7 部分 - Risk-Based Alerting 第 1–6 部分构建的检测规则各自会引发自己的告警。这种模型在接触真实环境时无法存活,本节将替换它。 ### 为什么基于单次检测的告警会失败 考虑一个在一小时内执行了以下操作的源地址: 1. 请求了 200 个 URL 并全部收到 404 响应 2. 发送了少量包含 `UNION SELECT` 的请求 3. 针对域控制器产生了 25 次失败登录 4. 成功通过身份验证 在基于单次检测的告警模式下,这是四个值得注意的事件,可能会分配给不同的分析师,并且每个都被作为低严重性关闭。扫描是面向互联网的主机上的背景噪音。二十五次失败登录是一个被遗忘的服务帐户。一次成功的登录是正常的。 但它们结合在一起就是一次入侵,而没有任何单独的告警指出了这一点。 **Risk-Based Alerting**(RBA)颠覆了这种模型:每次检测都会针对实体写入一个*带有评分的 risk event*,当累积的风险超过阈值时就会触发告警。这四个信号变成了一个实体在四个检测规则和三种 ATT&CK 技术中累积了 195 的风险评分——这是一次已经组合好完整故事的单次调查。从业人员报告称,改变模式后,告警量减少了 50% 到 90%。 ### 在这里是如何实施的 [`detections/`](detections/) 中的每个检测规则都带有一个 `rba` 块: ``` rba: message: $src$ authenticated successfully as $user$ after $failures$ failed attempts within the same hour. risk_objects: - field: src type: system score: 70 threat_objects: [] ``` `contentctl build` 将其编译为 Splunk ES 使用的 saved-search 配置: ``` action.risk = 1 action.risk.param._risk = [{"risk_object_field": "src", "risk_object_type": "system", "risk_score": 70}] ``` **Risk objects** 是受怀疑的实体。**Threat objects** 是支持性指标——一个 URL、一个特征码、一个哈希值——它们随事件一起传递但不进行评分。将两者反转是最常见的 RBA 错误;对 URL 进行评分会用 URL 而不是主机填满你的最高风险列表。 ### 评分 | 检测规则 | ATT&CK | Risk object | 评分 | |---|---|---|---| | 来自单一来源的过多失败登录 | T1110.001 | src / user | 30 / 20 | | 爆发式失败登录后的成功登录 | T1110.001 | src | 70 | | 特权组成员身份更改 | T1098 | user | 40 | | Web SQL 注入尝试 | T1190 | src | 60 | | 通过 Not Found 响应进行 Web 扫描 | T1595.003 | src | 35 | | 高严重性 Suricata IDS 告警 | T1595 | src | 45 | 风险评分不是严重性评级。它只回答一个问题:**这个观察结果在多大程度上改变了我对该实体已被入侵的判断?** 组成员身份更改是一种真正的持久化技术 (T1098),评分为 40,因为 IT 管理员每天都在做这件事——该评分反映了在环境中的证据权重,而不是抽象技术的严重性。 没有评分超过 70,这是故意的。如果某个检测评分达到 90+,就会重新变成单次检测触发一次告警,因为触发一次就会单独超过任何合理的阈值。如果确实需要无论上下文如何都值得立即响应,它应该被设为 notable——诚实的做法是直接说明这一点,而不是夸大评分。 完整的方法论、阈值选择和失败模式见:[`docs/rba-guide.md`](docs/rba-guide.md)。 ## 第 8 部分 - Detection-as-Code 检测规则即代码。它们是被版本控制的、经过审查的、并且是编译过的——否则它们就会失效。 ### contentctl [`contentctl`](https://github.com/splunk/contentctl) 是 Splunk 威胁研究团队的 content 工具,也是用于构建随 Enterprise Security 附带的 ESCU app 的同一工具。它将检测规则从 YAML 转换为 Splunk 的 `.conf` 文件,验证 macro 和 object 引用,并将所有内容打包成一个可安装的 app。 ``` pip install contentctl contentctl validate # schema, references, RBA structure contentctl build # -> dist/botsv1_soc_detections-latest.tar.gz ``` Repository 的布局符合 contentctl 的约定:`detections/`, `macros/`, `stories/`, `data_sources/`, `deployments/`, `lookups/`。 ### CI 检查的内容 [`.github/workflows/validate-content.yml`](.github/workflows/validate-content.yml) 会在每次触及 content 的 push 时运行: | 检查项 | 用途 | |---|---| | **`contentctl validate`** | 模式一致性和引用解析 — Splunk 自己的验证器 | | **`contentctl build`** | 证明 content 可以编译为可安装的 `.conf`,而不仅仅是 YAML 可以解析 | | **RBA stanza 计数** | 断言每个检测规则都生成了 risk 动作。一个 `rba` 块未能序列化的检测规则会在没有风险评分的情况下静默部署。 | | 必需文件存在 | 直接指明,而不是在以后作为引用错误出现 | | 检测 ID 唯一性 | 重复的 ID 会静默覆盖检测规则 | | ATT&CK + RBA 覆盖范围 | 没有检测规则会在缺少 technique ID 和 risk object 的情况下合并 | | App 构件上传 | 构建好的 app 可从运行记录中下载 | 构建步骤是最重要的一步。模式验证表明检测规则格式良好;将其构建到 `.conf` 文件中才说明它确实能够部署。 ### Macros 保持检测规则的可移植性 Index 名称存在于 macros 中,而不是搜索中: ``` name: botsv1_windows_security definition: index=windows_security ``` 每个检测规则还会获得一个 `_filter` macro,默认情况下为空,它位于搜索的末尾。调优工作在这里进行,而不是在检测逻辑中进行——规则文件和调优文件会因为不同的原因并在不同的时间表上进行更改。 ### 诚实的局限性 `contentctl` 可以告诉你一个检测规则格式是否良好。它无法告诉你它是否正确。一个搜索你的 add-on 未填充的数据模型字段的检测规则将会通过验证、构建、部署,但永远不会触发。 相关:这些检测规则带有 `tags.manual_test` 而不是自动化测试数据。contentctl 的测试框架针对容器化的 Splunk 重放 `attack_data` 样本,这不适合基于 BOTSv1 构建的 content——一个无法提交的 3340 万个事件的语料库。**这是一个真实的差距**,并且是比配套的 Suricata 项目所能实现的更弱的保证。它记录在 [`docs/known-limitations.md`](docs/known-limitations.md) 中,而不是被掩盖过去。 ## 第 9 部分 - Pipeline 集成 本项目是三个 Repository 的 Pipeline 中的 SIEM 层。规则在具备协议专业知识的地方编写,然后在这里进行转换或接入,以进行关联和风险评分。 ``` wireshark-threat-detection suricata-ids-rules Sigma rules Suricata rules → EVE JSON │ │ │ contentctl / sigma convert │ inputs.conf / props.conf ▼ ▼ splunk-siem-analysis contentctl YAML → risk events → RBA ``` ### Suricata EVE JSON — 已实现 [`botsv1_high_severity_suricata_ids_alert.yml`](detections/network/botsv1_high_severity_suricata_ids_alert.yml) 通过 `Intrusion_Detection` 数据模型使用来自 [suricata-ids-rules](https://github.com/jesse12-21/suricata-ids-rules) 项目的告警。 将 IDS 告警视为风险而不是 notables 才是关键所在。一个经过调优的传感器仍然会产生比 SOC 能够单独分类的更多的告警——作为一种风险来源,这种数量变得有用而不是有害。 两个操作上的警告,都在 [`docs/integrations.md`](docs/integrations.md) 中:默认情况下,EVE JSON 会记录所有事件类型,而不仅仅是告警,这是一种了解 Splunk 许可机制的高昂代价的方式。此外,Suricata 的数字严重性与 CIM 词汇表是相反的——严重性 1 是*最*严重的。 ### Sigma 规则 — 已记录,未实现 [wireshark-threat-detection](https://github.com/jesse12-21/wireshark-threat-detection) 项目维护着七个 Sigma 规则,而 contentctl 具有原生的 Sigma 支持。转换只需一条命令。 转换不能产生的是 contentctl 检测规则。它发出一个搜索字符串;RBA 块、数据源定义、ATT&CK 标签和故事引用仍然是手动的。“Sigma 转换为 Splunk” 通常被展示为一个单步过程,但事实并非如此。 该机制通过一个检测规则得到了证明,而不是声称覆盖了全部七个。这是它真实的现状。 ## 🔑 关键 SPL 查询参考 本项目中使用的所有检测查询的快速参考: | 查询目的 | 关键 SPL | |---|---| | 按 index 划分的事件计数 | `\| eventcount summarize=false index=botsv1 \| table index, count` | | Sourcetype 分布 | `index=botsv1 \| stats count by sourcetype \| sort -count` | | EventCode 频率 | `index=botsv1 sourcetype="WinEventLog:Security" \| stats count by EventCode \| sort -count` | | 进程执行基准 | `index=botsv1 EventCode=4688 \| stats count by New_Process_Name \| sort -count` | | Web 攻击检测 | `index=botsv1 sourcetype="stream:http" \| search uri_path="*../*" OR uri_path="*passwd*"` | | 顶级 Web 源 IP | `index=botsv1 sourcetype="stream:http" \| stats count by src_ip \| sort -count` | | 地理位置分析 | `index=botsv1 sourcetype="stream:http" \| iplocation src_ip \| stats count by Country, City` | | 跨源 IP 关联 | `index=botsv1 (src_ip="X" OR src="X") \| eval source_type=sourcetype \| timechart span=5m count by source_type` | ## 🧰 工具与环境 | 组件 | 版本 | 用途 | |---|---|---| | **Ubuntu** | 24.04 LTS | 主机操作系统 (VirtualBox 虚拟机) | | **Splunk Enterprise** | 10.2.2 (实验室) | SIEM 平台。屏幕截图是在 10.2.2 上捕获的;ES 8.5.1 列出了至 10.5 的平台兼容性。 | | **Splunk Enterprise Security** | 8.x | Risk-Based Alerting、risk index、findings | | **contentctl** | 5.5.16 | Detection-as-code:验证、构建、打包 | **BOTS v1 数据集** | 1.0 | 真实的攻击场景数据(3340 万个事件) | | **VirtualBox** | 最新版 | 虚拟机 hypervisor | ## 📚 总结 本项目通过九个循序渐进的练习展示了实用的 SIEM 操作技能: 1. **接入与导入** — 在 Ubuntu 24.04 上安装 Splunk Enterprise 10.2.2,加载 BOTS v1 数据集(跨越 26 个 source types 的 3340 万个事件),并验证成功的接入 2. **SPL 基础** — 使用 SPL 查询探索数据结构,识别关键 Windows EventCodes(4688、4703、4624)并了解数据集的组成 3. **威胁检测** — 编写用于进程执行异常和 Web 应用程序攻击的检测查询,识别出单一攻击者 IP (40.80.148.42) 使用编码绕过技术执行路径遍历、LFI 和 RCE 尝试 4. **安全仪表盘** — 构建了四面板的 SOC 概览仪表盘以及地理位置分析,针对正常基准流量将攻击者的活动可视化 5. **告警规则** — 配置了三个自动化告警(Web 攻击、可疑进程执行、新账户创建),带有基于严重性的分类和每小时的时间计划 6. **攻击调查** — 将来自攻击者的 35,732 个事件跨 HTTP 流、TCP/IP 流和 Suricata IDS 日志进行关联,利用 10,000+ 条 IDS 告警重建了 45 分钟的攻击时间线,展示了纵深防御检测 7. **Risk-Based Alerting** — 用实体风险评分取代了单次检测告警。六个检测规则针对用户和系统写入带有评分的 risk events,而不是引发单独的 notables,因此多阶段入侵会作为一个带有完整故事的高风险实体浮出水面,而不是四个断开连接的、被作为低严重性关闭的告警 8. **Detection-as-Code** — 将检测规则重建为 `contentctl` YAML — Splunk 自己的 content 工具,即构建 ESCU app 的工具 — 带有 MITRE ATT&CK 映射、风险评分和调优过滤器。CI 验证 schema 并且**在每次 push 时构建可安装的 Splunk app**,因此无法部署的检测规则无法到达 main 分支 9. **Pipeline 集成** — 将来自配套 IDS 项目的 Suricata EVE JSON 作为风险源接入,并记录了来自 Wireshark 项目的 Sigma 到 SPL 的转换路径,形成了从数据包捕获、传感器规则到 SIEM 关联的三个 Repository 的检测 pipeline ### 展示的技能 `SIEM 运营` · `检测工程` · `Detection-as-Code` · `Risk-Based Alerting` · `MITRE ATT&CK` · `Splunk 管理` · `SPL & tstats` · `CIM 数据模型` · `Splunk Enterprise Security` · `contentctl` · `威胁检测` · `安全仪表盘` · `告警工程` · `事件调查` · `日志关联` · `攻击时间线重建` · `CI/CD`
### 🔗 相关项目
[](https://github.com/jesse12-21/wireshark-threat-detection)
[](https://github.com/jesse12-21/nmap-network-recon)
[](https://github.com/jesse12-21/suricata-ids-rules)
[](https://github.com/jesse12-21/threat-intel-enricher)
[](https://github.com/jesse12-21/aws-cloud-security-lab)
*作为一个网络安全作品集项目构建 — 欢迎反馈和建议。*
*作为一个网络安全作品集项目构建 — 欢迎反馈和建议。*
标签:AMSI绕过, Cloudflare, Metaprompt, MITRE ATT&CK, 威胁检测, 安全运营, 扫描框架, 检测即代码