hernannh/ipflame
GitHub: hernannh/ipflame
面向蓝队的轻量 Web 日志威胁情报扫描器,内置 238 条检测规则,自动分析日志、丰富 IP 情报并计算风险评分,输出多种格式报告便于 SIEM 集成与自动化响应。
Stars: 0 | Forks: 0
# IP-Flame CTI
面向 Blue Team 的**威胁情报仪表板**。扫描 Web 服务器日志,检测恶意模式(14 个类别中的 238 条规则),利用地理定位/ASN/风险数据丰富恶意 IP 信息,计算风险评分(0-100),并生成多种格式的报告以便与 SIEM 集成。
```
time=2026-04-03T13:06:26.570-03:00 level=INFO msg="Iniciando IP-Flame Multi-Log Engine" version=3.2
time=2026-04-03T13:06:26.571-03:00 level=INFO msg="Patrones cargados" count=238 format=nginx-combined
time=2026-04-03T13:06:26.571-03:00 level=INFO msg="GeoLite2-City cargada"
time=2026-04-03T13:06:26.572-03:00 level=INFO msg="GeoLite2-ASN cargada"
time=2026-04-03T13:06:29.100-03:00 level=INFO msg="Enriquecimiento CTI" local=3421 api=258 note="258 IPs enviadas a ipquery.io para enriquecimiento"
time=2026-04-03T13:06:29.300-03:00 level=INFO msg=Resultados threat_actors=89 hits=1372 patterns=238
time=2026-04-03T13:06:29.350-03:00 level=INFO msg="Dashboard generado" path=output/flamed-ips.html
time=2026-04-03T13:06:29.400-03:00 level=INFO msg="Geo Intelligence dashboard" path=output/dashboard-geo.html
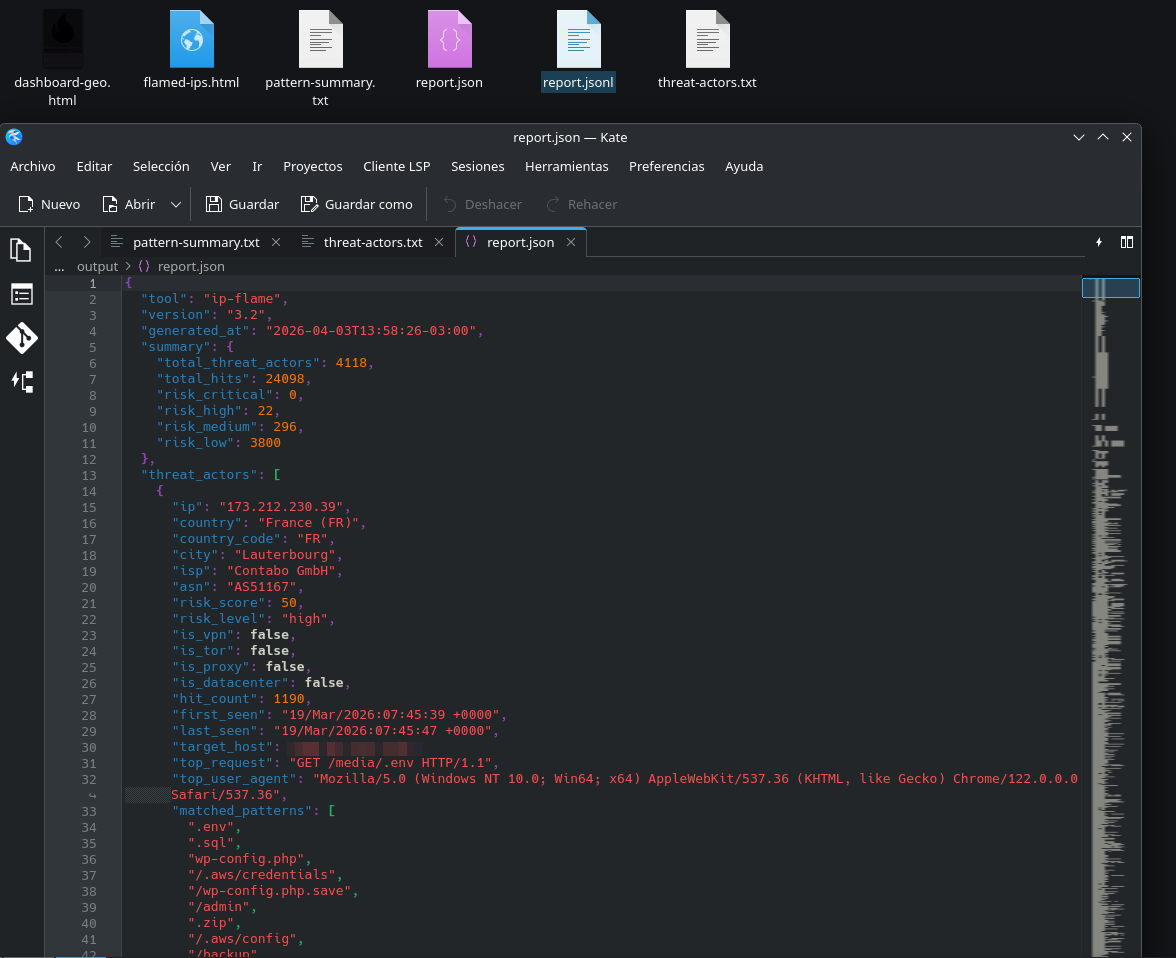
time=2026-04-03T13:06:29.410-03:00 level=INFO msg="Reporte JSON exportado" path=output/report.json
time=2026-04-03T13:06:29.420-03:00 level=INFO msg="IP-Flame finalizado" version=3.2
```
## 截图
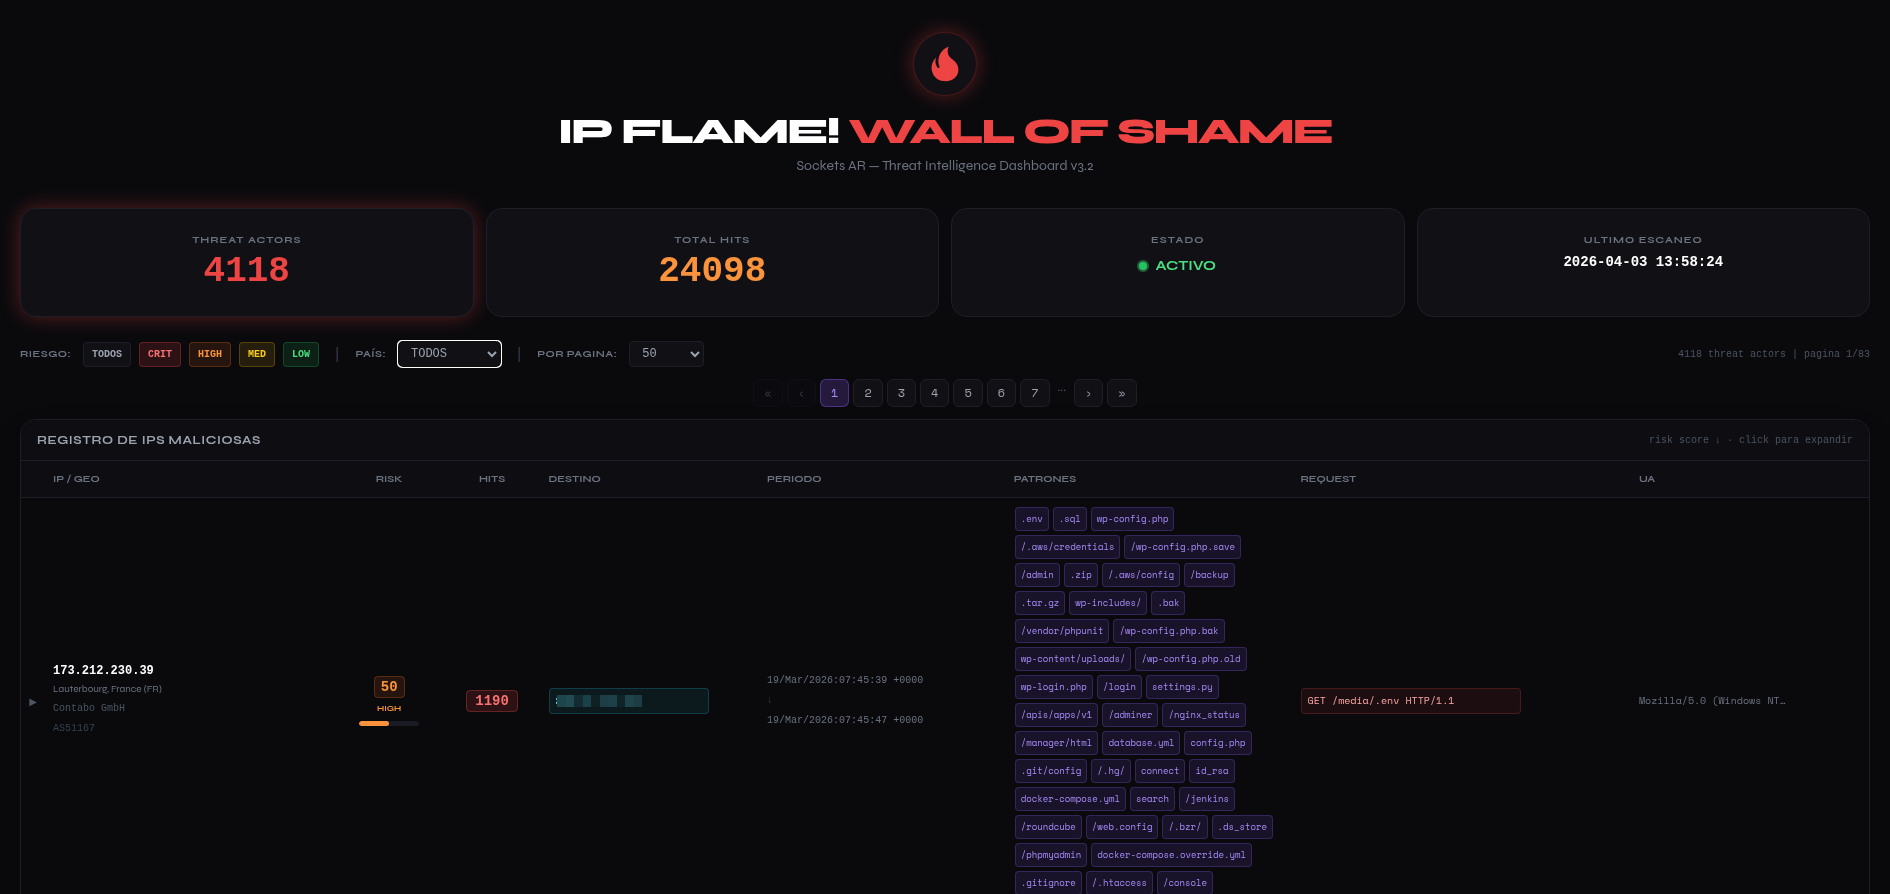
### Wall of Shame — 运营仪表板


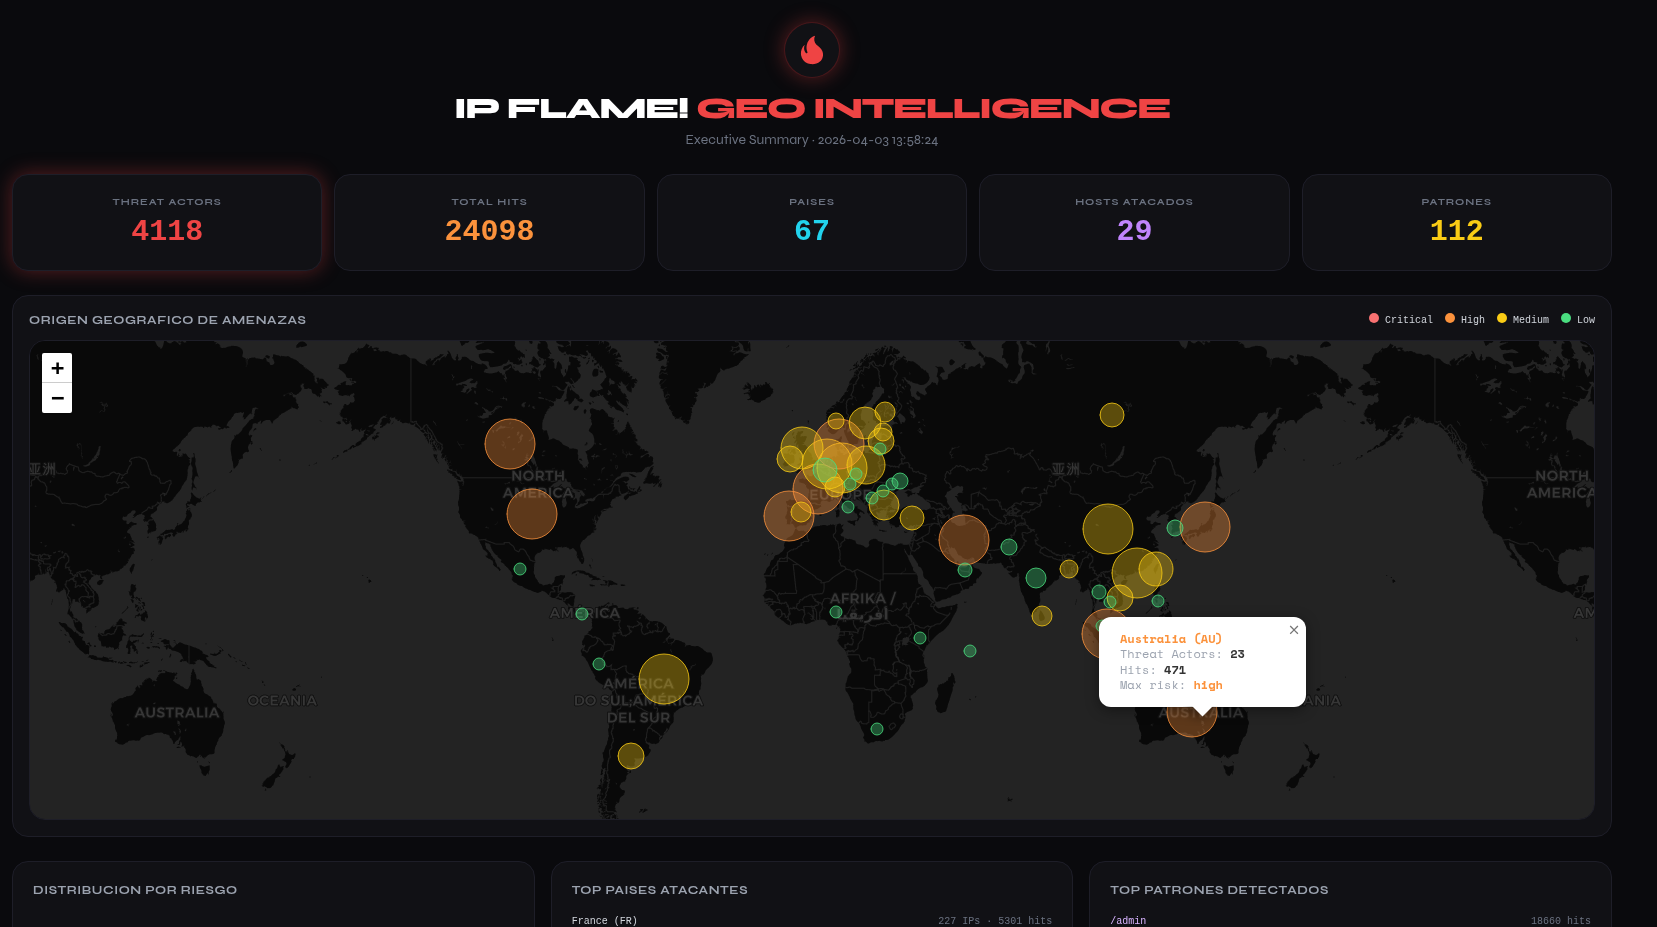
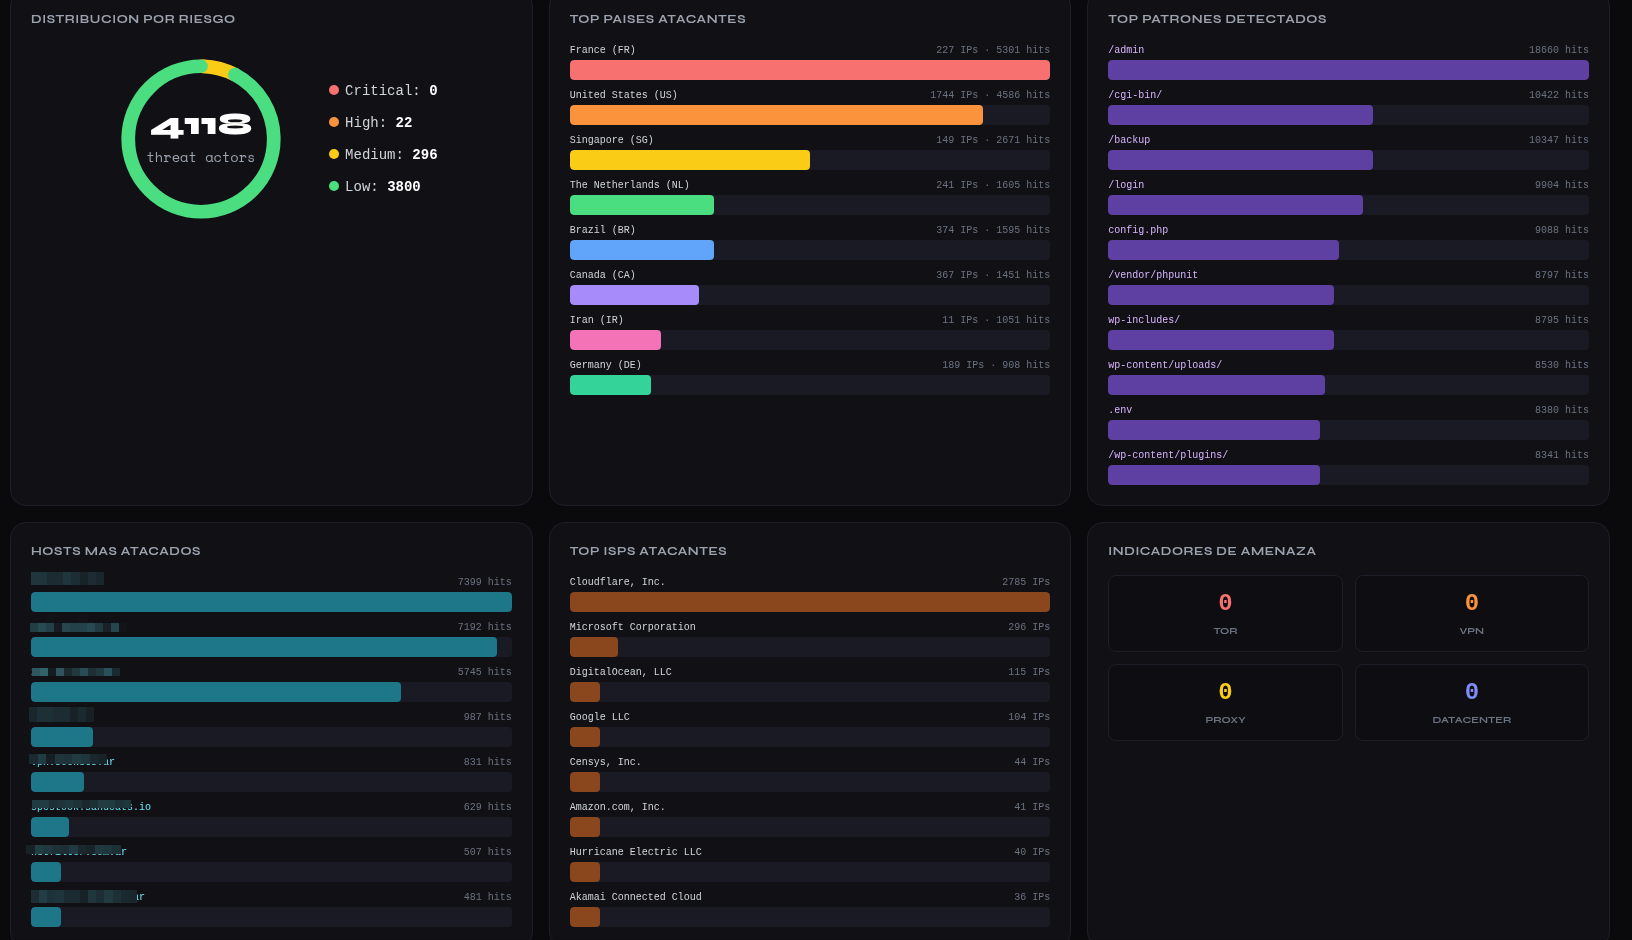
### Geo Intelligence — 交互式地图
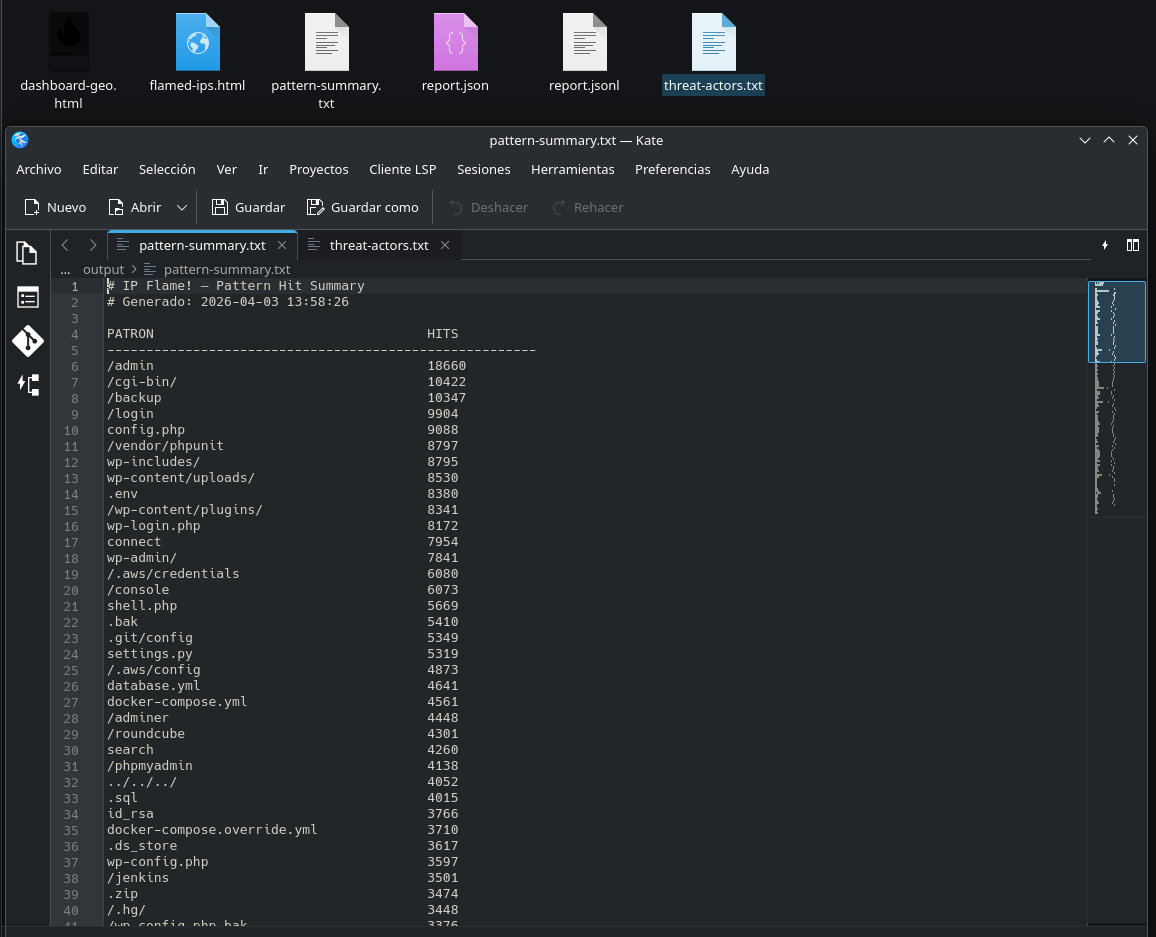
### 报告与输出
## 目录
- [截图](#screenshots)
- [功能特性](#caracteristicas)
- [快速开始](#inicio-rapido)
- [使用二进制文件](#uso-con-binario)
- [使用 Docker](#uso-con-docker)
- [配置](#configuracion)
- [输出文件](#archivos-de-salida)
- [与 SIEM 集成](#integracion-con-siem) — Wazuh, Elasticsearch, Splunk
- [Webhooks](#webhooks) — Slack, Telegram, Discord, n8n
- [与 CrowdSec 集成](#integracion-con-crowdsec)
- [风险评分](#risk-scoring)
- [API 透明度](#transparencia-de-la-api)
- [GeoIP 数据库](#bases-de-datos-geoip)
- [检测类别](#categorias-de-deteccion) — 14 个类别中的 238 个模式
- [仪表板](#dashboards) — Wall of Shame + Geo Intelligence
- [许可证](#licencia)
## 功能特性
- **威胁检测** — 14 个类别中的 238 个模式:CMS、配置泄露、VCS、RCE/webshells、SQLi、XSS、命令注入、Log4Shell/JNDI、SSRF/cloud metadata、扫描器、活跃 CVE、AI 爬虫、协议滥用、工具指纹识别
- **混合 CTI** — 使用 GeoLite2(City + ASN)进行本地解析,自动回退到 [ipquery.io](https://ipquery.io) API(包括 VPN/Tor/Proxy/Datacenter 检测和风险评分)。当向外部 API 发送 IP 时会有明确的日志记录
- **风险评分** — 每个 IP 的 0-100 评分,基于:命中量、模式多样性、匿名化指标(Tor/VPN/Proxy)和 API 评分
- **不区分大小写检测** — 小写匹配 + 递归 URL 解码(2 层)以检测编码逃避
- **多种输出格式** — Wall of Shame HTML、Geo Intelligence 仪表板(Leaflet 地图)、JSON、JSONL (SIEM)、threat-actors.txt (CrowdSec)、pattern-summary.txt
- **Geo Intelligence 仪表板** — Leaflet 交互式地图、风险分布、Top 国家/ISP/模式/受攻击主机、TOR/VPN/Proxy 指标
- **可选目标主机** — 条件列,显示每个攻击指向您基础设施的哪个域名/IP(需要 `log-host-field`)
- **Webhooks** — 向 Slack、Telegram、Discord、n8n 或通用端点发送警报,按风险级别过滤
- **Watch 模式** — 类似 `tail -f` 的持续监控,间隔可配置
- **多格式支持** — nginx/apache combined (W3C) 日志、自定义 key-value 格式和 IIS W3C Extended
- **并发** — 并行扫描多个日志文件
- **分页与筛选** — HTML 仪表板具有可配置分页(25/50/100/250/全部)、按风险级别筛选和按国家筛选(从结果自动填充的下拉菜单)
- **Structured logging** — 所有包使用 `log/slog`(默认文本模式,带 `--log-json` 的 JSON 模式用于 SIEM/可观测性)
- **环境变量** — 通过 `IPFLAME_*` 进行配置作为回退(配置文件优先)
- **Exit codes** — 0=成功,1=无日志文件,2=配置错误(已文档化用于 cron/systemd 集成)
- **Security hardening** — 防止路径遍历、模式长度限制(256 字符)、API 响应中的 IP 验证
- **预编译二进制文件** — Linux 和 macOS(amd64/arm64),零依赖,可在 GitHub Releases 获取
## 快速开始
### 系统要求
- Linux (amd64/arm64), macOS (amd64/arm64) 或 Windows (amd64)
- GeoLite2 数据库(可选,使用 `update-geoip.sh` 下载)
### 从 GitHub Releases 安装
```
# Linux amd64
curl -Lo ip-flame https://github.com/hernannh/ipflame/releases/latest/download/ip-flame-linux-amd64
chmod +x ip-flame
# Linux arm64 (Raspberry Pi, AWS Graviton)
curl -Lo ip-flame https://github.com/hernannh/ipflame/releases/latest/download/ip-flame-linux-arm64
chmod +x ip-flame
# macOS Apple Silicon (M1/M2/M3)
curl -Lo ip-flame https://github.com/hernannh/ipflame/releases/latest/download/ip-flame-darwin-arm64
chmod +x ip-flame
# Windows amd64 (PowerShell)
Invoke-WebRequest -Uri https://github.com/hernannh/ipflame/releases/latest/download/ip-flame-windows-amd64.exe -OutFile ip-flame.exe
```
### 初始设置
```
# 克隆此仓库 (templates + config)
git clone https://github.com/hernannh/ipflame.git
cd ipflame
# 下载 GeoIP 数据库 (可选但推荐)
chmod +x update-geoip.sh
./update-geoip.sh
# 编辑配置 (调整 web-log= 为你的日志路径)
nano config-ip-flame.txt
# 执行
./ip-flame --config config-ip-flame.txt
```
### 验证完整性
每个 release 都包含 `checksums-sha256.txt`:
```
sha256sum -c checksums-sha256.txt
```
### Docker
```
docker compose up --build
```
## 使用二进制文件
```
./ip-flame [flags]
```
| Flag | 默认值 | 描述 |
|---|---|---|
| `-config` | `config-ip-flame.txt` | 配置文件路径 |
| `-whitelist` | `whitelist.txt` | 白名单文件路径 |
| `-watch` | `false` | Watch 模式:持续监控日志 |
| `-interval` | `30` | 扫描间隔秒数(watch 模式) |
| `--log-json` | `false` | JSON 格式的结构化日志(输出到 stderr)。适合 SIEM/可观测性 |
### Exit codes
| 代码 | 含义 | 用途 |
|---|---|---|
| `0` | 成功 | 扫描成功完成 |
| `1` | 无日志文件 | 未找到与 `web-log` glob 匹配的文件 |
| `2` | 配置错误 | 配置文件无效、缺少参数或解析错误 |
这些代码允许与 cron、systemd 和编排脚本进行可靠集成:
```
# Cron 示例:若日志缺失则告警
/opt/ip-flame/ip-flame --config /opt/ip-flame/config.txt
EXIT_CODE=$?
if [ $EXIT_CODE -eq 1 ]; then
echo "WARN: ip-flame no encontro archivos de log" | mail -s "IP-Flame: sin logs" admin@example.com
fi
```
### 一次性执行(批处理)
扫描日志,生成所有报告并退出:
```
# 使用默认 config (在当前目录查找 config-ip-flame.txt)
./ip-flame
# 指定路径
./ip-flame --config /etc/ipflame/config.txt --whitelist /etc/ipflame/whitelist.txt
# 使用 JSON logging (重定向到 SIEM 或文件)
./ip-flame --log-json 2>> /var/log/ip-flame-structured.json
```
### 持续监控
保持进程活动,在每个间隔扫描新的日志行,如果有新命中则重新生成报告。自动支持日志轮转。
```
# Watch 间隔 30 秒 (默认)
./ip-flame --watch
# Watch 间隔 60 秒
./ip-flame --watch --interval 60
# 带 JSON logging 的 Watch
./ip-flame --watch --interval 60 --log-json
# 使用 nohup 在后台 Watch
nohup ./ip-flame --watch --interval 60 >> /var/log/ip-flame.log 2>&1 &
```
停止 watch 模式:`Ctrl+C` 或向进程发送 `SIGINT`/`SIGTERM`。
### 使用 cron 自动化(非 watch 模式)
如果您更喜欢一次性执行而不是 watch 模式:
```
# 每小时
0 * * * * /opt/ip-flame/ip-flame --config /opt/ip-flame/config.txt >> /var/log/ip-flame.log 2>&1
# 每 15 分钟
*/15 * * * * /opt/ip-flame/ip-flame --config /opt/ip-flame/config.txt >> /var/log/ip-flame.log 2>&1
```
### 使用 systemd timer 自动化
cron 的替代方案,推荐用于具有 systemd 的现代系统。提供更好的日志记录、依赖控制和错误处理。
**1. 创建 service unit** — `/etc/systemd/system/ip-flame.service`:
```
[Unit]
Description=IP-Flame CTI — Threat Intelligence Scanner
After=network.target
[Service]
Type=oneshot
ExecStart=/opt/ip-flame/ip-flame --config /opt/ip-flame/config.txt --whitelist /opt/ip-flame/whitelist.txt
WorkingDirectory=/opt/ip-flame
StandardOutput=journal
StandardError=journal
# 安全:以非特权用户运行
User=ipflame
Group=ipflame
# 可选 Hardening
NoNewPrivileges=true
ProtectSystem=strict
ReadWritePaths=/opt/ip-flame/output
ReadOnlyPaths=/var/log/nginx /opt/ip-flame/config.txt /opt/ip-flame/whitelist.txt /opt/ip-flame/geoip
PrivateTmp=true
```
**2. 创建 timer unit** — `/etc/systemd/system/ip-flame.timer`:
```
[Unit]
Description=IP-Flame CTI — Escaneo periodico
[Timer]
# 每 15 分钟运行
OnCalendar=*:0/15
# 在 60 秒窗口内随机分布执行 (避免 thundering herd)
RandomizedDelaySec=60
# 若错过上次执行则立即运行 (例如:服务器关机)
Persistent=true
[Install]
WantedBy=timers.target
```
**3. 启用并启动:**
```
# 重载 systemd
sudo systemctl daemon-reload
# 启用 timer (重启后生效)
sudo systemctl enable ip-flame.timer
# 立即启动 timer
sudo systemctl start ip-flame.timer
# 检查状态
sudo systemctl status ip-flame.timer
sudo systemctl list-timers | grep ip-flame
# 查看执行日志
sudo journalctl -u ip-flame.service -f
# 手动运行 (不等待 timer)
sudo systemctl start ip-flame.service
```
**有用的 `OnCalendar` 变体:**
```
OnCalendar=*:0/15 # Cada 15 minutos
OnCalendar=hourly # Cada hora
OnCalendar=*-*-* 06,18:00 # A las 06:00 y 18:00
OnCalendar=daily # Una vez al dia (medianoche)
OnCalendar=Mon *-*-* 03:00 # Lunes a las 03:00
```
### 作为 systemd 服务运行 watch 模式
如果您更喜欢使用 `--watch` 模式而不是 timer:
```
# /etc/systemd/system/ip-flame-watch.service
[Unit]
Description=IP-Flame CTI — Watch Mode (monitoreo continuo)
After=network.target
[Service]
Type=simple
ExecStart=/opt/ip-flame/ip-flame --config /opt/ip-flame/config.txt --watch --interval 60
WorkingDirectory=/opt/ip-flame
Restart=on-failure
RestartSec=10
StandardOutput=journal
StandardError=journal
User=ipflame
Group=ipflame
NoNewPrivileges=true
ProtectSystem=strict
ReadWritePaths=/opt/ip-flame/output
ReadOnlyPaths=/var/log/nginx /opt/ip-flame/config.txt /opt/ip-flame/whitelist.txt /opt/ip-flame/geoip
PrivateTmp=true
[Install]
WantedBy=multi-user.target
```
```
sudo systemctl daemon-reload
sudo systemctl enable --now ip-flame-watch.service
sudo journalctl -u ip-flame-watch.service -f
```
## 使用 Docker
镜像包含二进制文件、模板和默认配置。您只需要挂载日志和输出目录。
### 卷
| 主机卷 | 容器目标 | 模式 | 必需 | 描述 |
|---|---|---|---|---|
| 日志目录 | `/app/logs` | `:ro` | **是** | Web 服务器日志 |
| `output/` | `/app/output` | rw | **是** | 报告输出目录 |
| `geoip/` | `/app/geoip` | `:ro` | 可选 | GeoLite2 数据库(没有则使用 ipquery.io) |
| `config-ip-flame.txt` | `/app/config-ip-flame.txt` | `:ro` | 可选 | 仅当您需要自定义包含的配置时 |
| `whitelist.txt` | `/app/whitelist.txt` | `:ro` | 可选 | 仅当您需要自定义包含的白名单时 |
### 一次性执行
```
# Nginx
docker run --rm \
-v /var/log/nginx:/app/logs:ro \
-v ./output:/app/output \
ip-flame
# Apache
docker run --rm \
-v /var/log/apache2:/app/logs:ro \
-v ./output:/app/output \
ip-flame
# 使用本地 GeoIP 和自定义 config
docker run --rm \
-v /var/log/nginx:/app/logs:ro \
-v ./geoip:/app/geoip:ro \
-v ./mi-config.txt:/app/config-ip-flame.txt:ro \
-v ./output:/app/output \
ip-flame
```
### 使用 Docker 持续监控
```
# 前台
docker run --rm --name ip-flame-watch \
-v /var/log/nginx:/app/logs:ro \
-v ./geoip:/app/geoip:ro \
-v ./output:/app/output \
ip-flame ./ip-flame --watch --interval 60
# 后台 (daemon)
docker run -d --name ip-flame-watch \
--restart unless-stopped \
-v /var/log/nginx:/app/logs:ro \
-v ./geoip:/app/geoip:ro \
-v ./output:/app/output \
ip-flame ./ip-flame --watch --interval 60
# 查看 Watch 模式日志
docker logs -f ip-flame-watch
# 停止
docker stop ip-flame-watch
```
### Docker Compose
包含的 `docker-compose.yml` 配置用于一次性执行:
```
# 单次执行
docker compose up --build
# 后台 Watch
docker compose up -d --build
# 查看日志
docker compose logs -f
# 停止
docker compose down
```
对于 watch 模式,在 compose 中添加命令:
```
command: ["./ip-flame", "--watch", "--interval", "60"]
restart: unless-stopped
```
### 使用 cron 自动化
```
# 作为临时容器每小时运行
0 * * * * docker run --rm \
-v /var/log/nginx:/app/logs:ro \
-v /opt/ip-flame/geoip:/app/geoip:ro \
-v /opt/ip-flame/output:/app/output \
ip-flame >> /var/log/ip-flame.log 2>&1
```
### 使用 Ofelia 自动化(Docker 原生 cron)
[Ofelia](https://github.com/mcuadros/ofelia) 是一个为 Docker 设计的作业调度器 — 替代主机 cron 并允许直接在 docker-compose 标签中定义计划。无需在主机或容器内安装 cron。
**选项 A — docker-compose.yml 中的标签(推荐):**
```
services:
ip-flame:
build: .
container_name: ip-flame-run
restart: "no"
labels:
# Ofelia: ejecutar cada 15 minutos
ofelia.enabled: "true"
ofelia.job-exec.ip-flame-scan.schedule: "0 */15 * * * *"
ofelia.job-exec.ip-flame-scan.command: "./ip-flame"
ofelia.job-exec.ip-flame-scan.no-overlap: "true"
volumes:
- ./geoip:/app/geoip:ro
- /var/log/nginx:/app/logs:ro
- ./output:/app/output
ofelia:
image: mcuadros/ofelia:latest
container_name: ofelia-scheduler
restart: unless-stopped
depends_on:
- ip-flame
command: daemon --docker
volumes:
- /var/run/docker.sock:/var/run/docker.sock:ro
```
**选项 B — Ofelia 配置文件:**
如果您不想使用标签,创建一个 `ofelia.ini` 文件:
```
[job-exec "ip-flame-scan"]
schedule = 0 */15 * * * *
container = ip-flame-run
command = ./ip-flame
no-overlap = true
[job-exec "ip-flame-geoip-update"]
schedule = 0 0 3 * * 1
container = ip-flame-run
command = /bin/sh -c "apk add --no-cache curl && /app/update-geoip.sh"
no-overlap = true
```
```
# 包含 ofelia.ini 的 docker-compose.yml
services:
ip-flame:
build: .
container_name: ip-flame-run
restart: "no"
volumes:
- ./geoip:/app/geoip:ro
- /var/log/nginx:/app/logs:ro
- ./output:/app/output
ofelia:
image: mcuadros/ofelia:latest
container_name: ofelia-scheduler
restart: unless-stopped
command: daemon --config /etc/ofelia/config.ini
volumes:
- /var/run/docker.sock:/var/run/docker.sock:ro
- ./ofelia.ini:/etc/ofelia/config.ini:ro
```
**Ofelia 的有用计划:**
```
0 */15 * * * * # Cada 15 minutos
0 0 * * * * # Cada hora
0 0 */6 * * * # Cada 6 horas
0 0 0 * * * # Diariamente a medianoche
0 0 3 * * 1 # Lunes a las 03:00 (para update de GeoIP)
```
**验证 Ofelia 是否正在执行作业:**
```
docker logs -f ofelia-scheduler
```
## 配置
配置文件使用 `key=value` 格式。空行和以 `#` 开头的行将被忽略。
### 可用参数
| 参数 | 描述 | 示例 |
|---|---|---|
| `web-path=` | 输出目录(自动添加 `flamed-ips.html`) | `web-path=output/` |
| `web-log=` | 要扫描的日志文件的 Glob(支持通配符) | `web-log=/var/log/nginx/*log*` |
| `log-format=` | 日志格式:`nginx-combined`、`kv` 或 `iis-w3c` | `log-format=iis-w3c` |
| `geoip-dir=` | 包含 GeoLite2 `.mmdb` 数据库的目录 | `geoip-dir=geoip` |
| `offending-lines=` | 逗号分隔的检测模式(不区分大小写) | `offending-lines=wp-login.php,.env,nikto` |
| `log-ip-field=` | (仅 kv)包含客户端 IP 的字段 | `log-ip-field=CLIENT-IP` |
| `log-req-field=` | (仅 kv)包含 HTTP 请求的字段 | `log-req-field=REQ` |
| `log-ua-field=` | (仅 kv)包含 User-Agent 的字段 | `log-ua-field=UA` |
| `log-status-field=` | (仅 kv)包含 HTTP 状态码的字段 | `log-status-field=STATUS` |
| `log-time-field=` | (仅 kv)包含时间戳的字段 | `log-time-field=TIME` |
| `log-host-field=` | (仅 kv)包含目标 Host/域名的字段。可选 — 如未配置,报告中不显示该列 | `log-host-field=HOST` |
| `webhook=` | Webhook 配置(见 [Webhooks](#webhooks)) | `webhook=slack,https://hooks.slack.com/...` |
### 环境变量
所有配置参数都可以通过带 `IPFLAME_` 前缀的环境变量定义。配置文件优先于环境变量(如果参数在两者中都定义了,则使用文件中的值)。
| 环境变量 | 配置中的等效项 | 描述 |
|---|---|---|
| `IPFLAME_WEB_PATH` | `web-path=` | 输出目录 |
| `IPFLAME_WEB_LOG` | `web-log=` | 日志文件 Glob |
| `IPFLAME_LOG_FORMAT` | `log-format=` | 日志格式 |
| `IPFLAME_GEOIP_DIR` | `geoip-dir=` | GeoLite2 数据库目录 |
| `IPFLAME_LOG_IP_FIELD` | `log-ip-field=` | IP 字段(kv 格式) |
| `IPFLAME_LOG_REQ_FIELD` | `log-req-field=` | 请求字段(kv 格式) |
| `IPFLAME_LOG_UA_FIELD` | `log-ua-field=` | User-Agent 字段(kv 格式) |
| `IPFLAME_LOG_HOST_FIELD` | `log-host-field=` | Host 字段(kv 格式) |
这对于 Docker/Kubernetes 环境很有用,在这些环境中更倾向于通过环境变量而不是挂载文件进行配置:
```
# 使用环境变量运行 (无 config 文件)
IPFLAME_WEB_PATH=output/ \
IPFLAME_WEB_LOG="/var/log/nginx/*log*" \
IPFLAME_LOG_FORMAT=nginx-combined \
IPFLAME_GEOIP_DIR=geoip \
./ip-flame
# 使用环境变量的 Docker
docker run --rm \
-e IPFLAME_WEB_PATH=/app/output/ \
-e IPFLAME_WEB_LOG="/app/logs/*log*" \
-e IPFLAME_LOG_FORMAT=nginx-combined \
-e IPFLAME_GEOIP_DIR=/app/geoip \
-v /var/log/nginx:/app/logs:ro \
-v ./output:/app/output \
ip-flame
```
### 白名单
文件 `whitelist.txt` 每行包含一个 IP。空行和以 `#` 开头的行将被忽略。
```
# 内部 IPs / 开发团队
192.168.1.1
10.0.0.50
```
### 按服务器配置示例
**Nginx / Apache(标准 combined 格式):**
json
/opt/ip-flame/output/report.jsonl
```
#### 2. 创建解码器
创建 `/var/ossec/etc/decoders/ipflame_decoder.xml`:
```
^{"ip":
JSON_Decoder
```
#### 3. 创建规则
创建 `/var/ossec/etc/rules/ipflame_rules.xml`:
```
ipflame
IP-Flame: threat actor detectado — $(ip) [$(risk_level)] score:$(risk_score)
ipflame,
100100
medium
IP-Flame: threat actor MEDIUM — $(ip) score:$(risk_score) hits:$(hit_count) — $(country)
ipflame,medium,
100100
high
IP-Flame: threat actor HIGH — $(ip) score:$(risk_score) hits:$(hit_count) — $(country) $(isp)
ipflame,high,
alert_by_email
100100
critical
IP-Flame: threat actor CRITICAL — $(ip) score:$(risk_score) hits:$(hit_count) — $(country) $(isp)
ipflame,critical,
alert_by_email
100100
true
IP-Flame: threat actor desde TOR — $(ip) score:$(risk_score) — $(country)
ipflame,tor,
100100
true
IP-Flame: threat actor desde VPN — $(ip) score:$(risk_score) — $(country) $(isp)
ipflame,vpn,
100100
\d{3,}
IP-Flame: scanner masivo — $(ip) hits:$(hit_count) — $(country) $(isp)
ipflame,scanner,
```
#### 4. 验证并重启
```
# 验证 decoder 和 rules 无语法错误
/var/ossec/bin/wazuh-logtest
# 重启 manager
sudo systemctl restart wazuh-manager
# 在日志中验证文件正在被监控
sudo tail -f /var/ossec/logs/ossec.log | grep ip-flame
```
#### 5. 在 Wazuh Dashboard 中验证
数据输入后,可以在 Wazuh 仪表板中搜索:
- **Discover:** 按 `rule.groups: ipflame` 筛选
- **警报:** critical/high 威胁行为者显示为级别 10-14 的警报
- **可用于筛选器和可视化的字段:**
| Wazuh 字段 | 内容 |
|---|---|
| `data.ip` | 威胁行为者 IP |
| `data.risk_score` | 评分 0-100 |
| `data.risk_level` | critical / high / medium / low |
| `data.hit_count` | 命中数 |
| `data.country` | ISO 代码国家 |
| `data.isp` | 互联网提供商 |
| `data.asn` | 自治系统号 |
| `data.is_tor` | true/false |
| `data.is_vpn` | true/false |
| `data.is_proxy` | true/false |
| `data.first_seen` | 首次检测到的命中 |
| `data.last_seen` | 最后检测到的命中 |
| `data.matched_patterns[]` | 触发的模式 |
| `data.cti_source` | CTI 来源:`local` 或 `api` |
#### 6. Active response(自动拦截)
使用 Wazuh active response 自动拦截 critical IP:
```
firewall-drop
local
100103
43200
```
### Elasticsearch / Elastic Stack
#### 1. Index template
创建一个 index template 以便 Elasticsearch 正确映射 IP-Flame 字段。在 Kibana Dev Tools 中执行或通过 API:
```
PUT _index_template/ipflame
{
"index_patterns": ["ipflame-*"],
"template": {
"settings": {
"number_of_replicas": 1
},
"mappings": {
"properties": {
"ip": { "type": "ip" },
"country": { "type": "keyword" },
"country_code": { "type": "keyword" },
"city": { "type": "keyword" },
"isp": { "type": "keyword" },
"asn": { "type": "keyword" },
"risk_score": { "type": "integer" },
"risk_level": { "type": "keyword" },
"is_vpn": { "type": "boolean" },
"is_tor": { "type": "boolean" },
"is_proxy": { "type": "boolean" },
"is_datacenter": { "type": "boolean" },
"hit_count": { "type": "integer" },
"first_seen": { "type": "keyword" },
"last_seen": { "type": "keyword" },
"top_request": { "type": "text", "fields": { "keyword": { "type": "keyword" } } },
"top_user_agent": { "type": "text", "fields": { "keyword": { "type": "keyword" } } },
"matched_patterns": { "type": "keyword" },
"cti_source": { "type": "keyword" },
"hits": {
"type": "nested",
"properties": {
"timestamp": { "type": "keyword" },
"request": { "type": "text", "fields": { "keyword": { "type": "keyword" } } },
"status_code": { "type": "keyword" },
"user_agent": { "type": "text" },
"matched_pattern": { "type": "keyword" }
}
}
}
}
}
}
```
#### 2. 使用 Filebeat 摄取
```
# /etc/filebeat/filebeat.yml
filebeat.inputs:
- type: log
enabled: true
paths:
- /opt/ip-flame/output/report.jsonl
json.keys_under_root: true
json.add_error_key: true
fields:
event.dataset: ipflame
event.module: threat_intel
fields_under_root: true
# 可选处理器:添加摄入 timestamp 和 geopoint
processors:
- add_host_metadata: ~
- timestamp:
field: "first_seen"
layouts:
- "02/Jan/2006:15:04:05 -0700"
ignore_failure: true
output.elasticsearch:
hosts: ["https://localhost:9200"]
index: "ipflame-%{+yyyy.MM.dd}"
# Descomentar si usas autenticacion
# username: "elastic"
# password: "changeme"
# ssl.certificate_authorities: ["/etc/filebeat/ca.crt"]
# 若要使用固定 index pattern 请禁用 ILM
setup.ilm.enabled: false
setup.template.name: "ipflame"
setup.template.pattern: "ipflame-*"
```
```
# 验证配置
sudo filebeat test config
sudo filebeat test output
# 启动 Filebeat
sudo systemctl enable --now filebeat
```
#### 3. 使用 curl 直接摄取(无 Filebeat)
对于简单环境或测试,可以使用 `_bulk` API:
```
# 将 JSONL 转换为 bulk format 并摄入
cat output/report.jsonl | while IFS= read -r line; do
echo '{"index":{"_index":"ipflame-'$(date +%Y.%m.%d)'"}}'
echo "$line"
done | curl -s -H "Content-Type: application/x-ndjson" \
-XPOST "http://localhost:9200/_bulk" --data-binary @-
```
#### 4. Kibana 中的有用搜索
```
# 所有 critical threat actors
risk_level: "critical"
# 来自 Tor 的 IPs
is_tor: true
# 超过 100 hits 的 Threat actors
hit_count >= 100
# 特定范围的 IPs (得益于 ip 类型)
ip: 172.0.0.0/8
# 尝试访问 .env 的 Threat actors
matched_patterns: ".env"
# 组合:来自 datacenter 的高危+ threat actors
risk_level: ("high" OR "critical") AND is_datacenter: true
```
### Splunk
#### 1. 配置摄取
**选项 A — 监控 JSONL 文件:**
```
# /opt/splunk/etc/system/local/inputs.conf
[monitor:///opt/ip-flame/output/report.jsonl]
disabled = false
sourcetype = ipflame:json
index = threat_intel
```
**选项 B — 使用 HTTP Event Collector (HEC) 发送:**
1. 在 Splunk 中:Settings > Data Inputs > HTTP Event Collector > New Token
2. 记下生成的 token
3. 从脚本发送数据:
```
cat output/report.jsonl | while IFS= read -r line; do
curl -s -k "https://splunk:8088/services/collector/event" \
-H "Authorization: Splunk " \
-d "{\"sourcetype\": \"ipflame:json\", \"index\": \"threat_intel\", \"event\": $line}"
done
```
#### 2. 定义 sourcetype
```
# /opt/splunk/etc/system/local/props.conf
[ipflame:json]
INDEXED_EXTRACTIONS = json
KV_MODE = json
TIME_FORMAT = %d/%b/%Y:%H:%M:%S %z
TIME_PREFIX = "first_seen"\s*:\s*"
SHOULD_LINEMERGE = false
LINE_BREAKER = ([\r\n]+)
TRUNCATE = 0
category = Custom
description = IP-Flame CTI Threat Intelligence
```
#### 3. 有用的 SPL 搜索
```
# 所有 high 和 critical threat actors
index=threat_intel sourcetype="ipflame:json" (risk_level="high" OR risk_level="critical")
| table ip, risk_score, risk_level, hit_count, country, isp, matched_patterns
# 按 score 排名前 10 的 threat actors
index=threat_intel sourcetype="ipflame:json"
| sort - risk_score
| head 10
| table ip, risk_score, risk_level, hit_count, country, isp
# 来自 Tor 或 VPN 的 Threat actors
index=threat_intel sourcetype="ipflame:json" (is_tor=true OR is_vpn=true)
| table ip, risk_score, is_tor, is_vpn, country, hit_count
# 最频繁的模式
index=threat_intel sourcetype="ipflame:json"
| mvexpand matched_patterns
| stats count by matched_patterns
| sort - count
# Threat actors 地理地图 (需要 country_code 字段)
index=threat_intel sourcetype="ipflame:json"
| iplocation ip
| geostats count by risk_level
# 活动 Timeline
index=threat_intel sourcetype="ipflame:json"
| timechart count by risk_level
```
## Webhooks
IP-Flame 在检测到威胁行为者时通过 HTTP POST 发送警报。支持同时向多个目标发送,每个目标都有自己的最低风险级别过滤器。
### 配置格式
```
webhook=tipo,url[,min_risk_level][,telegram_chat_id]
```
| 参数 | 必需 | 描述 |
|---|---|---|
| `type` | 是 | `slack`、`telegram`、`discord`、`generic` |
| `url` | 是 | 完整的 webhook URL |
| `min_risk_level` | 否 | 警报的最低级别:`low`、`medium`(默认)、`high`、`critical` |
| `telegram_chat_id` | 仅 Telegram | 目标聊天/群组 ID |
仅发送 `risk_level` **等于或高于** 配置的 `min_risk_level` 的威胁行为者。如果没有威胁行为者满足过滤器,则不发送 webhook。
### Slack
1. 前往 [api.slack.com/apps](https://api.slack.com/apps) > Create App > Incoming Webhooks > 激活
2. 选择目标频道并复制 Webhook URL
3. 添加到 `config-ip-flame.txt`:
```
webhook=slack,https://hooks.slack.com/services/T00000000/B00000000/XXXXXXXXXXXXXXXXXXXXXXXX
```
仅警报 high 和 critical 威胁行为者:
```
webhook=slack,https://hooks.slack.com/services/T00/B00/XXX,high
```
Slack 中的消息按严重程度显示表情符号:
```
🔥 IP-Flame Alert — 3 threat actors detectados
🔴 173.212.230.39 — score:75 (critical) hits:1174 — France Contabo GmbH
🟠 185.177.72.22 — score:50 (high) hits:974 — France Bucklog SARL
🟡 43.207.196.36 — score:40 (medium) hits:312 — Japan Amazon.com
```
### Telegram
1. 使用 [@BotFather](https://t.me/BotFather) 创建机器人并复制 token
2. 将机器人添加到群组或开始直接聊天
3. 获取 `chat_id`:
- 对于群组:向群组发送消息并查询 `https://api.telegram.org/bot/getUpdates`
- 对于直接聊天:`chat_id` 是您的数字用户 ID
4. 添加到配置(chat_id 作为第 4 个参数):
```
webhook=telegram,https://api.telegram.org/bot123456:ABC-DEF/sendMessage,medium,-100123456789
```
### Discord
1. 在 Discord 服务器中:目标频道 > 编辑频道 > 整合 > Webhooks
2. 创建新 webhook,命名(例如:"IP-Flame"),复制 URL
3. 添加到配置:
```
webhook=discord,https://discord.com/api/webhooks/123456789012345678/ABCDEFGHIJK...
```
仅警报 critical:
```
webhook=discord,https://discord.com/api/webhooks/123/ABC,critical
```
### 通用(SIEM / custom / n8n)
用于直接与任何接受通过 HTTP POST 发送 JSON 的端点集成。IP-Flame 发送带有 `Content-Type: application/json` 头的 payload。
```
webhook=generic,https://my-siem.example.com/api/alerts,medium
```
**通用 payload 结构:**
```
{
"tool": "ip-flame",
"version": "3.2",
"generated_at": "2026-03-29T20:27:15-03:00",
"total": 3,
"threat_actors": [
{
"ip": "173.212.230.39",
"risk_score": 75,
"risk_level": "critical",
"hit_count": 1174,
"country": "France (FR)",
"asn": "AS51167",
"isp": "Contabo GmbH",
"first_seen": "19/Mar/2026:07:45:39 +0000",
"last_seen": "19/Mar/2026:07:45:47 +0000"
}
]
}
```
### 与 n8n 集成
[n8n](https://n8n.io) 是一个自动化平台,广泛用于 Blue Team 编排事件响应工作流。IP-Flame 使用 `generic` 类型指向 n8n 的 **Webhook** 节点与 n8n 集成。
**1. 在 n8n 中创建工作流:**
- 添加一个 **Webhook** 节点作为触发器
- 配置:
- HTTP Method: `POST`
- Path: 选择一个路径(例如:`ipflame-alert`)
- 复制 n8n 生成的 **Production URL** 或 **Test URL**(例如:`https://n8n.your-domain.com/webhook/ipflame-alert`)
**2. 配置 IP-Flame:**
```
webhook=generic,https://n8n.tu-dominio.com/webhook/ipflame-alert,high
```
**3. 示例工作流 — 自动分类:**
n8n 的 Webhook 节点接收来自 IP-Flame 的 JSON payload。从那里可以构建如下工作流:
```
[Webhook: IP-Flame Alert]
│
├─► [IF: risk_level == "critical"]
│ ├─► [HTTP Request: bloquear IP en firewall/CrowdSec]
│ ├─► [Slack: notificar canal #incidents]
│ └─► [TheHive: crear alerta]
│
├─► [IF: risk_level == "high"]
│ ├─► [Slack: notificar canal #threats]
│ └─► [Google Sheets / Notion: registrar en tracker]
│
└─► [Loop: por cada threat actor]
└─► [HTTP Request: consultar AbuseIPDB / VirusTotal]
└─► [Enriquecer datos y guardar]
```
**4. 在 n8n 中访问数据:**
在 Webhook 之后的节点中,IP-Flame 数据可用作:
| n8n 表达式 | 值 |
|---|---|
| `{{ $json.tool }}` | `"ip-flame"` |
| `{{ $json.total }}` | 威胁行为者数量 |
| `{{ $json.threat_actors[0].ip }}` | 第一个威胁行为者的 IP |
| `{{ $json.threat_actors[0].risk_score }}` | 风险评分(0-100) |
| `{{ $json.threat_actors[0].risk_level }}` | `"critical"`、`"high"`、`"medium"`、`"low"` |
| `{{ $json.threat_actors[0].is_tor }}` | `true` / `false` |
| `{{ $json.threat_actors[0].country }}` | ISO 代码国家 |
**5. 使用 Docker 自托管 n8n 的示例:**
如果 n8n 与 IP-Flame 在同一个 Docker 网络中运行,请使用服务名称作为主机:
```
# docker-compose.yml
services:
ip-flame:
build: .
# ...
depends_on:
- n8n
n8n:
image: n8nio/n8n
container_name: n8n
ports:
- "5678:5678"
volumes:
- n8n_data:/home/node/.n8n
volumes:
n8n_data:
```
```
# 在 config-ip-flame.txt 中,使用 Docker 服务名称
webhook=generic,http://n8n:5678/webhook/ipflame-alert,high
```
**6. 使用 n8n + IP-Flame 的 Blue Team 用例:**
| 用例 | 涉及的 n8n 节点 |
|---|---|
| 自动拦截 critical IP | Webhook → IF → HTTP Request (CrowdSec API / iptables) |
| 多渠道警报 | Webhook → IF 按级别 → Slack + Email + Telegram |
| CTI 丰富 | Webhook → Loop → VirusTotal + AbuseIPDB → Merge → DB |
| 创建工单 | Webhook → IF → TheHive / Jira / ServiceNow |
| 每日执行报告 | Schedule Trigger → Read File (report.json) → Summarize → Email |
| 更新阻止列表 | Webhook → Code(提取 IP)→ HTTP Request (firewall API) |
| 与 MISP 关联 | Webhook → Loop → MISP API(搜索指标)→ 如果匹配则警报 |
### 多个 Webhooks
可以同时配置多个 webhook,每个都有自己的级别过滤器:
```
# Slack:仅 critical (即时响应团队)
webhook=slack,https://hooks.slack.com/services/.../...,critical
# Telegram:high 和 critical (监控频道)
webhook=telegram,https://api.telegram.org/bot.../sendMessage,high,-100123456
# n8n:medium+ (自动分流 workflow)
webhook=generic,https://n8n.internal/webhook/ipflame-alert,medium
# 通用 SIEM:所有级别
webhook=generic,https://siem.internal/api/ipflame,low
```
如果有满足过滤器的威胁行为者,所有 webhook 都会在每次执行(或 watch 模式的 tick)时发送。
## 与 CrowdSec 集成
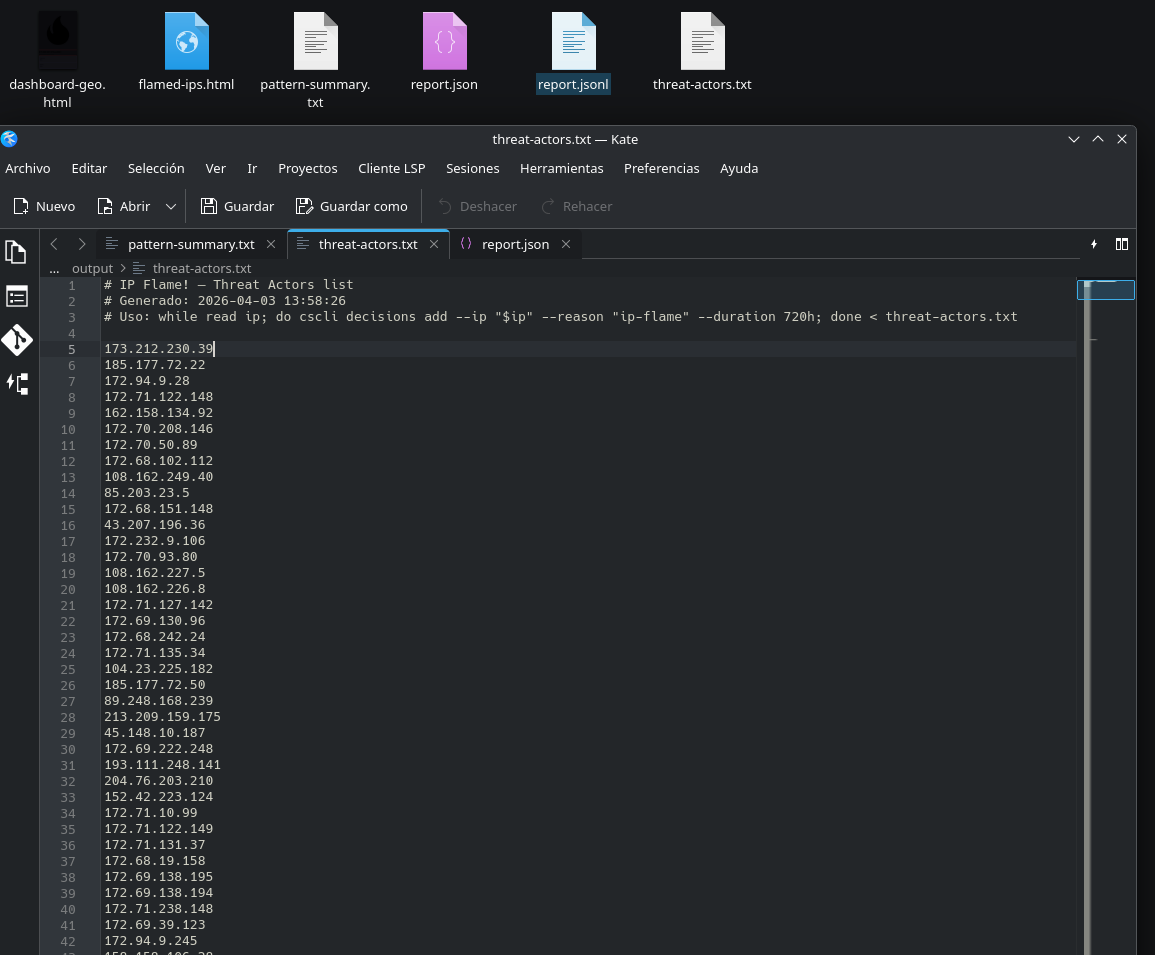
生成的 `threat-actors.txt` 文件可直接用于 CrowdSec:
```
# 封禁所有检测到的 IPs 30 天
while IFS= read -r ip; do
[[ "$ip" =~ ^#.*$ || -z "$ip" ]] && continue
cscli decisions add --ip "$ip" --reason "ip-flame" --duration 720h
done < output/threat-actors.txt
```
使用 cron 自动化:
```
# 运行 IP-Flame 并每小时输入 CrowdSec
0 * * * * /opt/ip-flame/ip-flame --config /opt/ip-flame/config.txt && \
while IFS= read -r ip; do [[ "$ip" =~ ^#.*$ || -z "$ip" ]] && continue; \
cscli decisions add --ip "$ip" --reason "ip-flame" --duration 720h; \
done < /opt/ip-flame/output/threat-actors.txt
```
## 风险评分
每个恶意 IP 都会根据 4 个因素获得 0 到 100 的风险评分:
| 因素 | 最高分 | 标准 |
|---|---|---|
| 命中量 | 25 | 1 次 = 3 分,5+ = 10 分,20+ = 15 分,50+ = 20 分,100+ = 25 分 |
| 模式多样性 | 25 | 1 个模式 = 3 分,2 个 = 10 分,3 个 = 15 分,5+ = 20 分,10+ = 25 分 |
| 匿名化 | 30 | VPN = 15 分,Proxy = 20 分,Tor = 30 分 |
| API 风险评分 | 20 | ipquery.io 评分(0-100)缩放至 0-20 |
**级别:**
| 评分 | 级别 | 含义 |
|---|---|---|
| 75-100 | `critical` | 活跃威胁,多向量,匿名化 |
| 50-74 | `high` | 激进的扫描器或主动利用 |
| 25-49 | `medium` | 侦察或适度扫描 |
| 0-24 | `low` | 孤立活动,可能是噪音 |
## API 透明度
当 IP-Flame 无法使用本地 GeoLite2 数据库解析 IP 时,会使用 [ipquery.io](https://ipquery.io) API 作为回退。在这种情况下:
- 记录一条明确的日志指示有多少 IP 被发送到 API 以及原因
- 发送的数据仅限于 IP 地址(不发送日志、请求或 user-agent)
- API 响应经过验证(返回的 IP 必须与查询的 IP 匹配)
- 报告中的 `cti_source` 字段指示数据是来自 `local` 还是 `api` 解析
```
time=2026-04-03T13:06:28.500-03:00 level=INFO msg="Enriquecimiento CTI" local=3421 api=258 note="258 IPs enviadas a ipquery.io para enriquecimiento"
```
## GeoIP 数据库
IP-Flame 使用 MaxMind GeoLite2 数据库进行本地解析(无需 API 调用):
```
# 下载 GeoLite2 (无需注册)
./update-geoip.sh
```
数据库从 [P3TERX 镜像](https://github.com/P3TERX/GeoLite.mmdb) 下载并保存在 `geoip/` 目录中。
**使用 cron 自动化**(每周更新):
```
0 3 * * 1 /opt/ip-flame/update-geoip.sh >> /var/log/ip-flame-geoip.log 2>&1
```
如果数据库不可用,IP-Flame 会自动使用 [ipquery.io](https://ipquery.io) API 作为回退(无限免费层,批次最多 10,000 个 IP)。
## 检测类别
IP-Flame 包含 14 个类别中的 **238 个模式**,旨在覆盖 Web 攻击的完整周期 — 从侦察到后渗透。模式不区分大小写,并应用递归 URL 解码(2 层)以检测编码逃避(`%2e%2e` = `..`,`%252e` = 双重编码)。
**Security hardening:** 自定义模式(通过配置中的 `offending-lines=` 定义)的长度限制为 256 个字符,以防止 ReDoS 攻击。
### 按类别摘要
| # | 类别 | 模式 | MITRE ATT&CK | 描述 |
|---|---|---|---|---|
| 1 | **CMS** | 18 | T1190 | WordPress、Joomla、Drupal、Magento、phpMyAdmin、Adminer 的利用 |
| 2 | **CONFIG** | 25 | T1552.001 | 暴露的配置文件、机密、凭据和备份 |
| 3 | **VCS** | 7 | T1213 | 暴露的源代码仓库(Git、SVN、Mercurial、Bazaar) |
| 4 | **RCE** | 22 | T1059 | Webshells(经典 + 现代)、代码注入、路径遍历、LFI |
| 5 | **SQLI** | 10 | T1190 | SQL 注入 Payload:UNION、布尔型、时间型、渗透 |
| 6 | **XSS** | 10 | T1189 | 跨站脚本:脚本注入、事件处理程序、Cookie 窃取 |
| 7 | **CMDI** | 10 | T1059.004 | 命令注入:Shell 执行、子 Shell、下载并执行 |
| 8 | **LOG4J** | 5 | T1190 | Log4Shell (CVE-2021-44228):通过 LDAP、RMI、DNS 的 JNDI 注入 |
| 9 | **SSRF** | 7 | T1552.005 | 服务端请求伪造:Cloud metadata(AWS、GCP、Azure、DO) |
| 10 | **SCAN** | 22 | T1595 | 管理面板、服务器状态、信息泄露、邮件服务器 |
| 11 | **CVE** | 18 | T1190 | 活跃被利用的 CVE 端点(Actuator、Ignition、Grafana 等) |
| 12 | **CRAWLER** | 10 | T1593 | 激进的 AI 爬虫和抓取器(GPTBot、ClaudeBot、Bytespider 等) |
| 13 | **PROTO** | 10 | T1190 | HTTP 上的 TLS、WebDAV、代理滥用、Docker socket、etcd |
| 14 | **TOOLS** | 18 | T1595.002 | User-Agent 中扫描工具的指纹 |
### 按类别详情
#### CMS — Web 平台利用 (T1190)
检测尝试访问流行 CMS 已知端点的模式。WordPress 占据约 43% 的 Web,使其成为最受攻击的 CMS。
```
xmlrpc.php, wp-login.php, wp-admin/, wp-config.php, wp-content/uploads/,
wp-includes/, wp-json/wp/v2/users, wp-json/oembed/, /?author=1, wp-cron.php,
administrator/index.php, /user/login, /downloader/,
/phpmyadmin, /pma/, /phpMyAdmin, /adminer, /dbadmin, /myadmin
```
#### CONFIG — 泄露的机密和配置 (T1552.001)
包含凭据、API token、连接字符串的配置文件。根据 OWASP Top 10(A01:2021 Broken Access Control),其泄露是现代应用程序妥协的首要载体。
```
.env, .env.local, .env.production, .env.backup, .env.dev, .env.staging,
.env.old, .env.save, .env.bak, /backup, /backups, .sql, .bak, .tar.gz,
.zip, .gz, .rar, config.php, database.yml, settings.py,
docker-compose.yml, docker-compose.override.yml, /.aws/credentials,
/.aws/config, id_rsa, id_ecdsa, id_ed25519, .DS_Store, web.config,
.npmrc, .dockerenv, .bash_history, .mysql_history, .psql_history,
/wp-config.php.bak, /wp-config.php.old, /wp-config.php.save, /config.php.bak
```
#### VCS — 暴露的代码仓库 (T1213)
访问版本控制目录允许下载完整的源代码,包括硬编码的凭据和业务逻辑。
```
.git/config, .git/HEAD, .git/COMMIT_EDITMSG, .gitignore, .git/objects/,
/.svn/entries, /.svn/wc.db, /.hg/, /.bzr/
```
#### RCE — 远程代码执行和 Webshells (T1059)
经典 Webshells(c99、r57)和现代 Webshells(Behinder、Godzilla、AntSword),以及用于 LFI/RFI 的代码注入和路径遍历技术。
```
cmd.php, shell.php, c99.php, r57.php, b374k, alfa.php, wso.php,
indoxploit, p0wny, weevely, antsword, behinder, godzilla,
eval(, base64_decode(, assert(, system(, exec(, passthru(, shell_exec(,
../../../, %2e%2e%2f, %2e%2e%5c, /proc/self/environ,
/etc/passwd, /etc/shadow, passwd%00, /cgi-bin/, .cgi, XDEBUG_SESSION,
/vendor/phpunit, /vendor/phpunit/phpunit/src/Util/PHP/eval-stdin.php
```
#### SQLI — SQL 注入 (T1190)
利用 SQL 注入提取数据、绕过身份验证或通过数据库执行命令的 Payload。涵盖 3 种主要技术:基于 UNION、基于布尔和基于时间。
```
UNION SELECT, UNION ALL SELECT, OR 1=1, ' AND ',
information_schema, SLEEP(, BENCHMARK(, WAITFOR DELAY,
/bin/sleep, INTO OUTFILE, INTO DUMPFILE, LOAD_FILE(
```
#### XSS — 跨站脚本 (T1189)
尝试在浏览器上下文中注入 JavaScript 以窃取会话、键盘记录或恶意重定向的 Payload。
```
标签:Apache日志, ASN分析, CISA项目, CTI工具, HTML仪表板, HTTP/HTTPS抓包, IP丰富化, IP 地址批量处理, Nginx日志, SIEM集成, Tor节点识别, VPN检测, Web服务器安全, 后端开发, 地理定位, 多模态安全, 威胁情报, 威胁扫描器, 安全运营, 开发者工具, 态势感知, 恶意模式检测, 扫描框架, 日志审计, 构建工具, 网络安全, 请求拦截, 隐私保护, 风险评分