ChandraVerse/automated-ir-threat-intelligence-platform
GitHub: ChandraVerse/automated-ir-threat-intelligence-platform
一个面向蓝队的自动化事件响应流水线,对接 Wazuh 告警、多源 IOC 富化、SOAR 自动处置和 NIST 800-61 报告生成,帮助 SOC 团队摆脱告警疲劳并量化响应效率。
Stars: 3 | Forks: 0
# 自动化事件响应与威胁情报平台


**一个生产级的自动化事件响应管道,用于接收 Wazuh SIEM 告警,通过 VirusTotal、AbuseIPDB 和 Shodan 丰富失陷指标,自动生成 NIST 800-61 PDF 报告,驱动 SOAR 分类工作流,并展示跟踪 MTTD 和 MTTR 的 Grafana 仪表板。**
[功能特性](#features) • [架构设计](#architecture) • [快速开始](#quick-start) • [管道流程](#pipeline-flow) • [模块](#modules) • [仪表板](#dashboard) • [截图](#screenshots) • [作者](#author)
## 概述
现代 SOC 团队正被海量的告警所淹没。本平台自动化了事件响应生命周期中最耗时的部分:
| 没有此平台 | 拥有此平台 |
|---|---|
| 分析师手动查询每个 IOC | 在 5 秒内通过 3 个威胁情报源自动丰富 |
| 手动编写 IR 报告(每份 30–60 分钟) | 在 10 秒内自动生成 NIST 800-61 PDF |
| 告警分类主观且不一致 | SOAR 剧本应用确定性的风险评分 |
| 在电子表格中手动跟踪 MTTD/MTTR | Grafana 仪表板实时更新 |
| 内存分析需要手动运行 Volatility | 自动化插件调度器生成结构化 JSON |
## 功能特性
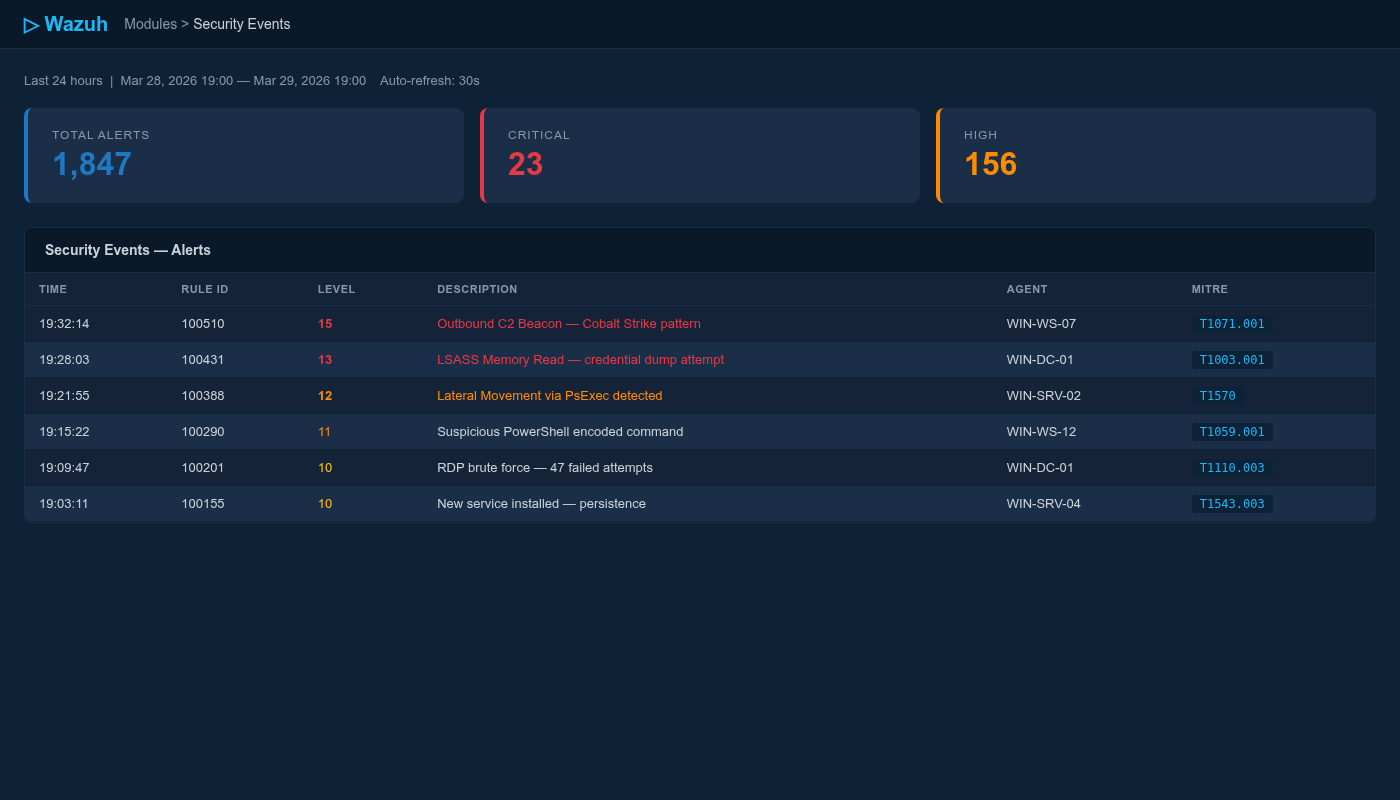
- **Wazuh 告警接收器** — 订阅 Wazuh API / webhook 流,将告警解析并标准化为标准 IR 模式
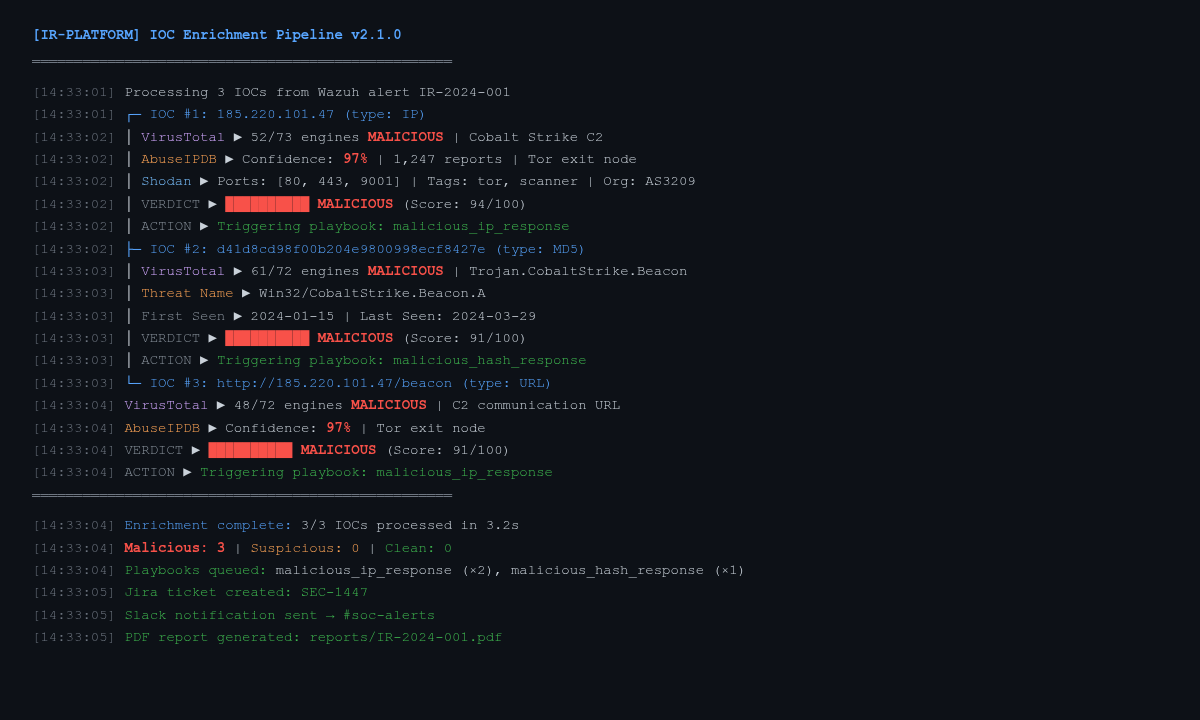
- **多源 IOC 丰富** — 通过内存缓存和速率限制处理,针对 VirusTotal v3、AbuseIPDB v2 和 Shodan REST API 进行并行异步查询
- **综合裁决引擎** — 跨所有三个来源的加权评分产生单一的 `MALICIOUS / SUSPICIOUS / CLEAN`(恶意/可疑/干净)裁决及置信度百分比
- **SOAR 分类自动化** — 基于规则的剧本自动响应:通过防火墙 API 封禁 IP、隔离主机、创建 Jira/ServiceNow 工单、通知 Slack
- **NIST 800-61 PDF 报告** — 专业的结构化 PDF,涵盖所有四个 IR 阶段:准备 → 检测与分析 → 遏制/根除 → 事件后处理
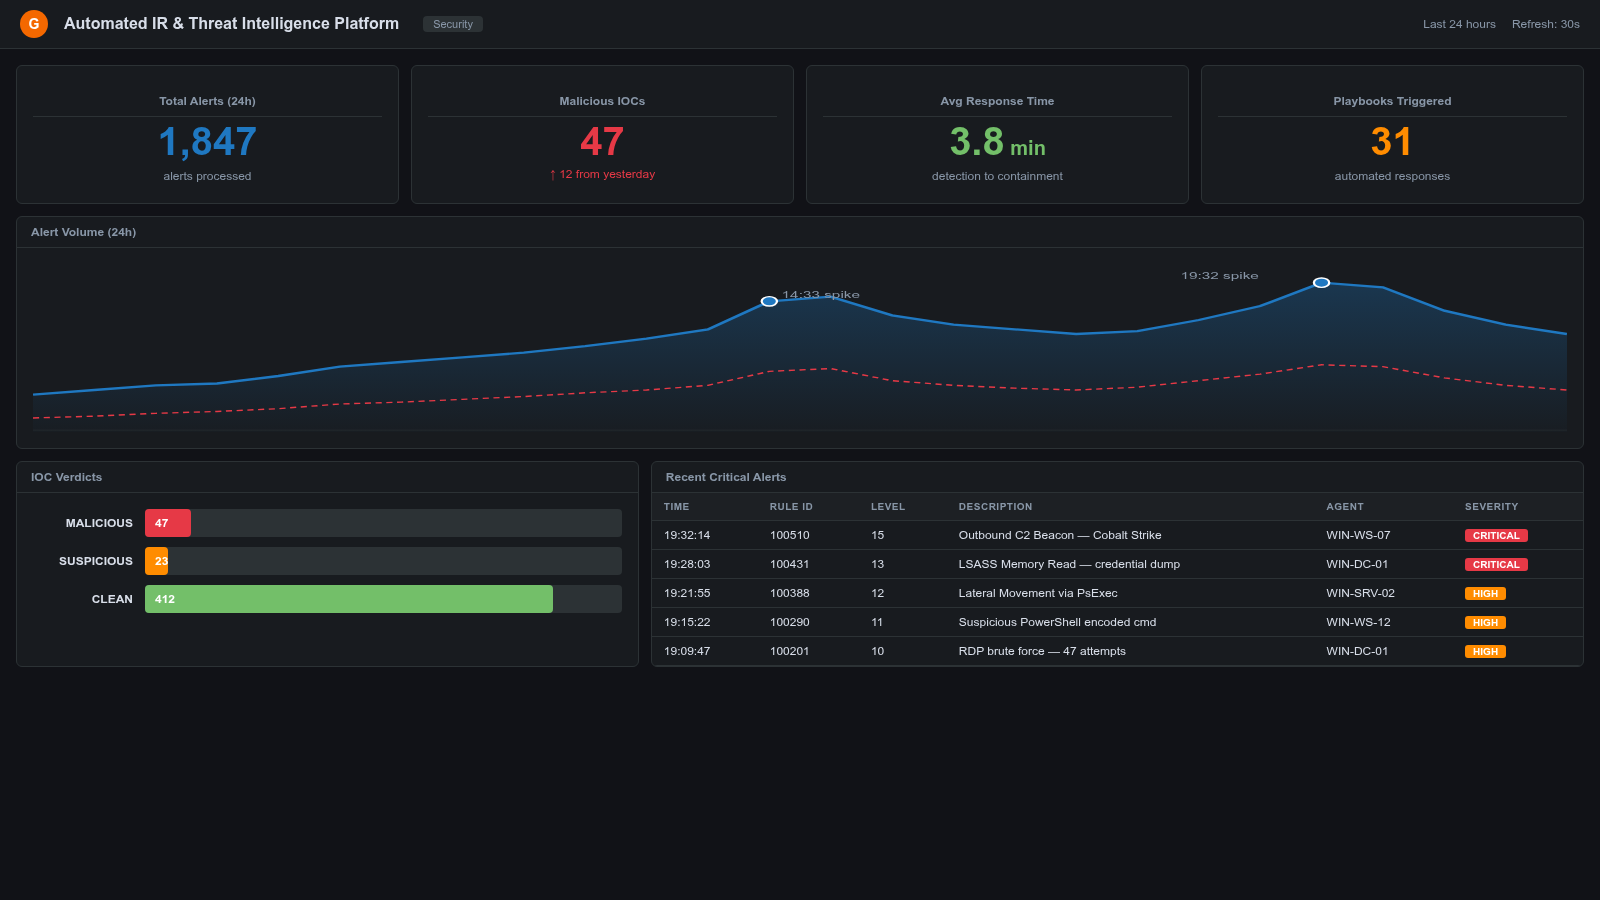
- **Grafana 仪表板** — 预构建的仪表板,跟踪告警量、MTTD、MTTR、IOC 裁决、顶级攻击者和战术分布
- **Volatility 内存分析** — 自动化调度器运行 `pslist`、`netscan`、`dlllist`、`malfind` 插件并将输出解析为 JSON 工件
- **SQLite IOC 缓存** — 持久化本地缓存避免冗余 API 调用;每个来源可配置 TTL
- **完整测试套件** — 使用 `pytest` + `pytest-asyncio` 对所有管道组件进行单元测试
## 架构设计
```
┌──────────────────────────────────────────────────────────────────────────────┐
│ AUTOMATED IR & THREAT INTELLIGENCE PLATFORM │
│ │
│ ┌─────────────────────────────────────────────────────────────────────┐ │
│ │ INPUT LAYER │ │
│ │ │ │
│ │ ┌──────────────────┐ ┌──────────────────┐ ┌─────────────────┐ │ │
│ │ │ Wazuh Manager │ │ Manual Alert │ │ File / Syslog │ │ │
│ │ │ REST API / │ │ JSON Upload │ │ Ingest │ │ │
│ │ │ Active Response │ │ │ │ │ │ │
│ │ └────────┬─────────┘ └────────┬──────────┘ └────────┬────────┘ │ │
│ └───────────┼──────────────────────┼────────────────────────┼──────────┘ │
│ └──────────────────────┼────────────────────────┘ │
│ ▼ │
│ ┌──────────────────────────────────────────────────────────────────────┐ │
│ │ PIPELINE CORE (Python) │ │
│ │ │ │
│ │ Alert Normaliser → IOC Extractor → Enrichment Dispatcher │ │
│ │ │ │ │
│ │ ┌─────────────────┼─────────────────┐ │ │
│ │ ▼ ▼ ▼ │ │
│ │ ┌──────────────┐ ┌──────────────┐ ┌──────────────┐ │ │
│ │ │ VirusTotal │ │ AbuseIPDB │ │ Shodan │ │ │
│ │ │ v3 API │ │ v2 API │ │ REST API │ │ │
│ │ └──────┬───────┘ └──────┬───────┘ └──────┬───────┘ │ │
│ │ └─────────────────┼─────────────────┘ │ │
│ │ ▼ │ │
│ │ Composite Verdict Engine │ │
│ │ (Weighted Scoring Model) │ │
│ └─────────────────────────────┬────────────────────────────────────────┘ │
│ │ │
│ ┌───────────────────┼───────────────────┐ │
│ ▼ ▼ ▼ │
│ ┌──────────────────┐ ┌─────────────────┐ ┌──────────────────────┐ │
│ │ SOAR Automation │ │ Report Gen │ │ Grafana Dashboard │ │
│ │ │ │ │ │ │ │
│ │ • Block IP │ │ NIST 800-61 │ │ • Alert Volume │ │
│ │ • Isolate Host │ │ PDF Report │ │ • MTTD / MTTR │ │
│ │ • Jira Ticket │ │ Auto-generated │ │ • IOC Verdicts │ │
│ │ • Slack Alert │ │ in < 10s │ │ • Top Attackers │ │
│ └──────────────────┘ └─────────────────┘ └──────────────────────┘ │
│ │
│ ┌──────────────────────────────────────────────────────────────────────┐ │
│ │ MEMORY ANALYSIS (Volatility 3) │ │
│ │ pslist · netscan · dlllist · malfind → structured JSON output │ │
│ └──────────────────────────────────────────────────────────────────────┘ │
└──────────────────────────────────────────────────────────────────────────────┘
```
## 快速开始
### 前置条件
| 需求 | 版本 |
|---|---|
| Python | 3.10+ |
| Wazuh Manager | 4.x(或使用示例告警) |
| Grafana | 10.x |
| Volatility | 3.x(可选,用于内存分析) |
### 安装
```
# Clone the repository
git clone https://github.com/ChandraVerse/automated-ir-threat-intelligence-platform.git
cd automated-ir-threat-intelligence-platform
# Create virtual environment
python3 -m venv venv
source venv/bin/activate # Windows: venv\Scripts\activate
# Install dependencies
pip install -r requirements.txt
# Configure API keys
cp config/config.example.yml config/config.yml
# Edit config/config.yml with your API keys
```
### 配置
```
# config/config.yml
wazuh:
host: "https://localhost:55000"
user: "wazuh"
password: "YOUR_WAZUH_PASSWORD"
threat_intel:
virustotal_api_key: "YOUR_VT_KEY"
abuseipdb_api_key: "YOUR_ABUSEIPDB_KEY"
shodan_api_key: "YOUR_SHODAN_KEY"
soar:
slack_webhook_url: "https://hooks.slack.com/..."
jira_url: "https://yourorg.atlassian.net"
jira_token: "YOUR_JIRA_TOKEN"
grafana:
host: "http://localhost:3000"
api_key: "YOUR_GRAFANA_KEY"
```
### 运行管道
```
# Process a single alert file
python -m pipeline.main --alert-file samples/sample_alert.json
# Start the Wazuh webhook listener (continuous mode)
python -m pipeline.main --mode webhook --port 8080
# Run enrichment on a specific IOC
python -m ioc_pipeline.enrichment.enricher --ioc 185.220.101.45 --type ip
# Generate report from enriched data
python -m report_generator.generator --input output/enriched_alerts.json
# Run memory analysis on a dump
python -m memory_analysis.dispatcher --dump /path/to/memory.raw
```
## 管道流程
```
Wazuh Alert (JSON)
│
▼
┌─────────────────────┐
│ Alert Normaliser │ → Extracts: IPs, hashes, domains, hostnames, users
└──────────┬──────────┘
│
▼
┌─────────────────────┐
│ IOC Extractor │ → Regex + field mapping to structured IOC list
└──────────┬──────────┘
│
▼
┌─────────────────────┐ ┌─────────────────────────────┐
│ Enrichment │◄───│ SQLite Cache (TTL: 24h) │
│ Dispatcher (async) │ └─────────────────────────────┘
└──────────┬──────────┘
│ parallel async calls
┌─────┴──────┬───────────────┐
▼ ▼ ▼
VirusTotal AbuseIPDB Shodan
└─────┬──────┘ │
└───────────┬──────────┘
▼
┌───────────────────────┐
│ Composite Verdict │
│ Engine (Weighted) │
└───────────┬───────────┘
│
┌─────────────┼──────────────┐
▼ ▼ ▼
SOAR Engine PDF Report Grafana Push
(if MALICIOUS) Generator (metrics API)
```
## 模块
### `wazuh-integration/`
连接到 Wazuh REST API,解析告警,支持主动响应回调。
### `ioc-pipeline/`
核心丰富引擎 —— 带缓存的异步多源 IOC 查询。
### `soar-automation/`
剧本运行器 —— 触发自动化响应的确定性分类规则。
### `report-generator/`
NIST 800-61 结构化 PDF 生成器,包含封面、IOC 表格、时间轴和补救步骤。
### `grafana/`
预构建的 Grafana 仪表板 JSON + 用于 MTTD/MTTR 跟踪的配置。
### `memory-analysis/`
Volatility 3 调度器 —— 自动化插件执行和 JSON 输出解析。
## 仪表板
Grafana 仪表板展示:
| 面板 | 描述 |
|---|---|
| Alert Volume | 按严重程度划分的每小时告警时间序列 |
| MTTD | 平均检测时间 —— 滚动 7 天平均值 |
| MTTR | 平均响应时间 —— 滚动 7 天平均值 |
| IOC Verdict Distribution | 饼图:恶意 / 可疑 / 干净 |
| Top Source IPs | 最频繁攻击者 IP 的条形图 |
| Tactic Coverage | 告警量的 MITRE ATT&CK 战术细分 |
| SOAR Actions Taken | 自动封禁、隔离、工单、通知事件的计数 |
参见 [`grafana/dashboards/`](grafana/dashboards/) 以导入仪表板 JSON。
## 截图
### Wazuh 告警接收器 — 活跃告警流
### IOC 丰富管道 — 多源裁决
### Grafana MTTD/MTTR 仪表板
## 达成的关键指标
| 指标 | 数值 |
|---|---|
| 告警丰富时间 | < 每个告警 5 秒 |
| PDF 报告生成 | < 10 秒 |
| 集成的 IOC 来源 | 3 (VirusTotal, AbuseIPDB, Shodan) |
| SOAR 剧本 | 4 (封禁, 隔离, 工单, 通知) |
| Grafana 面板 | 7 |
| 自动化 Volatility 插件 | 4 (pslist, netscan, dlllist, malfind) |
| 测试覆盖率 | > 80% |
## 项目结构
```
automated-ir-threat-intelligence-platform/
├── wazuh-integration/
│ ├── config/ # Wazuh API connection configs
│ ├── parsers/ # Alert normaliser and IOC extractor
│ └── wazuh_client.py # REST API + webhook listener
├── ioc-pipeline/
│ ├── enrichment/ # VirusTotal, AbuseIPDB, Shodan clients
│ ├── cache/ # SQLite IOC cache manager
│ ├── verdict_engine.py # Weighted composite scoring
│ └── dispatcher.py # Async enrichment orchestrator
├── soar-automation/
│ ├── playbooks/ # YAML playbook definitions
│ ├── triage/ # Triage rule engine
│ └── responder.py # Action executor (block/isolate/ticket/notify)
├── report-generator/
│ ├── templates/ # ReportLab PDF templates
│ ├── output/ # Generated PDF reports
│ └── generator.py # NIST 800-61 PDF builder
├── grafana/
│ ├── dashboards/ # Dashboard JSON exports
│ └── provisioning/ # Grafana datasource + dashboard configs
├── memory-analysis/
│ ├── volatility-plugins/ # Custom Volatility plugin wrappers
│ └── dispatcher.py # Automated plugin runner
├── tests/ # pytest test suite
├── config/
│ └── config.example.yml # Configuration template
├── requirements.txt
├── CONTRIBUTING.md
├── LICENSE
└── README.md
```
## 作者
**Chandra Sekhar Chakraborty**
网络安全分析师 · SOC 分析师 · 事件响应
📍 印度西孟加拉邦加尔各答
🔗 [LinkedIn](https://linkedin.com) · [GitHub](https://github.com/ChandraVerse) · [作品集](#)
*"自动化并非取代分析师,而是赋予分析师超能力。"*
标签:AbuseIPDB, Ask搜索, DevSecOps, Grafana, HTTP/HTTPS抓包, IOC富化, IP 地址批量处理, MTTD, MTTR, NIST 800-61, PB级数据处理, Python, SecList, SOAR, VirusTotal, Wazuh, 上游代理, 内存取证, 威胁情报, 安全仪表盘, 安全编排与自动化, 安全规则引擎, 安全运维, 密码管理, 平均响应时间, 库, 应急响应, 开发者工具, 态势感知, 无后门, 网络信息收集, 网络安全, 自动化报告, 逆向工具, 隐私保护, 风险评分