pranmoydev/ELK-Lab
GitHub: pranmoydev/ELK-Lab
基于 ELK Stack 8.11.0 构建的 SIEM 实验室,通过模拟凭证填充、DNS 隧道和 PowerShell 利用攻击,完整演示日志采集管道搭建与 Kibana 自定义仪表盘威胁检测分析流程。
Stars: 1 | Forks: 0
# ELK Stack SIEM 实验室 — 攻击模拟与自定义仪表盘
🚨 模拟真实攻击(Credential Stuffing、DNS Tunneling、PowerShell Exploitation)
📊 构建自定义仪表盘以可视化攻击模式
⚙️ 使用 ELK Stack (Docker + Filebeat + Logstash) 设计完整的 SIEM 管道
这是一个动手实践的网络安全实验室,演示了 ELK Stack
(Elasticsearch, Logstash, Kibana) SIEM 的部署、三种真实网络攻击的模拟,
以及用于安全事件可视化的自定义 Kibana 仪表盘。
## 🗂️ 实验室概述
| 组件 | 详情 |
|-----------|---------|
| Platform | ELK Stack 8.11.0 |
| Environment | Kali Linux + Docker Compose |
| Log Shipper | Filebeat |
| Attack Simulations | Credential Stuffing, DNS Tunneling, PowerShell Exploitation |
| Dashboard Panels | 7 个可视化面板 + 6 个 Markdown 文档面板 |
| Export | 通过 Kibana Reporting 导出 PDF |
## 📁 仓库结构
```
elk-siem-lab/
├── docker-compose.yml # ELK stack deployment config
├── filebeat/
│ └── filebeat.yml # Filebeat input & output config
├── attack-simulations/
│ ├── credential_stuffing.py # SSH brute force simulation
│ ├── dns_tunneling.py # DNS C2 tunnel simulation
│ └── powershell_exploitation.py # PowerShell attack simulation
├── kibana/
│ └── dashboard-export.ndjson # Kibana saved objects export
└── reports/
├── ELK_Lab_Report.docx # Part 1 lab report
└── SIEM_Dashboard_Report.docx # Part 2 dashboard report
```
📄 详细的设置、故障排除和分析:
👉 
👉 
## 🏗️ 架构
```
Python Scripts → Log Files → Filebeat → Logstash:5044
→ Elasticsearch:9200 → Kibana:5601
```
所有组件运行在单个 Kali Linux 虚拟机上。ELK Stack 运行在
Docker 容器中;Filebeat 直接运行在 VM 主机上以访问
本地日志文件。
## 🎥 演示
### 📊 仪表盘视图
### 🚨 DNS 攻击日志
### Credential Stuffing 检测
## 🚀 设置与部署
### 前置条件
- Kali Linux (或任何基于 Debian 的 Linux)
- 已安装 Docker + Docker Compose
- 主机上已安装 Filebeat 8.11.0
## 💡 项目意义
现代 SOC 团队依赖 SIEM 系统来检测和响应威胁。
本项目演示了:
- 攻击如何生成日志
- 日志如何被处理和结构化
- 分析师如何使用 SIEM 工具检测恶意行为
### 1. 启动 ELK Stack
```
cd ELK-Lab
docker-compose up -d
```
等待约 60 秒,然后验证:
```
curl http://localhost:9200/_cluster/health?pretty
```
预期结果:`"status": "yellow"` 或 `"green"`
### 2. 配置 Filebeat
将 `filebeat/filebeat.yml` 复制到你的 Filebeat 配置目录:
```
sudo cp filebeat/filebeat.yml /etc/filebeat/filebeat.yml
```
创建日志目录并启动 Filebeat:
```
sudo mkdir -p /var/log/attack-simulation
sudo systemctl enable filebeat
sudo systemctl start filebeat
```
### 3. 运行攻击模拟
```
# 运行全部三个仿真
sudo python3 attack-simulations/credential_stuffing.py
sudo python3 attack-simulations/dns_tunneling.py
sudo python3 attack-simulations/powershell_exploitation.py
```
### 4. 访问 Kibana
在浏览器中打开 `http://localhost:5601`。
导入仪表盘:
**Stack Management → Saved Objects → Import → 选择 `kibana/dashboard-export.ndjson`**
## 🎯 攻击模拟
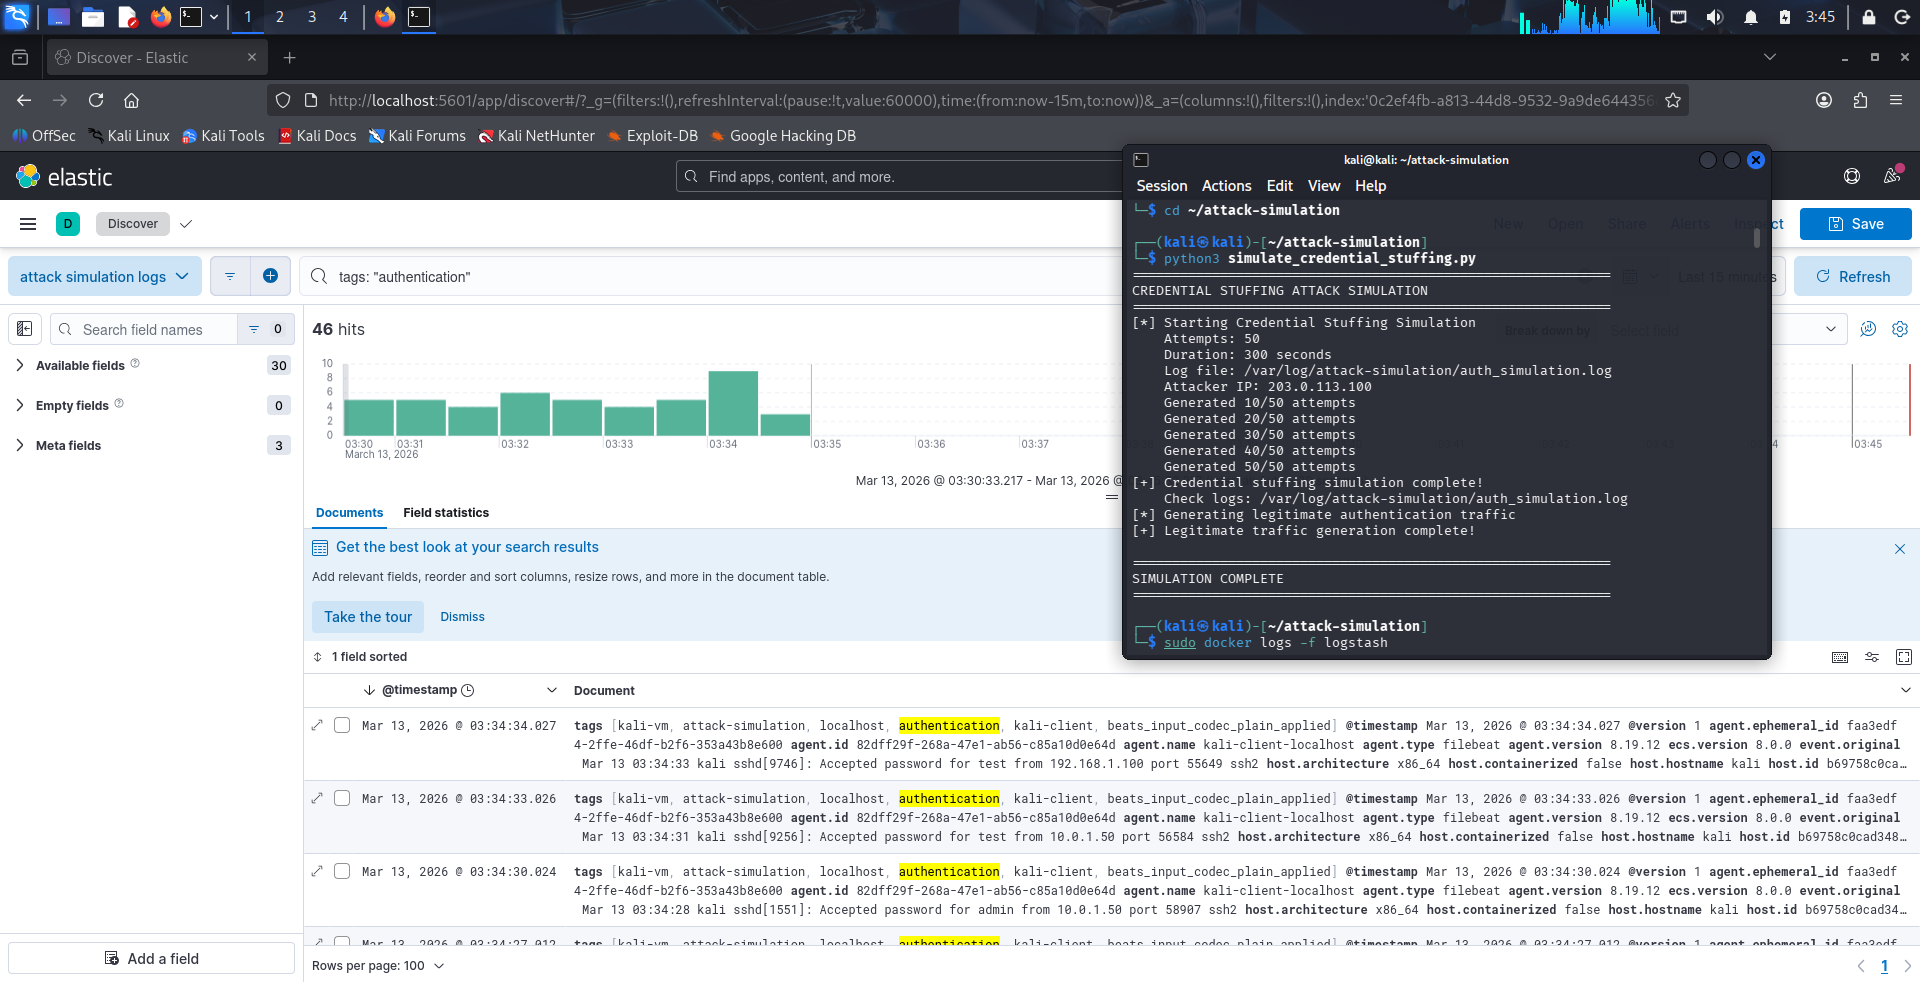
### 1. Credential Stuffing (`credential_stuffing.py`)
模拟 SSH 暴力破解/撞库攻击,生成
syslog 格式的身份验证日志条目。
- **50 次攻击尝试**,来自伪造的攻击者 IP,失败率为 95%
- **10 次合法登录事件**作为基线噪声
- 日志格式:syslog SSH (`Failed/Accepted password for from `)
- 输出:`/var/log/attack-simulation/auth_simulation.log`
**检测信号:** 来自单一 IP 的高失败登录量,
从同一来源尝试多个用户名。
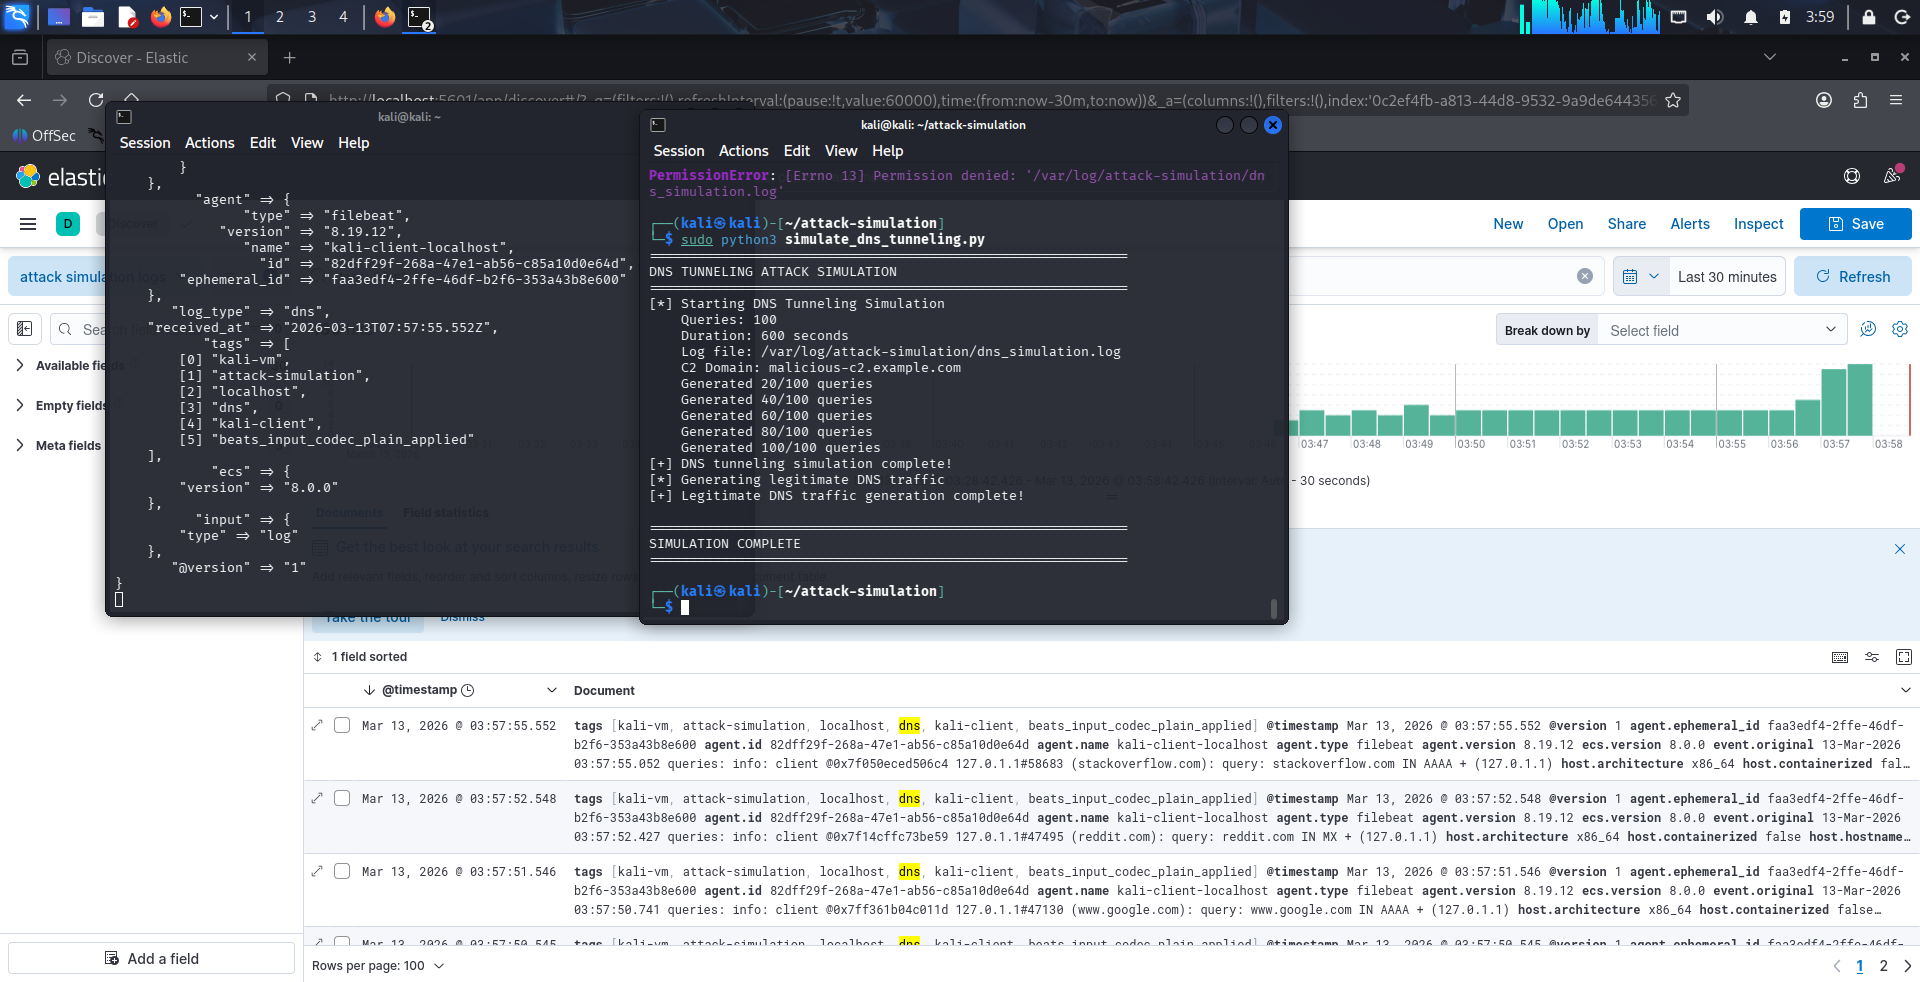
### 2. DNS Tunneling (`dns_tunneling.py`)
通过生成带有编码子域名载荷的 BIND 样式 DNS
查询日志,模拟基于 DNS 的 C2 通信。
- **100 次隧道查询**,带有 hex/base64 编码的子域名(60–90 个字符)
- **30 次针对常见域名的合法查询**作为基线
- C2 域名:`malicious-c2.example.com`
- 日志格式:BIND DNS 查询日志
- 输出:`/var/log/attack-simulation/dns_simulation.log`
**检测信号:** 异常长的查询名称,针对单一域名的
高查询频率,子域名中的 base64/hex 模式。
### 3. PowerShell Exploitation (`powershell_exploitation.py`)
模拟基于 Windows PowerShell 的攻击技术,生成
Sysmon 样式的 Event ID 1 (Process Create) 和 Event ID 4104
(Script Block Logging) 条目。
- **20 个恶意事件**,涵盖 8 种攻击技术
- **10 个合法 PowerShell 事件**作为基线
- 技术:编码命令、AMSI 绕过、Mimikatz、
Defender 排除、横向移动
- 60% 源自可疑的父进程(WINWORD.EXE 等)
- 输出:`/var/log/attack-simulation/powershell_simulation.log`
**检测信号:** Office 应用程序生成 PowerShell,
`-encodedCommand`/`-ExecutionPolicy Bypass` 标志,
命令行中的 `Invoke-Mimikatz`/`DownloadString`。
## 🧠 检测策略
本实验室不依赖预置规则,而是侧重于:
- 使用 Logstash 进行日志丰富
- 创建用于分析的结构化字段
- 通过可视化识别异常
这种方法模拟了分析人员在早期 SOC 环境中手动调查威胁的方式。
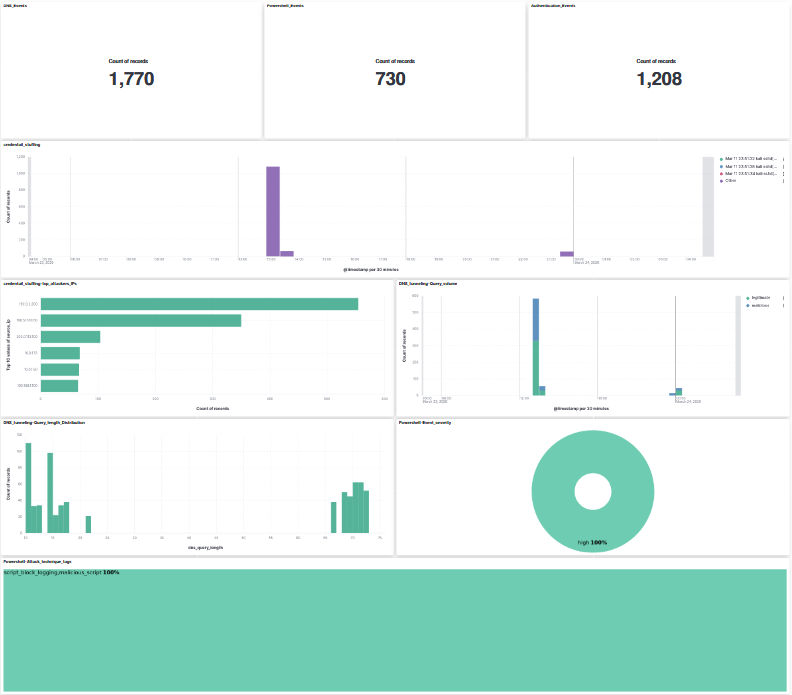
## 📊 SIEM 仪表盘
Kibana 仪表盘由 7 个可视化面板和 6 个
Markdown 文档面板组成,分为三个攻击类别部分。
### 可视化
| 面板 | 类型 | 攻击类别 |
|-------|------|-----------------|
| Event Volume KPIs (×3) | Metric | All |
| Failed Login Timeline | Bar (vertical) | Credential Stuffing |
| Top Attacker IPs | Bar (horizontal) | Credential Stuffing |
| DNS Query Volume | Line (dual layer) | DNS Tunneling |
| DNS Query Length Distribution | Bar (vertical) | DNS Tunneling |
| PowerShell Severity Breakdown | Donut | PowerShell Exploitation |
| PowerShell Attack Technique Tags | Treemap | PowerShell Exploitation |
### Runtime 字段
在 Kibana 中创建了三个 Painless runtime fields,用于从
原始日志消息中提取结构化属性:
- **`source_ip`** — 从 syslog auth 消息中提取攻击者 IP
- **`dns_query_length`** — 测量编码子域名查询的长度
- **`ps_severity`** / **`ps_tags`** — 从 Sysmon 样式日志条目中提取严重性和技术标签
## 🔧 故障排除
**Kibana 告警被阻止 — "encryption key required"**
添加到 `docker-compose.yml` 中的 Kibana environment 下:
```
- xpack.encryptedSavedObjects.encryptionKey=<32-char-hex>
- xpack.alerting.encryptionKey=<32-char-hex>
- xpack.reporting.encryptionKey=<32-char-hex>
```
**`docker-compose down` 后仪表盘丢失**
确保在 `docker-compose.yml` 中配置了命名卷:
```
volumes:
esdata:
driver: local
kibanaData:
driver: local
```
**Filebeat 未发送日志**
```
sudo systemctl status filebeat
sudo journalctl -u filebeat -f
```
## 📄 报告
`/reports` 目录中包含详细的实验室报告:
- **ELK_Lab_Report.docx** — 涵盖环境设置、
Filebeat 配置和攻击模拟设计
- **SIEM_Dashboard_Report.docx** — 涵盖仪表盘设计、
所有可视化实现以及遇到的问题
## 🛠️ 技术栈
- **Elasticsearch 8.11.0** — 日志索引和搜索
- **Logstash 8.11.0** — 日志摄取管道
- **Kibana 8.11.0** — 可视化和仪表盘
- **Filebeat 8.11.0** — 日志传输 Agent
- **Docker Compose** — 容器编排
- **Python 3** — 攻击模拟脚本
- **Kali Linux** — 实验室环境
## ⚠️ 免责声明
本仓库中的所有攻击模拟仅用于**教育目的**。未针对任何真实系统进行攻击。使用的攻击者 IP 地址来自
[RFC 5737](https://tools.ietf.org/html/rfc5737) TEST-NET 范围
(203.0.113.0/24, 198.51.100.0/24, 192.0.2.0/24),这些地址是不可路由的,
并保留用于文档。
## 👤 作者
**Pranmoy Patar**
个人作品集项目 — ELK Stack SIEM 实验室
## 许可证
本项目根据 MIT 许可证授权 - 详见 [LICENSE](LICENSE) 文件。
标签:AMSI绕过, DNS隐蔽通信, DNS隧道, Docker Compose, Elasticsearch, ELK Stack, Filebeat, Logstash, OPA, OpenCanary, PowerShell利用, Python, 内容过滤, 凭证填充, 威胁检测, 安全仪表盘, 安全信息与事件管理, 安全实验, 容器化部署, 对抗机器学习, 报告导出, 搜索引擎爬取, 撞库, 攻击模拟, 数字取证, 无后门, 日志收集, 版权保护, 网络安全, 自动化脚本, 越狱测试, 逆向工具, 隐私保护, 靶场, 驱动签名利用