grafana/gcx
GitHub: grafana/gcx
Grafana 官方的命令行工具,为用户和 AI 编码智能体提供对 Grafana 实例中 dashboard、告警、指标、日志等可观测性资源的结构化访问与管理能力。
Stars: 508 | Forks: 39
# gcx — Grafana CLI
.grafana.net # select oauth, then press Enter to skip cloud token selection
# 适用于自托管 Grafana 实例
gcx login local --server http://localhost:3000 --token
# 检查你的 API 路由繁忙程度(适用于任何 Grafana)
gcx metrics query 'sum by (handler)(rate(grafana_http_request_duration_seconds_count[5m]))' --since 1h
# 检查你的 grafana cloud 在过去一天的指标使用情况(仅限 Grafana Cloud)
gcx metrics query -d grafanacloud-usage 'grafanacloud_org_metrics_billable_series' --since 24h --step 1h
# 列出并搜索你的 dashboards
gcx dashboards list
gcx dashboards search "node exporter"
```
## 安装
**快速安装 (Linux/macOS):**
```
curl -fsSL https://raw.githubusercontent.com/grafana/gcx/main/scripts/install.sh | sh
```
下载最新版本,校验 SHA-256 checksum,并安装到
`~/.local/bin`。可通过 `INSTALL_DIR` 覆盖安装路径:
```
curl -fsSL https://raw.githubusercontent.com/grafana/gcx/main/scripts/install.sh | INSTALL_DIR=/usr/local/bin sh
```
**Homebrew (macOS 和 Linux):**
```
brew install grafana/grafana/gcx
```
在你的机器上从源码编译(需要 Homebrew 的 `go`,它会作为构建依赖被
自动安装)。首次安装大约需要 30–60 秒,
因为 Go 需要拉取依赖;后续升级会更快。
要更新到最新版本:
```
brew update && brew upgrade gcx
```
**预编译二进制文件 (Linux/macOS/Windows):**
从 [releases 页面](https://github.com/grafana/gcx/releases/latest) 下载适合你操作系统和架构的最新压缩包,
解压并将二进制文件移动到你的 PATH 中:
```
tar xzf gcx_*.tar.gz
chmod +x gcx && sudo mv gcx /usr/local/bin/
```
在 macOS 上,手动下载的二进制文件在首次运行时可能会被拦截,提示
*“Apple could not verify…”* 或 `killed: 9` —— 请参阅
[macOS Gatekeeper 和 killed: 9](docs/sources/installation.md#macos-gatekeeper-and-killed-9)
获取一次性解决方案。上面的 `curl | sh` 安装程序会
自动处理此问题。
**Go install:**
```
go install github.com/grafana/gcx/cmd/gcx@latest
```
**Shell 自动补全:**
```
gcx completion zsh > "${fpath[1]}/_gcx" # zsh
gcx completion bash > /etc/bash_completion.d/gcx # bash
gcx completion fish > ~/.config/fish/completions/gcx.fish # fish
```
**验证:** `gcx --version`
## 身份验证
`gcx login` 用于创建或重新验证 context。它会自动检测服务器是 Grafana Cloud(`*.grafana.net`)还是本地部署,并相应地调整提示。请根据你的设置选择下方匹配的路径。
**Grafana Cloud,基于浏览器的 OAuth(交互式,推荐):**
```
gcx login my-stack --server https://my-stack.grafana.net
```
打开浏览器进行 OAuth,然后将 access token、refresh token 和代理 endpoint 保存到 `my-stack` context 的命名 stack 条目中,并将该 context 设为当前 context。最适合 Cloud stack 的日常使用。如果 OAuth 不适合你的环境,请在提示处选择“Service account token”。
**Service account token (Cloud 或本地部署,推荐用于 CI/自动化):**
```
gcx login my-grafana --server https://your-instance.grafana.net --token glsa_xxx --yes
```
使用 [Grafana service account token](https://grafana.com/docs/grafana/latest/administration/service-accounts/),其角色应与 token 执行的任务相匹配:**Viewer** 足以进行查询(指标、日志、trace、profile)以及读取 dashboard 或 folder;**Editor** 可以推送和编辑 dashboard 及 folder;管理 datasource 配置则需要 **Admin**。在 Grafana Cloud 和 Enterprise 中,RBAC 自定义角色可以更严格地限制查询访问权限(例如,对特定 datasource 的 `datasources:read` 和 `datasources:query`)。token 适用于 Cloud 和本地部署,推荐在自动化场景中使用。本地部署的 stack 还可以使用基本身份验证或配置的 mTLS 客户端证书。
**Grafana Cloud 产品 API (SLO、Synthetic Monitoring、IRM 等):**
除了 Grafana 实例身份验证外,Cloud 产品命令还需要单独的 Grafana Cloud 平台凭证。
[Cloud Access Policy token](https://grafana.com/docs/grafana-cloud/account-management/authentication-and-permissions/access-policies/)
具有最广泛的命令兼容性,推荐用于自动化。请在登录时提供:
```
gcx login my-stack --server https://my-stack.grafana.net --token glsa_xxx --cloud-token glc_xxx --yes
```
或者稍后通过对同一 context 重新运行 `gcx login` 来添加 Cloud 访问权限。
交互式 Cloud 步骤可以保留现有的 CAP 或未过期的 OAuth 凭证,
接受新的 CAP,运行实验性的基于浏览器的 Cloud OAuth 流程,
或者跳过 Cloud 功能:
```
gcx login --context my-stack
```
你也可以直接运行 Cloud OAuth 流程:
```
gcx cloud login --context my-stack
```
直接 Cloud OAuth 会存储 OAuth token、过期时间、授予的 scope 和 endpoint 对,但这仍处于实验阶段,并非所有 Cloud 产品命令都支持它。
使用 CAP 可获得完全兼容性。
如果可能,`gcx` 会从 `--server` 推导出 Cloud stack slug。仅在 gcx 无法推导的自定义域名中显式设置它:
```
gcx config set stacks.my-stack.slug your-stack-slug
```
你无需为 `grafana.com` 设置 Cloud endpoint;gcx 默认使用
`https://grafana.com`。对于自定义环境,请验证并存储一致的
OAuth/API 目标对:在登录命令中提供一个 endpoint 会将其
用于两项操作,除非你显式地向
`gcx cloud login` 同时提供两者。更改命名条目的 `api-url` 或 `oauth-url` 会使其旧凭证失效,因此在编辑后需要重新验证。
**环境变量 (CI/CD、智能体):**
```
export GRAFANA_SERVER="https://your-instance.grafana.net"
export GRAFANA_TOKEN="your-service-account-token"
export GRAFANA_CLOUD_TOKEN="your-cloud-access-policy-token"
# 可选:仅在 gcx 无法从 GRAFANA_SERVER 推断出 stack slug 时需要。
export GRAFANA_CLOUD_STACK="your-stack-slug"
```
环境变量在每次调用命令时解析,因此你可以直接运行 `gcx` 命令,而无需事先执行 `gcx login`。
为了安全起见,自动发现的仓库 `.gcx.yaml` 不能将运行时 token、提示输入的登录凭证或外部 mTLS 密钥对附加到该文件提供的 destination 上。如果你打算让该文件管理凭证或直接提供 provider endpoint,请使用 `--config .gcx.yaml` 或 `GCX_CONFIG=.gcx.yaml` 显式授权;仅提供 `--server` 或 endpoint 标志是不够的。
特定于 provider 的运行时 endpoint 仅在同一调用中提供了匹配的运行时凭证时才被接受;该凭证对不会授权自动发现的仓库 stack 的 TLS 或代理配置。
**验证:** `gcx config check`
完整指南(包括重新验证、环境变量设置和常见错误排查)请参阅 [login 参考](docs/reference/login.md)。
## 实际操作演示
**从你的终端查询生产环境:**
```
$ gcx metrics query 'sum by (instance)(rate(grafana_http_request_duration_seconds_count[5m]))' --since 1h
┌───────────────────────────────────────────┬───────────────────────────────────────────┬───────────────────────────────────────────┐
│ INSTANCE │ TIMESTAMP │ VALUE │
├───────────────────────────────────────────┼───────────────────────────────────────────┼───────────────────────────────────────────┤
│ localhost:3000 │ 2026-04-28T11:59:00+01:00 │ 0.0073020555555555556 │
│ localhost:3000 │ 2026-04-28T12:00:00+01:00 │ 0.11167158333333332 │
│ localhost:3000 │ 2026-04-28T12:01:00+01:00 │ 0.1024372962962963 │
│ localhost:3000 │ 2026-04-28T12:02:00+01:00 │ 0.09583333333333333 │
...
```
**检查正在触发的告警:**
```
$ gcx alert rules list --state firing
┌──────────────────────────────────────┬─────────────────────────────────────────────────────────────────────┬──────────┬──────────┬──────────┐
│ UID │ NAME │ STATE │ HEALTH │ PAUSED │
├──────────────────────────────────────┼─────────────────────────────────────────────────────────────────────┼──────────┼──────────┼──────────┤
│ e62566b8-da2d-45e0-853a-40abebc9f863 │ adaptive_traces_forecast_gme_distributor_alert │ firing │ ok │ no │
│ cfhcfnhd8xam9a │ GraphiteProxy: Reads (dev) Native - Error Budget Burn Rate is High │ firing │ ok │ no │
│ affq1sffre0apd │ Unified Storage: HIGH_SLOW Latency - Error Budget Burn Rate is High │ firing │ ok │ no │
│ 16ddf4b0-7d8c-5dad-a71a-81f87a1e47a2 │ BillingSeriesAbsent │ firing │ ok │ no │
│ 09d44d08-b4cc-5d0e-8544-514e380f6bb3 │ k6CloudSecretsUsageReportingNoData │ firing │ ok │ no │
│ eb62d01f-5f73-543b-947b-2c849890d5f6 │ MissingBackups │ firing │ ok │ no │
│ 5f9e01d4-0b2d-5b51-a787-26535ded4719 │ MissingBackups │ firing │ ok │ no │
│ e4646576-9c07-5dfd-b22c-1e5b4da761ef │ MissingBackups │ firing │ ok │ no │
│ b89d5170-d0bd-5869-ad22-7a0a944b3aae │ MissingBackups │ firing │ ok │ no │
```
**查看 SLO 状态:**
```
$ gcx slo definitions list
┌───────────────────────┬───────────────────────────────────────────────────────┬─────────────┬────────────┬────────────┐
│ UUID │ NAME │ TARGET │ WINDOW │ STATUS │
├───────────────────────┼───────────────────────────────────────────────────────┼─────────────┼────────────┼────────────┤
│ y5yc8cy86yqtmey930foh │ CB additional identifier │ 90.00% │ 28d │ created │
│ sgz23sbv2c19v0r32s8y1 │ Checkout App - p95 Latency │ 99.50% │ 28d │ updated │
│ nwd4dk7j38spanror727k │ GraphiteProxy: Reads (dev) Native │ 99.50% │ 28d │ created │
│ e1cteeyl2ukmilw1tqugw │ KG fusion test grafana-slo-app │ 99.50% │ 28d │ created │
│ bwyf5d8g1614ugri7u0w7 │ KG fusion test grafana-slo-stats-service │ 99.50% │ 28d │ created │
│ tfkp5e0ronnl1ywpbv9b5 │ OTLPGateway: MetricWrites (dev) - Mimir │ 99.90% │ 28d │ created │
│ wvgxovr2k60efxizv1y9f │ Unified Storage: HIGH_SLOW Latency │ 99.50% │ 28d │ updated │
└───────────────────────┴───────────────────────────────────────────────────────┴─────────────┴────────────┴────────────┘
```
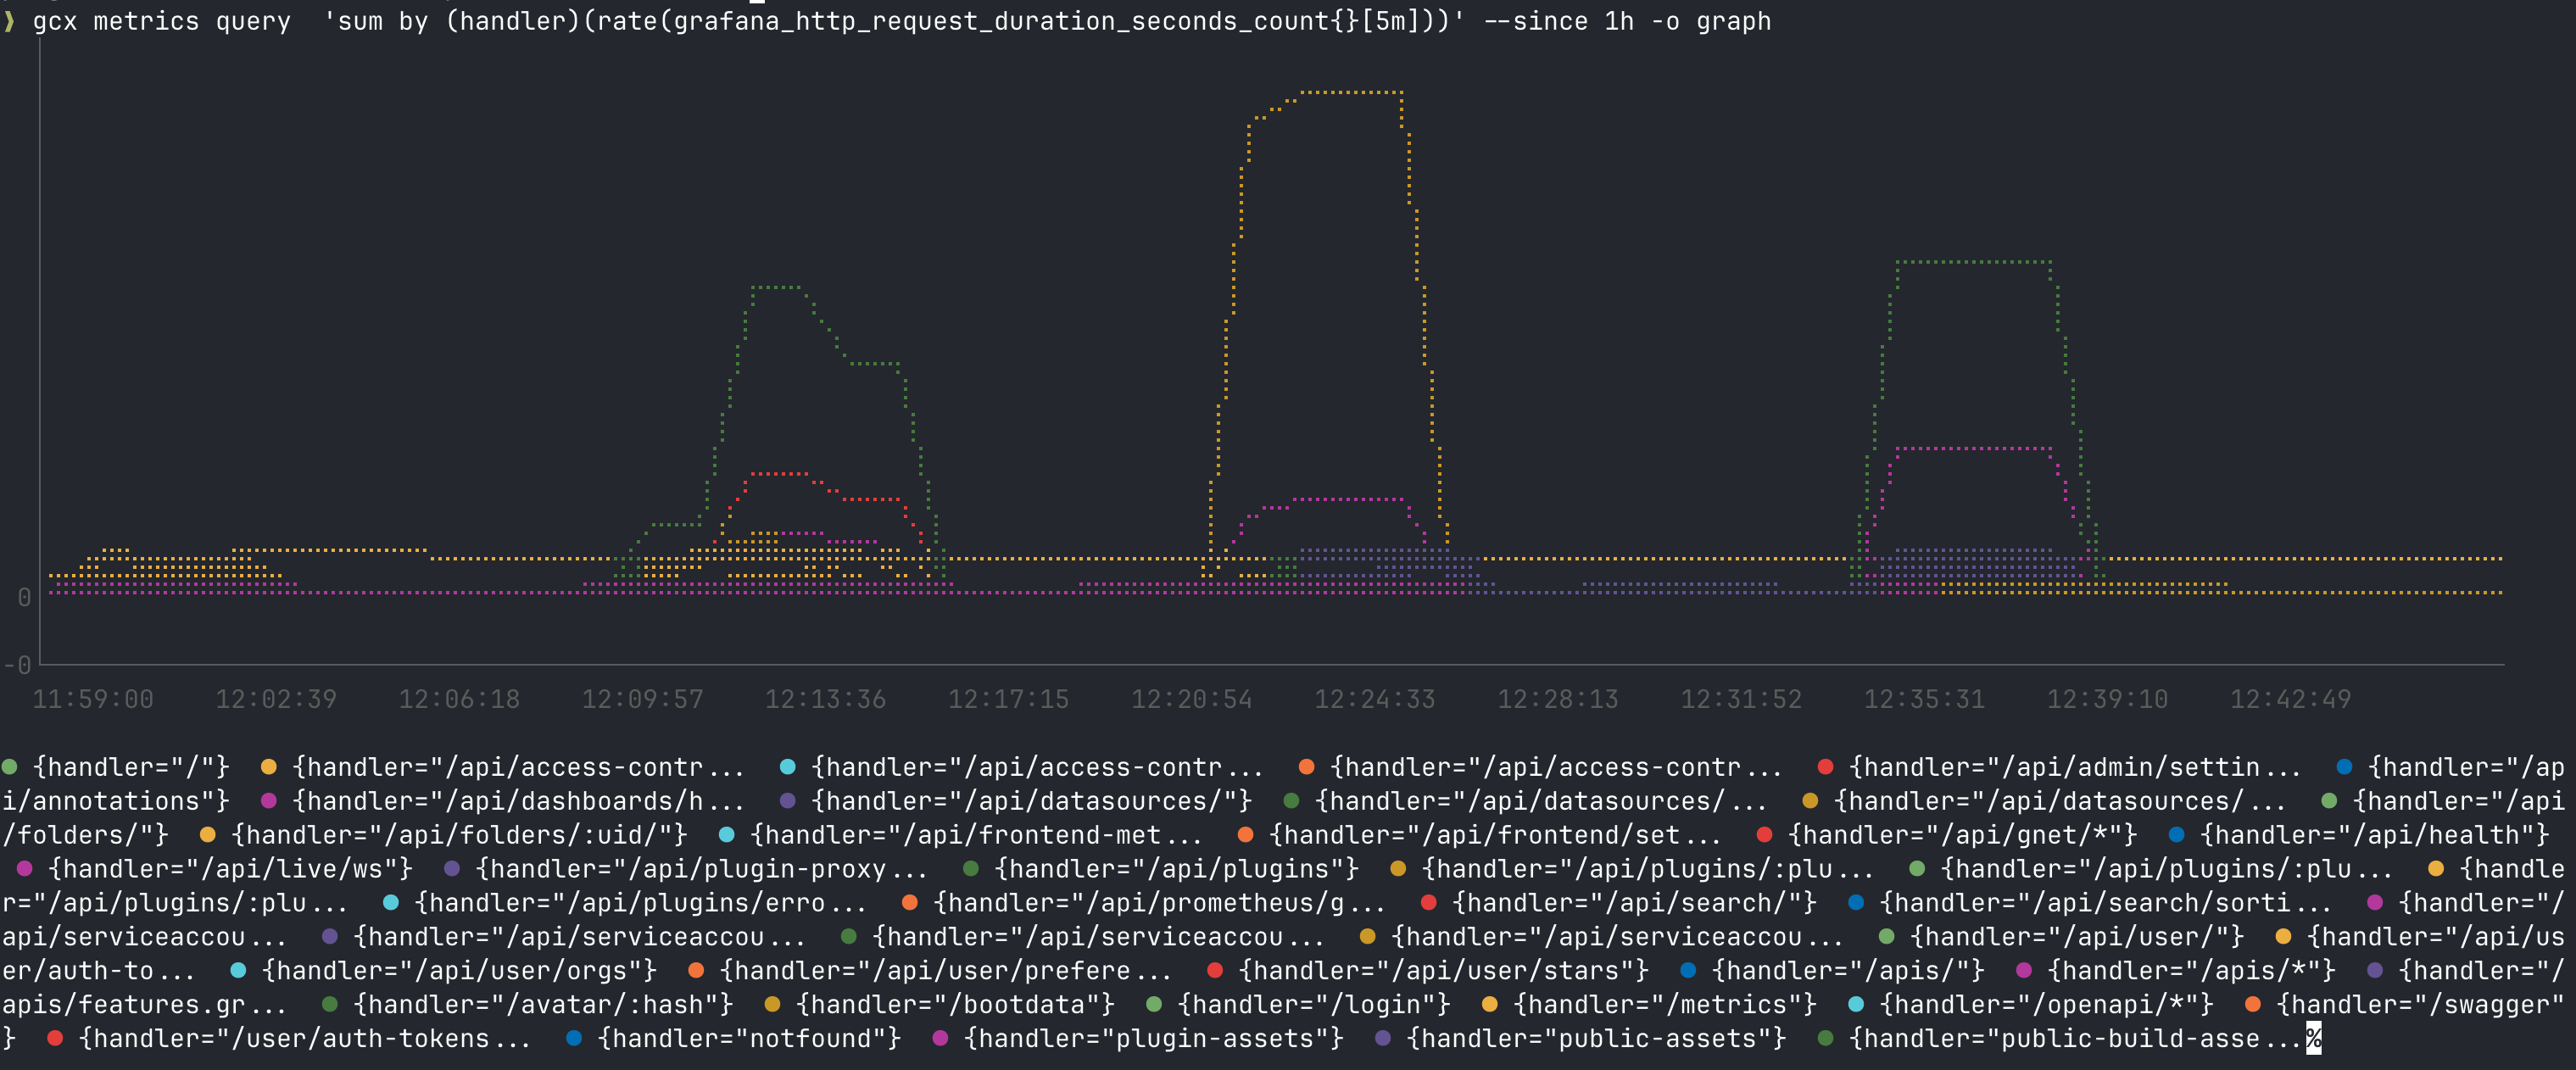
**直接在你的终端中可视化指标:**
```
$ gcx metrics query 'sum by (handler)(rate(grafana_http_request_duration_seconds_count{}[5m]))' --since 1h -o graph
```
**探索更多**
```
# Grafana 资源
gcx resources list-types # discover available resource types
gcx dashboards list # list all dashboards
gcx dashboards search "node exporter" # full-text search by title/tag/folder
gcx resources get folders # list all folders
gcx alert rules list # list alert rules
# Grafana Cloud 产品
gcx synthetic-monitoring checks list # list synthetic monitoring checks
gcx irm oncall schedules list # list on-call schedules
gcx k6 load-tests list # list k6 load tests
# 查询更多 datasources
gcx logs query '{app="nginx"} |= "error"' --since 1h
gcx traces query '{.cluster="dev-us-central-0"}' --since 1h
```
## 安装智能体技能
gcx 提供了一个便携的 Agent Skills 包,用于设置、dashboard 创建与 GitOps、datasource 探索、告警排查、结构化调试、SLO 管理、Synthetic Monitoring 工作流、Knowledge Graph 诊断、项目脚手架、资源生成与导入以及端到端可观测性部署。
请参阅 Claude 插件 README 中的[完整技能清单](claude-plugin/README.md#skills)。
**对于 Claude Code**
使用专用的 [Claude Code 插件](claude-plugin/README.md):
```
/plugin marketplace add grafana/gcx
/plugin install gcx@gcx-marketplace
```
**对于其他兼容 `.agents` 的环境**
例如:OpenAI Codex、OpenCode 和 Pi。使用以下命令查看包中附带的技能:
```
gcx agent skills list
24 skill(s) bundled with gcx
SKILL INSTALLED DESCRIPTION
create-dashboard yes Design and create dashboards with datasource discovery and snapshot-based visual iteration.
debug-with-grafana yes Structured workflow for investigating application problems with Grafana observability data.
....
```
使用以下命令将包安装到 `~/.agents/skills`:
```
gcx agent skills install --all
```
如果你安装的技能与你当前 `gcx` 版本附带的包不一致,
`gcx` 可能会显示交互式提醒,建议:
```
gcx agent skills update
```
要完全禁用该提醒,请设置:
```
export GCX_NO_UPDATE_NOTIFIER=1
```
## 智能体工作流
以下展示的是当你的编码智能体拥有生产环境访问权限时的情形。此示例使用了 Grafana Assistant,它需要 Grafana Cloud —— 请参阅[兼容性矩阵](#compatibility);[以下工作流](#beyond-alert-investigation)可在任何 Grafana 上运行。
**1. 告警触发** —— checkout 服务的 P95 延迟超过了 SLO 阈值。
**2. Assistant 进行排查** —— 你的编码智能体通过 gcx 调用 Grafana Assistant。Assistant 已经开始了调查 —— 它将问题追溯到 `customer_id` 上缺少索引,导致在负载下进行全表扫描。
**3. 修复问题** —— 起草 migration,添加索引。
**4. 防止复发** —— 使用 OpenTelemetry span 为服务植入插桩,在 checkout 流程上设置 Synthetic Monitoring 检查,并针对查询持续时间创建告警规则。
**5. 交付上线** —— 打开 PR,测试通过,部署到生产环境。告警解除。
调查、修复、插桩、监控 —— 开发者无需离开编辑器即可完成。Grafana Assistant 提供智能;gcx 提供接口。而且因为这一切都建立在你在 Grafana 中已经配置好的所有内容之上 —— 你的 dashboard、你的告警、你的 datasource —— 没有其他工具能开箱即用地为你提供这样的深度。
```
$ gcx assistant investigations list
ID TITLE STATUS UPDATED
abc1 Checkout P95 latency breach active 2m ago
def2 Memory leak in payment-svc resolved 1h ago
```
### 超越告警排查
上面的智能体工作流只是一个例子。gcx 支持广泛的工作流:
- **资源 GitOps** —— 将资源拉取到本地文件,让你的智能体进行编辑,然后推送回 Grafana (`gcx resources pull` / `gcx resources push`)
- **探索你的数据** —— 在编写查询之前发现 datasource、指标、标签和日志流 (`gcx datasources list`, `gcx metrics labels`)
- **SLO 管理** —— 从你的终端创建、监控和排查 SLO (`gcx slo definitions list`, `gcx slo reports list`)
- **入门与设置** —— 为 Kubernetes 集群植入插桩并配置 Grafana Cloud 产品 (`gcx instrumentation setup`)
- **可观测性即代码** —— 搭建项目脚手架,将现有的 dashboard 作为 Go 代码导入,进行 lint 并部署 (`gcx dev scaffold`, `gcx dev import`)
## 兼容性
### Grafana 版本支持
| Grafana | 支持级别 |
|---------|---------------|
| **Grafana Cloud** | **全面支持。** 本 README 中的所有内容,包括 Cloud 专属产品(SLO、Synthetic Monitoring、IRM、k6、Fleet、Adaptive Telemetry、Assistant)。 |
| **Grafana 13+** (OSS / Enterprise) | **全面支持** 自托管功能。gcx 依赖的所有 app-platform API 组默认均处于启用状态。 |
| **Grafana 12.x** (OSS / Enterprise) | **支持大部分功能。** 基于 app-platform API 组构建的功能在 12 中默认尚未启用,需要显式的 feature toggle —— 已知情况请参阅下文的 ‡。 |
| **Grafana < 12** | **不支持。** gcx 会检测服务器版本并以代码 6(版本不兼容)退出。 |
Grafana 正在逐步将其 API 迁移到 app-platform(Kubernetes 风格)的 API 组,每个组会在不同的版本中切换为默认启用。当命令需要你的 stack 未提供的 API 组时,请升级或启用相应的 feature toggle。有关这些要求(最低版本、feature toggle)的逐命令声明,正在
[#989](https://github.com/grafana/gcx/issues/989) 中追踪。
### 各部署类型的功能可用性
| 功能 | 命令 | OSS | Enterprise | Cloud | BYOC |
|---------|----------|:---:|:----------:|:-----:|:----:|
| 资源管理 (dashboard、folder) | `resources` | ✓ | ✓ | ✓ | ✓ |
| 告警规则 | `alert` | ✓ ‡ | ✓ ‡ | ✓ | ✓ |
| 原始 API 透传 | `api` | ✓ | ✓ | ✓ | ✓ |
| 可观测性即代码 | `dev` | ✓ | ✓ | ✓ | ✓ |
| 信号查询 (指标、日志、trace、profile) | `metrics`, `logs`, `traces`, `profiles` | ✓ † | ✓ † | ✓ | ✓ |
| SLO、Synthetic Monitoring、IRM、k6、Fleet 等 | `slo`, `synthetic-monitoring`, `irm`, `k6`, `fleet` | ✗ | ✗ | ✓ | ◐ |
| Adaptive Metrics / Logs / Traces | `metrics adaptive`, `logs adaptive`, `traces adaptive` | ✗ | ✗ | ✓ | ◐ |
| Grafana Assistant | `assistant` | ✗ | ✗ | ✓ | ✗ |
**‡ Grafana 管理的规则写入** —— 读取告警规则 (`gcx alert rules`, `gcx alert groups`) 和 datasource 管理的 ruler 写入 (`gcx alert ruler`) 可在 Grafana 12+ 上运行。通过资源层 (`gcx resources pull/push alertrules`) 写入 *Grafana 管理的*规则需要 Grafana 13+,其中 `rules.alert.grafana.app` API 默认启用。在 Grafana 12 上,必须使用 `kubernetesAlertingRules` feature toggle 显式启用(在 12.x 中为实验性功能,需要重启,并且必须启用 Unified Alerting):
```
[feature_toggles]
kubernetesAlertingRules = true
```
**† 自托管信号查询** —— `gcx metrics query`、`gcx logs query`、`gcx traces query` 和 `gcx profiles query` 可用于自托管的 datasource(Prometheus、Loki、Tempo、Pyroscope),但必须手动配置 datasource endpoint。对于 Grafana Cloud,endpoint 会从你的 stack 中自动发现。
**◐ BYOC** —— Bring Your Own Cloud 在你自己的基础设施上运行 Grafana stack,同时连接到 Grafana Cloud 控制平面。核心 Grafana 功能(dashboard、告警、信号查询)可完全使用。Cloud 产品的可用性(SLO、Synthetic Monitoring、IRM 等)取决于你的 BYOC stack 中安装和配置了哪些插件。
## Grafana Cloud 产品
gcx 为每个 Grafana Cloud 产品提供了专用命令:
| 产品 | 命令 | 示例 |
|---------|---------|----------|
| **SLOs** | `gcx slo` | `slo definitions list`, `slo reports list` |
| **Synthetic Monitoring** | `gcx synthetic-monitoring` | `synthetic-monitoring checks list`, `synthetic-monitoring probes list` |
| **IRM** | `gcx irm` | `irm oncall schedules list`, `irm oncall integrations list`, `irm incidents list`, `irm incidents create -f incident.yaml` |
| **Alerting** | `gcx alert` | `alert rules list`, `alert groups list` |
| **k6 Cloud** | `gcx k6` | `k6 load-tests list`, `k6 runs list` |
| **Fleet Management** | `gcx fleet` | `fleet pipelines list`, `fleet collectors list` |
| **Knowledge Graph** | `gcx kg` | `kg status`, `kg entities list`, `kg entities inspect` |
| **Frontend Observability** | `gcx frontend` | `frontend apps list`, `frontend apps get` |
| **App Observability** | `gcx appo11y` | `appo11y overrides get`, `appo11y settings get` |
| **Agent Observability** | `gcx agento11y` | `agento11y conversations list`, `agento11y agents list`, `agento11y rules list` |
| **Assistant** | `gcx assistant` | `assistant prompt`, `assistant investigations list`, `assistant mcp-servers list` |
| **Adaptive Metrics** | `gcx metrics adaptive` | `metrics adaptive recommendations list`, `metrics adaptive rules list` |
| **Adaptive Logs** | `gcx logs adaptive` | `logs adaptive patterns list`, `logs adaptive drop-rules list` |
| **Adaptive Traces** | `gcx traces adaptive` | `traces adaptive recommendations list`, `traces adaptive policies list` |
| **Profiles (Pyroscope)** | `gcx profiles` | `profiles query`, `profiles labels` |
| **Traces (Tempo)** | `gcx traces` | `traces query`, `traces get`, `traces labels` |
## 资源管理
通过单个 CLI 管理原生的 Grafana 资源(dashboard、folder)和 Grafana Cloud 资源:
```
# 将 dashboards 和 folders 拉取到本地文件
gcx resources pull dashboards -p ./resources -o yaml
gcx resources pull folders -p ./resources -o yaml
# 将本地更改推送回 Grafana
gcx resources push -p ./resources
# 预览更改而不应用
gcx resources push -p ./resources --dry-run
# 在推送前验证资源
gcx resources validate -p ./resources
# 交互式编辑 dashboard(打开 $EDITOR)
gcx resources edit dashboards/my-dashboard
# 删除资源
gcx resources delete dashboards/my-dashboard
```
## 告警与 Datasource 查询
直接检查告警规则并查询 datasource:
```
# 告警规则
gcx alert rules list
gcx alert groups list
# PromQL 查询
gcx metrics query 'rate(http_requests_total[5m])' --since 1h
gcx metrics labels
gcx metrics metadata
# LogQL 查询
gcx logs query '{app="nginx"} |= "error"' --since 1h
gcx logs labels
gcx logs series --match '{app="nginx"}'
```
gcx 还支持 Pyroscope(profiling)和 Tempo(trace)datasource。
## 可观测性即代码
gcx 包含使用 [grafana-foundation-sdk](https://github.com/grafana/grafana-foundation-sdk) 将 Grafana 资源作为 Go 代码进行管理的工具:
```
# 创建新项目脚手架
gcx dev scaffold --project my-dashboards
# 从 Grafana 导入现有 dashboards 作为 Go builder 代码
gcx dev import dashboards
# Live-reload 开发服务器(在浏览器中预览 dashboards)
gcx dev serve ./resources
# 使用内置和自定义 Rego 规则 Lint 资源
gcx dev lint run ./resources
gcx dev lint list-rules # list available rules
gcx dev lint new dashboard my-rule # create custom rule
# 构建并推送
go run . && gcx resources push -p ./resources
```
## 原始 API 访问
对于内置命令未涵盖的任何内容,请使用 API 透传:
```
gcx api /api/health
gcx api /api/datasources -o yaml
gcx api /api/dashboards/db -d @dashboard.json
gcx api /api/dashboards/uid/my-dashboard -X DELETE
```
## GitOps
将资源拉取到文件中,在 git 中进行版本控制,然后推回:
```
# 拉取所有资源
gcx resources pull -p ./resources -o yaml
# 提交到 git
git add ./resources && git commit -m "snapshot Grafana resources"
# 将更改从 git 推送到 Grafana
gcx resources push -p ./resources
```
gcx push 是幂等的 —— 多次运行会产生相同的结果。Folder 会在 dashboard 之前自动推送,以满足依赖关系。
## CI/CD
```
# .github/workflows/deploy-resources.yaml
name: Deploy Grafana Resources
on:
push:
branches: [main]
paths: ['resources/**']
jobs:
deploy:
runs-on: ubuntu-latest
steps:
- uses: actions/checkout@v4
- name: Install gcx
run: |
curl -fL "$(curl -s https://api.github.com/repos/grafana/gcx/releases/latest | grep browser_download_url | grep linux_amd64.tar.gz | cut -d '"' -f 4)" | tar xz gcx
chmod +x gcx && sudo mv gcx /usr/local/bin/
- name: Deploy resources
env:
GRAFANA_SERVER: ${{ secrets.GRAFANA_PROD_URL }}
GRAFANA_TOKEN: ${{ secrets.GRAFANA_PROD_TOKEN }}
run: |
gcx resources validate -p ./resources
gcx resources push -p ./resources --on-error abort
```
- `gcx resources` 命令专为非交互式使用而设计,除了 `edit` 会打开外部编辑器之外
- `resources delete` 没有确认提示。命名选择器无需 `--force` 即可继续执行;仅类型选择器(例如 `dashboards`)需要 `--force`(`--yes` 也会启用它),并且可以删除选定 context 和 namespace 中所有匹配的资源
- 在 `push` 和 `delete` 中使用 `--dry-run` 预览更改
- 使用 `--on-error abort|fail|ignore` 控制错误行为
- 使用 `-o json` 或 `-o yaml` 获取机器可解析的输出
## 文档
| 主题 | 描述 |
|-------|-------------|
| [安装](docs/sources/installation.md) | 在 macOS、Linux 和 Windows 上安装 gcx |
| [配置](docs/sources/configuration.md) | Context、身份验证、环境变量 |
| [管理资源](docs/guides/manage-resources.md) | 获取、推送、拉取、删除、编辑、验证 |
| [Dashboard 即代码](docs/guides/dashboards-as-code.md) | 结合实时开发服务器的 Dashboard-as-code 工作流 |
| [Linting 资源](docs/guides/lint-resources.md) | 使用 Rego 策略对 dashboard 和告警规则进行 lint |
| [CLI 参考](docs/reference/cli/) | 完整的命令参考(自动生成) |
## 使用统计
`gcx` 会向 Grafana Labs 报告有关其自身的有限使用统计数据。这些数据用于了解哪些命令和标志使用最频繁,命令在何处失败,以及人们尝试使用了哪些不存在的命令,以便我们改进产品。
要了解有关 `gcx` 使用统计的更多信息,或了解如何禁用它,请访问 [Grafana Labs 文档](https://grafana.com/docs/grafana/latest/as-code/observability-as-code/grafana-cli/gcx/anonymous-usage-statistics/)。
## 贡献
请参阅我们的[贡献指南](CONTRIBUTING.md)。
## 许可证
Apache 2.0 —— 请参阅 [LICENSE](LICENSE)。




标签:AIOps, API集成, EVTX分析, Go, Grafana, Ruby工具, 可观测性, 文档结构分析, 日志审计, 运维工具