ahlaam04/threat-detection-lab
GitHub: ahlaam04/threat-detection-lab
基于 Splunk SIEM 和 MITRE ATT&CK 框架的威胁检测工程实验室,使用真实攻击模拟数据集展示端到端的 SOC 检测规则构建与威胁可视化流程。
Stars: 0 | Forks: 0
# 威胁检测工程实验室
### Splunk SIEM × MITRE ATT&CK Framework
## 项目目标
本项目的目标是模拟真实的 SOC 分析师和检测工程师工作流程:
- 分析来自模拟企业入侵的真实攻击日志
- 识别可疑行为并将其映射到 MITRE ATT&CK
- 基于真实观察构建检测规则(SPL 查询)
- 创建专业的 SOC 仪表板以实现威胁可视化
- 以结构化和可重现的方式记录发现
本项目展示了端到端的检测工程技能:从原始日志分析到映射到威胁框架的可操作告警。
## 数据集 — Boss of the SOC v3 (BOTS v3)
### 什么是 BOTS v3?
**Boss of the SOC (BOTS) v3** 是由 **Splunk** 创建的专业级攻击模拟数据集。它最初用于 Splunk .conf2018 安全竞赛。
### 它模拟了什么?
该数据集模拟了**针对名为 Frothly 的虚构公司发起的真实网络攻击**,这是一家拥有混合基础设施(本地 Windows 机器 + AWS 云)的精酿啤酒公司。
### 模拟的基础设施
```
On-Premise Windows machines :
BSTOLL-L → Most active machine (6387 DNS queries)
BGIST-L → Windows workstation
MKRAEUS-L → MalloryKraeusen's workstation
PCERF-L → Windows workstation
FYODOR-L → Windows workstation
Cloud Infrastructure :
AWS EC2 instances
AWS RDS database
AWS CloudTrail logging
VPC Flow Logs
```
### 可用数据源
| Sourcetype | 事件数 | 描述 |
|------------|--------|-------------|
| syslog | 283,976 | Linux 系统日志 |
| stream:ip | 227,872 | 网络 IP 流量 |
| osquery:results | 219,997 | Linux 端点监控 |
| stream:dns | 218,456 | DNS 查询和响应 |
| stream:udp | 157,960 | UDP 网络流量 |
| WinEventLog | 48,101 | Windows 安全/系统日志 |
| cisco:asa | 80,192 | 防火墙日志 |
| aws:cloudtrail | 9,212 | AWS API 活动日志 |
**总计:涵盖完整攻击场景的 300,000+ 条事件**
 ## 调查与识别
在编写任何检测规则之前,我遵循了结构化的调查流程:
```
Step 1 → Understand the environment
What machines ? What data sources ? What timeline ?
Step 2 → Identify suspicious patterns
Abnormal volumes, unusual processes, privilege abuse
Step 3 → Map to MITRE ATT&CK
Which tactic and technique does this behavior match ?
Step 4 → Write the SPL detection rule
Based on real observations, not assumptions
Step 5 → Validate results
Check for false positives, tune thresholds
Step 6 → Save as scheduled alert
Automate detection for future occurrences
Step 7 → Document everything
YAML format with findings, rationale, and tuning notes
```
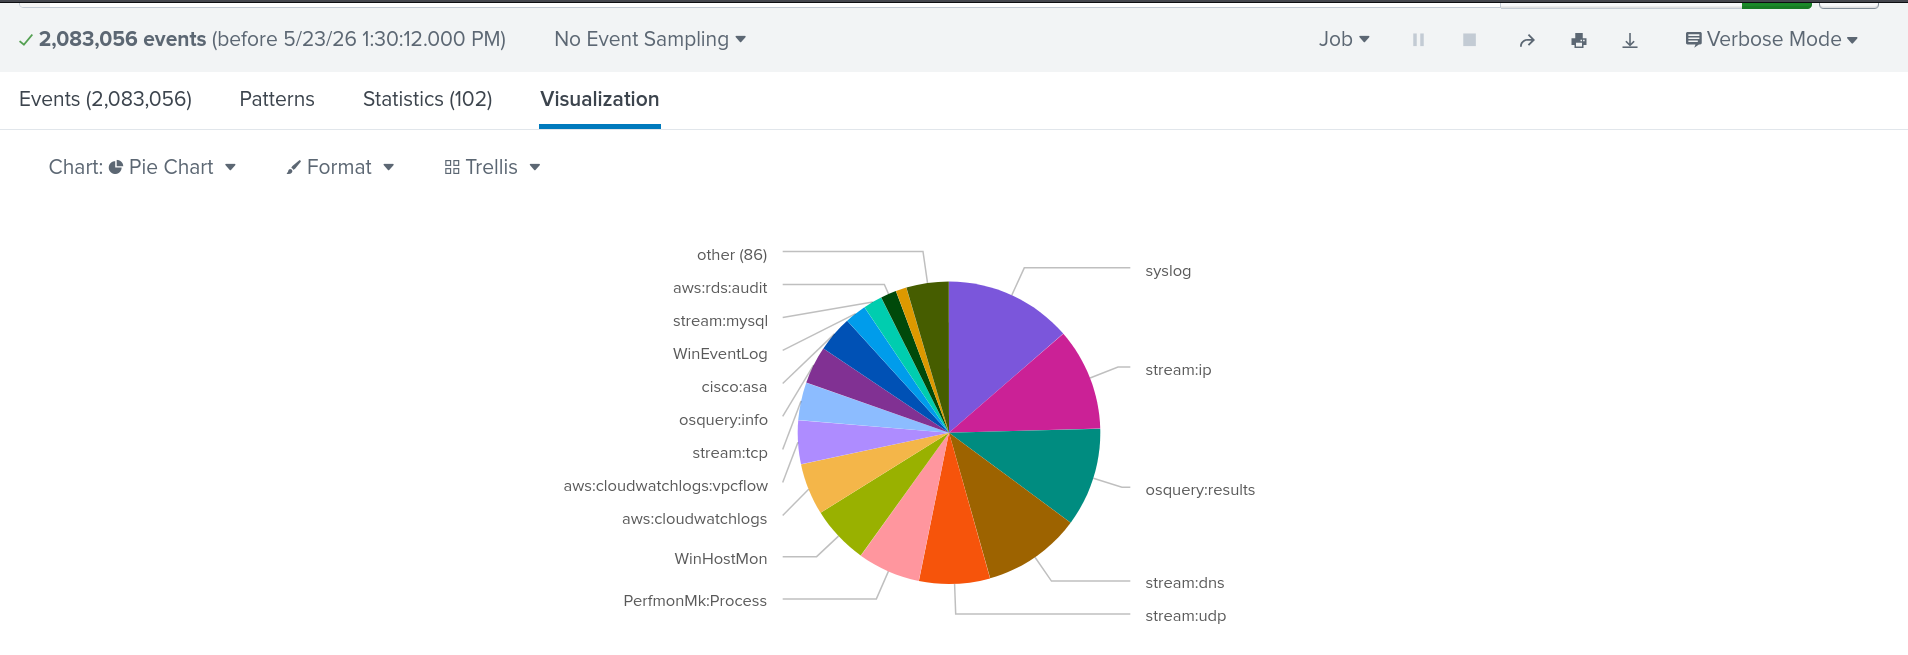
### 第 1 步 — 环境发现
在寻找攻击之前,我首先对环境进行了梳理,以了解我正在处理的内容。
**使用的查询**:
```
index=botsv3 | stats count by sourcetype | sort -count
```
## 调查与识别
在编写任何检测规则之前,我遵循了结构化的调查流程:
```
Step 1 → Understand the environment
What machines ? What data sources ? What timeline ?
Step 2 → Identify suspicious patterns
Abnormal volumes, unusual processes, privilege abuse
Step 3 → Map to MITRE ATT&CK
Which tactic and technique does this behavior match ?
Step 4 → Write the SPL detection rule
Based on real observations, not assumptions
Step 5 → Validate results
Check for false positives, tune thresholds
Step 6 → Save as scheduled alert
Automate detection for future occurrences
Step 7 → Document everything
YAML format with findings, rationale, and tuning notes
```
### 第 1 步 — 环境发现
在寻找攻击之前,我首先对环境进行了梳理,以了解我正在处理的内容。
**使用的查询**:
```
index=botsv3 | stats count by sourcetype | sort -count
```
 **我的发现**:
- 涵盖 15+ 数据源的 2,000,000+ 条事件
- Windows 端点、Linux 服务器和 AWS 云的混合
- 包含 2018 年 8 月完整攻击场景的数据
**关键观察**:
该数据集包含来自混合基础设施(本地 Windows 机器和 AWS 云服务)的日志。
这意味着攻击者必须同时入侵这两个环境。
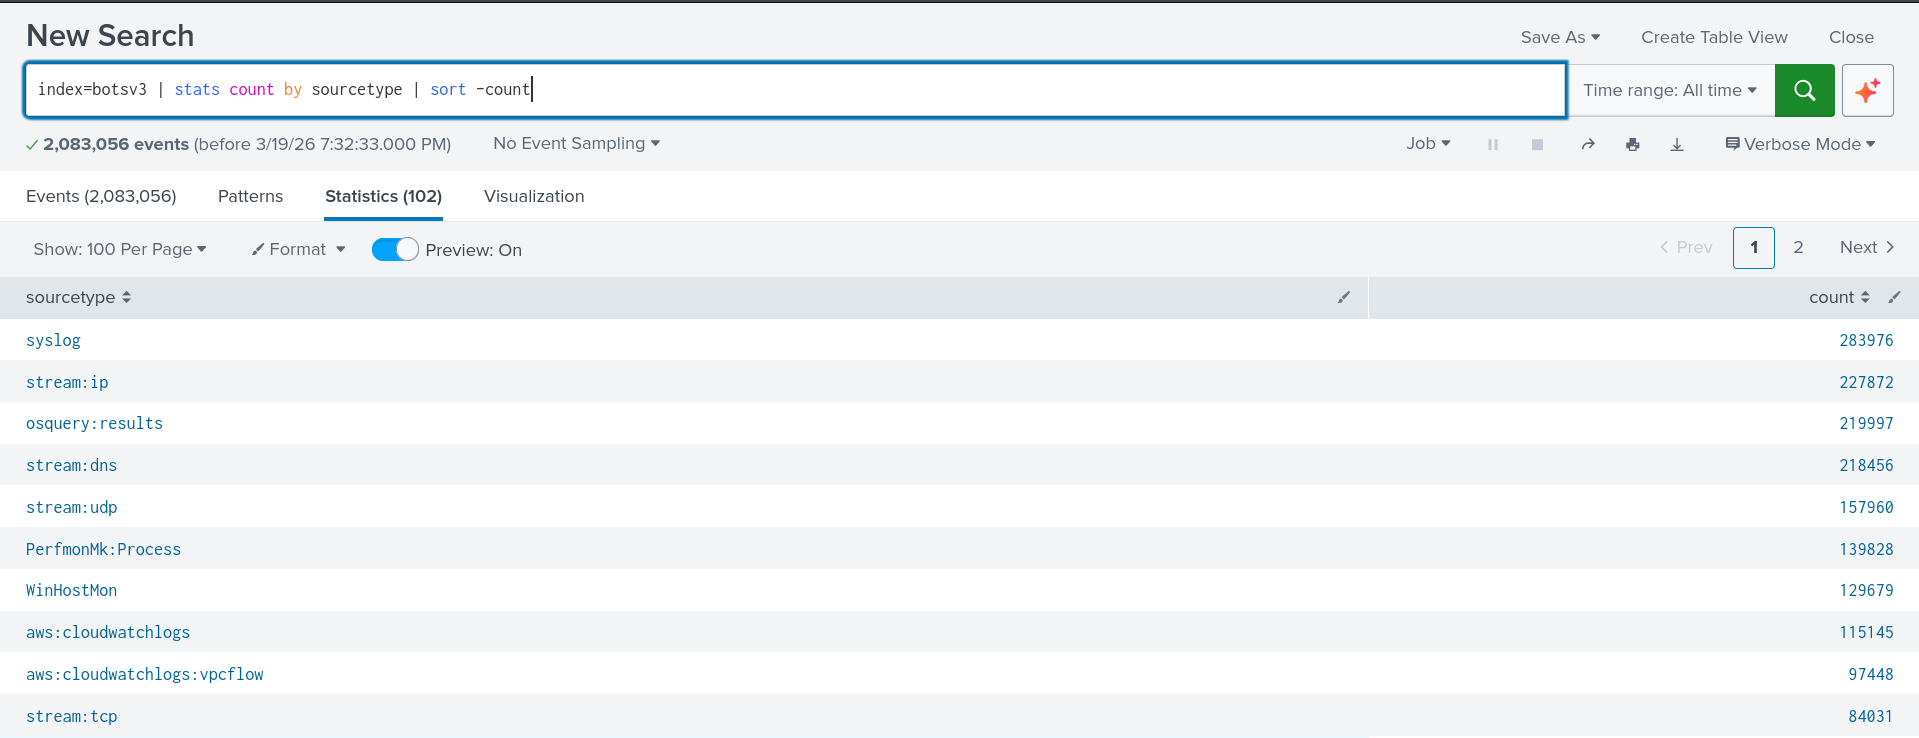
### 第 2 步 — 识别可疑主机
**使用的查询**:
```
index=botsv3 | stats count by host | sort -count
```
**我的发现**:
- 涵盖 15+ 数据源的 2,000,000+ 条事件
- Windows 端点、Linux 服务器和 AWS 云的混合
- 包含 2018 年 8 月完整攻击场景的数据
**关键观察**:
该数据集包含来自混合基础设施(本地 Windows 机器和 AWS 云服务)的日志。
这意味着攻击者必须同时入侵这两个环境。
### 第 2 步 — 识别可疑主机
**使用的查询**:
```
index=botsv3 | stats count by host | sort -count
```
 **我的发现**:
| 主机 | 事件计数 | 可疑等级 |
|------|-------------|-----------------|
| BSTOLL-L | 最高 | 🔴 极高 |
| BGIST-L | 高 | 🟠 高 |
| MKRAEUS-L | 中 | 🟡 中 |
| PCERF-L | 中 | 🟡 中 |
**关键观察**:
BSTOLL-L 生成的事件明显多于任何其他机器,这成为了我的主要调查目标。
**我的发现**:
| 主机 | 事件计数 | 可疑等级 |
|------|-------------|-----------------|
| BSTOLL-L | 最高 | 🔴 极高 |
| BGIST-L | 高 | 🟠 高 |
| MKRAEUS-L | 中 | 🟡 中 |
| PCERF-L | 中 | 🟡 中 |
**关键观察**:
BSTOLL-L 生成的事件明显多于任何其他机器,这成为了我的主要调查目标。
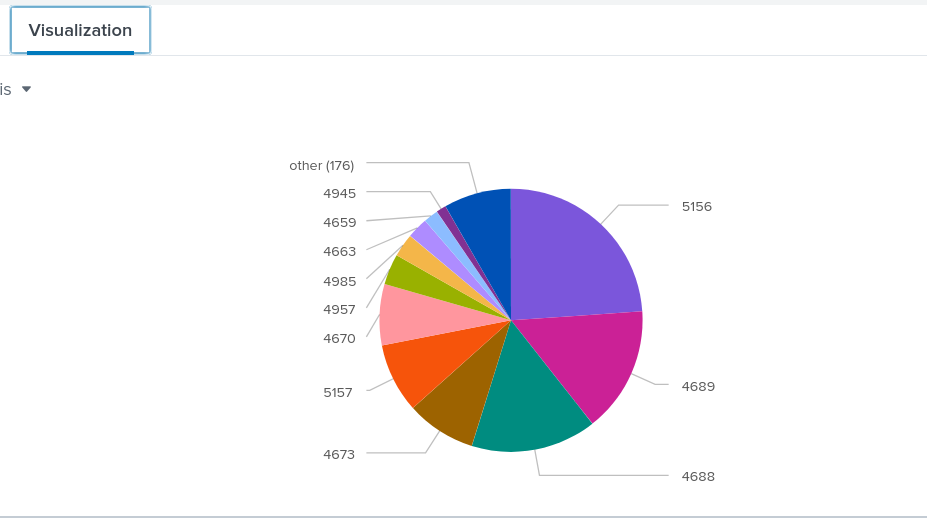
 ### 第 3 步 — 分析 Windows 事件代码
**使用的查询**:
```
index=botsv3 sourcetype="WinEventLog"
| stats count by EventCode
| sort -count
```
### 第 3 步 — 分析 Windows 事件代码
**使用的查询**:
```
index=botsv3 sourcetype="WinEventLog"
| stats count by EventCode
| sort -count
```
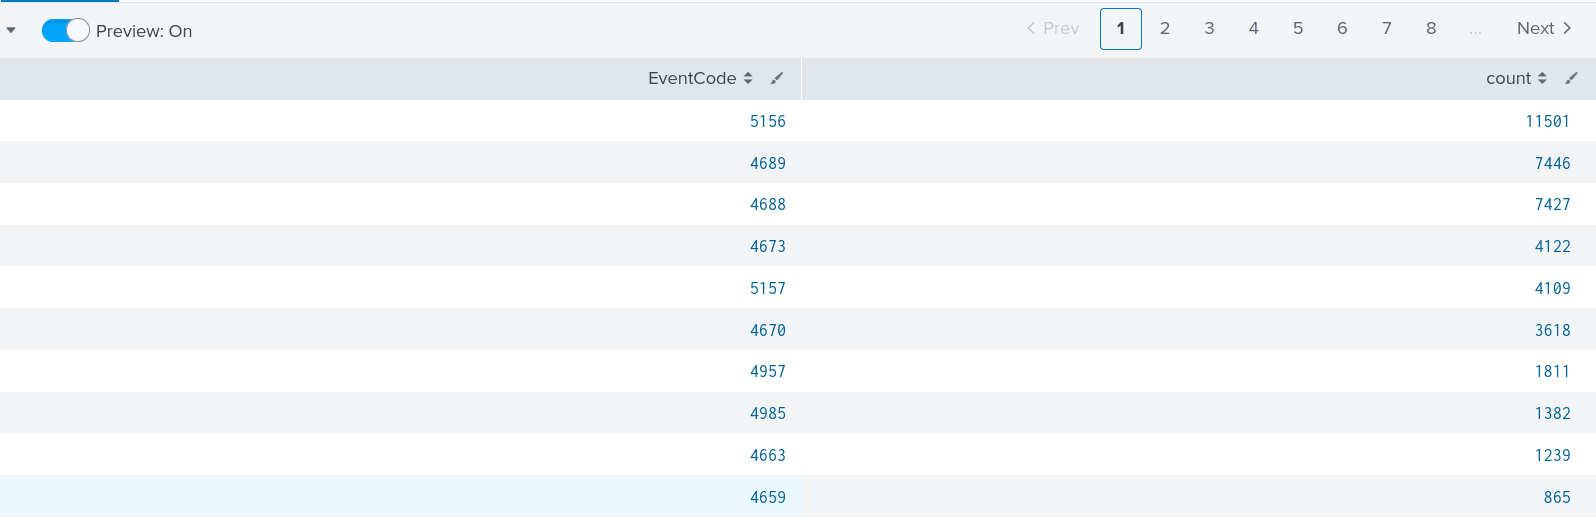 **我的发现**:
| EventCode | 计数 | 含义 |
|-----------|-------|---------|
| 4689 | 23,885 | 进程已终止 |
| 4688 | 2,419 | 进程已创建 |
| 4672 | 8,497 | 已分配特殊权限 |
| 4673 | 1,120 | 已调用特权服务 |
| 5156 | 2,256 | 已允许网络连接 |
**关键观察**:
EventCode 4672(特殊权限)出现了 8,497 次——异常高。这是我发现的第一个权限滥用的真实指标。
**我的发现**:
| EventCode | 计数 | 含义 |
|-----------|-------|---------|
| 4689 | 23,885 | 进程已终止 |
| 4688 | 2,419 | 进程已创建 |
| 4672 | 8,497 | 已分配特殊权限 |
| 4673 | 1,120 | 已调用特权服务 |
| 5156 | 2,256 | 已允许网络连接 |
**关键观察**:
EventCode 4672(特殊权限)出现了 8,497 次——异常高。这是我发现的第一个权限滥用的真实指标。
 ### 第 4 步 — 识别可疑进程
在注意到大量权限事件后,我调查了是哪些进程导致的。
**使用的查询**:
```
index=botsv3 sourcetype="WinEventLog"
(EventCode=4672 OR EventCode=4673)
| eval process=lower(coalesce(Process_Name, process_name))
| stats count by process, host
| sort -count
```
### 第 4 步 — 识别可疑进程
在注意到大量权限事件后,我调查了是哪些进程导致的。
**使用的查询**:
```
index=botsv3 sourcetype="WinEventLog"
(EventCode=4672 OR EventCode=4673)
| eval process=lower(coalesce(Process_Name, process_name))
| stats count by process, host
| sort -count
```
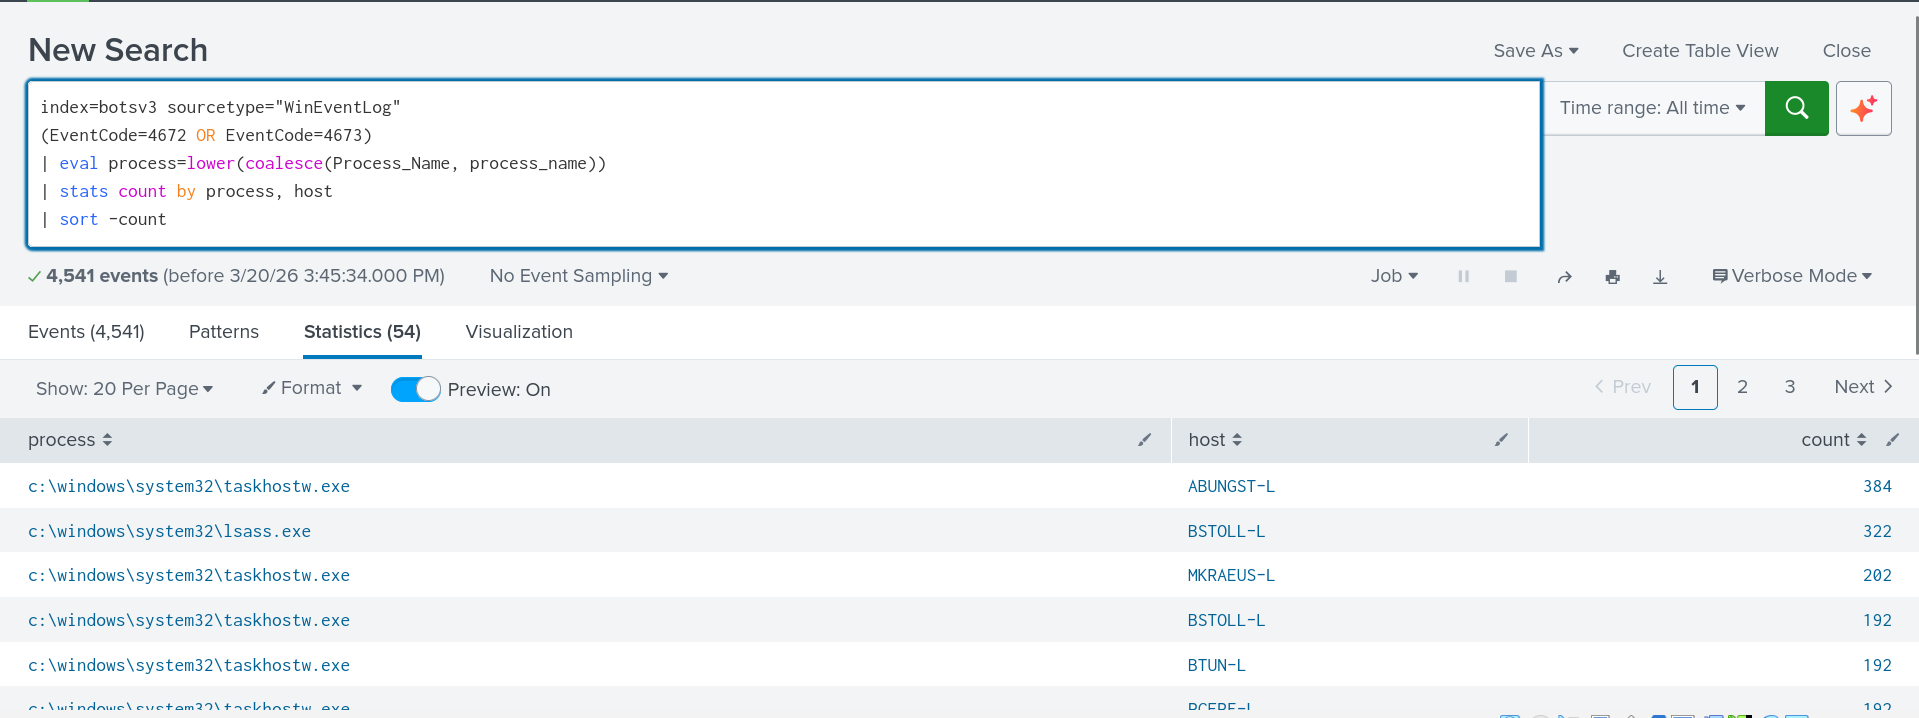 **关键发现 — 铁证**:
`RuntimeBroker.exe` 和 `explorer.exe` 是请求关键权限最多的进程。
**为什么这很可疑**:
- `RuntimeBroker.exe` 是一个 Windows 进程,用于管理来自 Microsoft Store 的应用权限。它永远不应该需要 SeTcbPrivilege。
- `explorer.exe` 是 Windows 文件管理器/桌面。同样——它没有合法理由请求操作系统级别的权限。
这是调查过程中发现的最清晰的失陷指标。
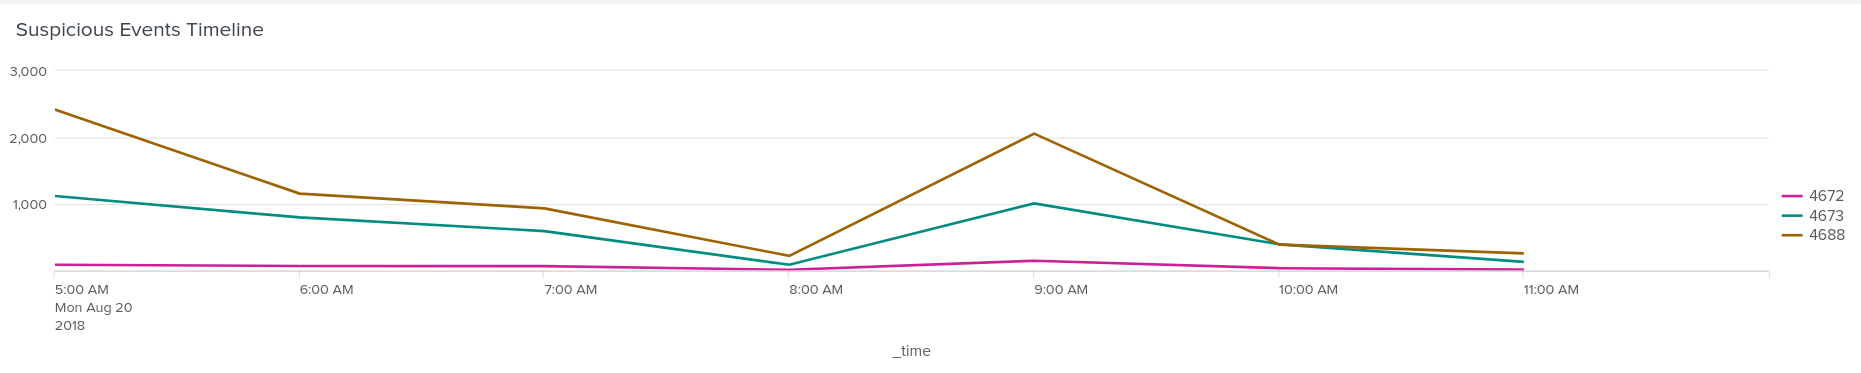
### 第 5 步 — 通过时间线分析进行确认
为了了解攻击发生的时间,我分析了事件时间线。
**使用的查询**:
```
index=botsv3 sourcetype="WinEventLog"
(EventCode=4672 OR EventCode=4673 OR EventCode=4688)
| timechart span=1h count by EventCode
```
**关键发现 — 铁证**:
`RuntimeBroker.exe` 和 `explorer.exe` 是请求关键权限最多的进程。
**为什么这很可疑**:
- `RuntimeBroker.exe` 是一个 Windows 进程,用于管理来自 Microsoft Store 的应用权限。它永远不应该需要 SeTcbPrivilege。
- `explorer.exe` 是 Windows 文件管理器/桌面。同样——它没有合法理由请求操作系统级别的权限。
这是调查过程中发现的最清晰的失陷指标。
### 第 5 步 — 通过时间线分析进行确认
为了了解攻击发生的时间,我分析了事件时间线。
**使用的查询**:
```
index=botsv3 sourcetype="WinEventLog"
(EventCode=4672 OR EventCode=4673 OR EventCode=4688)
| timechart span=1h count by EventCode
```
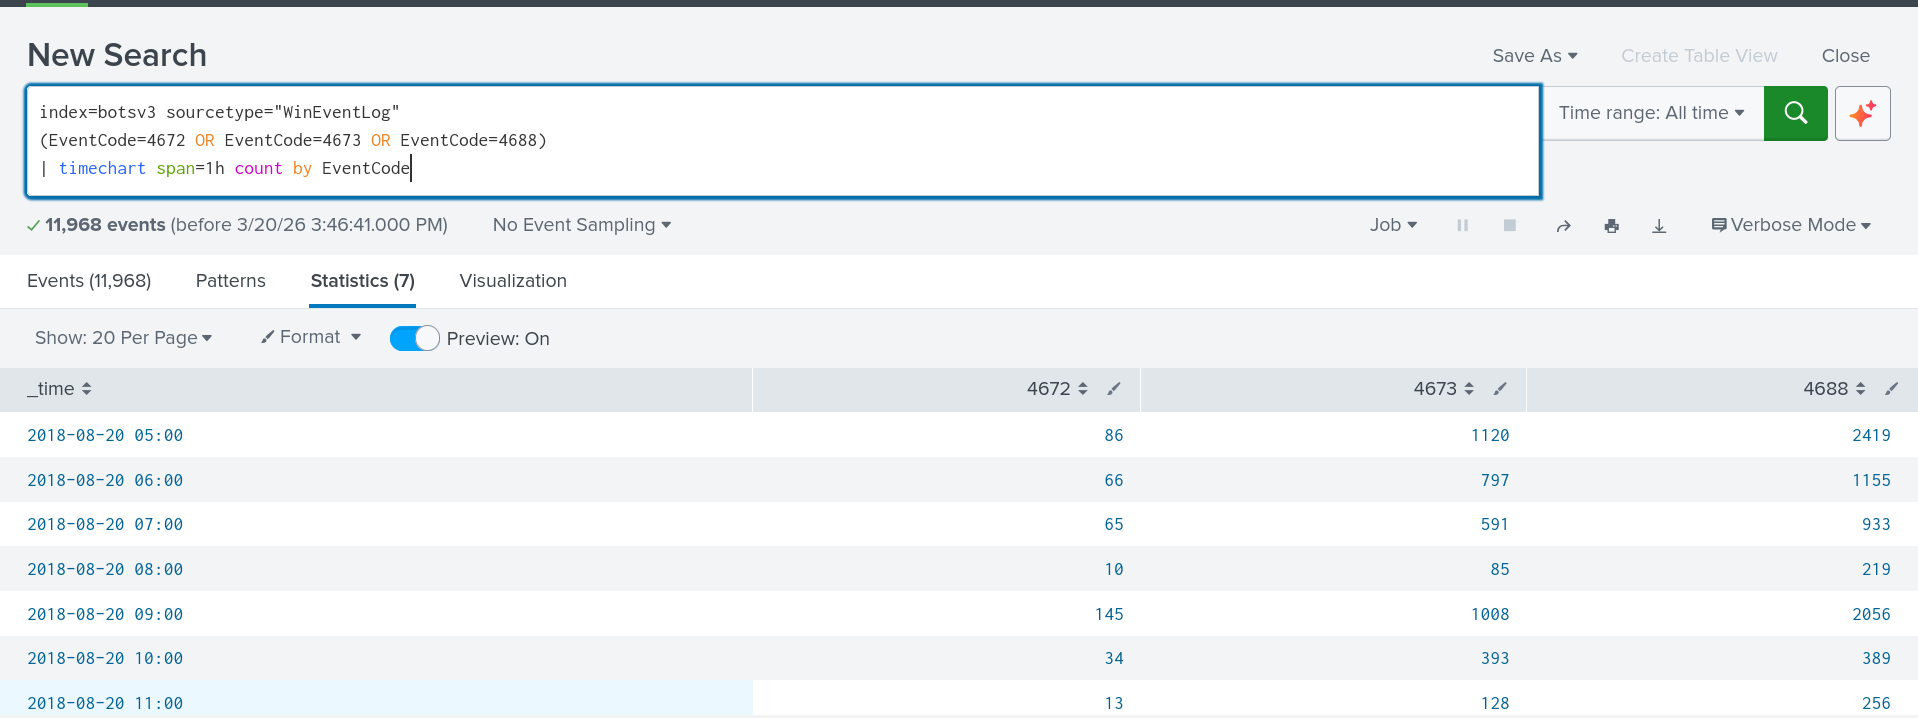 **我的发现**:
- 攻击活动集中在 2018 年 8 月 20 日的凌晨 03:00 到中午 12:00 之间
- 不同的机器上同时出现多个 EventCode 激增
- 这种同步模式表明攻击者在同时控制多台机器
**关键观察**:
不同主机之间同步的激增表明发生了横向移动——攻击者已经攻陷了多台机器,并同时在所有机器上执行命令。
### 第 6 步 — 误报分析
在调查过程中,我发现了关于误报的重要一课。
**EventCode 4625 案例**:
当我搜索失败的登录(EventCode 4625)时,我在两种不同的日志源中发现了事件:
| 日志源 | EventCode 4625 | 含义 |
|--------|----------------|---------|
| WinEventLog:Security | 真实的认证失败 | ✅ 相关 |
| WinEventLog:Application | 系统消息 | ❌ 误报 |
Application 日志中的 EventCode 4625 是由 Windows EventSystem 服务生成的,用于抑制重复的日志条目,与身份验证完全无关。
**经验教训**:
在查找身份验证失败时,务必通过 `source="WinEventLog:Security"` 进行过滤。根据日志源的不同,同一个 EventCode 可能具有完全不同的含义。
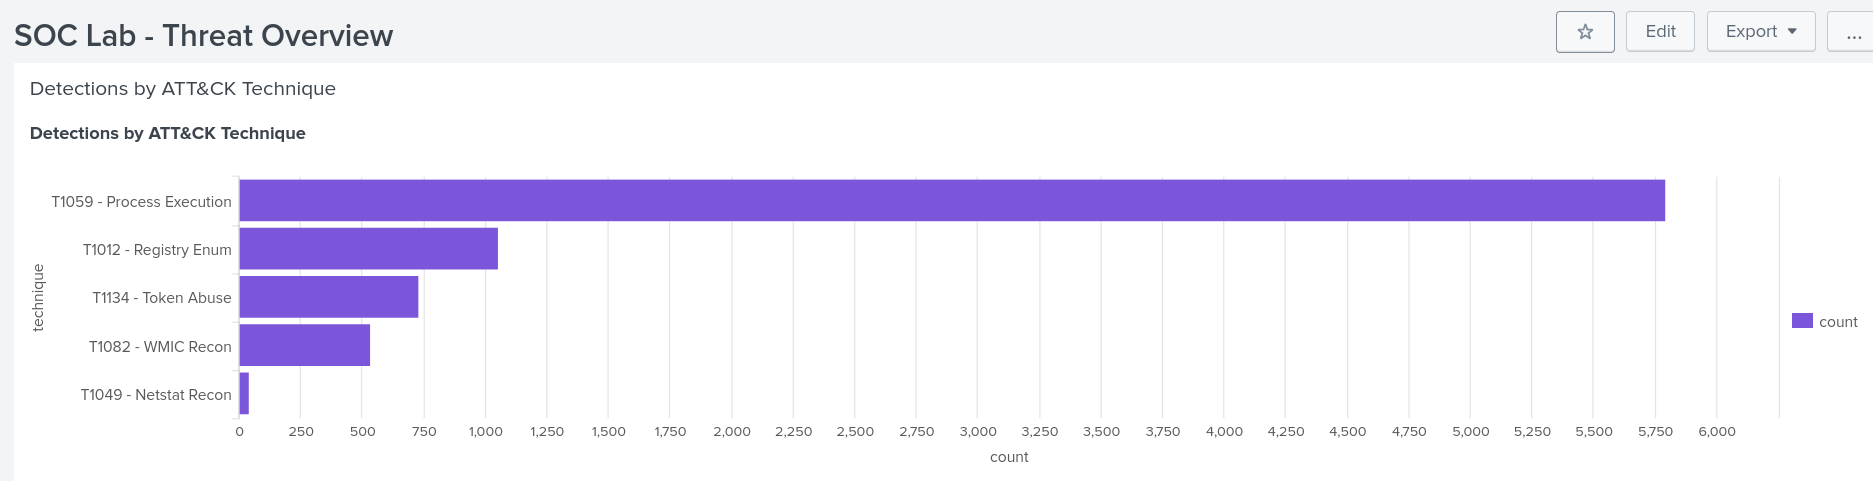
## ️ MITRE ATT&CK 覆盖范围
| 战术 | ID | 技术 | 检测数 | 严重性 | 状态 |
|--------|----|-----------|------------|----------|--------|
| Initial Access | T1190 | Exploit Public-Facing Application (Apache Struts) | 已确认 | Critical | ✅ |
| Execution | T1059.001 | PowerShell Obfuscated + AMSI Bypass | 已确认 | Critical | ✅ |
| Execution | T1059 | Command and Scripting Interpreter | 7724 | High | ✅ |
| Defense Evasion | T1027 | Obfuscated Files — Base64 + RC4 | 已确认 | Critical | ✅ |
| Defense Evasion | T1562.001 | Disable AMSI | 已确认 | Critical | ✅ |
| Defense Evasion | T1036 | Masquerading — iexeplorer.exe | 已确认 | High | ✅ |
| Privilege Escalation | T1548.002 | UAC Bypass via Fodhelper | 已确认 | Critical | ✅ |
| Privilege Escalation | T1134 | Access Token Manipulation | 729 | Critical | ✅ |
| Privilege Escalation | T1055 | Process Injection | 729 | High | ✅ |
| Persistence | T1136.001 | Create Local Account — svcvnc | 已确认 | Critical | ✅ |
| Persistence | T1098 | Account Manipulation — Added to Admins | 已确认 | Critical | ✅ |
| Command & Control | T1071.001 | C2 over HTTP — 45.77.53.176:8088 | 已确认 | Critical | ✅ |
| Discovery | T1082 | System Information Discovery — WMIC | 536 | Medium | ✅ |
| Discovery | T1049 | Network Connections Discovery — Netstat | 78 | Medium | ✅ |
| Discovery | T1012 | Query Registry — Software Enumeration | 1037 | Medium | ✅ |
| Discovery | T1087 | Account Discovery — cat /etc/passwd | 已确认 | Medium | ✅ |
| Lateral Movement | T1021.002 | SMB — Port 139 Scanning | 已确认 | High | ✅ |
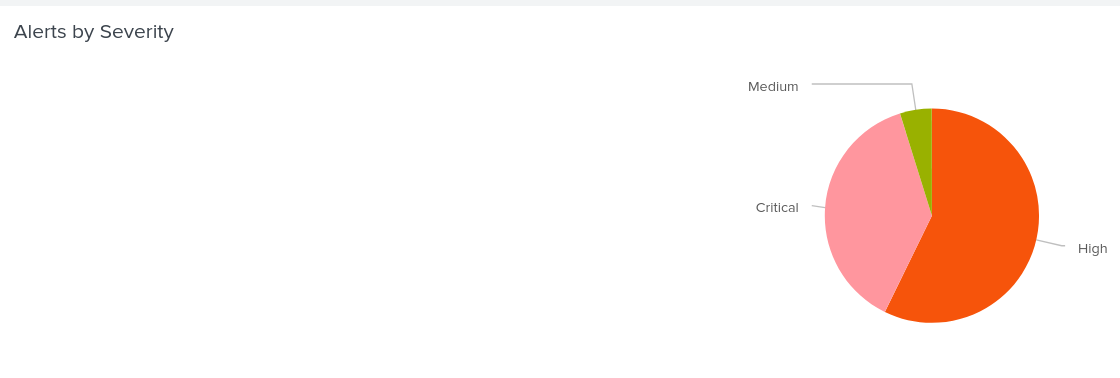
## SOC 仪表板
### 仪表板 1 — SOC 威胁概览
包含的面板:
- 按 ATT&CK 技术分类的检测(条形图)
**我的发现**:
- 攻击活动集中在 2018 年 8 月 20 日的凌晨 03:00 到中午 12:00 之间
- 不同的机器上同时出现多个 EventCode 激增
- 这种同步模式表明攻击者在同时控制多台机器
**关键观察**:
不同主机之间同步的激增表明发生了横向移动——攻击者已经攻陷了多台机器,并同时在所有机器上执行命令。
### 第 6 步 — 误报分析
在调查过程中,我发现了关于误报的重要一课。
**EventCode 4625 案例**:
当我搜索失败的登录(EventCode 4625)时,我在两种不同的日志源中发现了事件:
| 日志源 | EventCode 4625 | 含义 |
|--------|----------------|---------|
| WinEventLog:Security | 真实的认证失败 | ✅ 相关 |
| WinEventLog:Application | 系统消息 | ❌ 误报 |
Application 日志中的 EventCode 4625 是由 Windows EventSystem 服务生成的,用于抑制重复的日志条目,与身份验证完全无关。
**经验教训**:
在查找身份验证失败时,务必通过 `source="WinEventLog:Security"` 进行过滤。根据日志源的不同,同一个 EventCode 可能具有完全不同的含义。
## ️ MITRE ATT&CK 覆盖范围
| 战术 | ID | 技术 | 检测数 | 严重性 | 状态 |
|--------|----|-----------|------------|----------|--------|
| Initial Access | T1190 | Exploit Public-Facing Application (Apache Struts) | 已确认 | Critical | ✅ |
| Execution | T1059.001 | PowerShell Obfuscated + AMSI Bypass | 已确认 | Critical | ✅ |
| Execution | T1059 | Command and Scripting Interpreter | 7724 | High | ✅ |
| Defense Evasion | T1027 | Obfuscated Files — Base64 + RC4 | 已确认 | Critical | ✅ |
| Defense Evasion | T1562.001 | Disable AMSI | 已确认 | Critical | ✅ |
| Defense Evasion | T1036 | Masquerading — iexeplorer.exe | 已确认 | High | ✅ |
| Privilege Escalation | T1548.002 | UAC Bypass via Fodhelper | 已确认 | Critical | ✅ |
| Privilege Escalation | T1134 | Access Token Manipulation | 729 | Critical | ✅ |
| Privilege Escalation | T1055 | Process Injection | 729 | High | ✅ |
| Persistence | T1136.001 | Create Local Account — svcvnc | 已确认 | Critical | ✅ |
| Persistence | T1098 | Account Manipulation — Added to Admins | 已确认 | Critical | ✅ |
| Command & Control | T1071.001 | C2 over HTTP — 45.77.53.176:8088 | 已确认 | Critical | ✅ |
| Discovery | T1082 | System Information Discovery — WMIC | 536 | Medium | ✅ |
| Discovery | T1049 | Network Connections Discovery — Netstat | 78 | Medium | ✅ |
| Discovery | T1012 | Query Registry — Software Enumeration | 1037 | Medium | ✅ |
| Discovery | T1087 | Account Discovery — cat /etc/passwd | 已确认 | Medium | ✅ |
| Lateral Movement | T1021.002 | SMB — Port 139 Scanning | 已确认 | High | ✅ |
## SOC 仪表板
### 仪表板 1 — SOC 威胁概览
包含的面板:
- 按 ATT&CK 技术分类的检测(条形图)
 - 可疑事件时间线(折线图)
 - 受影响最大的主机(条形图)
 - 最可疑的用户(表格)
 - 按严重性划分的告警(饼图)
 ### 仪表板 2 — MITRE ATT&CK 覆盖范围
包含的面板:
- ATT&CK 技术覆盖范围表
### 仪表板 2 — MITRE ATT&CK 覆盖范围
包含的面板:
- ATT&CK 技术覆盖范围表
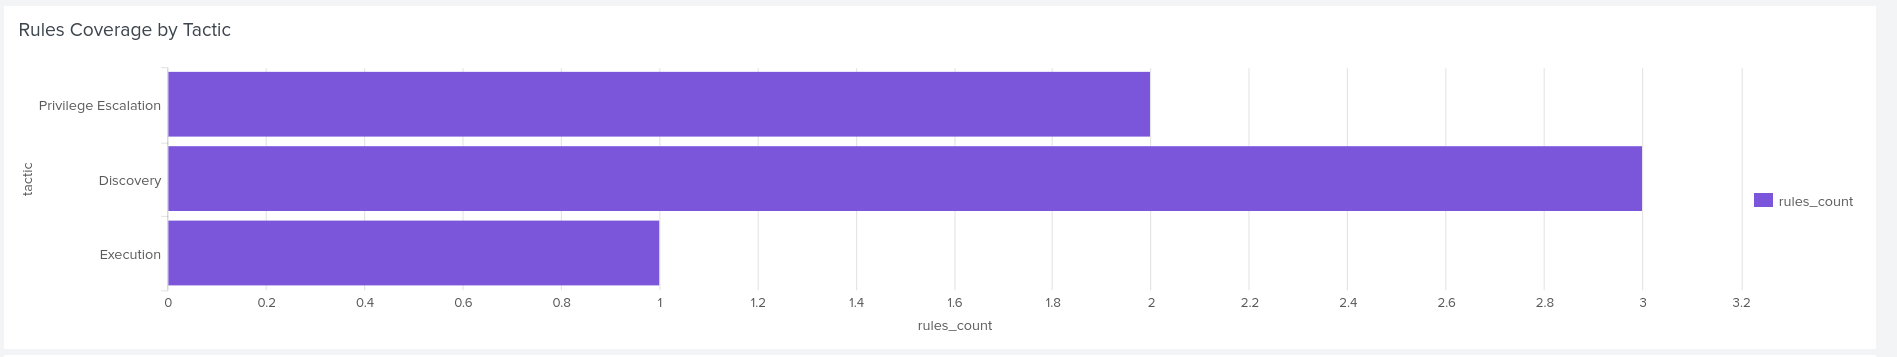
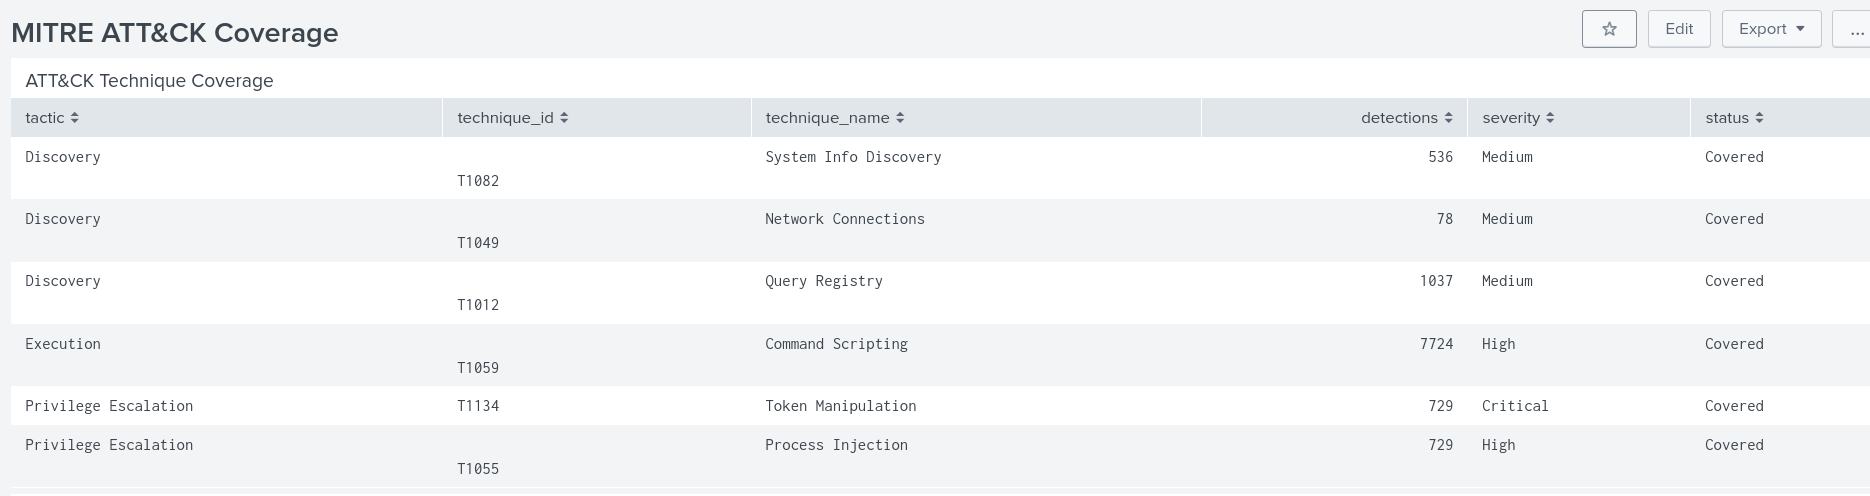 - 按战术划分的规则覆盖范围(条形图)
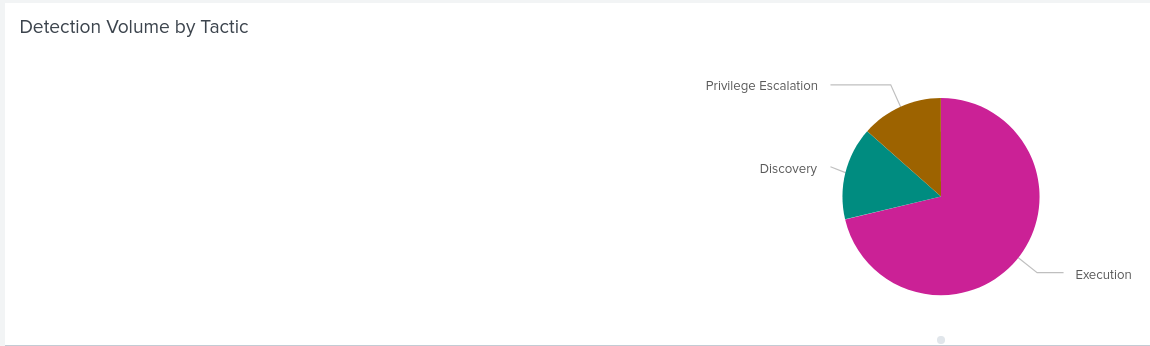
 - 按战术划分的检测量(饼图)
 ## 检测规则
请查看 [detections/](detections/) 文件夹获取所有 YAML 文档化规则。
| 文件 | 技术 | 描述 |
|------|-----------|-------------|
## 设置与配置
- [安装指南](docs/INSTALL.md)
- [告警配置](docs/ALERTS.md)
- [仪表板配置](docs/DASHBOARDS.md)
## 关键经验教训
**1. 务必按日志源进行过滤**
EventCode 4625 同时存在于 Application 和 Security 日志中。
只有 `source="WinEventLog:Security"` 包含真实的认证失败。
按源过滤可以消除误报。
**2. 上下文比 EventCode 更重要**
单次登录失败是正常的。5 分钟内来自同一 IP 的 100 次登录失败就是攻击。始终关注数量和上下文。
**3. 数据集时间范围**
BOTS v3 数据来自 8 年 8 月。查询此数据集时,请务必将 Splunk 时间范围设置为“所有时间 (All time)”。
**4. 正常进程也可能被滥用**
`RuntimeBroker.exe` 和 `explorer.exe` 是合法的 Windows 进程。只有当你查看它们请求了“什么”权限,而不仅仅是查看它们“是否”存在时,它们对关键权限的滥用才会显现出来。
## 使用的工具
| 工具 | 版本 | 用途 |
|------|---------|---------|
| Splunk Enterprise | 10.2 | SIEM 平台 |
| BOTS v3 Dataset | 1.0 | 攻击模拟数据 |
| MITRE ATT&CK | v14 | 威胁框架 |
| Kali Linux | 2025.4 | 实验室环境 |
| Git | 最新版 | 版本控制 |
## 📌 项目状态与路线图
### 当前状态
```
✅ Splunk lab deployed and configured
✅ BOTS v3 dataset loaded and analyzed
✅ 6 detection rules created and documented
✅ 2 SOC dashboards built
✅ Full GitHub documentation
✅ Threat hunting investigation completed
✅ Complete kill chain reconstructed (17 MITRE techniques)
✅ 20+ IOCs documented (network, host, registry)
✅ Backdoor account, UAC bypass, reverse shell confirmed
🔄 Complete kill chain finalization
⬜ MITRE ATT&CK Navigator export
⬜ Additional detection rules
⬜ Sigma rules conversion
⬜ Incident response playbooks
```
### 本项目存在的原因
构建此实验室是为了:
- 从真实攻击数据中学习检测工程
- 了解攻击者如何在杀伤链中运作
- 练习基于真实观察编写 SPL 查询
- 建立一个能展示 SOC 分析师技能的作品集
每次我学到新东西——一项新技术、一个新工具、一个新概念——我都会回到这个实验室并将其添加进去。这使得它成为了一个不断增长的参考,而不是一次性的练习。
### 接下来的计划
- 基于其他 BOTS v3 发现的更多检测规则
- 每个检测的 Sigma 规则格式
- 每个告警的事件响应 playbook
- 导出 MITRE ATT&CK Navigator 覆盖范围映射图
## 👤 作者
**Ahlam Boumehdi**
网络安全工程专业学生
LinkedIn:www.linkedin.com/in/ahlam-boumehdi
## 检测规则
请查看 [detections/](detections/) 文件夹获取所有 YAML 文档化规则。
| 文件 | 技术 | 描述 |
|------|-----------|-------------|
## 设置与配置
- [安装指南](docs/INSTALL.md)
- [告警配置](docs/ALERTS.md)
- [仪表板配置](docs/DASHBOARDS.md)
## 关键经验教训
**1. 务必按日志源进行过滤**
EventCode 4625 同时存在于 Application 和 Security 日志中。
只有 `source="WinEventLog:Security"` 包含真实的认证失败。
按源过滤可以消除误报。
**2. 上下文比 EventCode 更重要**
单次登录失败是正常的。5 分钟内来自同一 IP 的 100 次登录失败就是攻击。始终关注数量和上下文。
**3. 数据集时间范围**
BOTS v3 数据来自 8 年 8 月。查询此数据集时,请务必将 Splunk 时间范围设置为“所有时间 (All time)”。
**4. 正常进程也可能被滥用**
`RuntimeBroker.exe` 和 `explorer.exe` 是合法的 Windows 进程。只有当你查看它们请求了“什么”权限,而不仅仅是查看它们“是否”存在时,它们对关键权限的滥用才会显现出来。
## 使用的工具
| 工具 | 版本 | 用途 |
|------|---------|---------|
| Splunk Enterprise | 10.2 | SIEM 平台 |
| BOTS v3 Dataset | 1.0 | 攻击模拟数据 |
| MITRE ATT&CK | v14 | 威胁框架 |
| Kali Linux | 2025.4 | 实验室环境 |
| Git | 最新版 | 版本控制 |
## 📌 项目状态与路线图
### 当前状态
```
✅ Splunk lab deployed and configured
✅ BOTS v3 dataset loaded and analyzed
✅ 6 detection rules created and documented
✅ 2 SOC dashboards built
✅ Full GitHub documentation
✅ Threat hunting investigation completed
✅ Complete kill chain reconstructed (17 MITRE techniques)
✅ 20+ IOCs documented (network, host, registry)
✅ Backdoor account, UAC bypass, reverse shell confirmed
🔄 Complete kill chain finalization
⬜ MITRE ATT&CK Navigator export
⬜ Additional detection rules
⬜ Sigma rules conversion
⬜ Incident response playbooks
```
### 本项目存在的原因
构建此实验室是为了:
- 从真实攻击数据中学习检测工程
- 了解攻击者如何在杀伤链中运作
- 练习基于真实观察编写 SPL 查询
- 建立一个能展示 SOC 分析师技能的作品集
每次我学到新东西——一项新技术、一个新工具、一个新概念——我都会回到这个实验室并将其添加进去。这使得它成为了一个不断增长的参考,而不是一次性的练习。
### 接下来的计划
- 基于其他 BOTS v3 发现的更多检测规则
- 每个检测的 Sigma 规则格式
- 每个告警的事件响应 playbook
- 导出 MITRE ATT&CK Navigator 覆盖范围映射图
## 👤 作者
**Ahlam Boumehdi**
网络安全工程专业学生
LinkedIn:www.linkedin.com/in/ahlam-boumehdi
## 调查与识别
在编写任何检测规则之前,我遵循了结构化的调查流程:
```
Step 1 → Understand the environment
What machines ? What data sources ? What timeline ?
Step 2 → Identify suspicious patterns
Abnormal volumes, unusual processes, privilege abuse
Step 3 → Map to MITRE ATT&CK
Which tactic and technique does this behavior match ?
Step 4 → Write the SPL detection rule
Based on real observations, not assumptions
Step 5 → Validate results
Check for false positives, tune thresholds
Step 6 → Save as scheduled alert
Automate detection for future occurrences
Step 7 → Document everything
YAML format with findings, rationale, and tuning notes
```
### 第 1 步 — 环境发现
在寻找攻击之前,我首先对环境进行了梳理,以了解我正在处理的内容。
**使用的查询**:
```
index=botsv3 | stats count by sourcetype | sort -count
```
**我的发现**:
- 涵盖 15+ 数据源的 2,000,000+ 条事件
- Windows 端点、Linux 服务器和 AWS 云的混合
- 包含 2018 年 8 月完整攻击场景的数据
**关键观察**:
该数据集包含来自混合基础设施(本地 Windows 机器和 AWS 云服务)的日志。
这意味着攻击者必须同时入侵这两个环境。
### 第 2 步 — 识别可疑主机
**使用的查询**:
```
index=botsv3 | stats count by host | sort -count
```
### 第 3 步 — 分析 Windows 事件代码
**使用的查询**:
```
index=botsv3 sourcetype="WinEventLog"
| stats count by EventCode
| sort -count
```
**我的发现**:
| EventCode | 计数 | 含义 |
|-----------|-------|---------|
| 4689 | 23,885 | 进程已终止 |
| 4688 | 2,419 | 进程已创建 |
| 4672 | 8,497 | 已分配特殊权限 |
| 4673 | 1,120 | 已调用特权服务 |
| 5156 | 2,256 | 已允许网络连接 |
**关键观察**:
EventCode 4672(特殊权限)出现了 8,497 次——异常高。这是我发现的第一个权限滥用的真实指标。
### 第 4 步 — 识别可疑进程
在注意到大量权限事件后,我调查了是哪些进程导致的。
**使用的查询**:
```
index=botsv3 sourcetype="WinEventLog"
(EventCode=4672 OR EventCode=4673)
| eval process=lower(coalesce(Process_Name, process_name))
| stats count by process, host
| sort -count
```
**关键发现 — 铁证**:
`RuntimeBroker.exe` 和 `explorer.exe` 是请求关键权限最多的进程。
**为什么这很可疑**:
- `RuntimeBroker.exe` 是一个 Windows 进程,用于管理来自 Microsoft Store 的应用权限。它永远不应该需要 SeTcbPrivilege。
- `explorer.exe` 是 Windows 文件管理器/桌面。同样——它没有合法理由请求操作系统级别的权限。
这是调查过程中发现的最清晰的失陷指标。
### 第 5 步 — 通过时间线分析进行确认
为了了解攻击发生的时间,我分析了事件时间线。
**使用的查询**:
```
index=botsv3 sourcetype="WinEventLog"
(EventCode=4672 OR EventCode=4673 OR EventCode=4688)
| timechart span=1h count by EventCode
```
**我的发现**:
- 攻击活动集中在 2018 年 8 月 20 日的凌晨 03:00 到中午 12:00 之间
- 不同的机器上同时出现多个 EventCode 激增
- 这种同步模式表明攻击者在同时控制多台机器
**关键观察**:
不同主机之间同步的激增表明发生了横向移动——攻击者已经攻陷了多台机器,并同时在所有机器上执行命令。
### 第 6 步 — 误报分析
在调查过程中,我发现了关于误报的重要一课。
**EventCode 4625 案例**:
当我搜索失败的登录(EventCode 4625)时,我在两种不同的日志源中发现了事件:
| 日志源 | EventCode 4625 | 含义 |
|--------|----------------|---------|
| WinEventLog:Security | 真实的认证失败 | ✅ 相关 |
| WinEventLog:Application | 系统消息 | ❌ 误报 |
Application 日志中的 EventCode 4625 是由 Windows EventSystem 服务生成的,用于抑制重复的日志条目,与身份验证完全无关。
**经验教训**:
在查找身份验证失败时,务必通过 `source="WinEventLog:Security"` 进行过滤。根据日志源的不同,同一个 EventCode 可能具有完全不同的含义。
## ️ MITRE ATT&CK 覆盖范围
| 战术 | ID | 技术 | 检测数 | 严重性 | 状态 |
|--------|----|-----------|------------|----------|--------|
| Initial Access | T1190 | Exploit Public-Facing Application (Apache Struts) | 已确认 | Critical | ✅ |
| Execution | T1059.001 | PowerShell Obfuscated + AMSI Bypass | 已确认 | Critical | ✅ |
| Execution | T1059 | Command and Scripting Interpreter | 7724 | High | ✅ |
| Defense Evasion | T1027 | Obfuscated Files — Base64 + RC4 | 已确认 | Critical | ✅ |
| Defense Evasion | T1562.001 | Disable AMSI | 已确认 | Critical | ✅ |
| Defense Evasion | T1036 | Masquerading — iexeplorer.exe | 已确认 | High | ✅ |
| Privilege Escalation | T1548.002 | UAC Bypass via Fodhelper | 已确认 | Critical | ✅ |
| Privilege Escalation | T1134 | Access Token Manipulation | 729 | Critical | ✅ |
| Privilege Escalation | T1055 | Process Injection | 729 | High | ✅ |
| Persistence | T1136.001 | Create Local Account — svcvnc | 已确认 | Critical | ✅ |
| Persistence | T1098 | Account Manipulation — Added to Admins | 已确认 | Critical | ✅ |
| Command & Control | T1071.001 | C2 over HTTP — 45.77.53.176:8088 | 已确认 | Critical | ✅ |
| Discovery | T1082 | System Information Discovery — WMIC | 536 | Medium | ✅ |
| Discovery | T1049 | Network Connections Discovery — Netstat | 78 | Medium | ✅ |
| Discovery | T1012 | Query Registry — Software Enumeration | 1037 | Medium | ✅ |
| Discovery | T1087 | Account Discovery — cat /etc/passwd | 已确认 | Medium | ✅ |
| Lateral Movement | T1021.002 | SMB — Port 139 Scanning | 已确认 | High | ✅ |
## SOC 仪表板
### 仪表板 1 — SOC 威胁概览
包含的面板:
- 按 ATT&CK 技术分类的检测(条形图)
- 可疑事件时间线(折线图)
- 受影响最大的主机(条形图)
- 最可疑的用户(表格)
### 仪表板 2 — MITRE ATT&CK 覆盖范围
包含的面板:
- ATT&CK 技术覆盖范围表
- 按战术划分的规则覆盖范围(条形图)
- 按战术划分的检测量(饼图)
## 检测规则
请查看 [detections/](detections/) 文件夹获取所有 YAML 文档化规则。
| 文件 | 技术 | 描述 |
|------|-----------|-------------|
## 设置与配置
- [安装指南](docs/INSTALL.md)
- [告警配置](docs/ALERTS.md)
- [仪表板配置](docs/DASHBOARDS.md)
## 关键经验教训
**1. 务必按日志源进行过滤**
EventCode 4625 同时存在于 Application 和 Security 日志中。
只有 `source="WinEventLog:Security"` 包含真实的认证失败。
按源过滤可以消除误报。
**2. 上下文比 EventCode 更重要**
单次登录失败是正常的。5 分钟内来自同一 IP 的 100 次登录失败就是攻击。始终关注数量和上下文。
**3. 数据集时间范围**
BOTS v3 数据来自 8 年 8 月。查询此数据集时,请务必将 Splunk 时间范围设置为“所有时间 (All time)”。
**4. 正常进程也可能被滥用**
`RuntimeBroker.exe` 和 `explorer.exe` 是合法的 Windows 进程。只有当你查看它们请求了“什么”权限,而不仅仅是查看它们“是否”存在时,它们对关键权限的滥用才会显现出来。
## 使用的工具
| 工具 | 版本 | 用途 |
|------|---------|---------|
| Splunk Enterprise | 10.2 | SIEM 平台 |
| BOTS v3 Dataset | 1.0 | 攻击模拟数据 |
| MITRE ATT&CK | v14 | 威胁框架 |
| Kali Linux | 2025.4 | 实验室环境 |
| Git | 最新版 | 版本控制 |
## 📌 项目状态与路线图
### 当前状态
```
✅ Splunk lab deployed and configured
✅ BOTS v3 dataset loaded and analyzed
✅ 6 detection rules created and documented
✅ 2 SOC dashboards built
✅ Full GitHub documentation
✅ Threat hunting investigation completed
✅ Complete kill chain reconstructed (17 MITRE techniques)
✅ 20+ IOCs documented (network, host, registry)
✅ Backdoor account, UAC bypass, reverse shell confirmed
🔄 Complete kill chain finalization
⬜ MITRE ATT&CK Navigator export
⬜ Additional detection rules
⬜ Sigma rules conversion
⬜ Incident response playbooks
```
### 本项目存在的原因
构建此实验室是为了:
- 从真实攻击数据中学习检测工程
- 了解攻击者如何在杀伤链中运作
- 练习基于真实观察编写 SPL 查询
- 建立一个能展示 SOC 分析师技能的作品集
每次我学到新东西——一项新技术、一个新工具、一个新概念——我都会回到这个实验室并将其添加进去。这使得它成为了一个不断增长的参考,而不是一次性的练习。
### 接下来的计划
- 基于其他 BOTS v3 发现的更多检测规则
- 每个检测的 Sigma 规则格式
- 每个告警的事件响应 playbook
- 导出 MITRE ATT&CK Navigator 覆盖范围映射图
## 👤 作者
**Ahlam Boumehdi**
网络安全工程专业学生
LinkedIn:www.linkedin.com/in/ahlam-boumehdi标签:HTTP/HTTPS抓包, 代码示例, 安全运营, 态势感知, 扫描框架, 数据分析